Juvenile Crime Prevention Program Evaluation Summary 2015… · 2015, staff entered information...
17
Submitted to: Lindsey Capps, Interim Director Celeste Janssen, Council Chair Anya Sekino, Juvenile Crime Prevention Manager Youth Development Council Division of the Oregon Department of Education Salem, OR Submitted by: NPC Research 5100 SW Macadam Ave., Ste. 575 Portland, OR 97239 (503) 243-2436 www.npcresearch.com December 2017 Juvenile Crime Prevention Program Evaluation Summary 2015–2017
Transcript of Juvenile Crime Prevention Program Evaluation Summary 2015… · 2015, staff entered information...
Submitted to:
Lindsey Capps, Interim Director Celeste Janssen, Council Chair Anya Sekino, Juvenile Crime Prevention Manager Youth Development Council Division of the Oregon Department of Education Salem, OR Submitted by:
NPC Research 5100 SW Macadam Ave., Ste. 575 Portland, OR 97239 (503) 243-2436 www.npcresearch.com
December 2017
Juvenile Crime Prevention Program Evaluation Summary
2015–2017

Juvenile Crime Prevention Program
Evaluation Summary 2015–2017
Submitted by
NPC Research
Lisa M. Lucas, B.A. Anna M. Malsch, Ph.D.
Juliette R. Mackin, Ph.D. www.npcresearch.com
December 2017
NPC Research, JCP Evaluation Findings 2015–17
Page 1 of 15
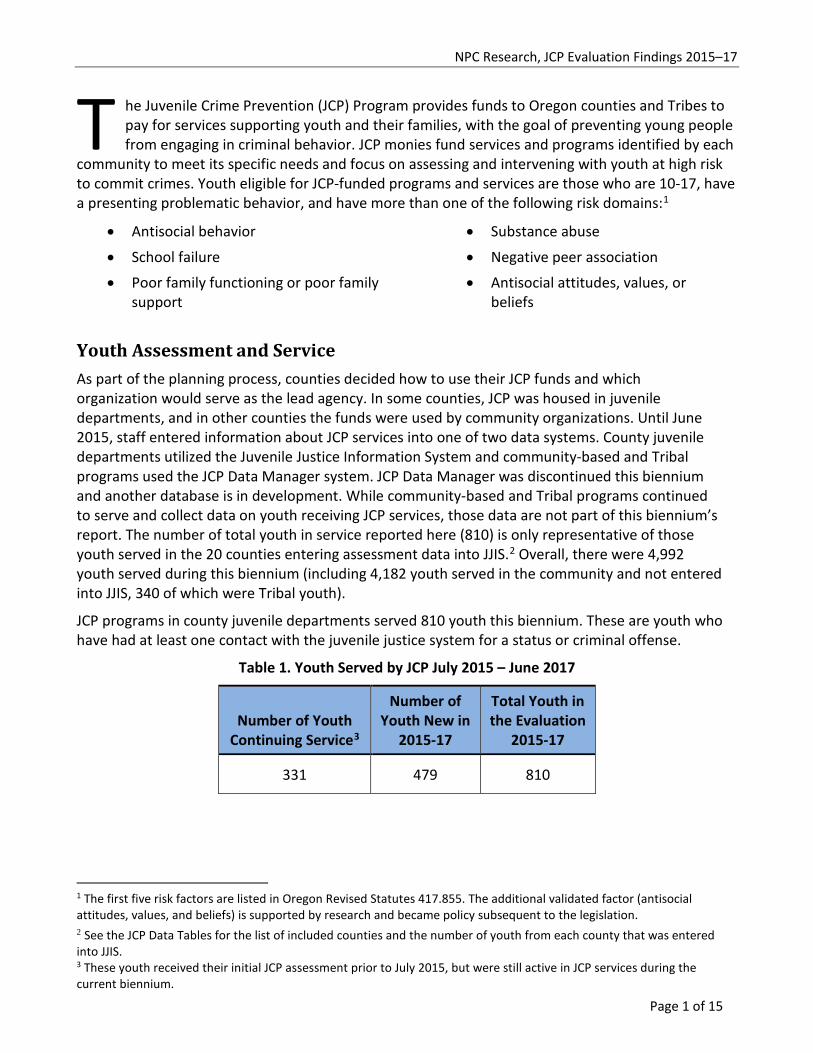
he Juvenile Crime Prevention (JCP) Program provides funds to Oregon counties and Tribes to pay for services supporting youth and their families, with the goal of preventing young people from engaging in criminal behavior. JCP monies fund services and programs identified by each
community to meet its specific needs and focus on assessing and intervening with youth at high risk to commit crimes. Youth eligible for JCP-funded programs and services are those who are 10-17, have a presenting problematic behavior, and have more than one of the following risk domains:1
• Antisocial behavior
• School failure
• Poor family functioning or poor family support
• Substance abuse
• Negative peer association
• Antisocial attitudes, values, or beliefs
Youth Assessment and Service As part of the planning process, counties decided how to use their JCP funds and which organization would serve as the lead agency. In some counties, JCP was housed in juvenile departments, and in other counties the funds were used by community organizations. Until June 2015, staff entered information about JCP services into one of two data systems. County juvenile departments utilized the Juvenile Justice Information System and community-based and Tribal programs used the JCP Data Manager system. JCP Data Manager was discontinued this biennium and another database is in development. While community-based and Tribal programs continued to serve and collect data on youth receiving JCP services, those data are not part of this biennium’s report. The number of total youth in service reported here (810) is only representative of those youth served in the 20 counties entering assessment data into JJIS.2 Overall, there were 4,992 youth served during this biennium (including 4,182 youth served in the community and not entered into JJIS, 340 of which were Tribal youth).
JCP programs in county juvenile departments served 810 youth this biennium. These are youth who have had at least one contact with the juvenile justice system for a status or criminal offense.
Table 1. Youth Served by JCP July 2015 – June 2017
Number of Youth Continuing Service3
Number of Youth New in
2015-17
Total Youth in the Evaluation
2015-17
331 479 810
1 The first five risk factors are listed in Oregon Revised Statutes 417.855. The additional validated factor (antisocial attitudes, values, and beliefs) is supported by research and became policy subsequent to the legislation. 2 See the JCP Data Tables for the list of included counties and the number of youth from each county that was entered into JJIS. 3 These youth received their initial JCP assessment prior to July 2015, but were still active in JCP services during the current biennium.
T
NPC Research, JCP Evaluation Findings 2015–17
Page 2 of 15
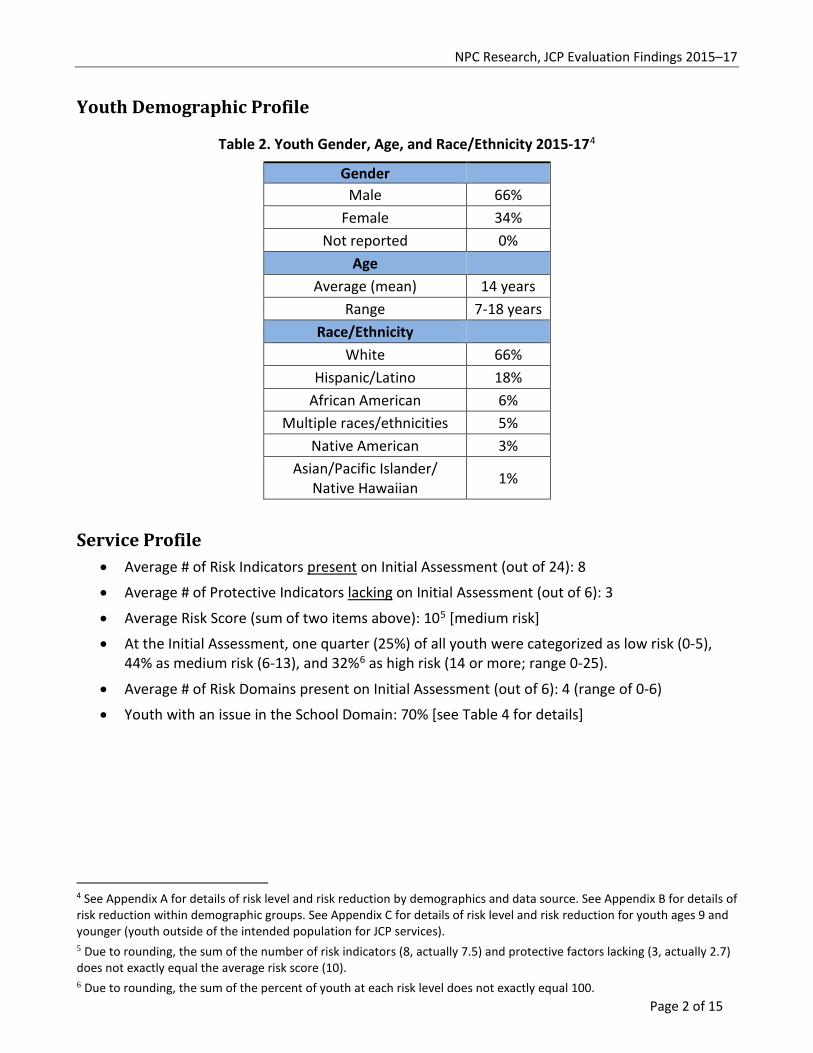
Youth Demographic Profile
Table 2. Youth Gender, Age, and Race/Ethnicity 2015-174
Gender Male 66%
Female 34% Not reported 0%
Age Average (mean) 14 years
Range 7-18 years Race/Ethnicity
White 66% Hispanic/Latino 18%
African American 6% Multiple races/ethnicities 5%
Native American 3% Asian/Pacific Islander/
Native Hawaiian 1%
Service Profile • Average # of Risk Indicators present on Initial Assessment (out of 24): 8
• Average # of Protective Indicators lacking on Initial Assessment (out of 6): 3
• Average Risk Score (sum of two items above): 105 [medium risk]
• At the Initial Assessment, one quarter (25%) of all youth were categorized as low risk (0-5), 44% as medium risk (6-13), and 32%6 as high risk (14 or more; range 0-25).
• Average # of Risk Domains present on Initial Assessment (out of 6): 4 (range of 0-6)
• Youth with an issue in the School Domain: 70% [see Table 4 for details]
4 See Appendix A for details of risk level and risk reduction by demographics and data source. See Appendix B for details of risk reduction within demographic groups. See Appendix C for details of risk level and risk reduction for youth ages 9 and younger (youth outside of the intended population for JCP services). 5 Due to rounding, the sum of the number of risk indicators (8, actually 7.5) and protective factors lacking (3, actually 2.7) does not exactly equal the average risk score (10). 6 Due to rounding, the sum of the percent of youth at each risk level does not exactly equal 100.
NPC Research, JCP Evaluation Findings 2015–17
Page 3 of 15
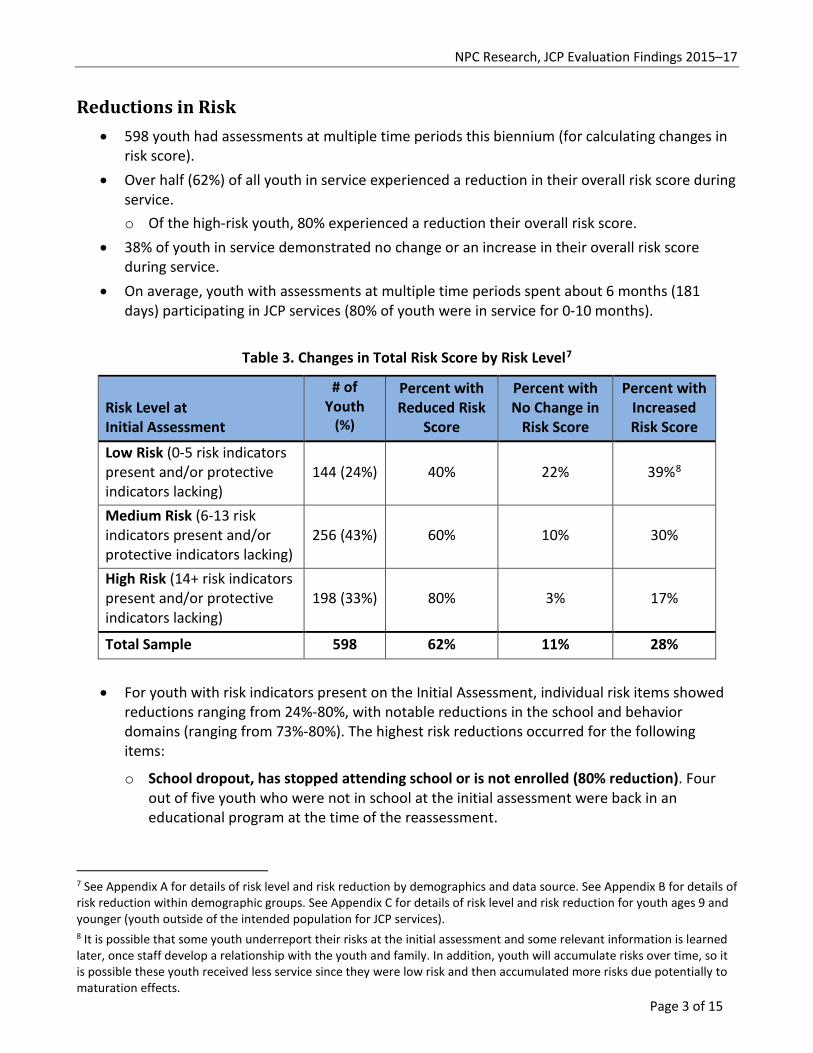
Reductions in Risk • 598 youth had assessments at multiple time periods this biennium (for calculating changes in
risk score). • Over half (62%) of all youth in service experienced a reduction in their overall risk score during
service. o Of the high-risk youth, 80% experienced a reduction their overall risk score.
• 38% of youth in service demonstrated no change or an increase in their overall risk score during service.
• On average, youth with assessments at multiple time periods spent about 6 months (181 days) participating in JCP services (80% of youth were in service for 0-10 months).
Table 3. Changes in Total Risk Score by Risk Level7
Risk Level at Initial Assessment
# of Youth
(%)
Percent with Reduced Risk
Score
Percent with No Change in
Risk Score
Percent with Increased Risk Score
Low Risk (0-5 risk indicators present and/or protective indicators lacking)
144 (24%) 40% 22% 39%8
Medium Risk (6-13 risk indicators present and/or protective indicators lacking)
256 (43%) 60% 10% 30%
High Risk (14+ risk indicators present and/or protective indicators lacking)
198 (33%) 80% 3% 17%
Total Sample 598 62% 11% 28%
• For youth with risk indicators present on the Initial Assessment, individual risk items showed reductions ranging from 24%-80%, with notable reductions in the school and behavior domains (ranging from 73%-80%). The highest risk reductions occurred for the following items:
o School dropout, has stopped attending school or is not enrolled (80% reduction). Four out of five youth who were not in school at the initial assessment were back in an educational program at the time of the reassessment.
7 See Appendix A for details of risk level and risk reduction by demographics and data source. See Appendix B for details of risk reduction within demographic groups. See Appendix C for details of risk level and risk reduction for youth ages 9 and younger (youth outside of the intended population for JCP services). 8 It is possible that some youth underreport their risks at the initial assessment and some relevant information is learned later, once staff develop a relationship with the youth and family. In addition, youth will accumulate risks over time, so it is possible these youth received less service since they were low risk and then accumulated more risks due potentially to maturation effects.

NPC Research, JCP Evaluation Findings 2015–17
Page 4 of 15
o Aggressive, disruptive behavior at school during the past month (79% reduction). Four out of five youth who displayed recent problematic behavior at school at the initial assessment were not displaying this behavior at the time of the reassessment.
o In the past month, youth’s behavior has hurt others or put them in danger (73% reduction). Three out of four youth who were exhibiting recent dangerous behavior at the initial assessment were not exhibiting this behavior at the time of the reassessment.
o In the past month, youth has run away for at least 1 day/night9 (73% reduction). Three out of four youth who had recently run away at the initial assessment had not recently run away at the time of the reassessment.
• Those youth lacking protective indicators on the Initial Assessment showed gains in protection ranging from 24% to 68%. The highest protection increases occurred for:
o There is an adult in the youth’s life (other than a parent) she/he can talk to (68% increase). More than two thirds of youth who did not have an adult in their lives at the initial assessment reported having this support at the time of the reassessment.
o Significant school attachment (54% increase). Over half of the youth who were not connected to school at the initial assessment were engaged at the time of the reassessment.
Improvements in the School Domain • Youth with at least one issue in the school domain on the Initial Assessment: 70%
Table 4. School Issues and Changes over Time10
Risk Indicator
Number of youth with indicator
reported on Initial Assessment
Number of youth with indicator reported on
Reassessment Percent change
Academic failure 313 119 62% decrease
Chronic truancy 243 86 65% decrease
School dropout 80 16 80% decrease
Protective Indicator
Number of youth WITHOUT
protective indicator reported on the
Initial Assessment
Number of youth WITH protective indicator
reported on the Reassessment Percent change
Significant school attachment/commitment 320 174 54% increase
9 In the most recent JCP Validation Study, this item was highly related to re-offending (NPC Research, 2011). 10 On average, the time in service was 6 months.

NPC Research, JCP Evaluation Findings 2015–17
Page 5 of 15
Figure 1. Decreases in School Risk Indicators
313
243
80
119
86
160
50
100
150
200
250
300
350
Academic failure Chronic truancy School dropout
# of youth with indicator oninitial assessment
# of youth with indicator onreassessment
80% decrease
62% decrease
65% decrease
NPC Research, JCP Evaluation Findings 2015–17
Page 6 of 15
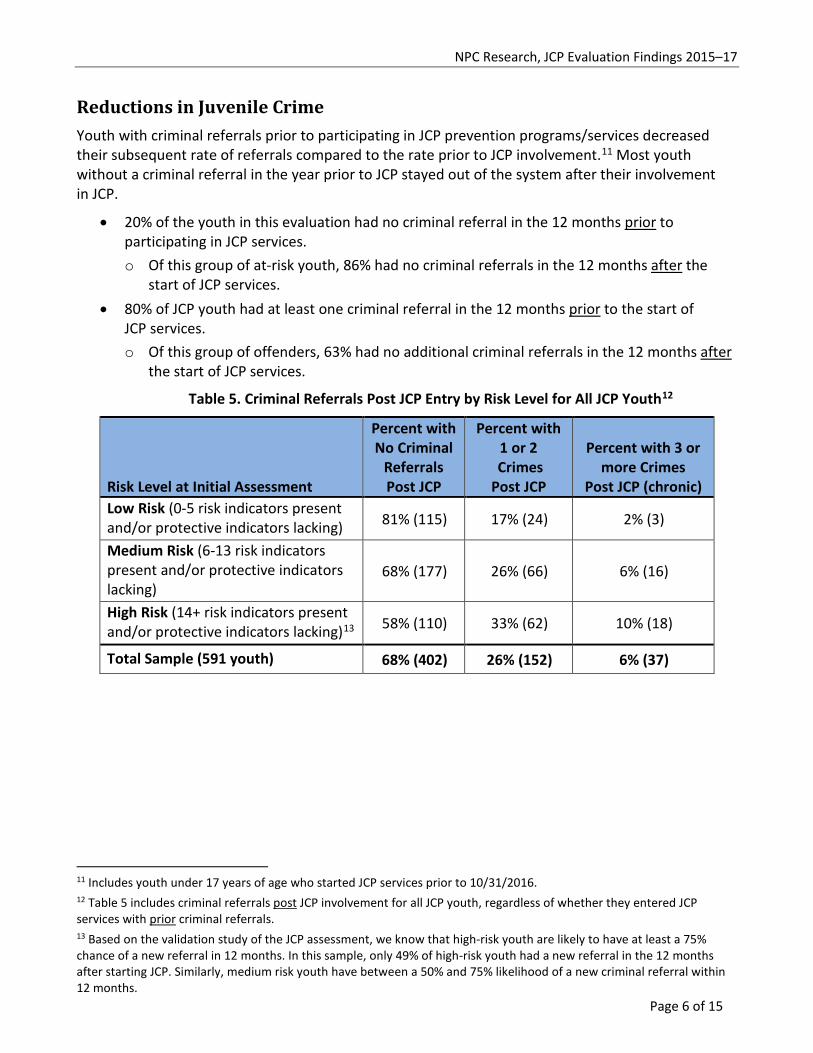
Reductions in Juvenile Crime Youth with criminal referrals prior to participating in JCP prevention programs/services decreased their subsequent rate of referrals compared to the rate prior to JCP involvement.11 Most youth without a criminal referral in the year prior to JCP stayed out of the system after their involvement in JCP.
• 20% of the youth in this evaluation had no criminal referral in the 12 months prior to participating in JCP services. o Of this group of at-risk youth, 86% had no criminal referrals in the 12 months after the
start of JCP services. • 80% of JCP youth had at least one criminal referral in the 12 months prior to the start of
JCP services. o Of this group of offenders, 63% had no additional criminal referrals in the 12 months after
the start of JCP services.
Table 5. Criminal Referrals Post JCP Entry by Risk Level for All JCP Youth12
Risk Level at Initial Assessment
Percent with No Criminal
Referrals Post JCP
Percent with 1 or 2
Crimes Post JCP
Percent with 3 or more Crimes
Post JCP (chronic) Low Risk (0-5 risk indicators present and/or protective indicators lacking) 81% (115) 17% (24) 2% (3)
Medium Risk (6-13 risk indicators present and/or protective indicators lacking)
68% (177) 26% (66) 6% (16)
High Risk (14+ risk indicators present and/or protective indicators lacking)13 58% (110) 33% (62) 10% (18)
Total Sample (591 youth) 68% (402) 26% (152) 6% (37)
11 Includes youth under 17 years of age who started JCP services prior to 10/31/2016. 12 Table 5 includes criminal referrals post JCP involvement for all JCP youth, regardless of whether they entered JCP services with prior criminal referrals. 13 Based on the validation study of the JCP assessment, we know that high-risk youth are likely to have at least a 75% chance of a new referral in 12 months. In this sample, only 49% of high-risk youth had a new referral in the 12 months after starting JCP. Similarly, medium risk youth have between a 50% and 75% likelihood of a new criminal referral within 12 months.

NPC Research, JCP Evaluation Findings 2015–17
Page 7 of 15
Figure 2. Criminal Referrals 12 Months Post JCP Service
68%
32% Proportion with noCriminal Referrals Post JCP(68%)Proportion with One orMore Criminal ReferralsPost JCP (32%)
For more information, please contact Anna Malsch at (503) 413-9098, or [email protected].
Page 8 of 15
Appendix A: Youth Demographic Information by Risk Level and Change in Risk Level
The table on the next page describes the demographic profile of each of the groups of youth by column heading. That is, the proportion of males and females, age, and proportion of racial/ethnic background is presented for the entire sample, and for the sub-groups of youth based on the risk level they had at intake and whether they had change in their number of risk indicators over time.
The proportion of males among youth of color is greater and one explanation for why we see the pattern of increased risk over time points to the importance of examining whether those youth are receiving culturally appropriate services.

Page 9 of 15
Table A1. Youth Demographic Information by Risk Level and Change in Risk Level14
All (Initial)15 N = 808
Low Risk at Entry
(I & R)16 n = 144
Med Risk at Entry (I & R) n = 256
High Risk at Entry (I & R) n = 198
Reduced Risk Level (I
& R) n = 369
No Change in Risk
Level (I & R)
n = 63
Increased Risk Level
(I & R) n = 166
Gender Male 66% (533) 75% (108) 68% (175) 58%17 (114) 62% (227) 79% (50) 72% (120)
Female 34% (275) 25% (36) 32% (81) 42% (84) 38% (142) 21% (13) 28% (46) Age
Average (mean) 14 years 14 years 14 years 14 years 14 years 14 years 14 years Range 7-18 years 7-18 years 8-18 years 8-18 years 7-18 years 10-18 years 7-17 years
Race/Ethnicity White 66% (808) 75% (108) 62% (158) 62% (123) 71% (262) 65% (41) 52% (86)
Hispanic/Latino 18% (147) 12% (18) 20% (51) 20% (40) 15% (56) 21% (13) 24% (40) Multiple races/ethnicities 5% (44) 5% (7) 7% (17) 6% (11) 4% (14) ɫ 18 8% (14)
Native American 3% (26) ɫ 4% (9) 4% (7) 2% (9) ɫ 4% (6) African American 6% (51) 5% (7) 8% (20) 8% (15) 5% (19) ɫ 12% (20)
Asian/Pacific Islander/ Native Hawaiian 1% (6) ɫ ɫ ɫ ɫ ɫ ɫ
14 Percentages may not add to 100 due to rounding. 15 These youth (n = 808) had an initial assessment. There were two additional youth who had only the reassessment. 16 These youth (n = 598) had both an initial and reassessment and therefore are in the group in which change over time can be measured. 17 Girls are overrepresented in the high-risk group, and there are proportionally more boys in the low-risk group. Older youth and the high-risk younger group were more likely to be in the reduced risk categories. Girls appear to be responding better to services than boys. 18 To protect youth confidentiality: “ɫ” refers to groups of one to four youth.

Page 10 of 15
Appendix B: Changes in Total Risk Score by Risk Level – Demographic Details19
The following tables provide additional details to describe the results of Table 3 in the main summary report, p. 3, which illustrates changes in risk score for the entire sample of youth.
Differences in percentages between tables are not necessarily statistically significant. Once the data are divided into multiple categories, the sample sizes become small, so interpretations of some comparisons must be made with caution. However, differences by race20,21 are worth noting and may highlight some areas where additional services, staff training, or resources are needed.
19 Percentages may not add to 100 due to rounding. 20 There were fewer than five youth identifying as Asian. To protect their identity, their data are not included in this appendix. 21 Data on the youth in the Tribal Programs were not included in this report.

Page 11 of 15
Changes by Gender Appendix B1. Changes in Total Risk Score by Risk Level: MALES
Risk Level at Initial Assessment # of Youth
(%)
Percent with Reduced
Risk Score
Percent with No Change
in Risk Score
Percent with Increased Risk Score
Low Risk (0-5 risk indicators present and/or protective indicators lacking)
108 (27%) 37% 25% 38%
Medium Risk (6-13 risk indicators present and/or protective indicators lacking)
175 (44%) 55% 10% 35%
High Risk (14+ risk indicators present and/or protective indicators lacking)
114 (29%) 80% 4% 16%
Total Sample 397 57% 13% 30%
Appendix B2. Changes in Total Risk Score by Risk Level: FEMALES
Risk Level at Initial Assessment # of Youth
(%)
Percent with Reduced
Risk Score
Percent with No Change
in Risk Score
Percent with Increased Risk Score
Low Risk (0-5 risk indicators present and/or protective indicators lacking)
36 (18%) 47% 11% 42%
Medium Risk (6-13 risk indicators present and/or protective indicators lacking)
81 (40%) 70% 10% 20%
High Risk (14+ risk indicators present and/or protective indicators lacking)
84 (42%) 81% 1% 18%
Total Sample 201 71% 7% 23%
Page 12 of 15
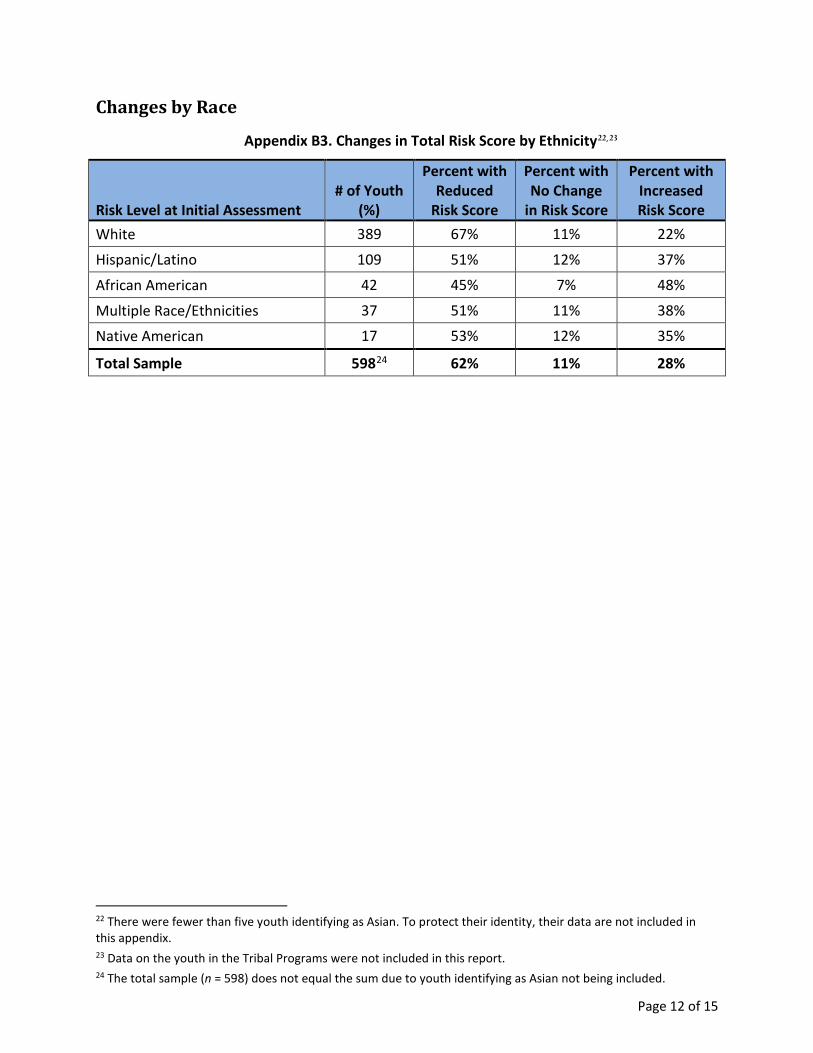
Changes by Race
Appendix B3. Changes in Total Risk Score by Ethnicity22,23
Risk Level at Initial Assessment # of Youth
(%)
Percent with Reduced
Risk Score
Percent with No Change
in Risk Score
Percent with Increased Risk Score
White 389 67% 11% 22%
Hispanic/Latino 109 51% 12% 37%
African American 42 45% 7% 48%
Multiple Race/Ethnicities 37 51% 11% 38%
Native American 17 53% 12% 35%
Total Sample 59824 62% 11% 28%
22 There were fewer than five youth identifying as Asian. To protect their identity, their data are not included in this appendix. 23 Data on the youth in the Tribal Programs were not included in this report. 24 The total sample (n = 598) does not equal the sum due to youth identifying as Asian not being included.

Page 13 of 15
Changes by Age
Appendix B4. Changes in Total Risk Score by Risk Level: AGE 13 OR YOUNGER (7-13)
Risk Level at Initial Assessment # of Youth
(%)
Percent with Reduced
Risk Score
Percent with No Change
in Risk Score
Percent with Increased Risk Score
Low Risk (0-5 risk indicators present and/or protective indicators lacking)
40 (20%) 30% 20% 50%
Medium Risk (6-13 risk indicators present and/or protective indicators lacking)
88 (43%) 47% 15% 40%
High Risk (14+ risk indicators present and/or protective indicators lacking)
75 (37%) 81% 3% 16%
Total Sample 203 56% 11% 33%
Appendix B5. Changes in Total Risk Score by Risk Level: AGE 14 AND OLDER (14-18)
Risk Level at Initial Assessment # of Youth
(%)
Percent with Reduced
Risk Score
Percent with No Change
in Risk Score
Percent with Increased Risk Score
Low Risk (0-5 risk indicators present and/or protective indicators lacking)
104 (26%) 43% 22% 35%
Medium Risk (6-13 risk indicators present and/or protective indicators lacking)
168 (43%) 67% 8% 26%
High Risk (14+ risk indicators present and/or protective indicators lacking)
123 (31%) 80% 3% 17%
Total Sample 395 65% 10% 25%

Page 14 of 15
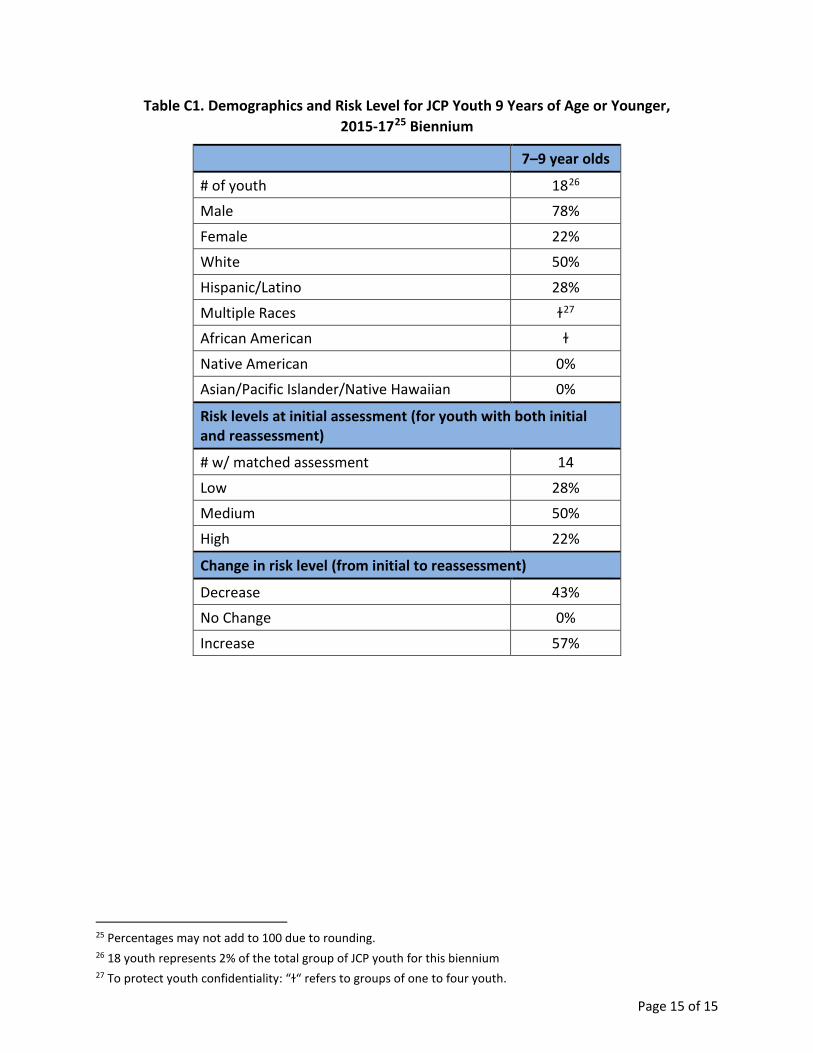
Appendix C: Demographics and Risk Level for Youth 9 Years of Age or Younger
The table on the next page illustrates the demographic and risk information for younger youth in the JCP evaluation sample. A majority of these youth experienced changes in risk score over time. Younger youth were disproportionally male. They were also less likely to be White, Native, or Asian, and more likely to be Hispanic/Latino or multi-racial. Note: The latest validation of the JCP Assessment in 2012 (for 2009–2011) had children and youth that ranged in age from 6 to 17. These were youth from JJIS, though many juvenile departments do not actually serve youth younger than 10. The tool was validated for the entire age range and there were no groups of youth for whom the tool did not “work,” though the numbers in the 6–8 year old range were very small. Results of the validation study did not yield any patterns that would have indicated it was not a useful tool for the younger youth. As part of the tool development process, a review of the research specific to the younger group was conducted and items were selected that were relevant across the entire age spectrum. Research suggests that younger children do not have as many accumulative risks simply because they have not had the opportunity due to their age. Many of the risks accumulate over time chronologically; therefore, older youth tend to have more risk indicators. When risk indicators are observed in the younger youth it is certainly notable. It is important if using the assessment with younger youth that they understand the concepts/questions—the skill of the interviewer with any individual child/youth is important in being able to explain questions, develop rapport, elicit information, and help the youth understand what is being asked. The other issue is how to serve the younger youth and if the JCP services in that area are appropriate for younger youth. When younger youth have multiple risk factors, it is worth paying attention to that, even if they are referred out to other services.
Page 15 of 15
Table C1. Demographics and Risk Level for JCP Youth 9 Years of Age or Younger, 2015-1725 Biennium
7–9 year olds
# of youth 1826
Male 78%
Female 22%
White 50%
Hispanic/Latino 28%
Multiple Races ɫ27
African American ɫ
Native American 0%
Asian/Pacific Islander/Native Hawaiian 0%
Risk levels at initial assessment (for youth with both initial and reassessment)
# w/ matched assessment 14
Low 28%
Medium 50%
High 22%
Change in risk level (from initial to reassessment)
Decrease 43%
No Change 0%
Increase 57%
25 Percentages may not add to 100 due to rounding. 26 18 youth represents 2% of the total group of JCP youth for this biennium 27 To protect youth confidentiality: “ɫ“ refers to groups of one to four youth.