JUTE MILL WORKERS OF WEST BENGAL - Riddhi Foundation · 2018-04-10 · List of Abbreviations AMRUT...
124
i Study Sponsored By NATIONAL JUTE BOARD JUTE MILL WORKERS OF WEST BENGAL: A Situational Analysis towards Enhancing their Wellbeing RIDDHI FOUNDATION
Transcript of JUTE MILL WORKERS OF WEST BENGAL - Riddhi Foundation · 2018-04-10 · List of Abbreviations AMRUT...
i
Study Sponsored By
NATIONAL JUTE BOARD
JUTE MILL WORKERS OF WEST BENGAL: A Situational Analysis towards Enhancing their
Wellbeing
RIDDHI FOUNDATION

Study Sponsored By
NATIONAL JUTE BOARD
JUTE MILL WORKERS OF WEST BENGAL: A Situational Analysis towards Enhancing their
Wellbeing
RIDDHI FOUNDATION

i
Table of Contents Table of Contents ........................................................................................................................................... i
List of Abbreviations ................................................................................................................................... vi
Acknowledgement………………………………………………………………………………………...viii
Team Members …………………………..……………………………………………………………….. ix
Executive Summary…………………………………………………………………………………………………………………………………1
1.1 Jute Industries in India ...................................................................................................................... 6
1.2 The Jute Mill Workers ...................................................................................................................... 7
1.3 Supply of Labour and their Skill ....................................................................................................... 8
1.4 Employment ...................................................................................................................................... 8
1.5 Poverty and Indebtedness of the Jute Mill Workers ......................................................................... 8
1.6 Living Conditions of the Jute Mill Workers ..................................................................................... 9
1.7 Housing and Related Amenities ........................................................................................................ 9
1.8 Health of the Jute Mill Workers and their Family Members .......................................................... 10
1.9 Industrial Relations and Disputes in Jute Mills............................................................................... 11
1.10 Measures by Government for Improving Conditions of the Workers ............................................ 14
1.11 The Jute Packaging Materials (Compulsory Use in Packing Commodities Act, 1987) .................. 15
1.12 The National Jute Board Act 2008 and the National Jute Board .................................................... 15
1.13 Schemes of the NJB for Welfare of the Jute Mill Workers ............................................................ 16
1.14 Beneficiaries of the Scholarship ..................................................................................................... 16
1.15 Objective of the Study..................................................................................................................... 17
2.1 Introduction ..................................................................................................................................... 18
2.2 Socio-economic Conditions Covered under the Study ................................................................... 18
2.3 Sample Selection ............................................................................................................................. 20
2.4 Data Collection ............................................................................................................................... 22
2.5 Data Compilation and Analysis ...................................................................................................... 23
2.6 In Depth Interview (IDI) and Focus Group Discussions (FGD) ..................................................... 23
3.1 Introduction ..................................................................................................................................... 24
3.2 Pattern of Migration for Working in the Jute Mills ........................................................................ 24
3.3 Religion, Caste and Demographics of Workers .............................................................................. 27
3.4 Demographic Features of the Workers’ Families ........................................................................... 29
3.5 Housing and Related Amenities ...................................................................................................... 35
3.6 Water Supply .................................................................................................................................. 40
3.7 Access to Sanitation Facility and Related Practices ....................................................................... 43
3.8 Solid Waste Disposal, Sewerage and Drainage .............................................................................. 46
ii
3.9 Access to Education ........................................................................................................................ 50
3.10 Training and Skill Development ..................................................................................................... 52
3.11 Status of Health ............................................................................................................................... 53
3.12 Income and Expenditure of the Jute Mill Workers ......................................................................... 61
3.13 Household Assets ............................................................................................................................ 63
3.14 Indebtedness and Reasons Thereof ................................................................................................. 63
3.15 Statutory Benefits from the Mills .................................................................................................... 67
3.16 Public Distribution System and other Entitlements ........................................................................ 68
3.17 Awareness on Different Schemes and Access to Benefits .............................................................. 69
3.18 Benefit from the Schemes of NJB ................................................................................................... 70
3.19 Participation in Various Social and Group Activities ..................................................................... 71
3.20 Social Environment ......................................................................................................................... 71
3.21 Mills Related Issues ........................................................................................................................ 72
4.1 Introduction ..................................................................................................................................... 75
4.2 Improving Living Conditions of the Jute Mill Workers ................................................................. 76
4.3 Education and Skill Development ................................................................................................... 78
4.4 Improving Services to the Children ................................................................................................ 80
4.5 Facilitating Economic Development ............................................................................................... 82
4.6 Enhancing Participation in Schemes for Minorities, SC and ST .................................................... 83
4.7 Increasing Awareness about various schemes ................................................................................ 84
4.8 Reducing problems faced in accessing various benefits ................................................................. 85
4.9 Improving Access to PDS ............................................................................................................... 85
4.10 Reducing vulnerability and improving social environment
4.11 More Direct Investment towards the Benefit of the Workers’ HHs ............................................... 86
4.12 Creation of a Cell within NJB for Looking after Wellbeing of the Workers’ HHs ........................ 86
List of Tables
2.3.1: List of Jute Mills selected and the location 22
3.2.1: Native places of the workers from where they migrated 25
3.2.2: State of origin of the migrant workers and period of migration 26
3.2.3: Reasons for migration 27
3.2.4: Living status of workers 27
3.3.1: Religion of the workers along with native places 28
3.3.2: Caste of the workers along with native places 28
3.3.3: Demographics of the workers 29
3.4.1: No. of family members by age & sex (excluding those living alone) 30
iii
3.4.2: Literacy rates 31
3.4.3: Educational background of surveyed workers by sex 31
3.4.4: Occupation of the family members living with the jute mill workers 32
3.4.5: Category of mill workers 33
3.4.6: Marital status of Sample Workers 34
3.4.7: Age at marriage 34
3.4.8: Number of children in the surveyed families 34
3.4.9: Number of living children in the workers’ household 34
3.5.1: Ownership status of housing 35
3.5.2: Types of residence of different categories of workers 36
3.5.3: Types of residence according to place of origin 36
3.5.4: Availability of some of the amenities 37
3.5.5: Number of rooms 37
3.5.6: Fuel used for cooking 39
3.5.7: Rent paid for accommodation 39
3.5.8: Type of Residence 40
3.6.1: Source of Drinking water 41
3.6.2: Nature of access to water (individual & shared sources) 41
3.6.3: Distance from water sources 42
3.6.4: Quality of water 43
3.6.5: Treatment of water for drinking 43
3.7.1: Access to toilet facilities 44
3.7.2: Type of latrine used 44
3.7.3: Bathing facility 45
3.7.4: Practice related to child defecation 46
3.8.1: System of disposal of garbage 47
3.8.2: Distance of dumping of disposable items 47
3.8.3: Frequency of disposal of garbage 48
3.8.4: Availability of improved vat 48
3.8.5: Nature of problem faced in disposal of garbage 48
3.8.6: Drainage facility available 49
3.8.7: Problem of water logging
3.9.1: Education status of family Member
49
50
3.9.2: Schooling status of children 51
3.9.3: Reasons for dropout 52
3.10.1: Occupational background of non-working members 53
3.11.1: Service providers for illness of the workers 54
3.11.2: Industry-wise accidents in West Bengal 55
3.11.3: Type and number of cases of illness due to occupational hazard 56
3.11.4: Reasons behind absenteeism of the workers 56
3.11.5: Incidence of illness during last one year across age group and sex 56
3.11.6: Type of reported sickness during last one year 57
3.11.7: Service Providers for treatment of family members (excluding workers) 58
3.11.8: Cost of treatment across household income (in Rs.) 58
3.11.9: Coverage of immunization against various diseases 59
iv
3.11.10: Service provider for Immunization of Child 59
3.11.11: Antenatal and Postnatal care of Pregnant and Lactating Mother 60
3.12.1: Monthly household income 61
3.12.2: Type of Work and Monthly Income 61
3.12.3: Details of Remittances 62
3.13.1: Household assets owned by the jute mill workers 63
3.14.1: Debt and its repayment 64
3.14.2: Source from where loan was taken 64
3.14.3: Purpose of loan 65
3.14.4: Access to savings account 66
3.14.5: Frequency of Savings 66
3.14.6: Number of workers having life insurance coverage by income category 67
3.16.1: No. of HHs who avail PDS 68
3.16.2: Access to various entitlements 69
3.17.1: Awareness on different schemes 69
3.19.1: Participation in various social and community level activities 71
3.20.1: Perceived vulnerability from various social evils 72
3.21.1: Suspension of work in the mills during last one year 72
3.21.2: Number of times the mill remains closed in Last Year 72
3.21.3: Reasons for suspension 73
3.21.4: Reasons behind suspension of work as reported by the millers 73
3.21.5: Expenses cut during suspension by income groups of workers 74
3.21.6: Responses of the children about their preferred profession
74
List of Graphs
3.2.1: Pattern of migration 24
3.2.2: Percentage of migrant workers across different time period when migrated 26
3.3.1: Percentage share of workers as per social group 28
3.4.1: Average family size with respect to educational level of workers 30
3.5.1: Ownership status of housing 35
3.9.1: Education level of male and female members of workers’ HHs 50
3.9.2: Never enrolled and drop out (%) for boys and girls 51
3.11.1: Percentage of workers and their family members who fell ill during last one year 58
3.12.1: Average HH expenditure per month and % share of different types of expenditure 62
3.14.1: Purpose of loan 65
3.20.1: Types of vulnerability faced
71
List of Annexures
2.1: Questionnaire 87
2.3.1: Information of the mills surveyed 95
2.3.2: Information of the workers of the mills surveyed 96
3.10.1: Vocational Training 97
v
3.11.1: Classification and Incidence of Common diseases suffered by the workers, average
duration period and Cost incurred
100
3.11.2: Classification and Incidence of Chronic diseases suffered by the workers, average
duration period and Cost incurred
101
3.11.3: Classification and Incidence of Common diseases suffered by the family members,
average duration period and Cost incurred
102
3.11.4: Classification and Incidence of Chronic diseases suffered by the family members,
average duration period and Cost incurred
103
3.12.4: Expenditure across different purposes 104
3.15.1: Statutory Benefits to the Jute worker 105
3.18.1: Benefit from the schemes of NJB for the mills surveyed 108
3.18.2: Status of Sanitation Schemes provided by NJB (2015-16) 109
3.18.3: Status of Scholarship Scheme provided by NJB (2015-16) 110
3.21.5: Ways of overcoming the situation when the mill was closed 112
4.7: Information about some important Schemes 113
vi
List of Abbreviations
AMRUT Atal Mission for Rejuvenation and Urban Transformation
AP Andhra Pradesh
APL Above Poverty Line
APY Atal Pension Yojana
BCG Bacillus Calmette-Guérin
BPL Below Poverty Line
CBC Carpet Backing Cloth
CBO Community Based Organization
CITU Centre of Indian Trade Unions
CSO Civil Society Organization
DA Dearness Allowance
DPT Diphtheria, Pertussis and Whooping cough
ESI Employees' State Insurance
ESIC Employees' State Insurance Corporation
FGD Focus Group Discussion
HH Household
HRA House Rent Allowance
IAY Indira Awas Yojana
IBPS Institute of Banking Personnel Selection
ICDS Integrated Child Development Services
IDI In Depth Interview
IJMA Indian Jute Manufacturing Association
JDP Jute Diversified Product
KMC Kolkata Municipal Corporation
KMDA Kolkata Metropolitan Development Authority
LPG Liquefied Petroleum Gas
MA&ME Minority Affairs and Madrasah Education
MHRD Ministry of Human Resource Development
MGNREGS Mahatma Gandhi National Rural Employment Guarantee Scheme
MT Metric Ton
vii
NFHS National Family Health Survey
NGO Non-Governmental Organization
NJB National Jute Board
NSDC National Skill Development Corporation
NSFDC National Scheduled Castes Finance and Development Corporation
NULM National Urban Livelihood Mission
OBC Other Backward Class
PDS Public Distribution System
PMAY Pradhan Mantri Awas Yojana
PMJJBY Pradhan Mantri Jeevan Jyoti Bima Yojana
PMSBY Pradhan Mantri Suraksha Bima Yojana
PW Pregnant Women
RKSY Rajya Khadya Suraksha Yojana
RSBY Rastriya Swastha Beema Yojana
SC Scheduled Caste
SJSRY Swarna Jayanti Sahari Rojgar Yojana
SRS Sample Registration System
SHG Self Help Group
ST Scheduled Tribe
TN Tamil Nadu
TV Television
UP Uttar Pradesh
WASH Water, Sanitation and Hygiene
WBMDFC West Bengal Minorities Finance Development Corporation
viii
Acknowledgement
The National Jute Board (NJB), Ministry of Textile, Government of India, entrusted Riddhi Foundation
for conducting a study for assessing the socioeconomic condition of the jute mill workers of West Bengal
and their family members. Purpose of the study was to assess the status of wellbeing of the workers and
their family members as well as to identify the interventions which are possible to be made by the NJB
for improvement of their level of wellbeing.
The study team of Riddhi Foundation is grateful to the NJB for reposing faith on the team in conducting
the study. The team express its sincere gratitude for the support and contribution of the officials of NJB
and the officials of the Jute Commissioner for conducting the study. The study team received all supports
from the management of the jute mills selected for the study, their workers, family members and the
leaders of the trade unions with whom the study team interacted to get information on the prevailing
socioeconomic condition of the workers and their families. The report could not be completed without
receiving information from them and the study team gratefully acknowledge their valuable contributions
in completing the study.
Several Departments and Agencies of the State Government also assisted the team by providing relevant
information on schemes which are likely to benefit the jute mill workers. The team appreciate their
contributions and is thankful to all of them.
Riddhi Foundation
ix
Team Members
Dr. M. N. Roy
Prof. Raghabendra Chattopadhaya
Mr. Dilip Ghosh
Dr. Kallol Mukherjee
Ms. Nilanjana Mukherjee
Ms. Mayuri Sen
Mr. Debraj Bhattacharya
Ms. Debasree Bose
1
Executive Summary
Objective of the Study: The objective of the present study is to capture the socio-economic conditions of
the jute mill workers of West Bengal and members of their household (HH) for proper appreciation of
their level of wellbeing and to suggest feasible and cost effective ways to improve their socio-economic
status.
Methodology: The study was conducted by selecting a sample of 10 jute mills and 50 workers from each
mill, both using the randomized sampling process. Apart from quantitative analyses of the data captured
through HH survey there were focus group discussions and in-depth-interviews to gain insight on the
qualitative aspects of the findings as well as to validate the results in some cases. The key findings of the
study are:
Social classification: The survey found that 76 per cent of the workers are Hindu and another 24 per cent
are Muslim. Out of all the workers share of those belonging to general caste, SC, ST and OBC are 53.4
per cent, 15.6 per cent, 2 per cent and 5.0 per cent respectively.
Migration pattern: 77 per cent of the workers have migrated for working in jute mills. This comprises
of 60.4 per cent migrating from other states and 16.6 per cent coming from different parts of erstwhile
Bengal, which includes present day Bangladesh. 20.8 per cent workers reported that they were local and
others were not aware of their native place. 14.2 per cent of the workers are found not to live with their
families.
Sex Ratio: Sex ratio is only 843, which is very low and the child sex ratio (up to 6 years of age) is 815,
which is even worse. Both these ratios are worse than the general population living in the same districts
where the mills are located.
Average family size: The average family size has been found to be 4.8 and the number of children per
HH works out to be 1.9.
Literacy Rate: The literacy rate of the jute mill workers and their family members is 81.07 per cent and
the corresponding figures are 84.18 per cent for male and 77.16 per cent for female respectively. Only
30.0 per cent of the workers had education beyond class VIII standard and only 6.8 per cent have education
above secondary level.
Occupation: A major portion of the male population are engaged as manual labour because of lower level
of education as well as little skill acquisition. The other important observation is low rate of participation
in economic activities (excluding reproductive HH work) by the women.
Housing: 69.5 per cent of the workers live in only room. Average number of rooms available in their
houses is 1.5 and the same is merely 1.1 for those who live in mill quarters. 27.8 per cent of the workers
live in quarters provided by the mills, 35.8 per cent live in rented houses outside mills and 36.4% live in
2
their own houses. 75.8 per cent have no separate kitchen. However, 96.4 per cent of them have electricity
in their houses.
Fuel: Majority of the respondents (53.0%) use LPG as their fuel while another 25.8 per cent use kerosene.
Coal and fire wood, which are hazardous from health point of view, are used by 14.0 per cent and 3.8 per
cent of the HHs respectively.
Water Supply: 91.6 per cent of the families use either piped water supply (91.0%) or water from deep
well using submersible pump (0.6%). Only 28.6 per cent of the HHs have individual source of water. 50.8
per cent of the HHs use shared sources of water and another 20.6 per cent use community sources. 8.8 per
cent of the HHs are not satisfied with the quality of water.
Toilet: Overall status of sanitation is not satisfactory. 54.6 per cent of HHs use public toilet, 45.0 per cent
use private toilets and 0.4 per cent HHs practice open defecation. However, total 8.4 per cent HHs practice
open defecation or unhygienic toilets.
Solid / liquid waste management: As many as 173 HHs, which is 34.6 per cent of the total workers
surveyed dispose their garbage in the open which is unhygienic. For those who live in the mill quarter, the
corresponding figure is 30.9 per cent. There is need to improve solid and liquid waste management.
Education: Majority of the family members of the workers have education level only up to class VIII.
18.7 per cent of female are illiterate compared to that of 14.5 per cent among male members of the HHs.
On the other hand, 18.4 per cent of the male family members have qualification of higher secondary or
above level compared to corresponding figure of only 9.4 per cent for the female family members.
Vocational Training: Vocational training for improving employability is an important need. The survey
however found that coverage of vocational training as well as its effectiveness have been poor although
substantial amount was spent by those who received such training with their own effort.
Health: The workers face high incidence of occupational hazard and related illness and there is need for
improving the working as well as the living environment. In spite of having coverage under ESI, the
workers received treatment from private facilities in 56.4 per cent cases and the same is 60.2 per cent for
the non-worker family members. That increases their burden of expenditure on healthcare.
ICDS: The ICDS infrastructure in the mills is very poor and needs upgradation. Also, all the eligible
children are not enrolled and all the enrolled children are not attending the centres.
Income: The survey found that average income of the workers’ HH is Rs. 11,015 per month. However,
there is wide variation of income across the HHs. Maximum households (57.4 per cent) have reported
monthly income in between Rs. 5,001 to Rs. 10,000 and 6.4 per cent HHs have income above Rs. 20,000
per month. On the other hand, 3.8 per cent HHs have income below Rs. 5000 per month.

3
Expenditure pattern: 55.3 per cent of the HH expenditure is made on food, followed by 7.3 per cent in
education (including 4.4 per cent for private tuition), 6.4 per cent in clothing, 5.7 per cent in health and 5
per cent in fuel.
Loan and Debt: 54 per cent HHs are in debt. The average amount of loan is Rs. 39,592 whereas the
amount of loan varies from Rs. 1,500 (for treatment) to Rs. 12, 00,000 (for building house, home loan
taken from Bank). Social obligation is the most common (35.6%) for taking loan followed by repairing
house (18.1%) and medical care (17.8%). In 78.5per cent cases loan was taken from PF.
Banking and insurance services: There is poor awareness about the banking and insurance services. 13.4
per cent HHs do not have any member having bank account and there is little insurance coverage outside
ESI. The HHs are not aware of the bank account linked scheme for insurance and pension, which are
specially targeted towards the poor.
PDS coverage and uptake: 17.8 per cent of the HHs did not have ration cards and another 10.2 per cent
did not lift food grains every week. Majority of them are from the lower income category.
Awareness on government schemes: Level of awareness on various government schemes vary from 84.6
per cent for student’s cycle scheme to as low as 4 per cent for SJSRY.
Participation in community activities: 25.8per cent of household participate in Trade Union activities
followed by 11.6 per cent of the household participate in Club/CBOs. Participation as member of SHG is
very low at 1.8 per cent while 64.6 per cent of the HHs are aware of the SHGs.
Vulnerability apprehended by the HHs: Alcoholism (47.4%) has been identified as the most common
problem followed by theft. Violence against women and trafficking are also perceived as serious problems
for which organizing women in SHGs could be a mitigating measure.
Suspension: 32.4 per cent mills faced suspension during last one year. The corresponding figures for
IJMA and Non-IJMA mills were 45.6 per cent and 19.2 per cent respectively.
On the basis of the study of the present condition of the workers, the following recommendations are
proposed:
Housing: Most of the jute mills have land where new houses may be constructed. The other parallel option
is to explore who are willing to take the benefit of PMAY and to facilitate their taking loan to construct
new houses or to improve existing houses.
Water: Water supply as such is not a problem. Though quality of water supplied is not tested but as per
perception of the residents of the quarters nearly 21per cent are not satisfied with its quality. There is need
to periodically test the water quality at the source as well as at the user end.
Sanitation: The possible interventions include improvement in toilet infrastructure, solid and liquid waste
management and menstrual hygiene. The mills may take a drive to improve the toilet infrastructure and to
4
prevent open or unhygienic mode of defecation completely within the mill premises including the quarters.
Sanitation facilities in the work place may also be improved.
Arranging clean fuel for all HHs: 47 per cent of the HHs do not have access to clean fuel. They may be
assisted to get LPG connection and NJB may consider providing some financial incentives.
Education: High dropout rate among the boys above 14 years is alarming. NJB may consider extending
their education scheme to cover all children of class IX and X. It is also necessary to make the parents
aware about educating their children and to provide possible support at home. Mills may also provide
reading room and coaching facility.
Improving uptake of the scholarship scheme: Only 44.8 per cent of the HHs are aware of the scholarship
scheme of the NJB. Therefore, there is need for increasing the awareness of the scheme among all the
eligible students and their parents.
Vocational Training: NJB may negotiate with the National Skill Development Commission as well as
the departments concerned of the state government and provide more opportunities for vocational training
of the children of jute mill workers in different trades.
ICDS: The infrastructures of the ICDS centres in the mills is to be improved to provide adequate space,
separate kitchen, water supply and toilets. Awareness of parents on importance of the scheme is also to be
increased for universal coverage and regular attendance of all their children.
Health: There is urgent need to address the issues on occupational health hazards of the workers. There
is also need to improve service delivery by the ESI to reduce burden of expenditure due to treatment from
private providers. The mills may be persuaded to organize health camp for prevention of serious illness
and treatment of chronic diseases.
Increasing Family Income: Large number of family members are unemployed and the adult women are
mostly confined to the domestic sphere. Improving quality of education and strengthening skill through
vocational training are critical requirements. Benefits from all available programmes in these respect are
to be converged. There is high potential for augmenting family income by mobilizing the women and
organizing them in SHGs as well as imparting income earning skill and management practices to them for
starting micro-enterprises. Support of professional organization working in this sector may be taken for
facilitating the entire process. Some of the SHGs may be trained to produce value added jute goods.
Support to workers belonging to the minority community: There is need to increase awareness about
the schemes specifically targeted towards the minority. NJB and the jute mills may collaborate with the
MA&ME department and the WBMFDC to facilitate uptake of benefits for the HH members of the
minority community with the support of suitable professional organizations.
Support to SC and ST workers: There are several schemes of school education department of
government of West Bengal aimed at SC students and also there are several schemes offered by the
National Scheduled Caste Finance Development Corporation and its West Bengal counterpart for taking
5
up income generating activities by the members of the SC. There are similar schemes for the members of
the ST community. NJB may move the appropriate authorities and take the help of competent
organizations to facilitate the process of extending due benefit to the SC and ST workers’ HHs.
Improving coverage of banking and insurance services: Lack of critical awareness in this regard is a
major problem. All the adult members of the HHs may be persuaded for opening bank account under Jan
Dhan Yojana and to access the insurance and pension benefits under the APY, PMJJBY and PMSBY
schemes.
Access to PDS: Almost all the workers’ HHs are eligible to get the benefit of the National Food Security
Act or the Rajya Khadya Suraksha Yojana to receive subsidized food grains. However, many of them are
not covered or are unable to lift ration every week. NJB may persuade the mills and take support of the
trade unions to identity the left out HHs for their receiving subsidized food grains.
Improving social environment: The women SHGs recommended to be formed can be federated (for each
mill or a cluster of nearby mills) to a umbrella organization so that all the SHGs can join together for
fighting many of the social evils like alcoholism, atrocities against women as well as improving physical
environment for which they need to be specially trained. The jute mill authorities and the NJB may provide
infrastructure and other support for regular meeting of the women SHGs and seek the support of all
possible allies like the police, government department, municipalities and other organizations whose
involvement will be helpful in removing the social evils. There is also need for outsourcing suitable
professional organization to handhold the SHGs and their Federation in empowering them to take up such
activities
Increasing direct investment for wellbeing of the workers: Total investment being made directly by
the government for the jute mill workers is quite insignificant compared to cost of indirect support to the
jute industries by the government. There should be more earmarked fund to directly address some of the
issues concerning the wellbeing of the jute mill workers and their households.
Constituting a Cell at the NJB: There is need to pursue several matters with various agencies towards
enhancing the wellbeing of the jute mill workers. NJB may consider creating a cell to provide undivided
attention to the wellbeing of the jute mill workers and their family members. As an alternative services of
a suitable agency may be outsourced to provide required support. However, in that case also there has to
be a couple of dedicated manpower within the Board for necessary coordination.
6
CHAPTER 1
Background of the Study
1.1 Jute Industries in India
1.1.1 Jute is a very important natural fiber which is grown in countries like India, Bangladesh, Myanmar,
Nepal, Vietnam etc. It is mainly used for packaging along with several other uses. Being environment
friendly, it has much potential for more diversified use. The entire jute sector globally employs more than
4.0 million people including farmers, workers in the jute mills/industry and people working in the Jute
Diversified Product (JDP) sub-sector. India is the largest producer of jute goods in the world, accounting
for around 70 per cent of world production. It is also the largest user of jute goods.
1.1.2 By the 19th century, when industrial processing of jute for manufacturing mostly packaging
materials started, Bengal practically monopolized the world’s production of raw jute. After independence,
jute is mostly grown in the eastern region of India, particularly West Bengal. The first jute mill in India
was established in 1855 at Rishra near Kolkata and the first twenty mills were scattered on either sides of
the river Hooghly around Kolkata. There were, however, four main clusters. The first cluster was around
Rishra and Serampore on the West bank of the river. Further to the South of the river, a group of mills
came up in Howrah. On the East bank, groups of mills came up between Shyamnagar in the North to
Sealdah, within Kolkata proper, along the newly laid railway track. In the Southern Suburbs of Kolkata,
a group of mills came up near the docks and jetties of Khidirpur and Garden Reach. Further South along
the East bank were Budge-Budge Jute Mills and later Birla Jute Mills. Thus the bulk of the industry was
not located within the municipal limits of the city unlike the Bombay cotton industry.1 Rather, the mills
were concentrated on a narrow strip of land within commuting distance from Kolkata comprising in effect
the suburban fringe of the city. In the early years, most of these mills were carefully located in or near
already thriving commercial and urbanized satellites. A few mills chose isolated sites, which later
developed into ‘mill towns.’
1.1.3 India has 92 jute mills of which 67 are located in West Bengal, as per information available with
the office of the Jute Commissioner. The main products are hessian, sacks, carpet backing cloth (CBC)
and other items. Total production of jute goods in the country during the period 1995-96 to 2014-15 varied
from 1776.0 thousand MT (2007-08) to 1267.2 thousand MT (2014-15), with an average of 1546.82
thousand MT per year2. Total production of jute goods varies substantially over the months within a year
and over the years, which also leads to change in labour demand. The maximum installed capacities in
jute mills other than 100% export oriented units is estimated to be 2,789 thousand metric tonnes per
annum, indicating capacity utilization of little over 50% on an average. Jute goods is an important item of
1Sen. S (1999), “Women and Labour in Late Colonial India, The Bengal Jute Industry”, CUP, P- 15 2From www.jutecomm.gov.in, the website of the Office of the Jute Commissioner
7
export. In the year 2014-15, export of jute goods was of Rs 1813.8 crore. Jute industry is highly labour
intensive with around one third of total turnover accounting for wages3. High weightage of labour cost
makes labour a critical input and an area for possible cost cutting by the millers which lead to strained and
complex relationship between the owners and the workers of the jute mills. There has been complaint of
exploitation of the workers and deprivation from statutory dues against the owner of the mills. The millers
were well organized from the initial days and there is a history of confrontation between the mill owners
and the labourers, which affects functioning of the mills.
1.1.4 In the period till independence, it was the British people who, being attracted by the easy access
to raw materials and cheap labour, established the jute mills. In absence of any regulation for the welfare
of the workers, the relation was exploitative and the owners enjoyed a monopolistic market. In the year
1884, majority of the Indian jute mills decided to form the Indian Jute Manufacturing Association in order
to maintain the level of profit by restricting the output to match with the demand.4 In July 1902, the
Association was named as the Indian Jute Mills Association. In 1931, the Indian Jute Mills Association
was registered under the Indian Trade Union Act, 1926. Thereafter, the Association was incorporated
under the Companies Act, 1956 on 28th July, 1989. However, only 26 mills in West Bengal are members
of the IJMA.
1.2 The Jute Mill Workers
1.2.1 The jute industry was dependent on migrant labourers from the initial days. The industry had
attracted immigrant labours from outside the state, especially from Odisha and Bihar. These workers were
"pushed, not pulled, to the city", according to the Royal Commission on Labour in India. The city had few
attractions for them. The commission further observed that "Few industrial workers would remain in
industry if they procure sufficient food and clothing in the village" 5 They failed to get adequate
employment and subsistence in the rural economy. Thus these migrants remained villagers at heart and
retained a close relationship with their village homes6. As a result, for a long time, the jute mill labourers
were most unstable and floating in character and the labour supply in the mills were greatly affected by
the seasons. The labourers, having little stake on the industry and being from different places far away
from the mills, were highly unorganized and suffered the exploitation, particularly in the initial days, when
there was hardly any regulation to safeguard the interests of the labourers.
3 Rao K.H and Rao M.M (1993): IJIR, Vo. 28, No.4 4Chakraborty. D (1999), “Rethinking working- class history: Bengal, 1890-1940”, CUP, P- 14 5Whitley, J. H. (1931). Report of the Royal Commission of Labour. London: H.M. Stationary Office, 1931. 6Bhattacharya. N, (1973), “Some Characteristics of Jute Industry Workers in Greater Calcutta,” Economic & Political Weekly,
Vol.8, 03 February
8
1.3 Supply of Labour and their Skill
1.3.1 The workers who joined the mills were generally uneducated and untrained for any specific job.
Moreover, the system of recruitment and training of jute mill workers were informal in nature from the
very beginning. The wage rates in jute mills were much lower compared to that in other industries.7 So
the workers left the mills whenever they got better jobs. S. R. Deshpande noted high turnover, especially
among the unskilled labourers. As the wage rate was not standardized, workers frequently went from one
mill to another. Other factors contributing to instability of the jute mill workers were bad working and
living conditions, low rates of wages, insecurity of service, the system of "budli" workers, absence of
social security measures, the "sardari" and "contract" systems of recruitment, and the fluctuations in the
international market of jute leading to fluctuations in the total employment.8The task of developing a
labour force was always a supply proposition to the mills and not a question of skill formation and training.
Agricultural labourers, unsettled by the sort of changes taking place in the agricultural economy, and
unskilled of all trades, peasants, artisans and labourers turned into destitute, mostly comprised the working
mass in the jute mills. They migrated with the expectation that the condition would be better in the place
of their destination.9
1.4 Employment
1.4.1 At present, jute mills in West Bengal provide direct employment to 2.3 lakhs persons and indirect
employment to 40 lakhs persons10. Previously the majority of the workers were from Bihar, Orissa and
Uttar Pradesh and the share of Bengali workers were relatively low because they were engaged in
agriculture but currently the scenario has changed and the proportion of Bengali workers are increasing.
The industry has a good potential for employment generation and modernization of the mills through
technology upgradation can improve the quality of workers who will get employed in the mills.
1.5 Poverty and Indebtedness of the Jute Mill Workers
1.5.1 Economic conditions of the jute mill workers were not good. Indebtedness was a common problem
among the workers of jute mills and many of them were always in debt.11 Often they took loan for day-
to-day expenses as many households had deficit in meeting monthly expenses. They often borrowed in
cash and in kind from various sources. Marriage and sickness seemed to be important reasons behind
7 Bhattacharya. N. ibid 8Mukherjee I (2011), “Industrial Workers in a Developing Society: A Sociological Study”, Journal of Health Population and
Nutrition 2011 Feb: 29 (1),9-13 9Hann. A (1997), “Unsettled Settlers: Migrant workers and industrial capitalism in Calcutta”, Modern Asian Studies, Vol. 31,
No. 4, pp. 919-949 10 Kundu. G, (1994), “Changes In the Working and Living Conditions of Workers In Jute Industry In West Bengal (1980 to
1992): A Study”, Thesis submitted to the University of Burdwan 11Das. N, (1996), “Environment and health conditions of Jute mill workers in West Bengal: A Geographical Analysis”,
Jawaharlal Nehru University, Working Paper, P-289-290
9
debts. Among the jute mill workers, both Hindus and Muslims used to pay a huge amount of dowry, both
in cash and kind. In case of sickness, much money was needed as almost no government health facilities
were accessible to the workers. Moreover, when the workers were unemployed due to strikes, lockouts
etc., it was necessary for them to take loans to bear the day to day expenditure of the household. Among
other reasons of indebtedness, buying and repairing house, buying agricultural land and cattle were
prominent. Sometimes a loan was taken to pay off a previous loan. The interest of loan ranges from 14
per cent in case of company loan to 200 per cent in case of money lenders (Mahajans). Possession of
consumer durables was an important indicator of the economic status of the workers. Majority of the
workers possessed various durable goods such as radio, wrist watch, sewing machine, pressure cooker etc.
Some of the workers also possessed television set12.
1.6 Living Conditions of the Jute Mill Workers
1.6.1 The working and living conditions of the labourers were generally poor, which had very adverse
impact on the quality of life of the workers as well as their family members. The mill authorities ignored
the plight of the workers and turned a blind eye to the poor conditions and squalor that prevailed in and
around the jute mills. Das observed that “The living and working conditions in and around jute mills was
always regarded as a low-priority for the mill owners”13. The monitoring of the living and working
conditions of the working class was necessary only to maintain the law and order in and around the mill.
Epidemics were discussed because they created large-scale absenteeism among the workers and for the
same reason accidents were also monitored to some extent. Even the government and the philanthropic
organisations also ignored the poor living conditions of the jute mill workers.
1.7 Housing and Related Amenities
1.7.1 One major reason behind poor living condition of the workers was poor housing. According to the
report of the Royal Commission 1931, majority of the workers lived in back-to-back lines of houses
provided by the employers. The quarters of the jute mill workers were generally built in a continuous row,
usually along a railway line. Every cluster or batch of houses was built without any plan or without
reference to any other. They were built haphazardly in this way from the very beginning, and the people
had to move to the streets outside through covered passages. If the totally ill planned construction was
injurious to the health of the workers by preventing ventilation, that method of shutting them up in courts
surrounded on all sides by buildings was far more so. The worker’s quarters were nothing but overcrowded
insanitary hovels, without any adequate ventilation facilities whatsoever. The floor and the roof were
cemented, but were often found leaking and damp. The workers cooked inside their rooms or in the
verandah and collected drinking water from the nearby tap or pond. The factory did not provide any
drinking water for them. The workers who stayed in rented houses generally resided in slums or shanties.
The living conditions in those slums were worse than those in the coolie-lines of the mills. The slum or
12 Kundu . G, (1994), ibid 13 Das. N, (1996)ibid
10
the makeshift shanties, found along the railway lines, or along the river or canal banks or beside wastelands
were used as garbage dumps. The areas were deprived of all means of cleanliness. The workers living in
those areas were deprived of water itself, since drinking water was not supplied to unauthorized premises
and the ponds or rivers were so polluted that they were not hygienic for consumption or use for other
domestic purposes. The houses were almost invariably built on public land and are often evicted at the
shortest notice. The contractors who build those houses or the local mafia who collected the so called
"rent" were usually given protection by the factory owners and they helped the factory owners to evict the
workers, if necessary. Hence the living conditions of the workers living in both the coolie-lines and in the
slums were controlled by the factory owners.
1.7.2 There were however exceptions depending on the management of the mill. A study based on Birla
Jute Mills showed that though the workers were mostly staying in the coolie lines provided by the
factories, their dwellings were much better than many other jute mills.14 The workers were provided with
one room, one wide balcony, a kitchen, a toilet, drinking water facilities and a small courtyard. The houses
have electricity and cross ventilation. The better living conditions of the Birla Jute Mill were responsible
for the comparatively less morbidity among the workers.
1.8 Health of the Jute Mill Workers and their Family Members
1.8.1 The living conditions of the workers affected their health directly. Poor housing condition was
associated with lack of access to basic amenities like water & sanitation as a result of which various
infectious and other diseases caused by unhealthy environment were widely prevalent among the jute mill
workers and their family members living with them. Overcrowding with insanitary condition inside the
house created stresses and health hazards due to factors such as improper lighting, lack of ventilation etc.
As a result of all these, the people generally had poorer health and higher burden of diseases and the infant
mortality rate was also very high.15
1.8.2 Various studies had been carried out in the past focusing on the health of the jute mill workers16.
It can be seen that majority of the workers suffered from respiratory diseases since they got constantly
exposed to jute dust which substantially enhanced the risk of impairment of lung function. From all the
studies an interesting fact can be stated that most of the workers never had any respiratory trouble before
joining the work in the jute mill. The main reasons of the worker’s ill health were the living and working
conditions. The diseases were mostly due to bad housing conditions, lack of basic amenities like clean
water, insanitary living condition and overcrowding and hence the diseases were inherent in the nature of
their quality of life. It has been observed that over time the respiratory diseases such as asthma, bronchitis,
chronic cough etc. among the workers had increased. Exposure to jute dust within the working areas and
the general dusty atmosphere of the neighbourhood slum were responsible for the spread of respiratory
14Das. N, (1996)-ibid 15 Das. N, (1996)-ibid 16Mandal. A (2014), “Pulmonary function of jute mill workers from West Bengal, India”, Progress Health Science Vol 4, No1,
P- 8

11
diseases. There were some diseases which were specific to the workers of the jute mills. For example, a
typical skin disease prevailed among the workers handling batching oil in the batching department. It was
a kind of eczema causing pigmentation and scars of the skin17. The scars might often turn into skin cancer
needing operation. The skin diseases were further multiplied due to insanitary living conditions, the
diseases of the workers differed from the diseases of his household members in the sense that the workers
suffered from some diseases typical to the nature of their work and the working conditions. Thus, the
workers suffered from more diseases than their household members as they suffered both from
occupational hazards at the workplace as well as environmental hazards at the workplace and at home. In
the present days also, the scenario has not changed much. A study conducted during the year 2010 found
that an outbreak of cholera in a jute mill situated by the side of the river Hooghly, continued for many
days18. The mill received water from two sources: (a) the underground water, which was stored in an
overhead tank, was primarily used for industrial purposes and for domestic use, e.g. washing, bathing and
(b) water supplied by the Kolkata Municipal Corporation (KMC) was used for drinking purposes. This
water was stored in the reservoir in the mill premises and distributed to the workers through three taps. The
study pointed out that contamination of the drinking-water reservoir within the factory premises as the
source of the outbreak since the drinking-water reservoir was not cleaned or disinfected.
1.8.3 The health seeking behavior of the workers were related to health awareness, availability of
healthcare facilities including preventive and promotive services like inoculation, family planning etc. and
access to such services. As mentioned above, it was further influenced by the socio-economic conditions,
their working and living environment, poverty and ignorance on causes behind diseases because good
health is related to attaining certain level of education. The non-availability of basic amenities and medical
facilities forced the workers to adopt a life style which was harmful to themselves and their family
members. The poor health seeking behaviour of the workers, poor living conditions, inadequate health
infrastructure and lack of access to whatever facilities existed were all different parts of the vicious cycle
which led to ill health of the workers and their family members.
1.9 Industrial Relations and Disputes in Jute Mills
1.9.1 Job insecurity and poor working conditions had been a matter of continuous dissatisfaction among
the workers and the jute sector became one of the hotbeds of trade union activities. The first industry wide
strike in jute industry was called in December, 1936 which lasted for around three months19. The system
of securing labour for the mills during that period depended entirely on the sardars who had absolute
rights to hire and fire and they alone dealt with the management. Thus, the first strike had job security as
17 Das. N, (1996)-ibid 18Mridha. P (2011), “The 2010 Outbreak of Cholera among Workers of a Jute Mill in Kolkata, West Bengal, India”, Journal
of Health Population and Nutrition 2011 Feb: 29 (1),9-13
19 Maheswari. Y (2013), "Industrial dispute in jute mills”, International Journal of Marketing, Financial Services &
Management Research Vol.2, No. 7, P-64

12
its main issue. It was decided, with the intervention of Mr. Fazlul Haque, the then Chief Minister of
undivided Bengal, that hiring and firing would have to be done on consultation with the management and
with its concurrence. So the first strike was successful and arbitrary action on the part of the sardars was
precluded.
1.9.2 After independence, Central Wage Board was set up in August 1960, with two representatives,
each of the Workers or Trade Unions and of employers, giving its recommendations in 1963 for a validity
of three years. The recommendations were accepted unanimously.
1.9.3 With the lapse of that three-year period, the Central Trade Unions, which had further consolidated
their position among jute mill workers, presented a charter of demands. This led to confrontation for a
prolonged period, ending in a strike after which Tripartite Settlement was reached between the Trade
Unions, the Employers and the West Bengal Government, with some degree of intervention from Central
Government. There had been several Tripartite Settlements followed by fresh agitation after expiry of the
agreement. With 1978 came another major demand for wage revision, and the third major strike in the
Jute Industry began from January 5, 1979, continuing till February 22, when another Tripartite Settlement
followed with validity up to December, 1981. The agreement was accepted both by the IJMA and non-
member mills. There followed a few one day strikes from 1980 to 1982, with the Unions renewing
demands for wages revision at the expiry of the December 1981 deadline. At that time, Gross Wage for
jute workers was Rs 619.0 to Rs 650.6 per month, with fringe benefit in the shape of employer’s
contribution adding an indirect 30-35 percentage. However, the strange thing was that all workers were
paid the same amount with no differentiations for skills or experience, and only minor differences based
on job classifications. Thus IJMA created a plea for productivity-linked wages. The evidence of the 1980s
with regard to productivity bears out the contention of the Unions that man days per metric ton of jute
products were being progressively reduced from about 65 to a target of 45. The lack of Grades and Scales
and the problem of reducing employment in the industry led to the inclusion of two crucial clauses in the
1979 settlement-clause V (4) under which a committee to go into whole question of workload, and clause
V (5) under which a committee to go into the question of Grades and Scales would be set up by the State
Government. Accordingly, the two committees under D. Bandopadhyay and S.K. Bhattacharya submitted
their reports in December, 1980 and May 1981 respectively. According to the first committee, workforce
had been reduced by 46,000 since 1972 and workload increased so that the man-loom ratio, which stood
at 3.12 in 1947 had increased to 2.52 in 1979, and hence, working balance as in 1972 should be resorted.
However, the recommendation met with an outright rejection from the IJMA. The State Government,
while supporting the committee, admitted that there were shortcomings in the evaluation, since only 16
mills had provided the necessary data. The IJMA also challenged the recommendations on Grades and
Scales in court. However, while not able to obtain concessions from mills owners, the Unions were no
more to be sidelined. They continued to put pressure on the State Government, which convened several
unsuccessful tripartite discussions. The Unions jointly began a strike on 16th January, 1984 which ended
with a settlement in April. The industry had to concede mainly on Grades and Scales in the next agreement.
Workers were put into 7 consolidated Grades varying between a minimum of Rs 211 and maximum of Rs
420 with Scales or increments varying between Rs 4 and Rs 10. The amounts are insignificant but the
13
point was accepted by the employers. The employers also agreed to maintain permanent workers at 90
percent of the workforce in each mills as on May 5, 1971 (May is the lean season), and a further category
of Special Budlies at 20 percent of the same complement with an assurance of providing at least 220 days’
work for them. Casual Budlies could be given work as and when required, there being no stipulation as to
the minimum number of working days. As a result of this agreement, the jute industry in present days
follows categories of workmen (other than monthly rated staff like clerical and security personnel):
Permanent, Special Budlies, Casual Budlies, and Contract Workers. The permanent workers are entitled
to benefits and leave. The Special Budlies got wages for 220 days, or number of days actually worked,
and get proportional leave. Casual Budlies got benefits for only the days worked, usually too small to
accumulate leave except in some cases. They were often deprived of PF, ESI and Gratuity. Contract
workers are employed for special jobs or in places like canteens and get paid purely at minimum wage
rates for days worked. The unions went on strike again from January 28, 1992 resulting in an agreement
on March 17, 1992, which increased the basic wage to a minimum of Rs. 406 and maximum of Rs 615,
with rate of increments remaining unchanged at ludicrous levels. However, since DA had increased
substantially, the total emoluments of permanent workers had exceeded Rs 2,000 per month.20
1.9.4 Jute Industries faced occasional strikes to improve their condition. Every year workers call strike
for improving their living and overall conditions. There was the longest strike of 84 days in 1984.
According to a Government record issued by State Labour Ministry, there were maximum number of
strikes in the year 2002 during last 15 years.21 The number of strikes were two in 1993, one in the year
1995, three in the year 1997, five in the year 1999, two in the year 2000, two in the year 2001 and 17 in
the year 2002. In the strike of 1995, 2.25 lakhs people joined. In 2004 there were three strikes. In the year
2003 CITU and others 15 trade unions called a strike on 29th December which lasted for 11 days.
Tripartite discussions were not very successful in improving the conditions of the workers of the mill.
Again 20 Unions of jute mill workers jointly called strike for indefinite period from 5th January 2007
demanding payment of increased rate of DA and dues of PF, Gratuity etc. The increasing bitterness
between the workers and the owners is one of the reasons for decline of jute industries.
1.9.5 The extent of bitter relationship has occasionally led to extreme untoward incidents like beating to
death of officers22. It reflects both the militancy of the workers as well as persistence of the unaddressed
demands of the workers like payment of outstanding gratuity, bonus, provident funds and increase in
dearness allowance, which becomes stagnant and large scale financial irregularities of the management in
spite of having a system of tripartite settlement from the 196023. The quality of management of some of
the mills with more unrest is also an important factor in contributing to the continuing mistrust between
the millers and the workers, since there are mills which have been working without much hassles for a
20 Venkataratnam C. S., Verma Anil (1998), Challenge of Change: Industrial Relations in Indian Industry, 1997, Allied
Publishers Limited, P76 21 Maheswari. Y (2013)-ibid 22The Chief Executive Officer of the North Brook Jute Mill was beaten to death by the agitated employees when they were
proposed weekly three days’ work because of lack of order and piled up stock of finished goods. 23Editorial Article (2014): Economic and Political Weekly, June 28
14
long time due to better management. The high degree of mistrust between the owners and the workers is
one of the reasons of resorting to extreme steps by the workers in resolving issues than the regular process
of conciliation for settlement of disputes. Enhancing the component of wellbeing of the workers may lead
to some soothing impact on the industrial relationship in the jute sector.
1.10 Measures by Government for Improving Conditions of the Workers
1.10.1 Considering the demand of the jute mill and other workers for proper working and living
conditions, there had been growing emphasis on the improvement of working conditions and the welfare
of the workers in the organized sector after independence. Several legal measures have been taken by the
Government, particularly after independence, for improving the conditions of the industrial workers in
general, which have also benefitted the workers of the jute mills. Some of the important Acts applicable
to the jute mill workers are briefly mentioned below:
i. The Industrial Dispute Act, 1947: This Act was passed by the Government to provide for
investigation and settlement of the industrial disputes between employers and employees,
promotion of measure for securing and preserving amity and good relationship, prevention of illegal
strikes and lockout andrelief to workmen in the matter of lay off and retrenchment, collective
bargaining etc.
ii. The Factory Act, 1948: This Act ensures that the workers have a safe, clean and healthy working
environment. Facilities for sitting, first-aid, canteen, shelters, rest rooms, lunch rooms and crèches
where women workers were present. In most of the jute mills these facilities were not provided as
per requirement.
iii. Minimum Wages Act, 1948: This Act was passed to prevent exploitation of labours and to provide
some sort of social security measures to a vast majority of working class people employed in the
unorganized sector in the country since these workers had very little or no bargaining power and
they often get deprived of fair and legitimate wage.
iv. The ESI Act, 1948: This applies to factories (except seasonal factories) employing 10 or more
persons. Employees of the factories drawing wages up to Rs. 15000/- per month are entitled to
social security cover under the ESI Act. It is a self-financing health insurance scheme for Indian
workers. This fund is managed by the Employees' State Insurance Corporation (ESIC), an
autonomous corporation established by the Ministry of Labour and Employment, Government of
India, according to rules and regulations stipulated in the ESI Act 1948. The employers' rate of
contribution is 4.75 percent of the wages paid to employees. The employees' contribution is 1.75
percent of the wages paid, making the total share of 6.5 per cent of wage as contribution to the ESI.
Daily-wage employees earning less than Rs100/- a day are exempt from paying their share. Main
benefits under ESI Scheme are Sickness Benefit, Disablement Benefit, Dependents’ Benefit,
Maternity Benefit and Medical Benefit.
v. The Employees’ Provident Funds and Miscellaneous Provisions Act, 1952: It is an Act to
provide for the institution of provident funds, pension fund and deposit-linked insurance fund for
employees in factories and other establishments.
15
vi. The Payment of Gratuity Act, 1972: This Act is an important social security legislation intended
to provide relief to an employee when he is no longer in service under his employer.
vii. The West Bengal Workmen’s House Rent Allowance Act, 1974: This Act applies to the
industrial establishments in West Bengal where 20 or more workmen are employed. The Act
provides for payment of house rent allowance to a workman @ 5 per cent of the wages during a
month or Rs. 15/- whichever is higher.24 Even temporary, casual or budli workmen rendering
services for less than 6 days in a month are entitled to a pro-rata house rent allowance.
viii. The Equal Remuneration Act, 1976: The Equal Remuneration Act, 1976 is an important piece of
legislation in the field of women’s welfare to provide for the payment of equal remuneration to men
and women workers and for the prevention of discrimination on the ground of sex, against women
in the matter of employment, promotion etc.
1.11 The Jute Packaging Materials (Compulsory Use in Packing Commodities Act,
1987)
An act to provide for the compulsory use of jute packaging material in the supply and distribution
of certain commodities was passed by the Parliament in 1987 in the interests of production of raw jute and
jute packaging material and of persons engaged in the production thereof. This helps to provide an assured
market to the jute manufacturers. Jute Commissioner procures B-Twill bags for use by government to
indirectly benefit the jute growers and the mill workers. The quantum of purchase was 2424 thousand
Bales at a price of Rs 5589.1 crore during the year 2015-16.
1.12 The National Jute Board Act 2008 and the National Jute Board
1.12.1 The National Jute Board Act, 2008 was passed by the Parliament to establish the National Jute
Board (NJB) “for the development, the cultivation, manufacturing and marketing of jute and jute products
and for matters connected therewith and incidental thereto”. The Act got the assent of the President on the
February 12, 2009. As per the Act, it shall be the duty of the Board to promote the development of jute
and jute products by such measures as it thinks fit. The Board may undertake measures for promotion of
production and productivity of better quality of raw jute, improve efficiency and productivity of the jute
manufacturing sector, engages in research and human resource development programmes to explore
new, innovative and diversified use of jute products with the idea of enabling both the organized as well
as the decentralized sector to compete and increase the global share of Indian jute goods. Since the working
condition of the jute mill workers and their wellbeing is very critical to improve the efficiency and
productivity of the jute manufacturing sector, the functions of the Board also include improvement of
working conditions and wellbeing of the workers and their families. The Act also provides that Board may
take measures to (i) take steps to protect the interests of the jute growers and workers and to promote their
24Department of Labour; Government of West Bengal; Labour in West Bengal: Annual report 2014-15
16
welfare by improving their livelihood avenues and (ii) secure better working conditions and provisions
and improvement of amenities and incentives for workers engaged in the jute industry.
1.13 Schemes of the NJB for Welfare of the Jute Mill Workers
1.13.1 The Charter of the Board includes providing for the welfare of workers in jute-producing units and
some schemes have been already taken up towards that end, which are briefly mentioned below.
i. Sanitation facilities:
A Scheme to provide hygienic sanitary facilities for mill workers and their families, first in the
mill quarters and in the second stage in the working areas have been introduced five years ago.
Applications are sought from mills for construction of sanitary facilities in mill quarters and in the working
areas, which is examined and appraised through an independent agency. Sanitary facilities include
designed sanitary blocks with toilet facilities for men and women, wash basins, sewage, etc. The total cost
of constructing such sanitary facility is borne by NJB, subject to a maximum of Rs. 20 lakhs each. The
concerned mill first incurs the expenditure for construction of the sanitary facilities and thereafter 90 per
cent of the costs up to the ceiling of Rs 20 lakh is reimbursed by NJB. As far as possible, the facilities in
the workers’ quarters / living areas should be Pay-and-Use type where revenues provide the cost of
maintenance for the agency managing them. In the case of facilities constructed in the mill working areas,
the mill concerned is required to enter into Annual Maintenance Agreement with Sulabh International or
such other agency as may be selected. The mill concerned has to bear the cost of maintenance.
ii. Scholarship Scheme for Children:
NJB extends support to the workers’ family towards education of their children through a
scholarship scheme, which was approved during the 9th Board meeting of NJB held on 25th February,
2015. The amount of one-time scholarship for different categories of students is given below:
1. On qualifying Secondary Education (for girls only): Rs. 5,000/-
2. On qualifying Higher Secondary Education (for girls only): Rs. 10,000/-
3. On qualifying Graduation (for boys & girls): Rs. 15,000/-
4. On qualifying Post Graduation (for boys & girls): Rs. 20,000/-
5. For pursuing Professional courses (Engineering, Technical, Management, Chartered Accountant,
Chartered Secretary, Institute of Cost and Chartered Accountants courses) in Govt. Institutions (for boys
& girls): Annual Tuition fees.
The scheme will be applicable to all jute goods manufacturing units throughout the country paying Cess.
Annual budget for the year 2015-16 was Rs 2.0 crore.
1.14 Beneficiaries of the Scholarship
1.14.1 Any registered manufacturing unit producing jute, as defined in Jute Manufactures Cess Act, 1983
and employing at least 10 workers will be considered under the scheme. Children of a worker
17
(male/female) pursuing study in any recognized school, college and university and any female worker
who is also a daughter/wife of a jute mill worker shall also be covered, if she is a student. Maximum two
children per family may get the benefit under the scheme.
1.15 Objective of the Study
1.15.1 From the observations of the various studies carried out on the jute mill workers stated above, it
can be seen that the conditions of the workers and their family members need to be improved. Labour
being one of the most critical component of the jute industry, enhanced wellbeing is likely to have positive
impact on their productivity and on labour relationship. So the essential needs of the workers in respect
of food, clothing, shelter and basic amenities like water, sanitation & waste disposal, healthcare,
education, social security, recreational and cultural facilities etc. should be improved. Moreover, mutual
conflict between the employers and employees gives birth to the industrial disputes which stand against
the progress and prosperity of the industry as well as of the workers. As mentioned above, no industry can
enjoy peace and progress as long as the primary needs of the workers are not fulfilled. Thus, the proposed
study is to cover different benefits provided by the jute mills to the workers, access to various civic and
socioeconomic services from the local governments (Municipalities where they usually live), the State
and the Union Governments and the barriers they are facing in improving their quality of life within the
given social and economic context in which they are living. The study is aimed at identifying the gaps in
uptake of various services and the constraints in availing the existing opportunities by the jute mill workers
and their family members due to supply and/or demand side failures as well as the reasons behind such
failures so that the findings help in prescribing the appropriate policies for improvement in their wellbeing
through appropriate interventions. The demographic features of the mill workers have also been captured
to judge if the social background of the worker has any association with their wellbeing. Assessment of
wellbeing of the workers involves multidimensional analysis of various economic, social and demographic
factors that have influence on the standard of living of the working force in the jute mill. These factors
have been categorized into demographic conditions, living conditions and basic amenities, access to social
services and benefits provided by the mills, economic status, education status and related access, health
and nutrition status and related access, participation in government programs for social and economic
development etc. These factors have been captured through the study and analysis has been made using
statistical tools to draw inferences. The study will help to understand the possible interventions which are
to be made for enhancing the wellbeing of the jute mill workers.
18
Chapter 2
Methodology for the Study
2.1 Introduction
The objective of the study is to capture the socio-economic conditions of the jute mill workers of
West Bengal and members of their household (HH) for proper appreciation of their level of wellbeing, the
benefits that accrue to them as workers of the mills or their family members and other socio-economic
benefits they can access from the public domain as well as from the market. There are several aspects of
the socio-economic conditions of the jute mill workers and members of their HHs for judging their
wellbeing. To keep the study within manageable limit only the important social and economic aspects of
the workers and their household members have been captured in the study. The data has been collected
by studying a sample of the workers selected through scientific sampling techniques, so that the findings
reflect the general conditions of the workers and their HHs with certain degree of confidence. This chapter
describes the different social and economic aspects of the workers which have been considered for the
study, methodology adopted for identifying the required number of sample HHs, process of capturing data
from each of the household selected at random, other relevant information from the mills and other
agencies for analyzing the same.
2.2 Socio-economic Conditions Covered under the Study
The study covered the following broad aspects of social and economic conditions of the HHs
having at least one jute mill worker:
i. Demographic features and migration pattern:
These broadly cover the social and religious background of the workers, their demographic
features, the area from where they have migrated, their mother tongue, marital status, family size,
sex ratio etc. Various other aspects like literacy rates, educational background of the workers and
their family members and occupation status of all the adult members etc. have also been captured.
ii. Housing and household amenities:
These broadly cover the nature of houses where they live, number of rooms, access to amenities
like electricity, availability of separate kitchen, fuel used for cooking, cost of accommodation etc.
Given that the poor housing conditions of the jute mill workers reported in the earlier studies, these
aspects were captured in more details to appreciate the quality of life of the jute mill workers and
their family members.
iii. Access to water, sanitation and hygiene:
19
These include access to drinking water, types of sources used, access to toilet facilities, nature of
solid and liquid waste management etc.
iv. Access to education and development of professional skill:
Development of human resources is a permanent step towards ending poverty and deprivation.
The study has captured the education status of the family members of the jute mill workers
including status of schooling. It also covers status of acquisition of various employment oriented
skills by the male and female members of the workers and the benefit that has accrued towards
receiving employment.
v. Status of health and access to medical services:
It was difficult to conduct a full-fledged study on the status of health of the jute mill workers and
their family members within the scope of the present study. However, given the reported health
related issues of the jute mill workers as discussed in Chapter I, some of the important aspects of
the jute mill workers including their occupational health hazards have been captured through
household survey. Access to treatment of diseases and cost involved along with available
preventive services, particularly for the women and children have also been captured in the survey.
vi. Income, expenditure, savings and indebtedness:
The study has also capture the income of the HHs from all sources including that received as wage
by the mill workers. Though it is very difficult to capture the income from informal sources but
best efforts have been made to estimate the likely income of the sample HHs and their expenditure
with item wise break up. To assess the overall economic status of the HH the level of debt and
savings as well as the reasons of incurring debt etc. have also been captured. Further, access to
banking and insurance services have been captured through the study to assess the uptake of
financial services by the workers and their family members. Nature of assets owned by the HHs
has also been captured for general understanding of the level of affluence of the HHs.
vii. Statutory benefits from the mills:
The jute mill workers are supposed to receive some of the statutory benefits and it is necessary to
know to what extent such benefits are being received by the workers. Also, the benefit may vary
with the type of workers. These have been captured to the extent possible from the workers as well
as the mill owners.
viii. Access to various entitlements and participation in welfare schemes:
There are certain entitlements which the citizens enjoy in general. To what extent the jute mill
workers and their family members are enjoying some of the important entitlements have been
included in the study. That apart, there are some targeted services as well as general opportunities
to be enjoyed by the citizen and the study has also captured to what extent the jute mill workers
and their family members have been benefitted. These aspects have been captured to assess, to the
20
extent possible, if the jute mill workers are accessing such benefits at par with the other people
with similar socio-economic background.
ix. Awareness and participation in various social activities:
The level of awareness of the workers and their family members and their participation in various
social activities help them to enjoy a better quality of life and access various social benefits. These
aspects have also been captured
x. Social environment in which the workers live:
There are certain aspects related to social environment which are important determinants of quality
of life. These include law and order situation, vulnerability to different types of crime, violence
against women, incidence of alcoholism etc. Some of such important aspects have also been
captured for assessing the level of vulnerability of the jute mill workers and their family members.
All the information mentioned before have been captured using a questionnaire. After developing
the questionnaire, the same was field tested and thereafter modified for being used in the survey. The final
questionnaire that has been actually used for the survey is shown in Annexure 2.1.
2.3 Sample Selection
It is neither economic nor necessary to survey all the workers in every mill, since statistically
significant inferences can be drawn by surveying a sample of the target households. The essence of
sampling in such socioeconomic study is to take adequate samples and to maintain randomness in selection
for having minimum bias, which allow for consistent estimates and sound inferences to represent the entire
population, which, in this case, are all the jute mill workers of West Bengal and their family members.
A system of two stage sampling has been considered to be most appropriate for the study. In the
first stage suitable number of mills were selected and in the second stage suitable number of workers from
each mill were selected, both using randomized sampling techniques.
2.3.1 Sampling suitable number of mills:
There are total 67 jute mills in West Bengal of which only 6 are located outside the KMDA area
and far away from Kolkata. The 61 mills in KMDA area are spread across the districts of North 24
Parganas, Howrah, Hooghly, South 24 Parganas and Kolkata. A map showing location of all the mills in
KMDA area is shown in the next page. Normally a sample of 10 per cent should be adequate for this type
of survey. However, to be on the safer side, total 10 mills have been selected, which works out to be
around 15 per cent of the total mills. The characteristics of the workers and their socio-economic condition
are different for those mills located within KMDA area compared to those which are away from KMDA
area, which are only 6 in number. Therefore, only 1 mill has been selected from outside KMDA area and
9 mills have been selected from KMDA area. The selection has been done using randomized sampling
techniques from the two different sets of mills. The mills which remained closed or have problems which
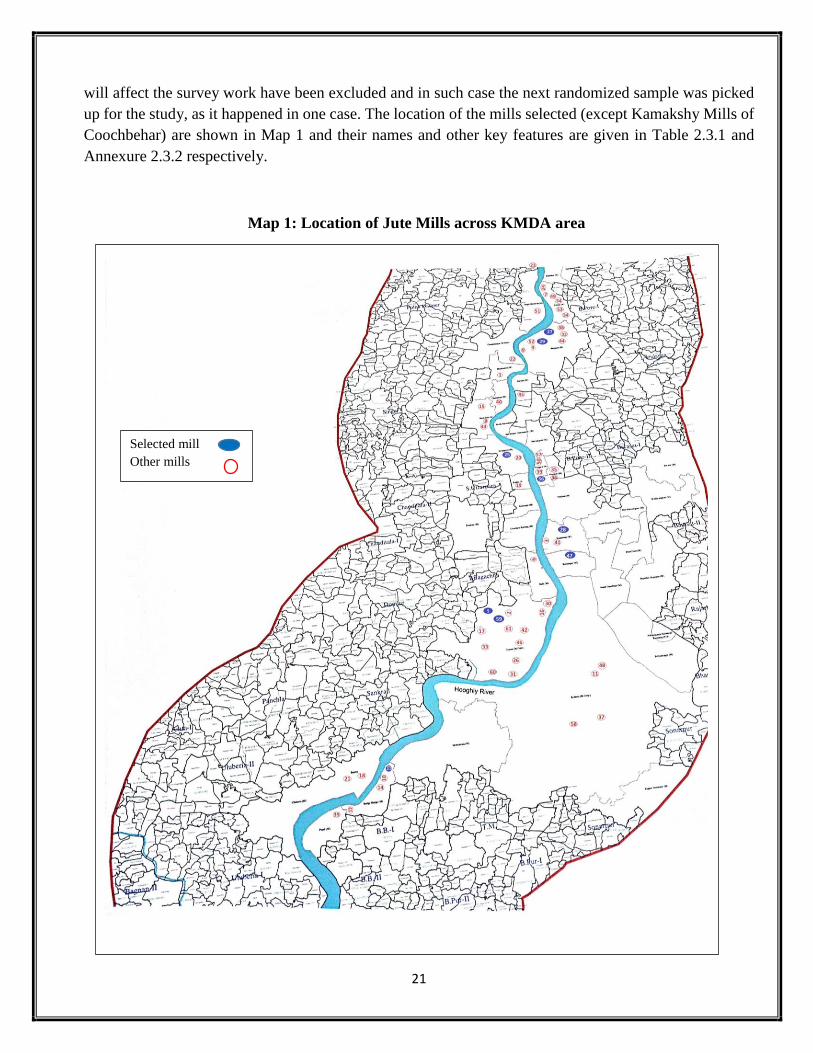
21
will affect the survey work have been excluded and in such case the next randomized sample was picked
up for the study, as it happened in one case. The location of the mills selected (except Kamakshy Mills of
Coochbehar) are shown in Map 1 and their names and other key features are given in Table 2.3.1 and
Annexure 2.3.2 respectively.
Selected mill
Other mills
Map 1: Location of Jute Mills across KMDA area
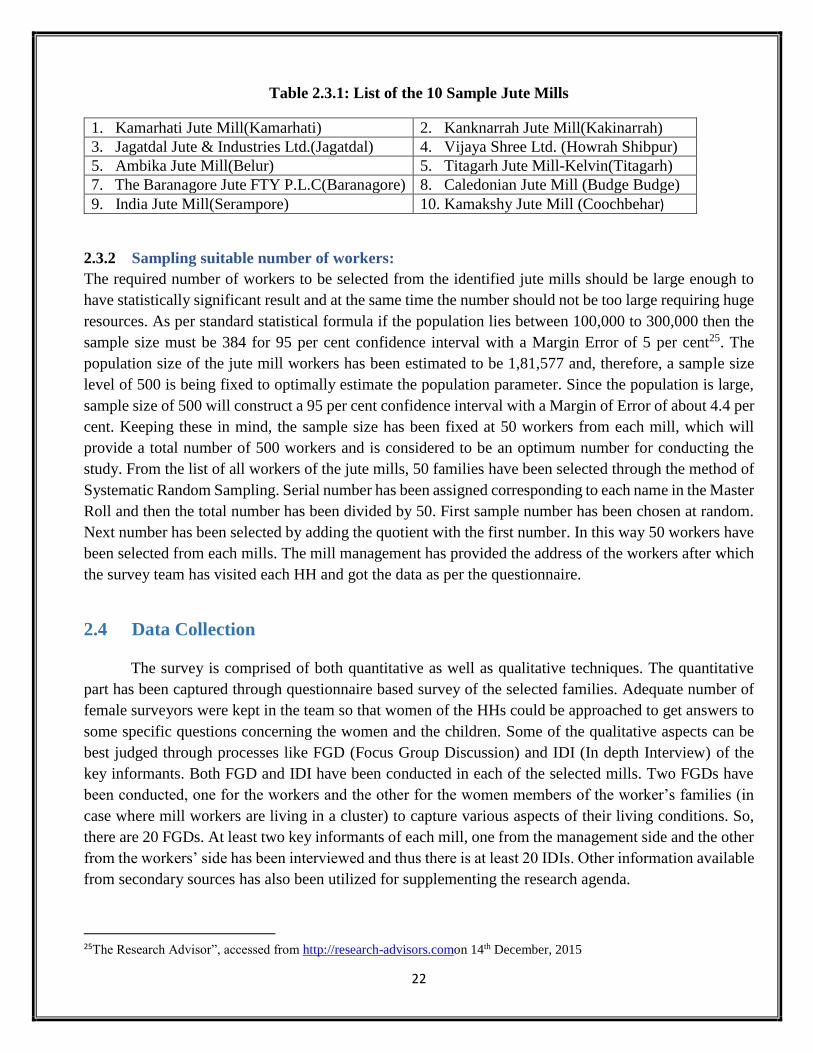
22
Table 2.3.1: List of the 10 Sample Jute Mills
1. Kamarhati Jute Mill(Kamarhati) 2. Kanknarrah Jute Mill(Kakinarrah)
3. Jagatdal Jute & Industries Ltd.(Jagatdal) 4. Vijaya Shree Ltd. (Howrah Shibpur)
5. Ambika Jute Mill(Belur) 5. Titagarh Jute Mill-Kelvin(Titagarh)
7. The Baranagore Jute FTY P.L.C(Baranagore) 8. Caledonian Jute Mill (Budge Budge)
9. India Jute Mill(Serampore) 10. Kamakshy Jute Mill (Coochbehar)
2.3.2 Sampling suitable number of workers:
The required number of workers to be selected from the identified jute mills should be large enough to
have statistically significant result and at the same time the number should not be too large requiring huge
resources. As per standard statistical formula if the population lies between 100,000 to 300,000 then the
sample size must be 384 for 95 per cent confidence interval with a Margin Error of 5 per cent25. The
population size of the jute mill workers has been estimated to be 1,81,577 and, therefore, a sample size
level of 500 is being fixed to optimally estimate the population parameter. Since the population is large,
sample size of 500 will construct a 95 per cent confidence interval with a Margin of Error of about 4.4 per
cent. Keeping these in mind, the sample size has been fixed at 50 workers from each mill, which will
provide a total number of 500 workers and is considered to be an optimum number for conducting the
study. From the list of all workers of the jute mills, 50 families have been selected through the method of
Systematic Random Sampling. Serial number has been assigned corresponding to each name in the Master
Roll and then the total number has been divided by 50. First sample number has been chosen at random.
Next number has been selected by adding the quotient with the first number. In this way 50 workers have
been selected from each mills. The mill management has provided the address of the workers after which
the survey team has visited each HH and got the data as per the questionnaire.
2.4 Data Collection
The survey is comprised of both quantitative as well as qualitative techniques. The quantitative
part has been captured through questionnaire based survey of the selected families. Adequate number of
female surveyors were kept in the team so that women of the HHs could be approached to get answers to
some specific questions concerning the women and the children. Some of the qualitative aspects can be
best judged through processes like FGD (Focus Group Discussion) and IDI (In depth Interview) of the
key informants. Both FGD and IDI have been conducted in each of the selected mills. Two FGDs have
been conducted, one for the workers and the other for the women members of the worker’s families (in
case where mill workers are living in a cluster) to capture various aspects of their living conditions. So,
there are 20 FGDs. At least two key informants of each mill, one from the management side and the other
from the workers’ side has been interviewed and thus there is at least 20 IDIs. Other information available
from secondary sources has also been utilized for supplementing the research agenda.
25The Research Advisor”, accessed from http://research-advisors.comon 14th December, 2015

23
2.5 Data Compilation and Analysis
The data from the filled in survey formats have been entered into the database created for the study
and the data have been carefully validated to maintain quality of the analyses that followed from the data
captured from the field. Tables on various thematic aspects of socioeconomic life of the sample HHs have
been generated for drawing specific inferences.
2.6 In Depth Interview (IDI) and Focus Group Discussions (FGD)
IDIs and FGDs were conducted in two phases. Some of these were conducted during the survey
for understanding the qualitative aspects of the data which were being captured. After the analyses of the
data there were some queries for better understanding of the issues which emerged. Some of the IDIs and
the FGDs were conducted after the analyses was completed for validation of the findings as well as to
gain better insight of the issues involved and interventions possible.
In-depth Interview and Focus Group Discussion with the jute mill
workers
and their family members
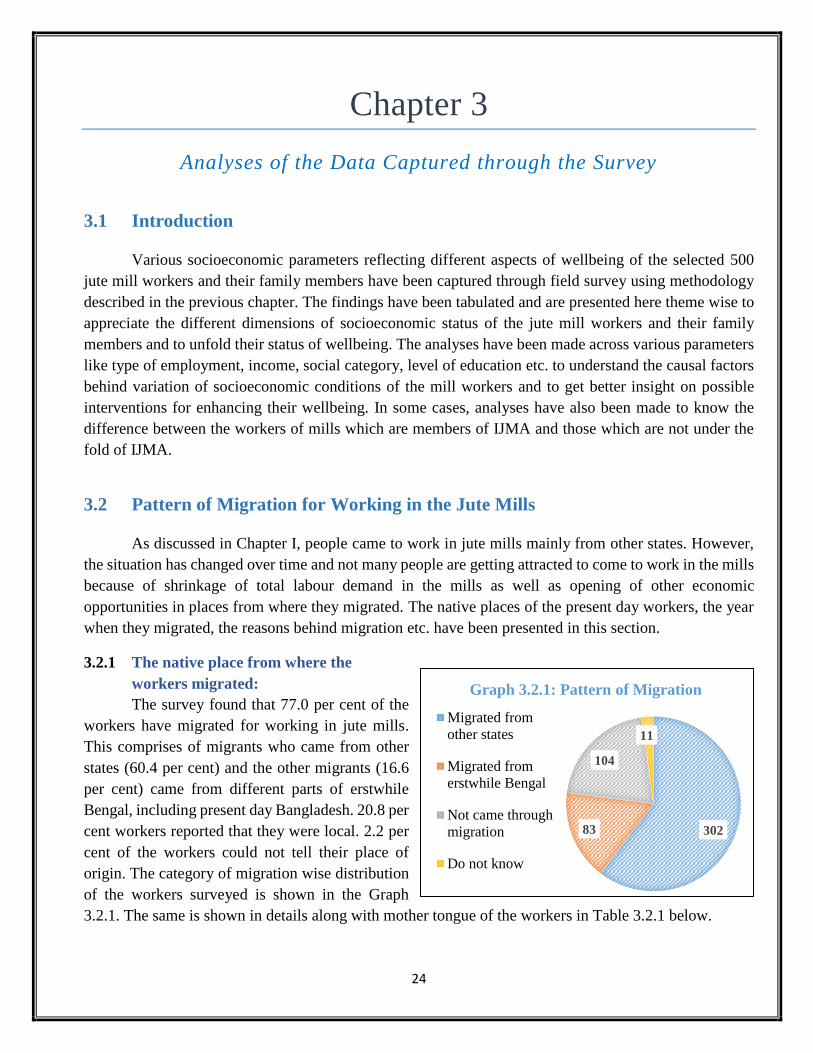
24
Chapter 3
Analyses of the Data Captured through the Survey
3.1 Introduction
Various socioeconomic parameters reflecting different aspects of wellbeing of the selected 500
jute mill workers and their family members have been captured through field survey using methodology
described in the previous chapter. The findings have been tabulated and are presented here theme wise to
appreciate the different dimensions of socioeconomic status of the jute mill workers and their family
members and to unfold their status of wellbeing. The analyses have been made across various parameters
like type of employment, income, social category, level of education etc. to understand the causal factors
behind variation of socioeconomic conditions of the mill workers and to get better insight on possible
interventions for enhancing their wellbeing. In some cases, analyses have also been made to know the
difference between the workers of mills which are members of IJMA and those which are not under the
fold of IJMA.
3.2 Pattern of Migration for Working in the Jute Mills
As discussed in Chapter I, people came to work in jute mills mainly from other states. However,
the situation has changed over time and not many people are getting attracted to come to work in the mills
because of shrinkage of total labour demand in the mills as well as opening of other economic
opportunities in places from where they migrated. The native places of the present day workers, the year
when they migrated, the reasons behind migration etc. have been presented in this section.
3.2.1 The native place from where the
workers migrated:
The survey found that 77.0 per cent of the
workers have migrated for working in jute mills.
This comprises of migrants who came from other
states (60.4 per cent) and the other migrants (16.6
per cent) came from different parts of erstwhile
Bengal, including present day Bangladesh. 20.8 per
cent workers reported that they were local. 2.2 per
cent of the workers could not tell their place of
origin. The category of migration wise distribution
of the workers surveyed is shown in the Graph
3.2.1. The same is shown in details along with mother tongue of the workers in Table 3.2.1 below.
30283
104
11
Graph 3.2.1: Pattern of Migration
Migrated from
other states
Migrated from
erstwhile Bengal
Not came through
migration
Do not know
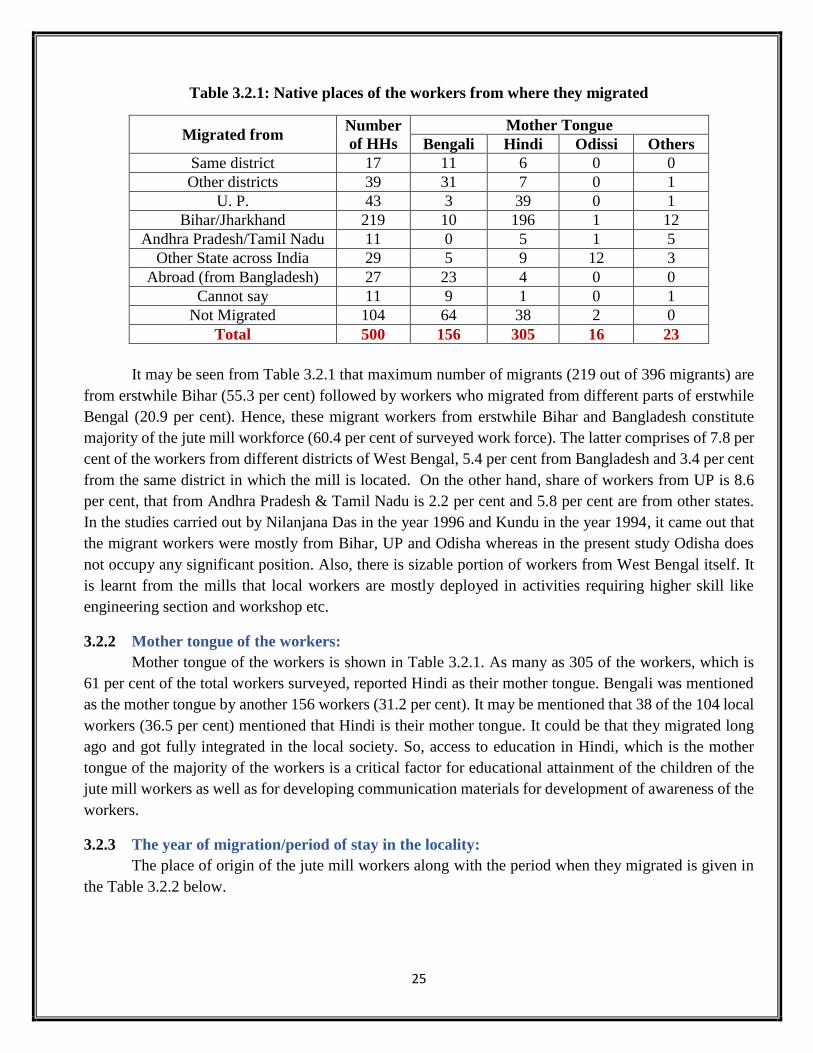
25
Table 3.2.1: Native places of the workers from where they migrated
Migrated from Number
of HHs
Mother Tongue
Bengali Hindi Odissi Others
Same district 17 11 6 0 0
Other districts 39 31 7 0 1
U. P. 43 3 39 0 1
Bihar/Jharkhand 219 10 196 1 12
Andhra Pradesh/Tamil Nadu 11 0 5 1 5
Other State across India 29 5 9 12 3
Abroad (from Bangladesh) 27 23 4 0 0
Cannot say 11 9 1 0 1
Not Migrated 104 64 38 2 0
Total 500 156 305 16 23
It may be seen from Table 3.2.1 that maximum number of migrants (219 out of 396 migrants) are
from erstwhile Bihar (55.3 per cent) followed by workers who migrated from different parts of erstwhile
Bengal (20.9 per cent). Hence, these migrant workers from erstwhile Bihar and Bangladesh constitute
majority of the jute mill workforce (60.4 per cent of surveyed work force). The latter comprises of 7.8 per
cent of the workers from different districts of West Bengal, 5.4 per cent from Bangladesh and 3.4 per cent
from the same district in which the mill is located. On the other hand, share of workers from UP is 8.6
per cent, that from Andhra Pradesh & Tamil Nadu is 2.2 per cent and 5.8 per cent are from other states.
In the studies carried out by Nilanjana Das in the year 1996 and Kundu in the year 1994, it came out that
the migrant workers were mostly from Bihar, UP and Odisha whereas in the present study Odisha does
not occupy any significant position. Also, there is sizable portion of workers from West Bengal itself. It
is learnt from the mills that local workers are mostly deployed in activities requiring higher skill like
engineering section and workshop etc.
3.2.2 Mother tongue of the workers:
Mother tongue of the workers is shown in Table 3.2.1. As many as 305 of the workers, which is
61 per cent of the total workers surveyed, reported Hindi as their mother tongue. Bengali was mentioned
as the mother tongue by another 156 workers (31.2 per cent). It may be mentioned that 38 of the 104 local
workers (36.5 per cent) mentioned that Hindi is their mother tongue. It could be that they migrated long
ago and got fully integrated in the local society. So, access to education in Hindi, which is the mother
tongue of the majority of the workers is a critical factor for educational attainment of the children of the
jute mill workers as well as for developing communication materials for development of awareness of the
workers.
3.2.3 The year of migration/period of stay in the locality:
The place of origin of the jute mill workers along with the period when they migrated is given in
the Table 3.2.2 below.
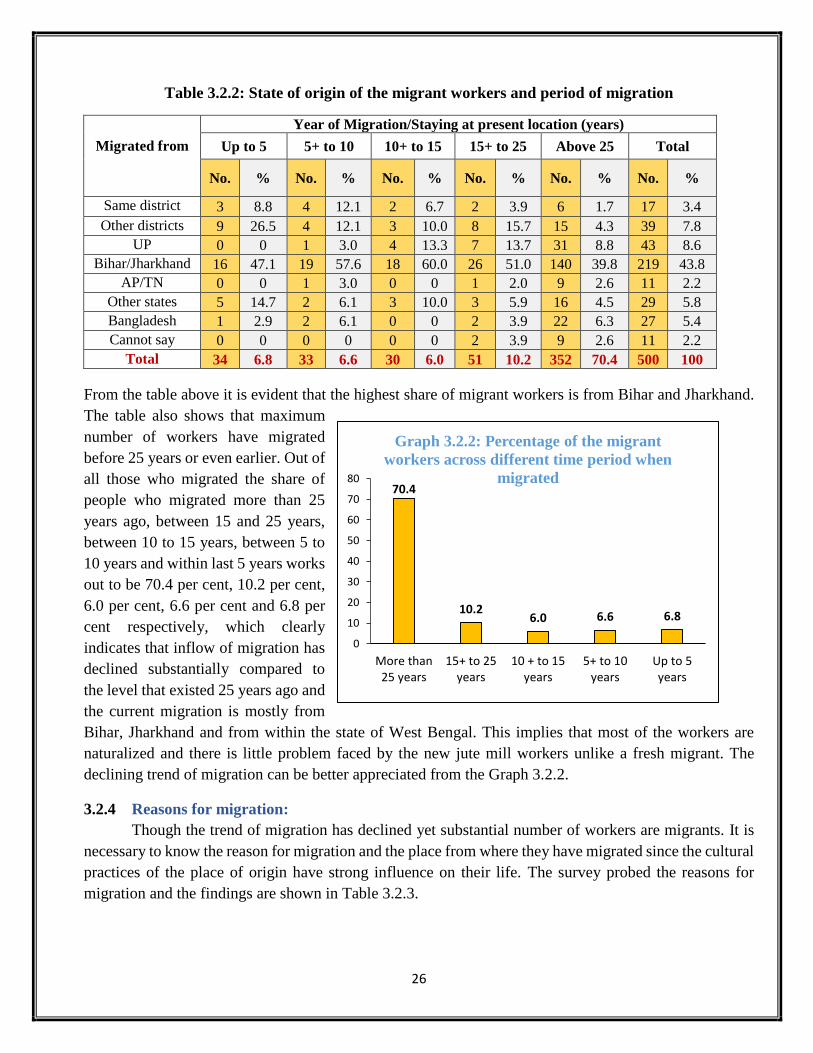
26
Table 3.2.2: State of origin of the migrant workers and period of migration
Migrated from
Year of Migration/Staying at present location (years)
Up to 5 5+ to 10 10+ to 15 15+ to 25 Above 25 Total
No. % No. % No. % No. % No. % No. %
Same district 3 8.8 4 12.1 2 6.7 2 3.9 6 1.7 17 3.4
Other districts 9 26.5 4 12.1 3 10.0 8 15.7 15 4.3 39 7.8
UP 0 0 1 3.0 4 13.3 7 13.7 31 8.8 43 8.6
Bihar/Jharkhand 16 47.1 19 57.6 18 60.0 26 51.0 140 39.8 219 43.8
AP/TN 0 0 1 3.0 0 0 1 2.0 9 2.6 11 2.2
Other states 5 14.7 2 6.1 3 10.0 3 5.9 16 4.5 29 5.8
Bangladesh 1 2.9 2 6.1 0 0 2 3.9 22 6.3 27 5.4
Cannot say 0 0 0 0 0 0 2 3.9 9 2.6 11 2.2
Total 34 6.8 33 6.6 30 6.0 51 10.2 352 70.4 500 100
From the table above it is evident that the highest share of migrant workers is from Bihar and Jharkhand.
The table also shows that maximum
number of workers have migrated
before 25 years or even earlier. Out of
all those who migrated the share of
people who migrated more than 25
years ago, between 15 and 25 years,
between 10 to 15 years, between 5 to
10 years and within last 5 years works
out to be 70.4 per cent, 10.2 per cent,
6.0 per cent, 6.6 per cent and 6.8 per
cent respectively, which clearly
indicates that inflow of migration has
declined substantially compared to
the level that existed 25 years ago and
the current migration is mostly from
Bihar, Jharkhand and from within the state of West Bengal. This implies that most of the workers are
naturalized and there is little problem faced by the new jute mill workers unlike a fresh migrant. The
declining trend of migration can be better appreciated from the Graph 3.2.2.
3.2.4 Reasons for migration:
Though the trend of migration has declined yet substantial number of workers are migrants. It is
necessary to know the reason for migration and the place from where they have migrated since the cultural
practices of the place of origin have strong influence on their life. The survey probed the reasons for
migration and the findings are shown in Table 3.2.3.
70.4
10.26.0 6.6 6.8
0
10
20
30
40
50
60
70
80
More than25 years
15+ to 25years
10 + to 15years
5+ to 10years
Up to 5years
Graph 3.2.2: Percentage of the migrant
workers across different time period when
migrated
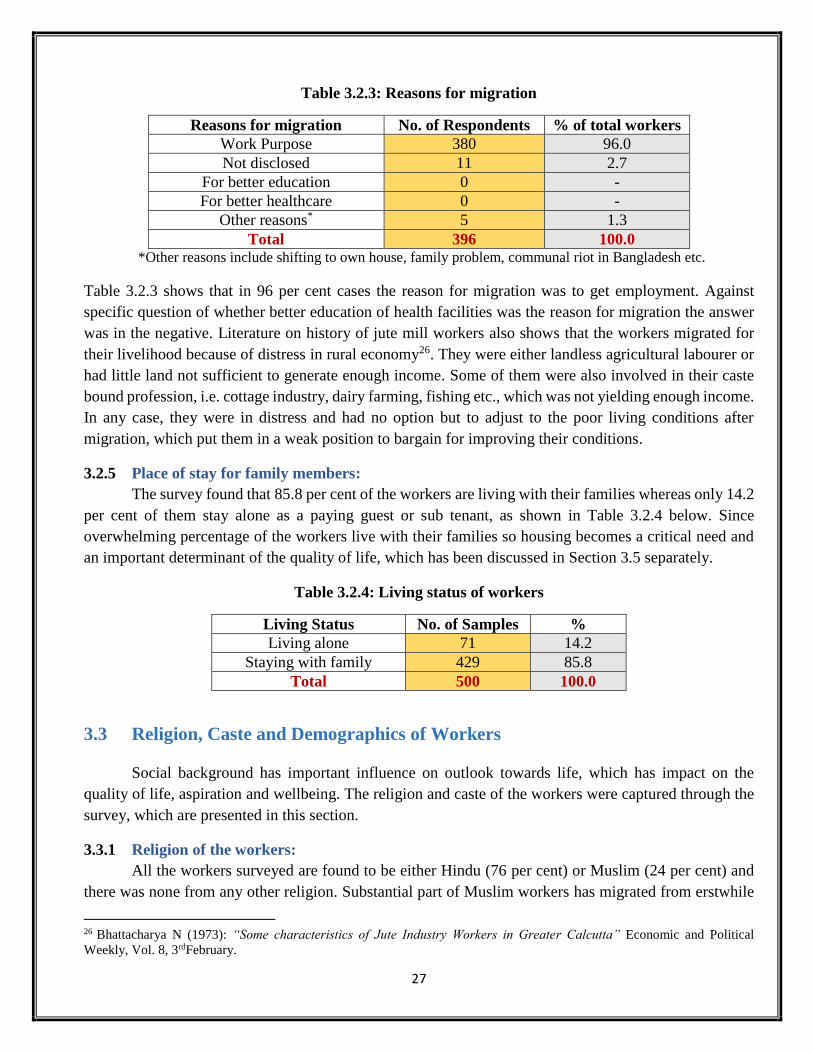
27
Table 3.2.3: Reasons for migration
Reasons for migration No. of Respondents % of total workers
Work Purpose 380 96.0
Not disclosed 11 2.7
For better education 0 -
For better healthcare 0 -
Other reasons* 5 1.3
Total 396 100.0 *Other reasons include shifting to own house, family problem, communal riot in Bangladesh etc.
Table 3.2.3 shows that in 96 per cent cases the reason for migration was to get employment. Against
specific question of whether better education of health facilities was the reason for migration the answer
was in the negative. Literature on history of jute mill workers also shows that the workers migrated for
their livelihood because of distress in rural economy26. They were either landless agricultural labourer or
had little land not sufficient to generate enough income. Some of them were also involved in their caste
bound profession, i.e. cottage industry, dairy farming, fishing etc., which was not yielding enough income.
In any case, they were in distress and had no option but to adjust to the poor living conditions after
migration, which put them in a weak position to bargain for improving their conditions.
3.2.5 Place of stay for family members:
The survey found that 85.8 per cent of the workers are living with their families whereas only 14.2
per cent of them stay alone as a paying guest or sub tenant, as shown in Table 3.2.4 below. Since
overwhelming percentage of the workers live with their families so housing becomes a critical need and
an important determinant of the quality of life, which has been discussed in Section 3.5 separately.
Table 3.2.4: Living status of workers
Living Status No. of Samples %
Living alone 71 14.2
Staying with family 429 85.8
Total 500 100.0
3.3 Religion, Caste and Demographics of Workers
Social background has important influence on outlook towards life, which has impact on the
quality of life, aspiration and wellbeing. The religion and caste of the workers were captured through the
survey, which are presented in this section.
3.3.1 Religion of the workers:
All the workers surveyed are found to be either Hindu (76 per cent) or Muslim (24 per cent) and
there was none from any other religion. Substantial part of Muslim workers has migrated from erstwhile
26 Bhattacharya N (1973): “Some characteristics of Jute Industry Workers in Greater Calcutta” Economic and Political
Weekly, Vol. 8, 3rdFebruary.
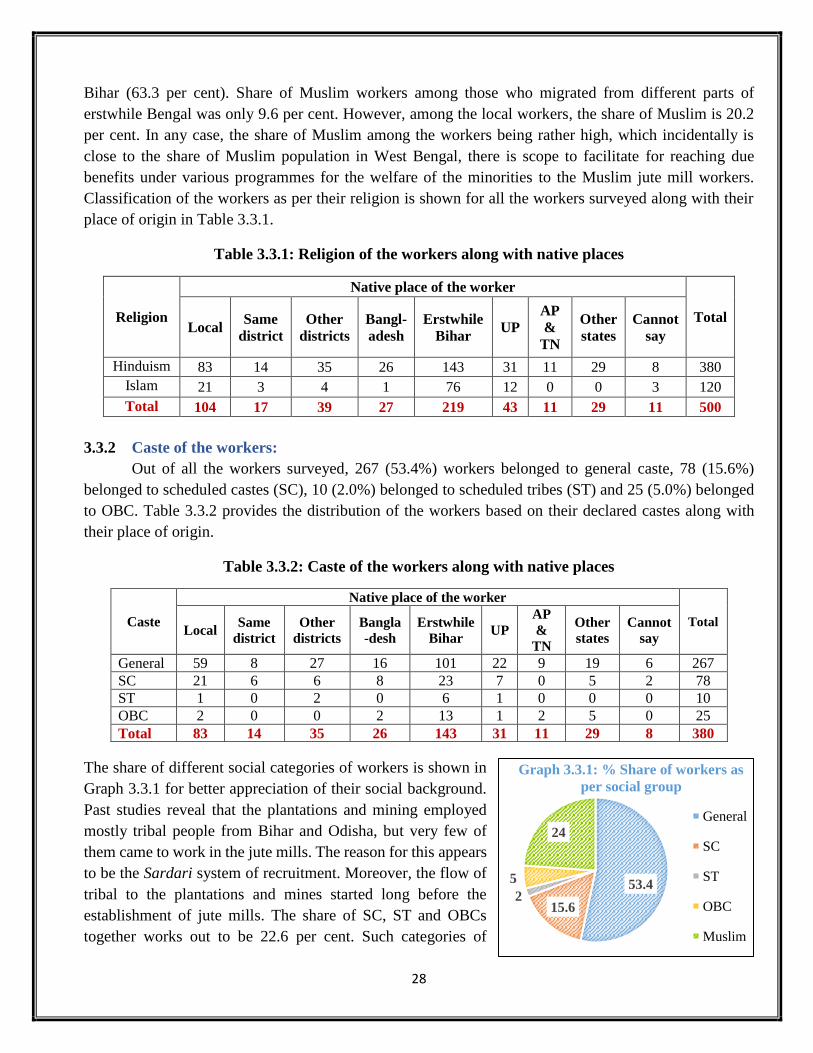
28
Bihar (63.3 per cent). Share of Muslim workers among those who migrated from different parts of
erstwhile Bengal was only 9.6 per cent. However, among the local workers, the share of Muslim is 20.2
per cent. In any case, the share of Muslim among the workers being rather high, which incidentally is
close to the share of Muslim population in West Bengal, there is scope to facilitate for reaching due
benefits under various programmes for the welfare of the minorities to the Muslim jute mill workers.
Classification of the workers as per their religion is shown for all the workers surveyed along with their
place of origin in Table 3.3.1.
Table 3.3.1: Religion of the workers along with native places
Religion
Native place of the worker
Total Local
Same
district
Other
districts
Bangl-
adesh
Erstwhile
Bihar UP
AP
&
TN
Other
states
Cannot
say
Hinduism 83 14 35 26 143 31 11 29 8 380
Islam 21 3 4 1 76 12 0 0 3 120
Total 104 17 39 27 219 43 11 29 11 500
3.3.2 Caste of the workers:
Out of all the workers surveyed, 267 (53.4%) workers belonged to general caste, 78 (15.6%)
belonged to scheduled castes (SC), 10 (2.0%) belonged to scheduled tribes (ST) and 25 (5.0%) belonged
to OBC. Table 3.3.2 provides the distribution of the workers based on their declared castes along with
their place of origin.
Table 3.3.2: Caste of the workers along with native places
Caste
Native place of the worker
Total Local
Same
district
Other
districts
Bangla
-desh
Erstwhile
Bihar UP
AP
&
TN
Other
states
Cannot
say
General 59 8 27 16 101 22 9 19 6 267
SC 21 6 6 8 23 7 0 5 2 78
ST 1 0 2 0 6 1 0 0 0 10
OBC 2 0 0 2 13 1 2 5 0 25
Total 83 14 35 26 143 31 11 29 8 380
The share of different social categories of workers is shown in
Graph 3.3.1 for better appreciation of their social background.
Past studies reveal that the plantations and mining employed
mostly tribal people from Bihar and Odisha, but very few of
them came to work in the jute mills. The reason for this appears
to be the Sardari system of recruitment. Moreover, the flow of
tribal to the plantations and mines started long before the
establishment of jute mills. The share of SC, ST and OBCs
together works out to be 22.6 per cent. Such categories of
53.4
15.62
5
24
General
SC
ST
OBC
Muslim
Graph 3.3.1: % Share of workers as
per social group
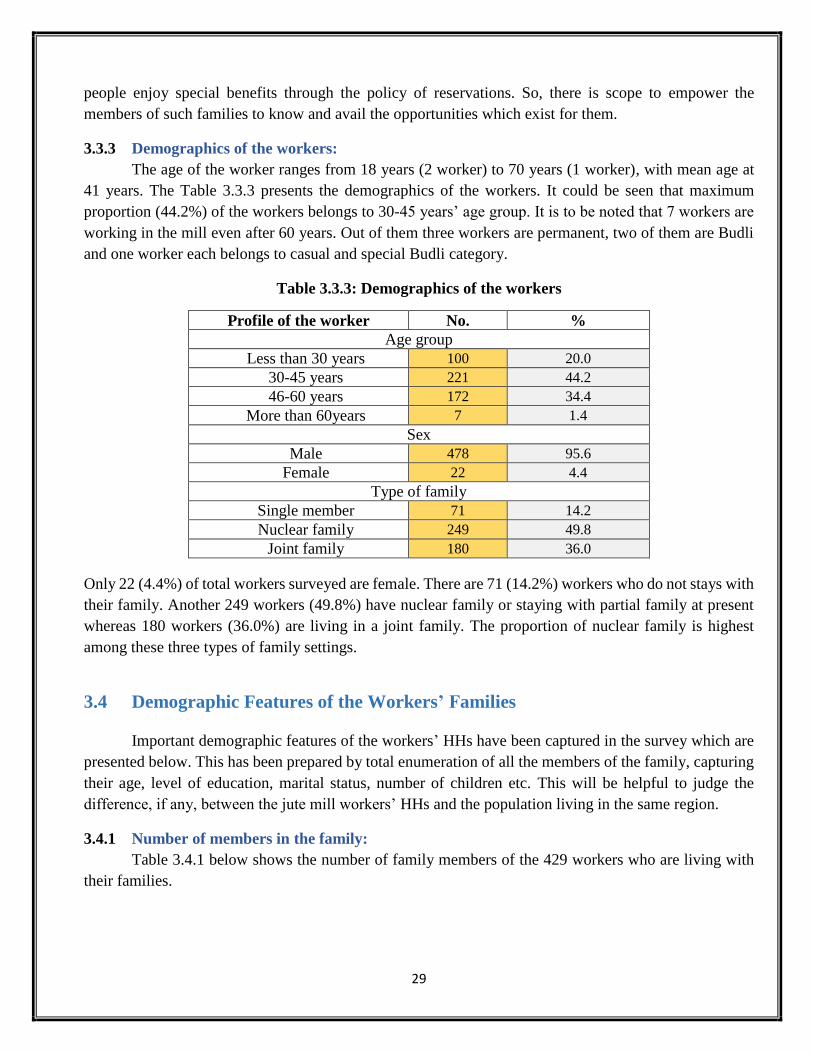
29
people enjoy special benefits through the policy of reservations. So, there is scope to empower the
members of such families to know and avail the opportunities which exist for them.
3.3.3 Demographics of the workers:
The age of the worker ranges from 18 years (2 worker) to 70 years (1 worker), with mean age at
41 years. The Table 3.3.3 presents the demographics of the workers. It could be seen that maximum
proportion (44.2%) of the workers belongs to 30-45 years’ age group. It is to be noted that 7 workers are
working in the mill even after 60 years. Out of them three workers are permanent, two of them are Budli
and one worker each belongs to casual and special Budli category.
Table 3.3.3: Demographics of the workers
Profile of the worker No. %
Age group
Less than 30 years 100 20.0
30-45 years 221 44.2
46-60 years 172 34.4
More than 60years 7 1.4
Sex
Male 478 95.6
Female 22 4.4
Type of family
Single member 71 14.2
Nuclear family 249 49.8
Joint family 180 36.0
Only 22 (4.4%) of total workers surveyed are female. There are 71 (14.2%) workers who do not stays with
their family. Another 249 workers (49.8%) have nuclear family or staying with partial family at present
whereas 180 workers (36.0%) are living in a joint family. The proportion of nuclear family is highest
among these three types of family settings.
3.4 Demographic Features of the Workers’ Families
Important demographic features of the workers’ HHs have been captured in the survey which are
presented below. This has been prepared by total enumeration of all the members of the family, capturing
their age, level of education, marital status, number of children etc. This will be helpful to judge the
difference, if any, between the jute mill workers’ HHs and the population living in the same region.
3.4.1 Number of members in the family:
Table 3.4.1 below shows the number of family members of the 429 workers who are living with
their families.
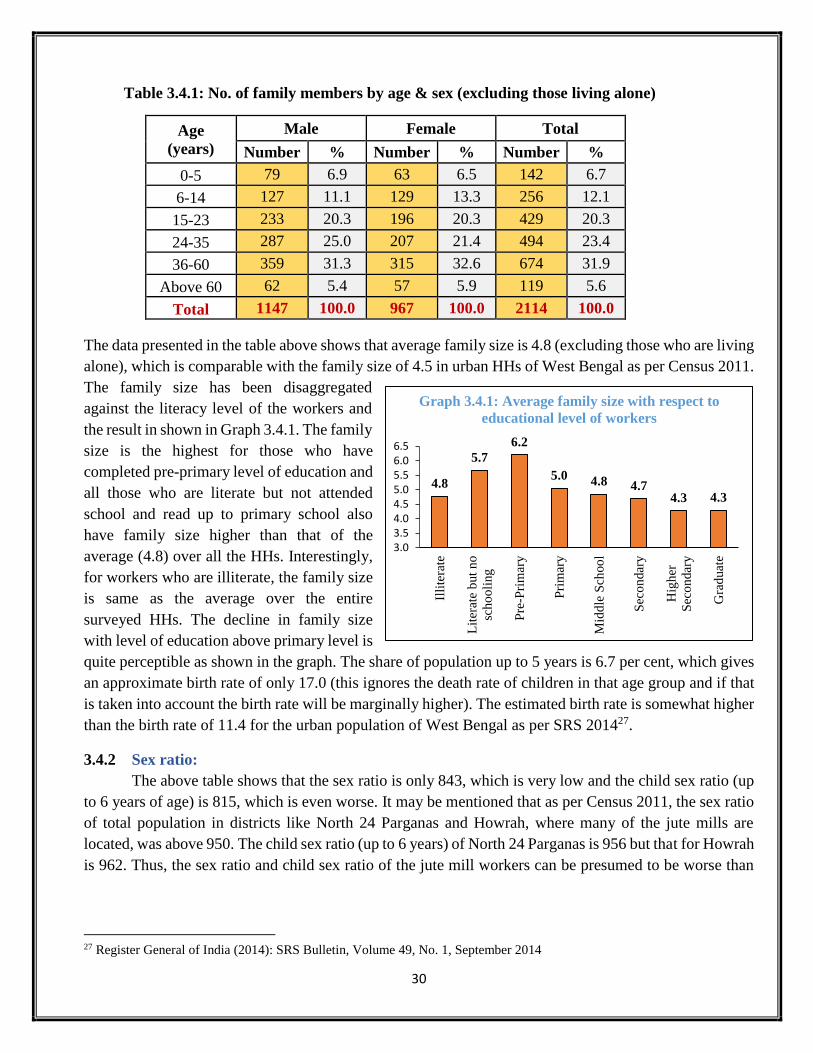
30
Table 3.4.1: No. of family members by age & sex (excluding those living alone)
Age
(years)
Male Female Total
Number % Number % Number %
0-5 79 6.9 63 6.5 142 6.7
6-14 127 11.1 129 13.3 256 12.1
15-23 233 20.3 196 20.3 429 20.3
24-35 287 25.0 207 21.4 494 23.4
36-60 359 31.3 315 32.6 674 31.9
Above 60 62 5.4 57 5.9 119 5.6
Total 1147 100.0 967 100.0 2114 100.0
The data presented in the table above shows that average family size is 4.8 (excluding those who are living
alone), which is comparable with the family size of 4.5 in urban HHs of West Bengal as per Census 2011.
The family size has been disaggregated
against the literacy level of the workers and
the result in shown in Graph 3.4.1. The family
size is the highest for those who have
completed pre-primary level of education and
all those who are literate but not attended
school and read up to primary school also
have family size higher than that of the
average (4.8) over all the HHs. Interestingly,
for workers who are illiterate, the family size
is same as the average over the entire
surveyed HHs. The decline in family size
with level of education above primary level is
quite perceptible as shown in the graph. The share of population up to 5 years is 6.7 per cent, which gives
an approximate birth rate of only 17.0 (this ignores the death rate of children in that age group and if that
is taken into account the birth rate will be marginally higher). The estimated birth rate is somewhat higher
than the birth rate of 11.4 for the urban population of West Bengal as per SRS 201427.
3.4.2 Sex ratio:
The above table shows that the sex ratio is only 843, which is very low and the child sex ratio (up
to 6 years of age) is 815, which is even worse. It may be mentioned that as per Census 2011, the sex ratio
of total population in districts like North 24 Parganas and Howrah, where many of the jute mills are
located, was above 950. The child sex ratio (up to 6 years) of North 24 Parganas is 956 but that for Howrah
is 962. Thus, the sex ratio and child sex ratio of the jute mill workers can be presumed to be worse than
27 Register General of India (2014): SRS Bulletin, Volume 49, No. 1, September 2014
4.8
5.7
6.2
5.0 4.8 4.74.3 4.3
3.03.54.04.55.05.56.06.5
Illi
tera
te
Lit
erat
e b
ut
no
sch
ooli
ng
Pre
-Pri
mar
y
Pri
mar
y
Mid
dle
Sch
oo
l
Sec
on
dar
y
Hig
her
Sec
on
dar
y
Gra
duat
e
Graph 3.4.1: Average family size with respect to
educational level of workers
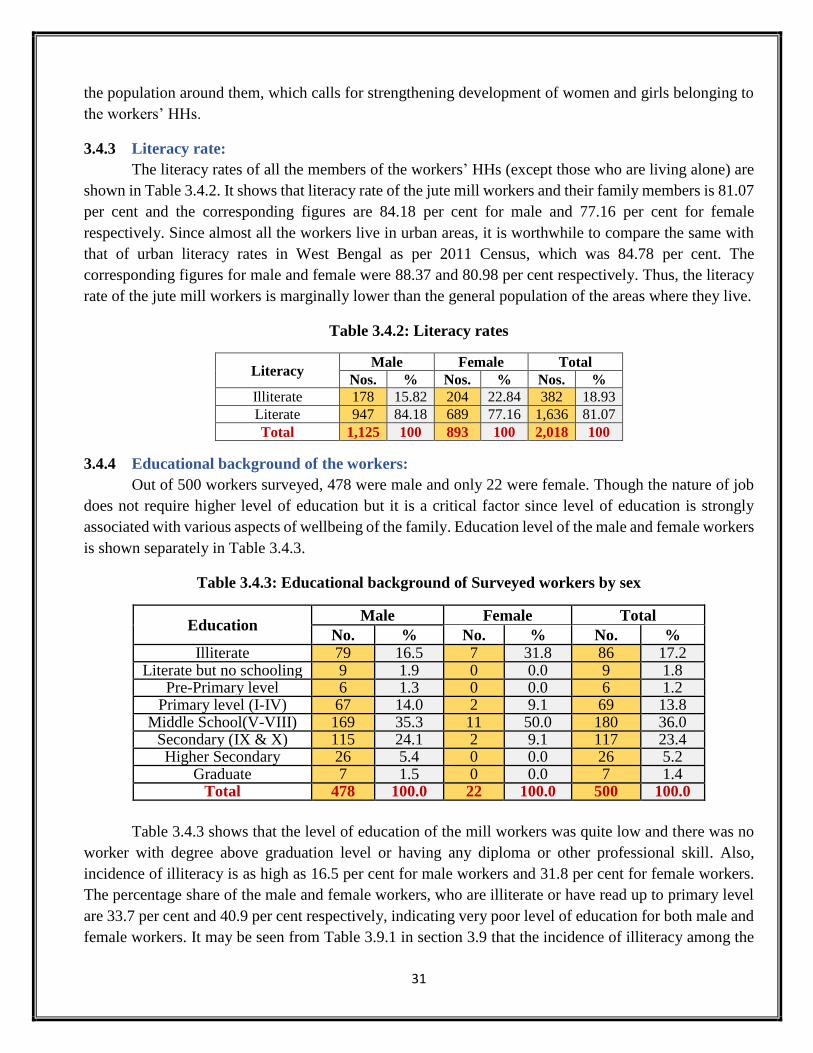
31
the population around them, which calls for strengthening development of women and girls belonging to
the workers’ HHs.
3.4.3 Literacy rate:
The literacy rates of all the members of the workers’ HHs (except those who are living alone) are
shown in Table 3.4.2. It shows that literacy rate of the jute mill workers and their family members is 81.07
per cent and the corresponding figures are 84.18 per cent for male and 77.16 per cent for female
respectively. Since almost all the workers live in urban areas, it is worthwhile to compare the same with
that of urban literacy rates in West Bengal as per 2011 Census, which was 84.78 per cent. The
corresponding figures for male and female were 88.37 and 80.98 per cent respectively. Thus, the literacy
rate of the jute mill workers is marginally lower than the general population of the areas where they live.
Table 3.4.2: Literacy rates
Literacy Male Female Total
Nos. % Nos. % Nos. %
Illiterate 178 15.82 204 22.84 382 18.93
Literate 947 84.18 689 77.16 1,636 81.07
Total 1,125 100 893 100 2,018 100
3.4.4 Educational background of the workers:
Out of 500 workers surveyed, 478 were male and only 22 were female. Though the nature of job
does not require higher level of education but it is a critical factor since level of education is strongly
associated with various aspects of wellbeing of the family. Education level of the male and female workers
is shown separately in Table 3.4.3.
Table 3.4.3: Educational background of Surveyed workers by sex
Education Male Female Total
No. % No. % No. % Illiterate 79 16.5 7 31.8 86 17.2
Literate but no schooling 9 1.9 0 0.0 9 1.8 Pre-Primary level 6 1.3 0 0.0 6 1.2
Primary level (I-IV) 67 14.0 2 9.1 69 13.8 Middle School(V-VIII) 169 35.3 11 50.0 180 36.0
Secondary (IX & X) 115 24.1 2 9.1 117 23.4 Higher Secondary 26 5.4 0 0.0 26 5.2
Graduate 7 1.5 0 0.0 7 1.4 Total 478 100.0 22 100.0 500 100.0
Table 3.4.3 shows that the level of education of the mill workers was quite low and there was no
worker with degree above graduation level or having any diploma or other professional skill. Also,
incidence of illiteracy is as high as 16.5 per cent for male workers and 31.8 per cent for female workers.
The percentage share of the male and female workers, who are illiterate or have read up to primary level
are 33.7 per cent and 40.9 per cent respectively, indicating very poor level of education for both male and
female workers. It may be seen from Table 3.9.1 in section 3.9 that the incidence of illiteracy among the
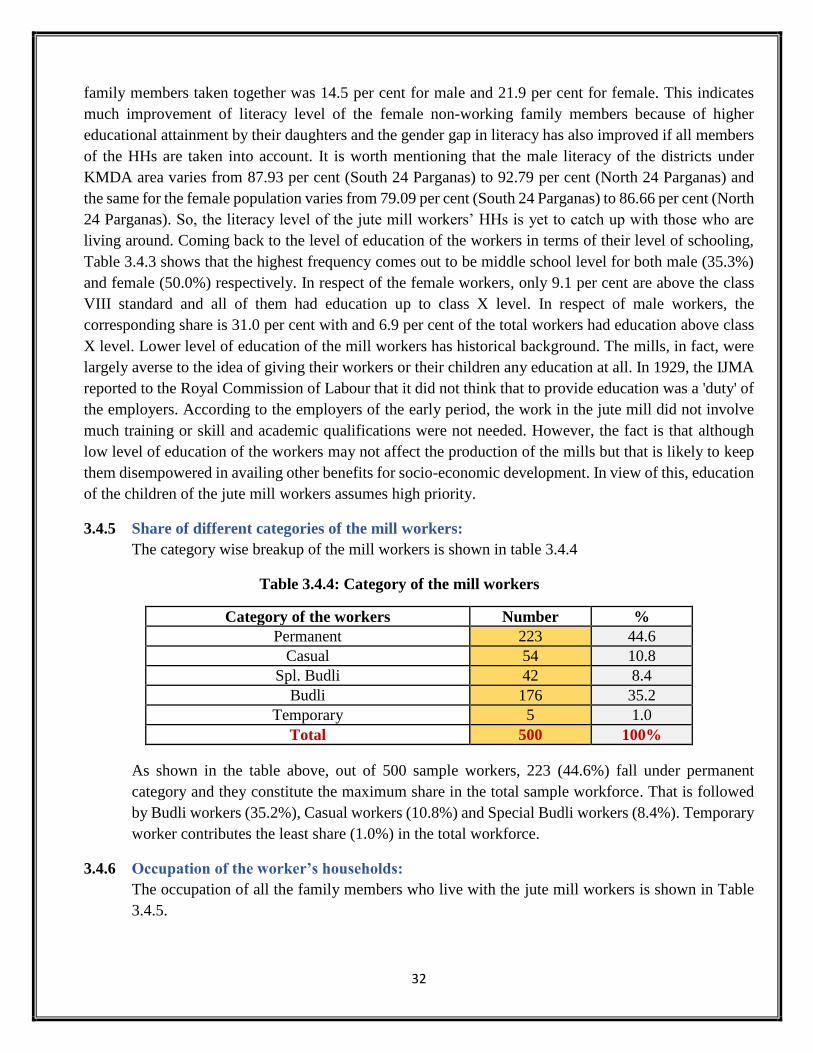
32
family members taken together was 14.5 per cent for male and 21.9 per cent for female. This indicates
much improvement of literacy level of the female non-working family members because of higher
educational attainment by their daughters and the gender gap in literacy has also improved if all members
of the HHs are taken into account. It is worth mentioning that the male literacy of the districts under
KMDA area varies from 87.93 per cent (South 24 Parganas) to 92.79 per cent (North 24 Parganas) and
the same for the female population varies from 79.09 per cent (South 24 Parganas) to 86.66 per cent (North
24 Parganas). So, the literacy level of the jute mill workers’ HHs is yet to catch up with those who are
living around. Coming back to the level of education of the workers in terms of their level of schooling,
Table 3.4.3 shows that the highest frequency comes out to be middle school level for both male (35.3%)
and female (50.0%) respectively. In respect of the female workers, only 9.1 per cent are above the class
VIII standard and all of them had education up to class X level. In respect of male workers, the
corresponding share is 31.0 per cent with and 6.9 per cent of the total workers had education above class
X level. Lower level of education of the mill workers has historical background. The mills, in fact, were
largely averse to the idea of giving their workers or their children any education at all. In 1929, the IJMA
reported to the Royal Commission of Labour that it did not think that to provide education was a 'duty' of
the employers. According to the employers of the early period, the work in the jute mill did not involve
much training or skill and academic qualifications were not needed. However, the fact is that although
low level of education of the workers may not affect the production of the mills but that is likely to keep
them disempowered in availing other benefits for socio-economic development. In view of this, education
of the children of the jute mill workers assumes high priority.
3.4.5 Share of different categories of the mill workers:
The category wise breakup of the mill workers is shown in table 3.4.4
Table 3.4.4: Category of the mill workers
Category of the workers Number %
Permanent 223 44.6
Casual 54 10.8
Spl. Budli 42 8.4
Budli 176 35.2
Temporary 5 1.0
Total 500 100%
As shown in the table above, out of 500 sample workers, 223 (44.6%) fall under permanent
category and they constitute the maximum share in the total sample workforce. That is followed
by Budli workers (35.2%), Casual workers (10.8%) and Special Budli workers (8.4%). Temporary
worker contributes the least share (1.0%) in the total workforce.
3.4.6 Occupation of the worker’s households:
The occupation of all the family members who live with the jute mill workers is shown in Table
3.4.5.
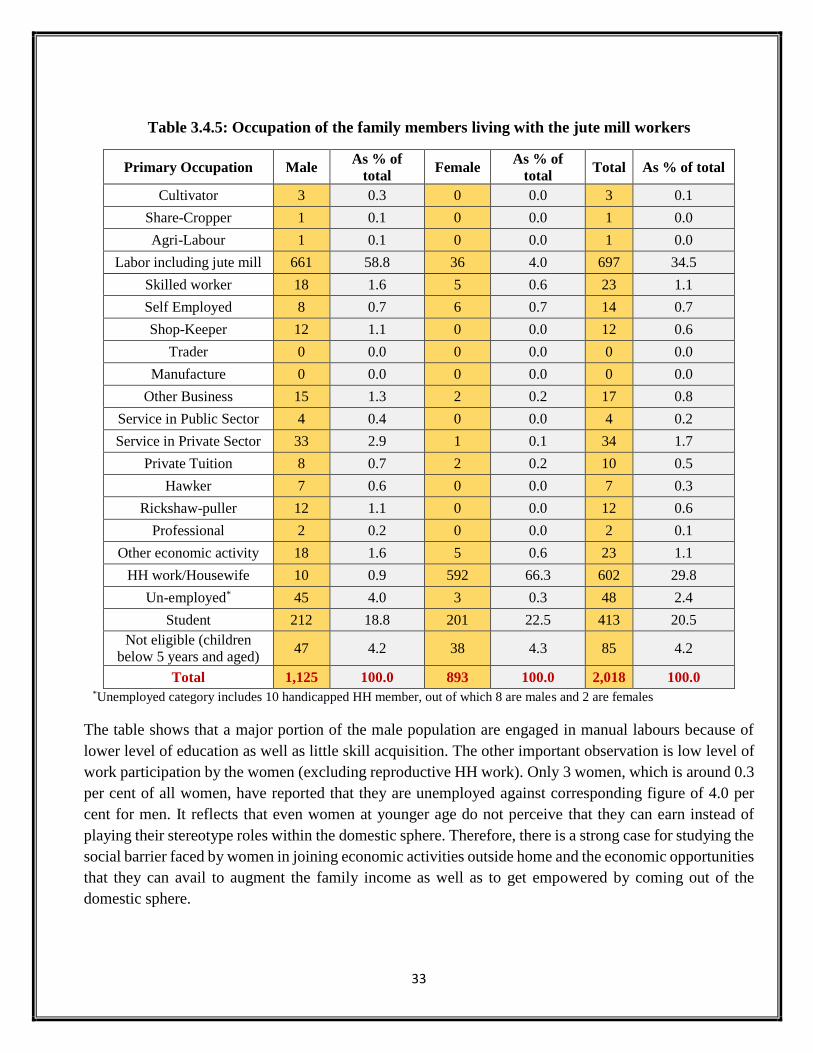
33
Table 3.4.5: Occupation of the family members living with the jute mill workers
Primary Occupation Male As % of
total Female
As % of
total Total As % of total
Cultivator 3 0.3 0 0.0 3 0.1
Share-Cropper 1 0.1 0 0.0 1 0.0
Agri-Labour 1 0.1 0 0.0 1 0.0
Labor including jute mill 661 58.8 36 4.0 697 34.5
Skilled worker 18 1.6 5 0.6 23 1.1
Self Employed 8 0.7 6 0.7 14 0.7
Shop-Keeper 12 1.1 0 0.0 12 0.6
Trader 0 0.0 0 0.0 0 0.0
Manufacture 0 0.0 0 0.0 0 0.0
Other Business 15 1.3 2 0.2 17 0.8
Service in Public Sector 4 0.4 0 0.0 4 0.2
Service in Private Sector 33 2.9 1 0.1 34 1.7
Private Tuition 8 0.7 2 0.2 10 0.5
Hawker 7 0.6 0 0.0 7 0.3
Rickshaw-puller 12 1.1 0 0.0 12 0.6
Professional 2 0.2 0 0.0 2 0.1
Other economic activity 18 1.6 5 0.6 23 1.1
HH work/Housewife 10 0.9 592 66.3 602 29.8
Un-employed* 45 4.0 3 0.3 48 2.4
Student 212 18.8 201 22.5 413 20.5
Not eligible (children
below 5 years and aged) 47 4.2 38 4.3 85 4.2
Total 1,125 100.0 893 100.0 2,018 100.0 *Unemployed category includes 10 handicapped HH member, out of which 8 are males and 2 are females
The table shows that a major portion of the male population are engaged in manual labours because of
lower level of education as well as little skill acquisition. The other important observation is low level of
work participation by the women (excluding reproductive HH work). Only 3 women, which is around 0.3
per cent of all women, have reported that they are unemployed against corresponding figure of 4.0 per
cent for men. It reflects that even women at younger age do not perceive that they can earn instead of
playing their stereotype roles within the domestic sphere. Therefore, there is a strong case for studying the
social barrier faced by women in joining economic activities outside home and the economic opportunities
that they can avail to augment the family income as well as to get empowered by coming out of the
domestic sphere.

34
3.4.7 Marital Status of the workers:
The marital status of the workers is shown in Table 3.4.6 and it shows that 84.8% of them are
married. The age at marriage is shown in Table 3.4.7.
Table 3.4.6: Marital status of Sample Workers Table 3.4.7: Age at marriage
84.8% of the surveyed workers were married. Age of marriage
varies from 12 years (by one female worker) to 43 years (by
one male worker). Mean age of marriage is estimated as 25.6 years for male workers while 18.3 years for
female workers. 15 workers (14 females and 1 male worker) had been married before 18 years (3.5%) at
which marriage is illegal for both boys and girls. Moreover, 55 workers (13.0%) are married within 18 to
20 years of age. 21 years being the legal year of marriage for boys, 49 male workers are married before
21 years. Majority of workers (39.9%) are married within 21 to 25 year of age.
3.4.8 Number of children:
Number of children in the surveyed families across different age groups is shown in Table 3.4.8.
There were 569 children (up to 18 years) in 292 HHs and number of children per HH works out to be 1.9.
Number of living children in each HH is shown in Table 3.4.9. It shows that a larger proportion of the
workers had one (32.0%) or two living children (23.4%). Around 10 % of the workers had 4 or more living
children.
Table 3.4.8: Number of children (up to 18 years) in the surveyed families
Child Age No. of family
having children
No. of
Boys %
No. of
Girls %
Total
Children
0- below 2 years 37 24 63.2 14 36.8 38
2-5 years 84 55 52.9 49 47.1 104
6-14 years 169 127 49.6 129 50.4 256
15-18 years 137 87 50.9 84 49.1 171
Total 292* 293 51.5 276 48.5 569 *This is not the total of the corresponding rows since there is more than one child in many families.
Table 3.4.9: Number of living children in the worker’s household
Number of living children of the worker Number of families %
No child 114 22.8
1 child 160 32.0
2 children 117 23.4
3 children 58 11.6
4 children or more 51 10.2
Marital Status No. of sample workers As % of total
Married 424 84.8
Unmarried 76 15.2
Total 500 100.0
Age at marriage Number %
Less than 18 years 15 3.5
18-20 years 55 13.0
21-25 years 169 39.9
26-30 years 145 34.2
Above 30 years 40 9.4
Total 424 100
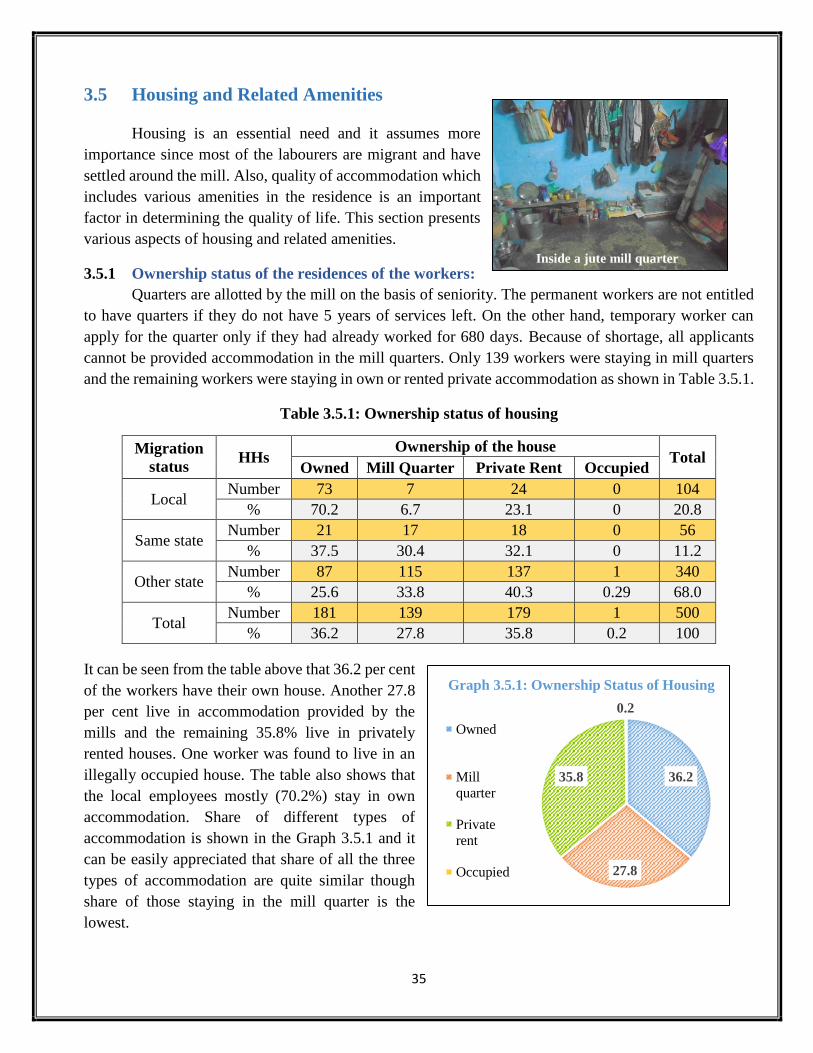
35
3.5 Housing and Related Amenities
Housing is an essential need and it assumes more
importance since most of the labourers are migrant and have
settled around the mill. Also, quality of accommodation which
includes various amenities in the residence is an important
factor in determining the quality of life. This section presents
various aspects of housing and related amenities.
3.5.1 Ownership status of the residences of the workers:
Quarters are allotted by the mill on the basis of seniority. The permanent workers are not entitled
to have quarters if they do not have 5 years of services left. On the other hand, temporary worker can
apply for the quarter only if they had already worked for 680 days. Because of shortage, all applicants
cannot be provided accommodation in the mill quarters. Only 139 workers were staying in mill quarters
and the remaining workers were staying in own or rented private accommodation as shown in Table 3.5.1.
Table 3.5.1: Ownership status of housing
Migration
status HHs
Ownership of the house Total
Owned Mill Quarter Private Rent Occupied
Local Number 73 7 24 0 104
% 70.2 6.7 23.1 0 20.8
Same state Number 21 17 18 0 56
% 37.5 30.4 32.1 0 11.2
Other state Number 87 115 137 1 340
% 25.6 33.8 40.3 0.29 68.0
Total Number 181 139 179 1 500
% 36.2 27.8 35.8 0.2 100
It can be seen from the table above that 36.2 per cent
of the workers have their own house. Another 27.8
per cent live in accommodation provided by the
mills and the remaining 35.8% live in privately
rented houses. One worker was found to live in an
illegally occupied house. The table also shows that
the local employees mostly (70.2%) stay in own
accommodation. Share of different types of
accommodation is shown in the Graph 3.5.1 and it
can be easily appreciated that share of all the three
types of accommodation are quite similar though
share of those staying in the mill quarter is the
lowest.
36.2
27.8
35.8
0.2
Owned
Mill
quarter
Private
rent
Occupied
Graph 3.5.1: Ownership Status of Housing
Inside a jute mill quarter

36
3.5.2 Types of accommodation of different categories of workers:
As shown in the table above, 35.8 per cent of the
workers live in rented private houses. In order to view if the
type of accommodation is related to the categories of
employment, the distribution of different types of
accommodation across different categories of employees is
shown in Table 3.5.2.
Table 3.5.2: Types of residence of different categories of workers
Shelter Type Total
Sample
Type of workers
Permanent Casual Budli/Sp.Budli Temporary
No. % No. % No. % No. %
Own 181 102 45.7 15 27.8 62 28.4 2 40.0
Mill Quarter 139 57 25.6 23 42.6 59 27.1 0 0.0
Private Rent 179 64 28.7 16 29.6 96 44.0 3 60.0
Others/shared 1 0 0 0 0 1 0.5 0 0.0
Total 500 223 100 54 100 218 100 5 100
It works out from Table 3.5.2 that out of those who own houses 56.4 per cent are permanent workers and
out of all the permanent workers 45.7 per cent have their own houses, which is much higher than the share
of Casual and Budli/Spl. Budli category of workers having own houses. Out of those 139 workers who
live in mill quarter, the highest share is of the Budli/Special Budli workers (42.5%) followed by the
Permanent workers (41.0%) and the Casual workers (16.5%). Table 3.5.3 shows the association of
residence type with the place of origin of the workers.
Table 3.5.3: Types of residence according to place of origin
Place of
origin
Ownership of the house Total
Owned Mill Quarter Private Rent Occupied
No. % No. % No. % No. % No. %
Local 73 70.2 7 6.7 24 23.1 0 0 104 100
West Bengal 21 37.5 17 30.4 18 32.1 0 0 56 100
Other states 87 25.6 115 33.8 137 40.3 1 0.3 340 100
Total 181 36.2 139 27.8 179 35.8 1 0.2 500 100
The table above shows that 70.2 per cent of the local employees stay in their own house. 37.5 per cent of
those who have migrated from within West Bengal also stay in their own houses. However, only 25.6%
workers who have migrated from other states have own houses. Most of them (40.3%) stay in rented
Quarter line of mill workers

37
house. In IJMA Mills 39.2% lives in mill quarters whereas in case of non-IJMA Mills only 16.4% lives in
the mill quarters.
3.5.3 Average number of rooms and amenities:
The quality of living is related to number of rooms in the house along with availability of certain
amenities like having separate kitchen, electricity, water supply, sanitary facilities etc. Access to water
and sanitation has been discussed later in sections 3.6 and 3.7 and the availability of other amenities are
shown across different types of accommodation in Table 3.5.4.
Table 3.5.4: Availability of some of the amenities
Indicators Owned Mill-quarter Private Rent Occupied Total
Total no. of HHs 181 139 179 1 500
Having separate kitchen No. % No. % No. % No. % No. %
85 47.0 11 7.9 25 14.0 0 0 121 24.2
Having Electricity* 176 97.2 136 98.0 169 94.4 1 100.0 482 96.4
Average No. of Rooms 2.2 1.1 1.3 1.0 1.5
*Only authorized connections have been considered
Average number of rooms for all the HHs taken together is 1.5 as shown in Table 3.5.4. However, for own
houses the average number of available rooms is 2.2, which is the highest among all the categories. The
corresponding figure is only 1.1 for those living in mill quarter and 1.3 for those living in rented
accommodation. Number of rooms available for all the respondents are shown in Table 3.5.5.
Table 3.5.5: Number of rooms
Nos. No. of HHs % of total HHs
1 347 69.5
2 114 22.8
3 22 4.4
4 11 2.2
More than 4 5 1.0
Total 499 100.0
Average No. of Room 1.5
*One worker lives in a room on a sharing basis.
It shows that as high as 69.5 per cent HHs live only in one room and another 22.8 per cent live in two
rooms. As per 2011 Census, 41.7 per cent of the urban HHs in West Bengal were living in a single room
and another 31.7 per cent were living in two rooms. Therefore, the housing facilities for the jute mill
workers are much adverse compared to the urban HHs in general of the state. This is because the quarters
in the mill has generally only one room and those who live in rented accommodation may find it difficult
to hire more than one room for leading a better life. So, improvement of the quality of the workers’ quarters
and augmenting the number of houses available is a much required intervention.

38
3.5.4 Availability of separate kitchen:
Table 3.5.4 also shows that only 24.2 per cent of the HHs have separate kitchen on an average.
That is quite low compared to the Census 2011 finding
that 65 per cent of urban HHs in West Bengal had
separate kitchen. In this case also, the best scenario is
that of the households living in their own houses. 47
per cent of such households have separate kitchens.
The worst is for those who live in the mill quarters, in
which case only 7.9 per cent have kitchens. Thus, the
mill
quarters
have the
poorest
amenities
in terms of both number of rooms and availability of kitchens.
Such quarters are generally of a single room of about 90 to
120 square feet with a small veranda (around 30 to 35 square
feet), which is also used for cooking28 . In many quarters
visited by the study team, the workers have used the vacant
space outside, where available, to expand their kitchen. So,
the accommodation is not satisfactory, particularly when the family size is 4.8 on average.
3.5.5 Availability of electricity:
Table 3.5.4 shows that electricity is generally available for all categories of residences barring a
few HHs. At an aggregated level, 96.4 per cent HHs have
authorized electric connection and 3.2 per cent do not have such
connection. Another 0.4 per cent have unauthorized connection.
Therefore, access to electricity is quite satisfactory.
3.5.6 Type of fuel used by the HHs:
Type of fuel used for cooking is another indicator to judge
the quality of life of the workers. Table 3.5.6 shows the type of
fuel used in the households surveyed across monthly income
ranges. Majority of the respondents (53%) use LPG as their fuel
while another 25.8 per cent use kerosene. 25.8, 14.0 and 3.8 per
cent of the HHs still use kerosene, coal and fire wood respectively,
all of which are hazardous from health point of view.
28The mill authorities mentioned that the quarters were built long ago for a single person, when the worker came alone
without their families
A part of the verandah being used as kitchen
LPG used as fuel
A corner of the courtyard being used for
cooking purpose
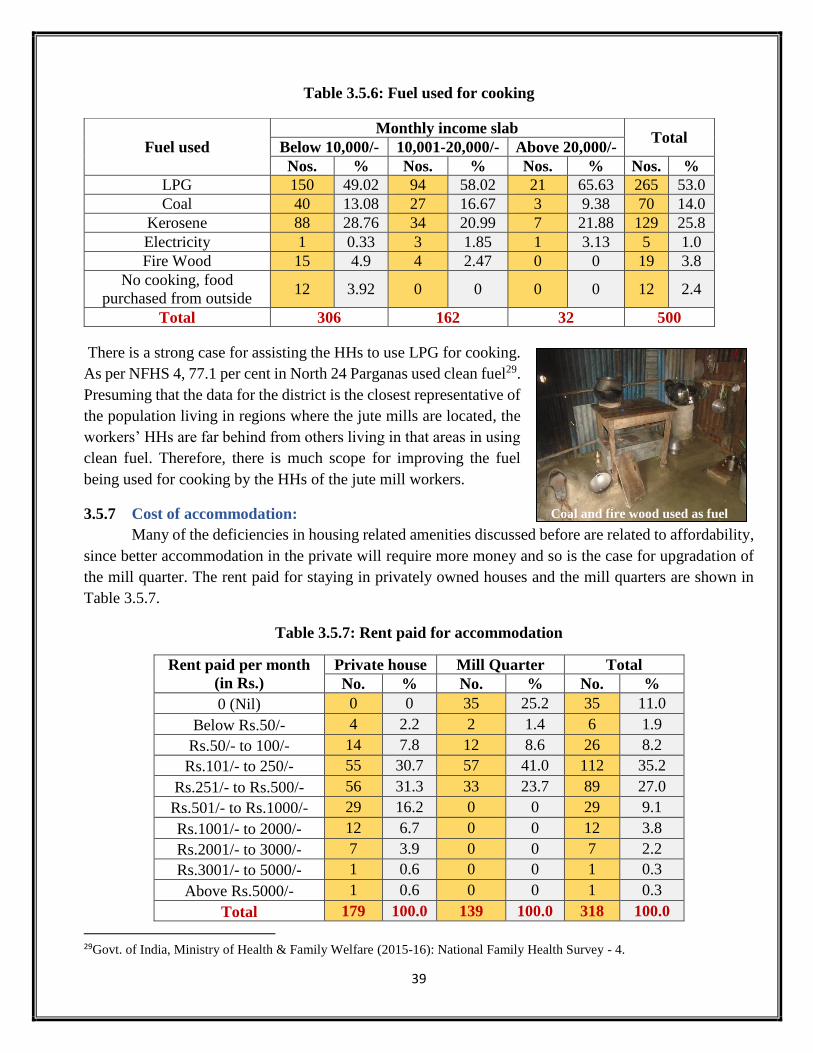
39
Table 3.5.6: Fuel used for cooking
There is a strong case for assisting the HHs to use LPG for cooking.
As per NFHS 4, 77.1 per cent in North 24 Parganas used clean fuel29.
Presuming that the data for the district is the closest representative of
the population living in regions where the jute mills are located, the
workers’ HHs are far behind from others living in that areas in using
clean fuel. Therefore, there is much scope for improving the fuel
being used for cooking by the HHs of the jute mill workers.
3.5.7 Cost of accommodation:
Many of the deficiencies in housing related amenities discussed before are related to affordability,
since better accommodation in the private will require more money and so is the case for upgradation of
the mill quarter. The rent paid for staying in privately owned houses and the mill quarters are shown in
Table 3.5.7.
Table 3.5.7: Rent paid for accommodation
Rent paid per month
(in Rs.)
Private house Mill Quarter Total
No. % No. % No. %
0 (Nil) 0 0 35 25.2 35 11.0
Below Rs.50/- 4 2.2 2 1.4 6 1.9
Rs.50/- to 100/- 14 7.8 12 8.6 26 8.2
Rs.101/- to 250/- 55 30.7 57 41.0 112 35.2
Rs.251/- to Rs.500/- 56 31.3 33 23.7 89 27.0
Rs.501/- to Rs.1000/- 29 16.2 0 0 29 9.1
Rs.1001/- to 2000/- 12 6.7 0 0 12 3.8
Rs.2001/- to 3000/- 7 3.9 0 0 7 2.2
Rs.3001/- to 5000/- 1 0.6 0 0 1 0.3
Above Rs.5000/- 1 0.6 0 0 1 0.3
Total 179 100.0 139 100.0 318 100.0
29Govt. of India, Ministry of Health & Family Welfare (2015-16): National Family Health Survey - 4.
Fuel used
Monthly income slab Total
Below 10,000/- 10,001-20,000/- Above 20,000/-
Nos. % Nos. % Nos. % Nos. %
LPG 150 49.02 94 58.02 21 65.63 265 53.0
Coal 40 13.08 27 16.67 3 9.38 70 14.0
Kerosene 88 28.76 34 20.99 7 21.88 129 25.8
Electricity 1 0.33 3 1.85 1 3.13 5 1.0
Fire Wood 15 4.9 4 2.47 0 0 19 3.8
No cooking, food
purchased from outside 12 3.92 0 0 0 0 12 2.4
Total 306 162 32 500
Coal and fire wood used as fuel
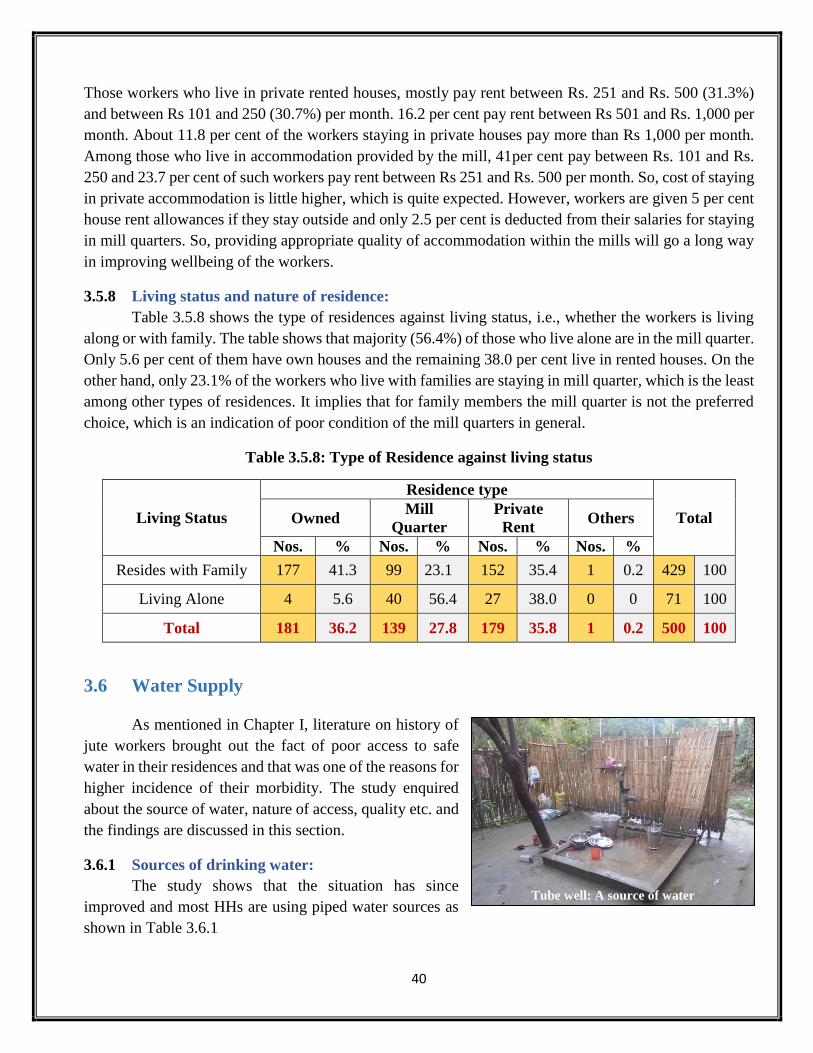
40
Those workers who live in private rented houses, mostly pay rent between Rs. 251 and Rs. 500 (31.3%)
and between Rs 101 and 250 (30.7%) per month. 16.2 per cent pay rent between Rs 501 and Rs. 1,000 per
month. About 11.8 per cent of the workers staying in private houses pay more than Rs 1,000 per month.
Among those who live in accommodation provided by the mill, 41per cent pay between Rs. 101 and Rs.
250 and 23.7 per cent of such workers pay rent between Rs 251 and Rs. 500 per month. So, cost of staying
in private accommodation is little higher, which is quite expected. However, workers are given 5 per cent
house rent allowances if they stay outside and only 2.5 per cent is deducted from their salaries for staying
in mill quarters. So, providing appropriate quality of accommodation within the mills will go a long way
in improving wellbeing of the workers.
3.5.8 Living status and nature of residence:
Table 3.5.8 shows the type of residences against living status, i.e., whether the workers is living
along or with family. The table shows that majority (56.4%) of those who live alone are in the mill quarter.
Only 5.6 per cent of them have own houses and the remaining 38.0 per cent live in rented houses. On the
other hand, only 23.1% of the workers who live with families are staying in mill quarter, which is the least
among other types of residences. It implies that for family members the mill quarter is not the preferred
choice, which is an indication of poor condition of the mill quarters in general.
Table 3.5.8: Type of Residence against living status
Living Status
Residence type
Total Owned Mill
Quarter
Private
Rent Others
Nos. % Nos. % Nos. % Nos. %
Resides with Family 177 41.3 99 23.1 152 35.4 1 0.2 429 100
Living Alone 4 5.6 40 56.4 27 38.0 0 0 71 100
Total 181 36.2 139 27.8 179 35.8 1 0.2 500 100
3.6 Water Supply
As mentioned in Chapter I, literature on history of
jute workers brought out the fact of poor access to safe
water in their residences and that was one of the reasons for
higher incidence of their morbidity. The study enquired
about the source of water, nature of access, quality etc. and
the findings are discussed in this section.
3.6.1 Sources of drinking water:
The study shows that the situation has since
improved and most HHs are using piped water sources as
shown in Table 3.6.1
Tube well: A source of water
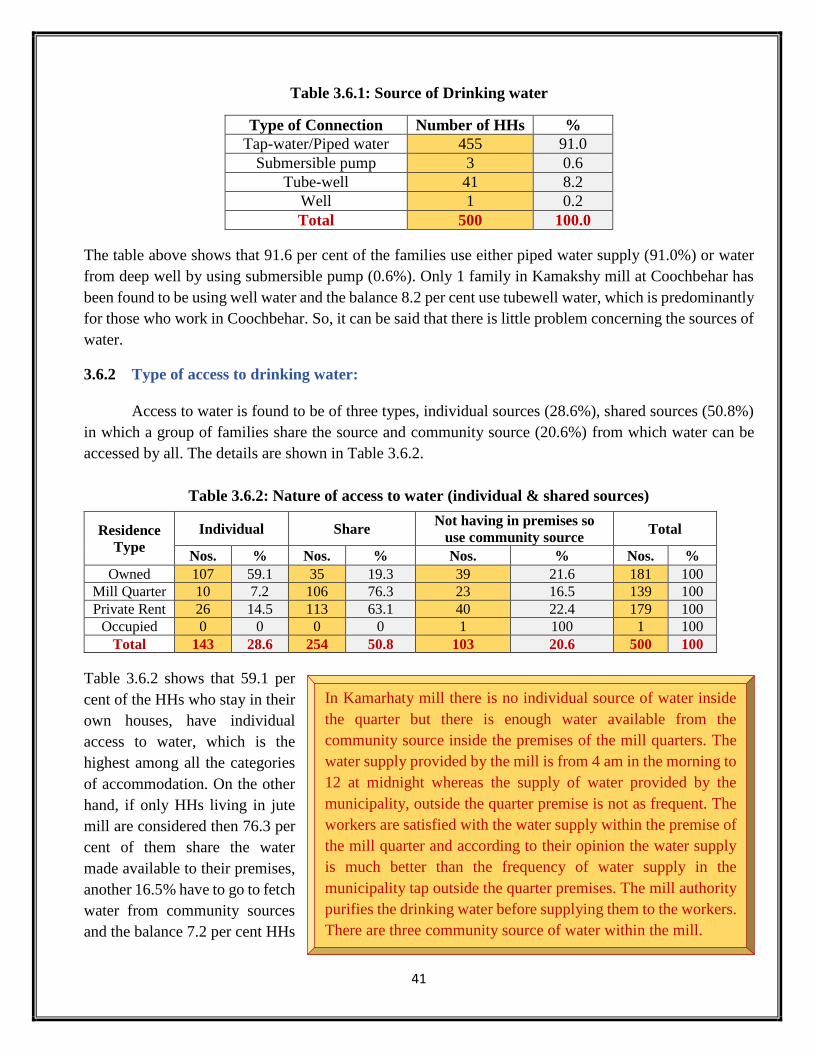
41
Table 3.6.1: Source of Drinking water
Type of Connection Number of HHs %
Tap-water/Piped water 455 91.0
Submersible pump 3 0.6
Tube-well 41 8.2
Well 1 0.2
Total 500 100.0
The table above shows that 91.6 per cent of the families use either piped water supply (91.0%) or water
from deep well by using submersible pump (0.6%). Only 1 family in Kamakshy mill at Coochbehar has
been found to be using well water and the balance 8.2 per cent use tubewell water, which is predominantly
for those who work in Coochbehar. So, it can be said that there is little problem concerning the sources of
water.
3.6.2 Type of access to drinking water:
Access to water is found to be of three types, individual sources (28.6%), shared sources (50.8%)
in which a group of families share the source and community source (20.6%) from which water can be
accessed by all. The details are shown in Table 3.6.2.
Table 3.6.2: Nature of access to water (individual & shared sources)
Table 3.6.2 shows that 59.1 per
cent of the HHs who stay in their
own houses, have individual
access to water, which is the
highest among all the categories
of accommodation. On the other
hand, if only HHs living in jute
mill are considered then 76.3 per
cent of them share the water
made available to their premises,
another 16.5% have to go to fetch
water from community sources
and the balance 7.2 per cent HHs
Residence
Type
Individual Share Not having in premises so
use community source Total
Nos. % Nos. % Nos. % Nos. %
Owned 107 59.1 35 19.3 39 21.6 181 100
Mill Quarter 10 7.2 106 76.3 23 16.5 139 100
Private Rent 26 14.5 113 63.1 40 22.4 179 100
Occupied 0 0 0 0 1 100 1 100
Total 143 28.6 254 50.8 103 20.6 500 100
In Kamarhaty mill there is no individual source of water inside
the quarter but there is enough water available from the
community source inside the premises of the mill quarters. The
water supply provided by the mill is from 4 am in the morning to
12 at midnight whereas the supply of water provided by the
municipality, outside the quarter premise is not as frequent. The
workers are satisfied with the water supply within the premise of
the mill quarter and according to their opinion the water supply
is much better than the frequency of water supply in the
municipality tap outside the quarter premises. The mill authority
purifies the drinking water before supplying them to the workers.
There are three community source of water within the mill.

42
have individual sources. The corresponding figures for those who live outside, taking the individual and
rented accommodation are 45.6, 23.1 and 31.3 per cent respectively (excluding those from the mills at
Coochbehar, who predominantly use individual sources). Thus, though the workers staying in the mill
quarters mostly access water from shared sources but that increases the burden on the women of the HHs.
In terms of percentage of HHs having individual access to drinking water, the incidence is nearly double
for those who live outside than those living inside the mills. However, as the Table 3.6.3 shows that except
4 per cent of such HHs all others can access water from within 100 meter and 74.8 per cent have sources
of water within 50 meter of their premises. The study also finds that only 3.1 percent of IJMA mills have
individual source of water whereas 17.1 per cent of non-IJMA mills have individual source of water.
Table 3.6.3: Distance from water sources
Location Residence
Type
Distance from Water Source
Total 50 meter
51 to 100
meter
More than 100
meter
Coochbehar Outside 36 5 0 41
Mill Quarter 8 1 0 9
KMDA Outside 231 70 19 320
Mill Quarter 99 30 1 130
All 374 106 20 500
Majority of the households (74.8%) have source of water within 50 meters from their household. However,
more than one-fifth (21.2%) have to fetch water from more than 50 meters, which is a significant number.
For those who live within the quarter, as high as 76.2per cent of the HHs can access water from within 50
meter. In fact, for each cluster of quarters there is a water connection within the premises. For those who
live outside the mill, the corresponding figure is 72.2per cent. However, close to 6per cent of the HHs
living outside the mill (excluding those from Coochbehar) have to travel beyond 100 meters and the
corresponding figure for those who stays within mill quarter it is negligible since only 1 HH falls under
this category. Thus, there is little problem with the access to water in terms of distance from the source
and the same is little better for those who live in the mill
quarter.
3.6.3 Quality of water:
Quality of water is an important issue since as per
studies mentioned earlier, many workers and family
members suffer from water borne diseases. It was not
possible to measure quality of water through standard tests
but the views of the users were collected and the same is
presented in Table 3.6.4.
Water from tube well with
high iron content
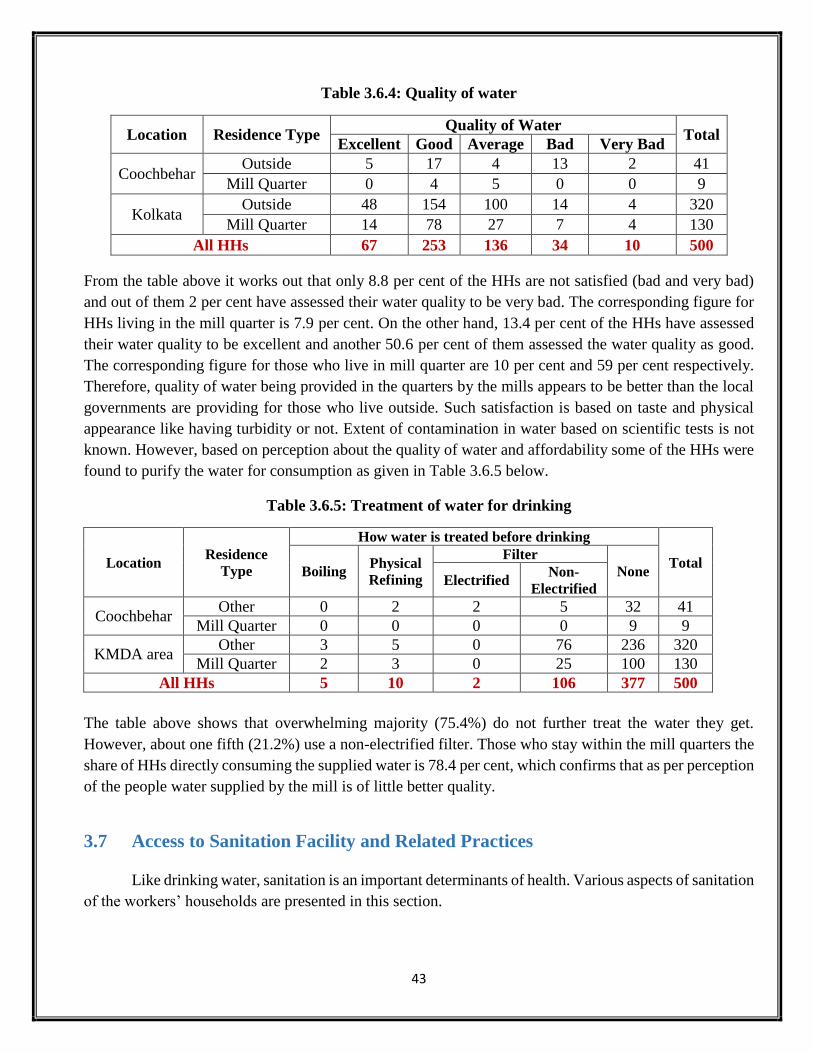
43
Table 3.6.4: Quality of water
Location Residence Type Quality of Water
Total Excellent Good Average Bad Very Bad
Coochbehar Outside 5 17 4 13 2 41
Mill Quarter 0 4 5 0 0 9
Kolkata Outside 48 154 100 14 4 320
Mill Quarter 14 78 27 7 4 130
All HHs 67 253 136 34 10 500
From the table above it works out that only 8.8 per cent of the HHs are not satisfied (bad and very bad)
and out of them 2 per cent have assessed their water quality to be very bad. The corresponding figure for
HHs living in the mill quarter is 7.9 per cent. On the other hand, 13.4 per cent of the HHs have assessed
their water quality to be excellent and another 50.6 per cent of them assessed the water quality as good.
The corresponding figure for those who live in mill quarter are 10 per cent and 59 per cent respectively.
Therefore, quality of water being provided in the quarters by the mills appears to be better than the local
governments are providing for those who live outside. Such satisfaction is based on taste and physical
appearance like having turbidity or not. Extent of contamination in water based on scientific tests is not
known. However, based on perception about the quality of water and affordability some of the HHs were
found to purify the water for consumption as given in Table 3.6.5 below.
Table 3.6.5: Treatment of water for drinking
Location Residence
Type
How water is treated before drinking
Total Boiling
Physical
Refining
Filter
None Electrified
Non-
Electrified
Coochbehar Other 0 2 2 5 32 41
Mill Quarter 0 0 0 0 9 9
KMDA area Other 3 5 0 76 236 320
Mill Quarter 2 3 0 25 100 130
All HHs 5 10 2 106 377 500
The table above shows that overwhelming majority (75.4%) do not further treat the water they get.
However, about one fifth (21.2%) use a non-electrified filter. Those who stay within the mill quarters the
share of HHs directly consuming the supplied water is 78.4 per cent, which confirms that as per perception
of the people water supplied by the mill is of little better quality.
3.7 Access to Sanitation Facility and Related Practices
Like drinking water, sanitation is an important determinants of health. Various aspects of sanitation
of the workers’ households are presented in this section.
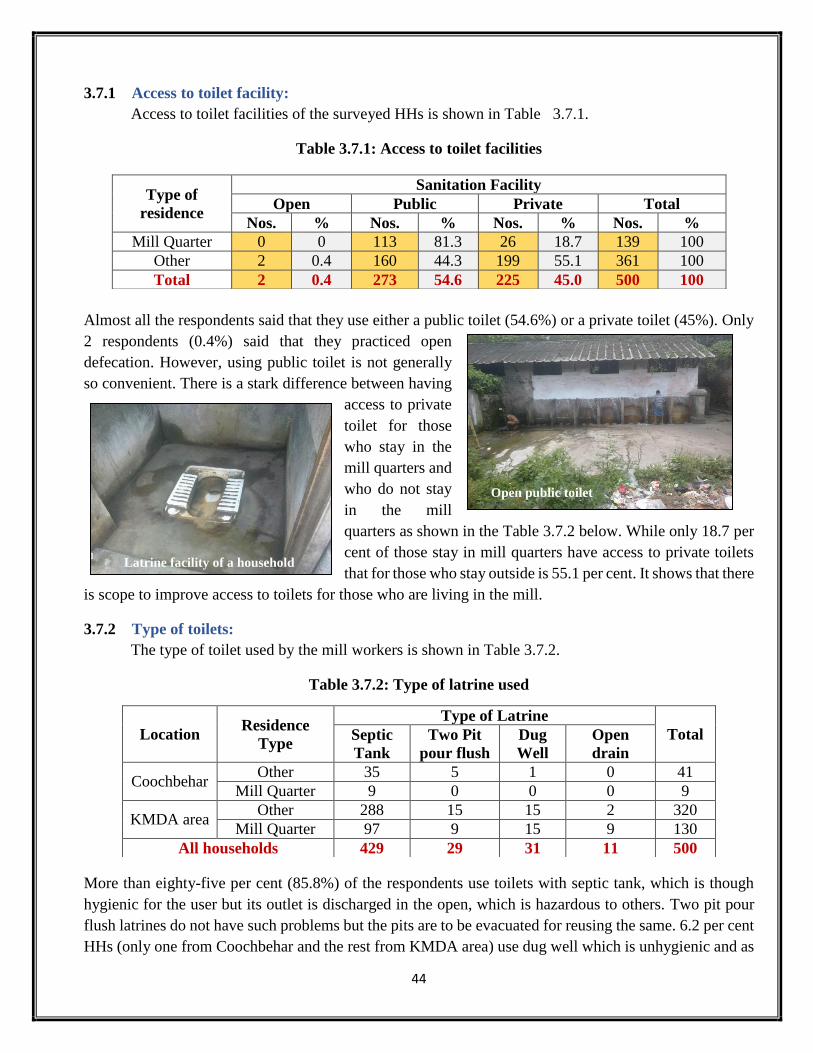
44
3.7.1 Access to toilet facility:
Access to toilet facilities of the surveyed HHs is shown in Table 3.7.1.
Table 3.7.1: Access to toilet facilities
Almost all the respondents said that they use either a public toilet (54.6%) or a private toilet (45%). Only
2 respondents (0.4%) said that they practiced open
defecation. However, using public toilet is not generally
so convenient. There is a stark difference between having
access to private
toilet for those
who stay in the
mill quarters and
who do not stay
in the mill
quarters as shown in the Table 3.7.2 below. While only 18.7 per
cent of those stay in mill quarters have access to private toilets
that for those who stay outside is 55.1 per cent. It shows that there
is scope to improve access to toilets for those who are living in the mill.
3.7.2 Type of toilets:
The type of toilet used by the mill workers is shown in Table 3.7.2.
Table 3.7.2: Type of latrine used
More than eighty-five per cent (85.8%) of the respondents use toilets with septic tank, which is though
hygienic for the user but its outlet is discharged in the open, which is hazardous to others. Two pit pour
flush latrines do not have such problems but the pits are to be evacuated for reusing the same. 6.2 per cent
HHs (only one from Coochbehar and the rest from KMDA area) use dug well which is unhygienic and as
Type of
residence
Sanitation Facility
Open Public Private Total
Nos. % Nos. % Nos. % Nos. %
Mill Quarter 0 0 113 81.3 26 18.7 139 100
Other 2 0.4 160 44.3 199 55.1 361 100
Total 2 0.4 273 54.6 225 45.0 500 100
Location Residence
Type
Type of Latrine
Total Septic
Tank
Two Pit
pour flush
Dug
Well
Open
drain
Coochbehar Other 35 5 1 0 41
Mill Quarter 9 0 0 0 9
KMDA area Other 288 15 15 2 320
Mill Quarter 97 9 15 9 130
All households 429 29 31 11 500
Open public toilet
Latrine facility of a household

45
many as 11 HHs (all from KMDA area) practice open defecation using open drains, which leads to
unsanitary living conditions. There is need for improving the
sanitation practices by changing attitude as well as improving
toilet infrastructure.
There is lack of
cleanliness of the toilet
and only 5.6 per cent
respondents mentioned
that the toilets are
cleaned every day and another 72.6 per cent of them mentioned that
the same is cleaned occasionally. There is need for overall
improvement of hygiene as revealed from the survey.
3.7.3 Bathing facility: There is inadequate infrastructure for taking bath as shown in the Table 3.7.3 below.
Table 3.7.3: Bathing facility
Nature of bathing facilities Number of HHs % share
Exclusive 145 29.0
Share with Others within the premises 223 44.6
Public facility with full Privacy 9 1.8
Public with limited or no privacy for bathing 119 23.8
Other(pond) 4 0.8
Total 500 100.0
A little less than thirty percent (29%) of the respondents have exclusive bathing facilities of their own.
Majority (44.6%) of the HHs have to share bathrooms with
others, while about
one fourth of the
respondents
(23.8%) have said
that they have to
bathe in public with
limited or no
privacy. The
bathing facilities provided by the mill are mostly (80.7%) on
a sharing basis.
3.7.4 Child defecation and handling child excreta:
Practice related to child defecation is very important from protecting the children from water borne
diseases and generally the practice followed is not hygienic. The practice of treating child excreta was
Tap water used for bathing
Public bathing area for the men
Shared toilet
Open toilet on the road
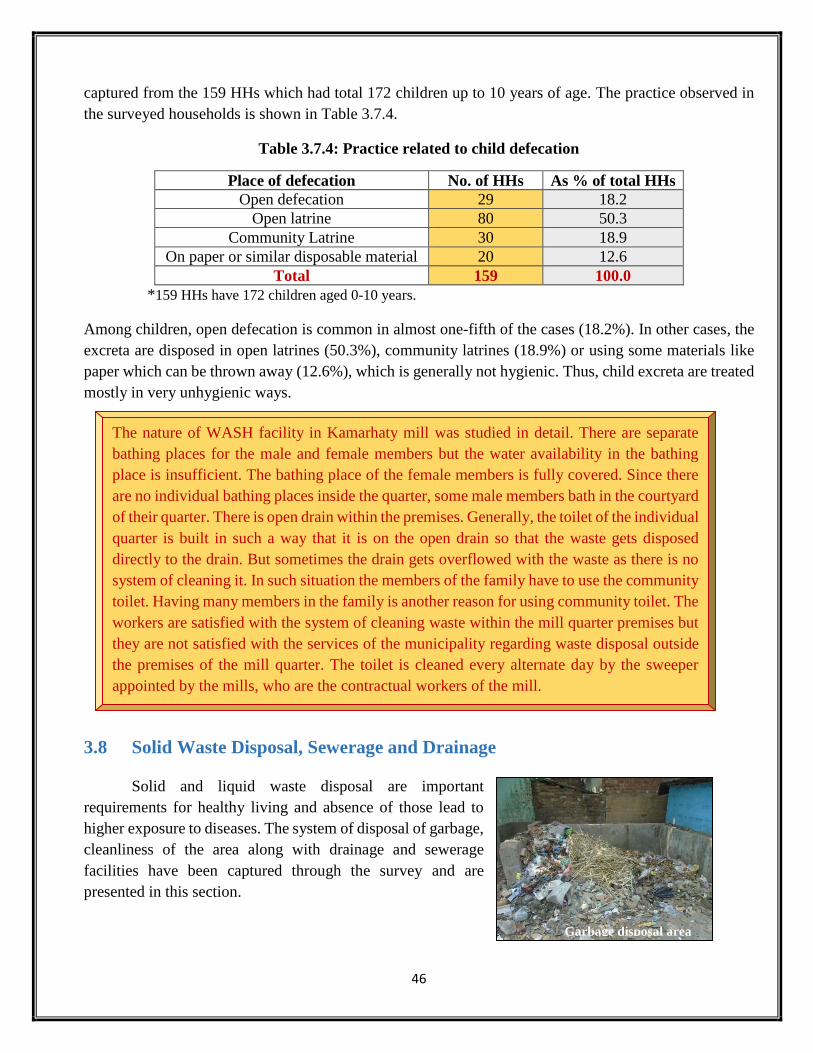
46
captured from the 159 HHs which had total 172 children up to 10 years of age. The practice observed in
the surveyed households is shown in Table 3.7.4.
Table 3.7.4: Practice related to child defecation
Place of defecation No. of HHs As % of total HHs
Open defecation 29 18.2
Open latrine 80 50.3
Community Latrine 30 18.9
On paper or similar disposable material 20 12.6
Total 159 100.0
*159 HHs have 172 children aged 0-10 years.
Among children, open defecation is common in almost one-fifth of the cases (18.2%). In other cases, the
excreta are disposed in open latrines (50.3%), community latrines (18.9%) or using some materials like
paper which can be thrown away (12.6%), which is generally not hygienic. Thus, child excreta are treated
mostly in very unhygienic ways.
3.8 Solid Waste Disposal, Sewerage and Drainage
Solid and liquid waste disposal are important
requirements for healthy living and absence of those lead to
higher exposure to diseases. The system of disposal of garbage,
cleanliness of the area along with drainage and sewerage
facilities have been captured through the survey and are
presented in this section.
The nature of WASH facility in Kamarhaty mill was studied in detail. There are separate
bathing places for the male and female members but the water availability in the bathing
place is insufficient. The bathing place of the female members is fully covered. Since there
are no individual bathing places inside the quarter, some male members bath in the courtyard
of their quarter. There is open drain within the premises. Generally, the toilet of the individual
quarter is built in such a way that it is on the open drain so that the waste gets disposed
directly to the drain. But sometimes the drain gets overflowed with the waste as there is no
system of cleaning it. In such situation the members of the family have to use the community
toilet. Having many members in the family is another reason for using community toilet. The
workers are satisfied with the system of cleaning waste within the mill quarter premises but
they are not satisfied with the services of the municipality regarding waste disposal outside
the premises of the mill quarter. The toilet is cleaned every alternate day by the sweeper
appointed by the mills, who are the contractual workers of the mill.
Garbage disposal area

47
3.8.1 Solid waste disposal:
The Table 3.8.1 shows the system of garbage disposal across different types of HHs within KMDA
area and Coochbehar.
Table 3.8.1: System of disposal of garbage
The table shows that as many as 173 HHs, which is 34.6 per cent of the total HHs surveyed, dispose their
garbage in the open which is unhygienic. For those who live in the mill
quarters, the corresponding figure is 30.9 per cent. Thus, there is
hardly any difference in the practice for garbage disposal by those
living inside or outside the mills. The mills can do little in improving
the practice in respect of those living outside the mills but there is both
need and scope for improving the practice of garbage disposal within
mill areas. Table 3.8.2 provides the distance of the places for disposing
garbage for all HHs except those who deposit their garbage to the
collector, who comes to the door step in areas having mobile garbage
collection system by the municipality. Some HHs directly put their garbage in the municipal vats. 50 per
cent HHs of the IJMA Mills use municipal vat for garbage disposal whereas only 39 per cent HHs of Non
IJMA Mills use municipal vat.
Table 3.8.2: Distance of dumping of disposable items
Distance Responses % share
Within 10 meter 0 0.0
10-20 meter 93 22.4
21-50 meter 185 44.6
51-100 meter 106 25.5
More than 100 meter 31 7.5
Total 415 100.0
*The above data estimated Municipal Mobile Conservancy.
Location Residence
Type
Garbage Disposal
Total Municipal
Vat
Open
Space
Municipal
mobile
conservancy
Pond Mill
Dustbin
Coochbehar Outside mill 3 31 2 5 0 41
Mill Quarter 0 3 0 0 6 9
KMDA area Outside mill 153 99 61 7 0 320
Mill Quarter 65 40 22 1 2 130
All households 221 173 85 13 8 500
Open sewage
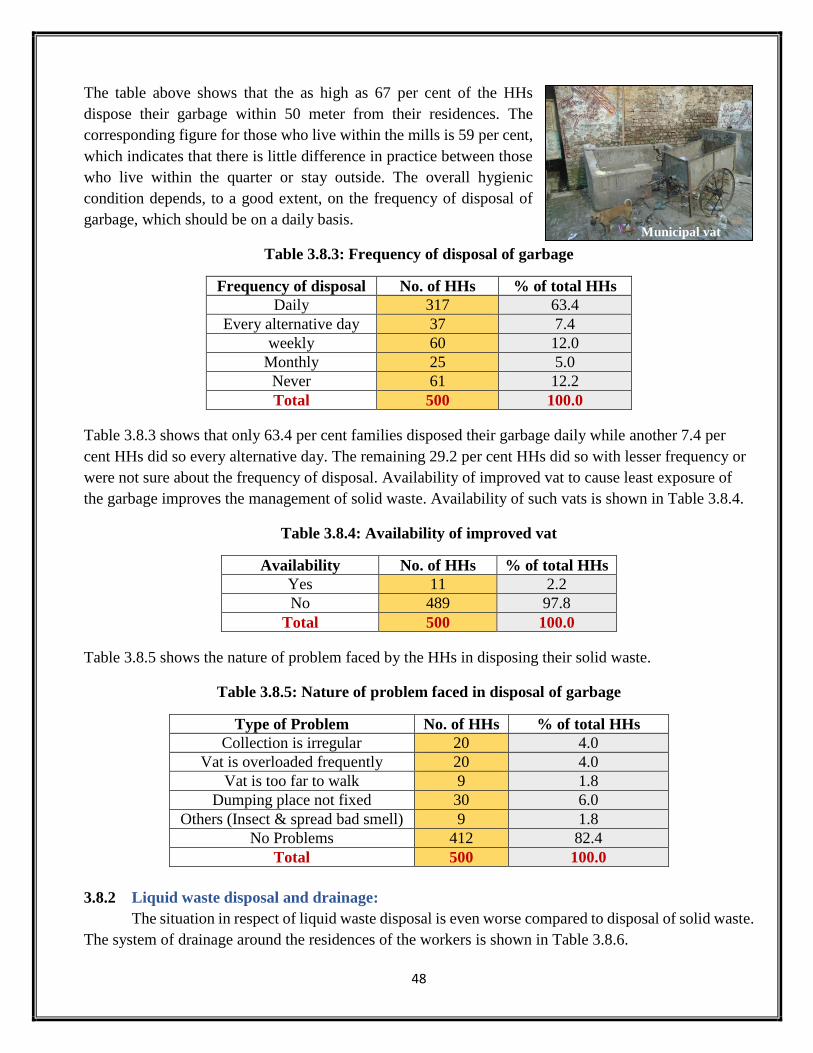
48
The table above shows that the as high as 67 per cent of the HHs
dispose their garbage within 50 meter from their residences. The
corresponding figure for those who live within the mills is 59 per cent,
which indicates that there is little difference in practice between those
who live within the quarter or stay outside. The overall hygienic
condition depends, to a good extent, on the frequency of disposal of
garbage, which should be on a daily basis.
Table 3.8.3: Frequency of disposal of garbage
Frequency of disposal No. of HHs % of total HHs
Daily 317 63.4
Every alternative day 37 7.4
weekly 60 12.0
Monthly 25 5.0
Never 61 12.2
Total 500 100.0
Table 3.8.3 shows that only 63.4 per cent families disposed their garbage daily while another 7.4 per
cent HHs did so every alternative day. The remaining 29.2 per cent HHs did so with lesser frequency or
were not sure about the frequency of disposal. Availability of improved vat to cause least exposure of
the garbage improves the management of solid waste. Availability of such vats is shown in Table 3.8.4.
Table 3.8.4: Availability of improved vat
Availability No. of HHs % of total HHs
Yes 11 2.2
No 489 97.8
Total 500 100.0
Table 3.8.5 shows the nature of problem faced by the HHs in disposing their solid waste.
Table 3.8.5: Nature of problem faced in disposal of garbage
Type of Problem No. of HHs % of total HHs
Collection is irregular 20 4.0
Vat is overloaded frequently 20 4.0
Vat is too far to walk 9 1.8
Dumping place not fixed 30 6.0
Others (Insect & spread bad smell) 9 1.8
No Problems 412 82.4
Total 500 100.0
3.8.2 Liquid waste disposal and drainage:
The situation in respect of liquid waste disposal is even worse compared to disposal of solid waste.
The system of drainage around the residences of the workers is shown in Table 3.8.6.
Municipal vat

49
Table 3.8.6: Drainage facility available
It works out from the data shown in the table above that only 6.6 per cent of the HHs have their liquid
waste disposed through closed drain. The corresponding figures
for those who reside in
mill quarters and outside
are 7.2 per cent and 6.4
per cent respectively.
11.6 per cent have no
drainage at all and all of
them are from the mill at
Coochbehar. 82.2 per cent of the HHs have open drain and for
those who live in the mill quarter the share of such HHs among all those who live within mill quarter is
92.8 per cent compared to corresponding figure of 78.1 per cent for
those who live outside the mill quarter. Thus, drainage facility
provided by the mills for their quarters is worse than that provided by
the municipalities in KMDA area (excluding workers of the mill at
Coochbehar, many of whom live in rural areas).
Many of the residents (36.4%) faced problem of water logging during
moderate to heavy shower as shown in the Table 3.8.7.
Table 3.8.7: Problem of water logging
Frequency of Water logging during heavy rains No. of HHs % of total HHs
Water logging is not a problem 318 63.6
Water remains stagnant throughout the day 58 11.6
Water remains stagnant for a couple of days 90 18.0
Water remain stagnant for many days 34 6.8
Total 500 100.0
Location Residence
Type
Drainage Facility
Total Open
Drain
Closed
Drain
Underground
sewerage
No
Drain
Coochbehar Outside mill 8 0 0 33 41
Mill Quarter 9 0 0 0 9
KMDA area Outside mill 274 23 0 23 320
Mill Quarter 120 10 0 0 130
All households 411 33 0 56 500
Garbage vat beside public latrine
Water logged area
An Open drain

50
3.9 Access to Education
Education is an important determinant of the capability and functioning of any person for
enhancing his or her wellbeing. With universalization of elementary education as well as living within an
urban agglomeration, the children of the jute mill workers should get necessary access to education to
grow as a citizen and participate in social and economic activities for leading a satisfactory life. On the
other hand, lack of education reduces the options which restricts their scope to enhance the level of
wellbeing. Various aspects of education of the family members of the workers’ households towards
development of their human resources are presented in this section.
3.9.1 Educational background of the family members:
The status of education of the family members (excluding children below the age of 6 years) is
given in Table 3.9.1.
Table 3.9.1: Education status of family Member
The workers themselves and the family members of those 71 workers who are staying alone are excluded
from the data presented there.
The table shows that majority of
the family members of the
workers have education level
only up to class VIII. 21.9 per
cent of the females are illiterate
against 14.5 per cent illiterate
among male members of the
HHs. On the other hand, 13.7 per
cent of the male family members
have qualification of higher
secondary or above level
Educational Level
Sex Total
Male Female
Nos. % Nos. % Nos. %
Illiterate 99 14.5 197 21.9 296 18.7
Literate but no schooling 9 1.3 12 1.3 21 1.3
Pre-Primary 26 3.8 25 2.8 51 3.2
Primary 117 17.0 134 14.9 251 15.8
Middle School 170 24.8 279 31.0 449 28.3
Secondary 139 20.2 168 18.7 307 19.3
Higher Secondary 94 13.7 62 6.9 156 9.8
Graduate 27 3.9 22 2.4 49 3.1
Post-Graduate 3 0.4 1 0.1 4 0.3
Professional Course 3 0.4 0 0.0 3 0.2
Total 687 100.0 900 100.0 1587 100.0
14.5
5.1
17
24.820.2
13.7
4.7
21.9
4.1
14.9
31
18.7
6.92.5
0
5
10
15
20
25
30
35 Male Female
Graph 3.9.1: Education level of male and female members of the
workers’ HHs
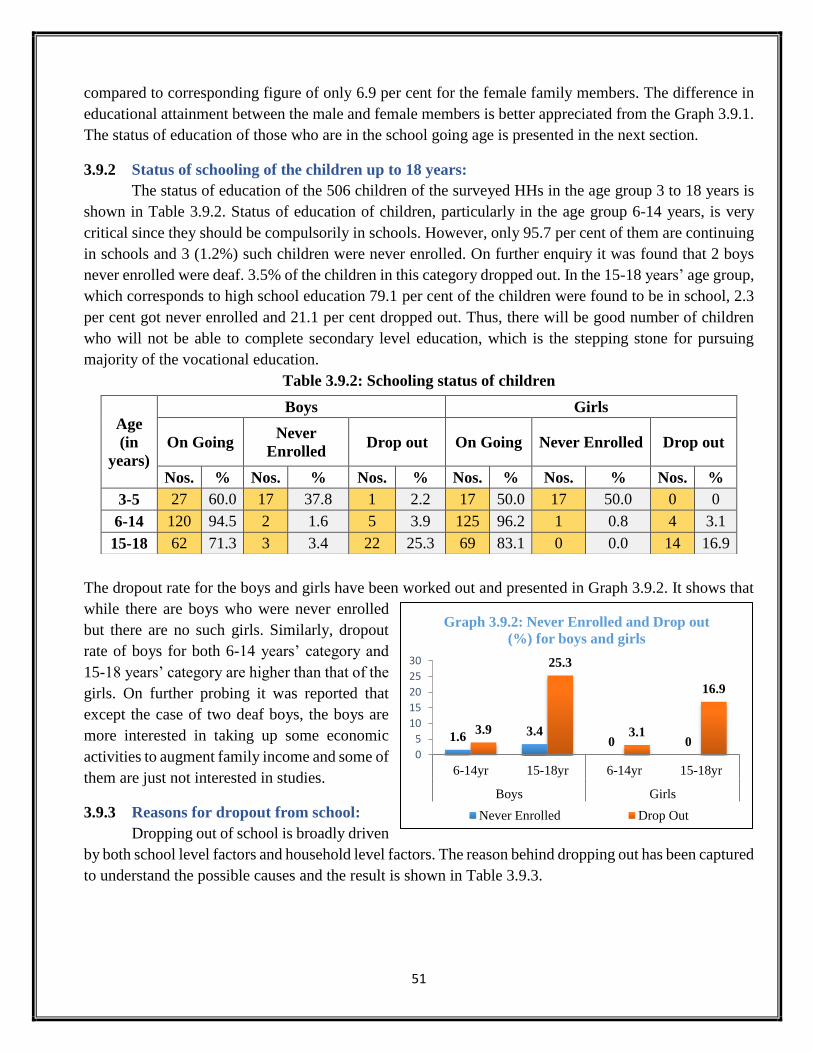
51
compared to corresponding figure of only 6.9 per cent for the female family members. The difference in
educational attainment between the male and female members is better appreciated from the Graph 3.9.1.
The status of education of those who are in the school going age is presented in the next section.
3.9.2 Status of schooling of the children up to 18 years:
The status of education of the 506 children of the surveyed HHs in the age group 3 to 18 years is
shown in Table 3.9.2. Status of education of children, particularly in the age group 6-14 years, is very
critical since they should be compulsorily in schools. However, only 95.7 per cent of them are continuing
in schools and 3 (1.2%) such children were never enrolled. On further enquiry it was found that 2 boys
never enrolled were deaf. 3.5% of the children in this category dropped out. In the 15-18 years’ age group,
which corresponds to high school education 79.1 per cent of the children were found to be in school, 2.3
per cent got never enrolled and 21.1 per cent dropped out. Thus, there will be good number of children
who will not be able to complete secondary level education, which is the stepping stone for pursuing
majority of the vocational education.
Table 3.9.2: Schooling status of children
The dropout rate for the boys and girls have been worked out and presented in Graph 3.9.2. It shows that
while there are boys who were never enrolled
but there are no such girls. Similarly, dropout
rate of boys for both 6-14 years’ category and
15-18 years’ category are higher than that of the
girls. On further probing it was reported that
except the case of two deaf boys, the boys are
more interested in taking up some economic
activities to augment family income and some of
them are just not interested in studies.
3.9.3 Reasons for dropout from school:
Dropping out of school is broadly driven
by both school level factors and household level factors. The reason behind dropping out has been captured
to understand the possible causes and the result is shown in Table 3.9.3.
Age
(in
years)
Boys Girls
On Going Never
Enrolled Drop out On Going Never Enrolled Drop out
Nos. % Nos. % Nos. % Nos. % Nos. % Nos. %
3-5 27 60.0 17 37.8 1 2.2 17 50.0 17 50.0 0 0
6-14 120 94.5 2 1.6 5 3.9 125 96.2 1 0.8 4 3.1
15-18 62 71.3 3 3.4 22 25.3 69 83.1 0 0.0 14 16.9
1.6 3.40 0
3.9
25.3
3.1
16.9
0
5
10
15
20
25
30
6-14yr 15-18yr 6-14yr 15-18yr
Boys Girls
Graph 3.9.2: Never Enrolled and Drop out
(%) for boys and girls
Never Enrolled Drop Out
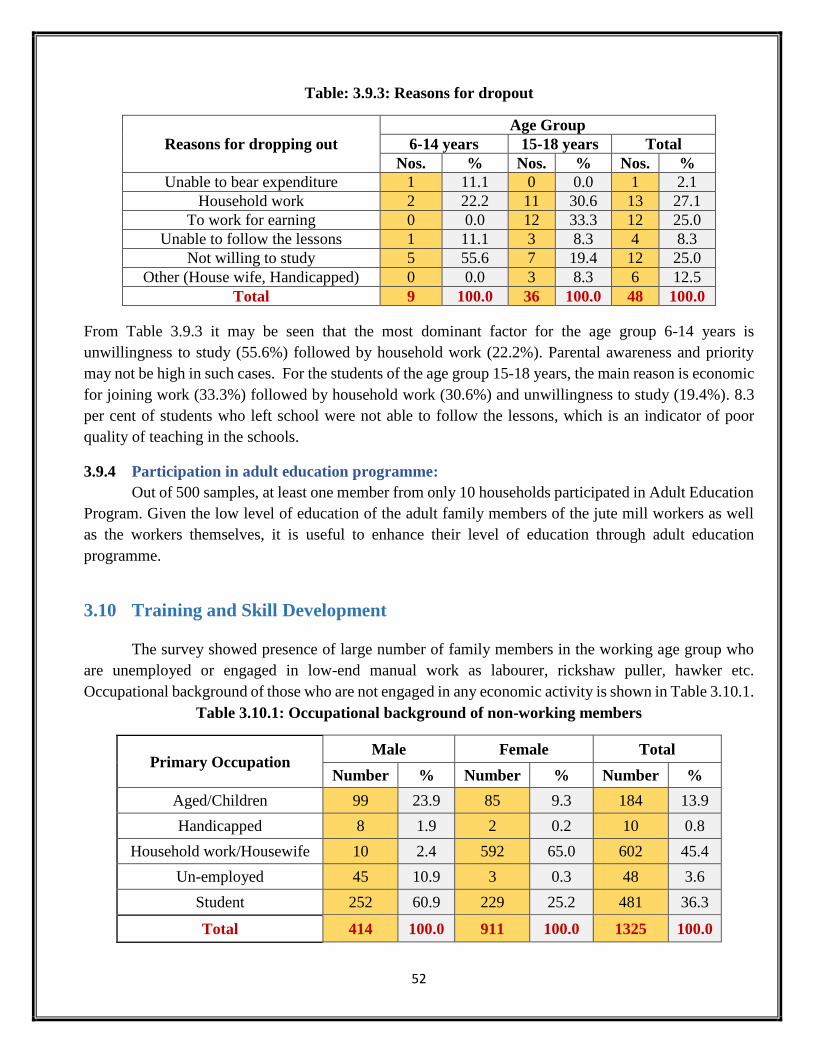
52
Table: 3.9.3: Reasons for dropout
Reasons for dropping out
Age Group
6-14 years 15-18 years Total
Nos. % Nos. % Nos. %
Unable to bear expenditure 1 11.1 0 0.0 1 2.1
Household work 2 22.2 11 30.6 13 27.1
To work for earning 0 0.0 12 33.3 12 25.0
Unable to follow the lessons 1 11.1 3 8.3 4 8.3
Not willing to study 5 55.6 7 19.4 12 25.0
Other (House wife, Handicapped) 0 0.0 3 8.3 6 12.5
Total 9 100.0 36 100.0 48 100.0
From Table 3.9.3 it may be seen that the most dominant factor for the age group 6-14 years is
unwillingness to study (55.6%) followed by household work (22.2%). Parental awareness and priority
may not be high in such cases. For the students of the age group 15-18 years, the main reason is economic
for joining work (33.3%) followed by household work (30.6%) and unwillingness to study (19.4%). 8.3
per cent of students who left school were not able to follow the lessons, which is an indicator of poor
quality of teaching in the schools.
3.9.4 Participation in adult education programme:
Out of 500 samples, at least one member from only 10 households participated in Adult Education
Program. Given the low level of education of the adult family members of the jute mill workers as well
as the workers themselves, it is useful to enhance their level of education through adult education
programme.
3.10 Training and Skill Development
The survey showed presence of large number of family members in the working age group who
are unemployed or engaged in low-end manual work as labourer, rickshaw puller, hawker etc.
Occupational background of those who are not engaged in any economic activity is shown in Table 3.10.1.
Table 3.10.1: Occupational background of non-working members
Primary Occupation Male Female Total
Number % Number % Number %
Aged/Children 99 23.9 85 9.3 184 13.9
Handicapped 8 1.9 2 0.2 10 0.8
Household work/Housewife 10 2.4 592 65.0 602 45.4
Un-employed 45 10.9 3 0.3 48 3.6
Student 252 60.9 229 25.2 481 36.3
Total 414 100.0 911 100.0 1325 100.0
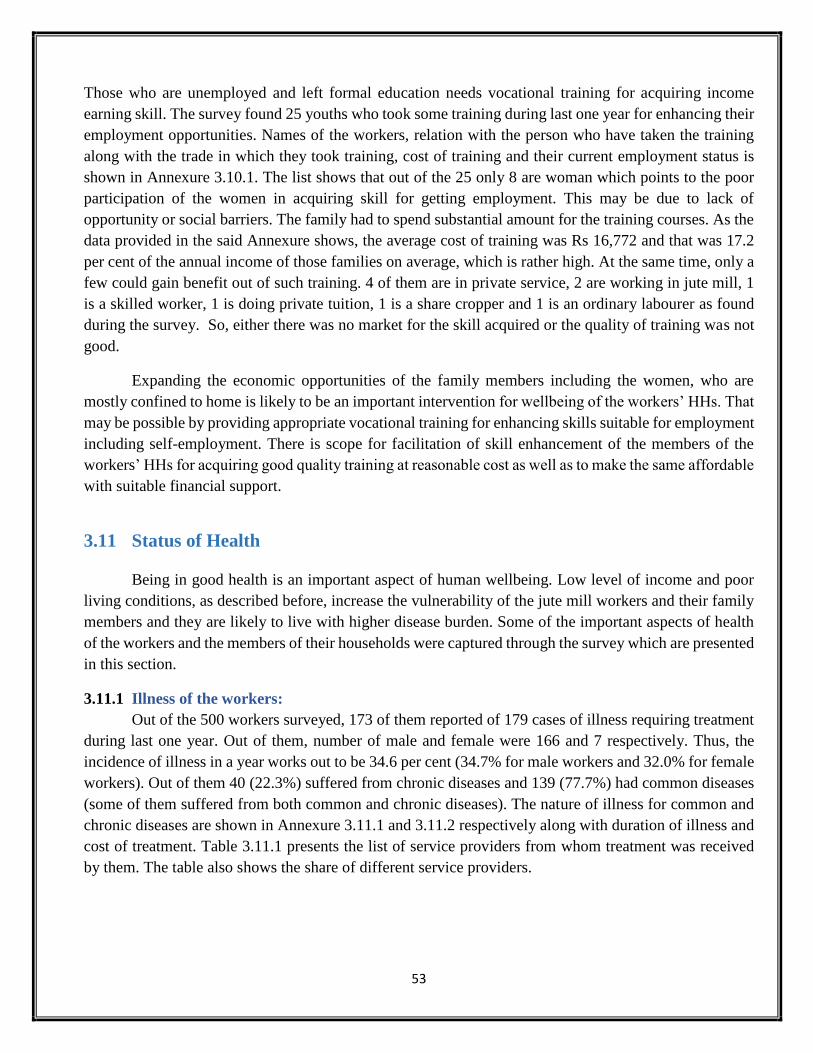
53
Those who are unemployed and left formal education needs vocational training for acquiring income
earning skill. The survey found 25 youths who took some training during last one year for enhancing their
employment opportunities. Names of the workers, relation with the person who have taken the training
along with the trade in which they took training, cost of training and their current employment status is
shown in Annexure 3.10.1. The list shows that out of the 25 only 8 are woman which points to the poor
participation of the women in acquiring skill for getting employment. This may be due to lack of
opportunity or social barriers. The family had to spend substantial amount for the training courses. As the
data provided in the said Annexure shows, the average cost of training was Rs 16,772 and that was 17.2
per cent of the annual income of those families on average, which is rather high. At the same time, only a
few could gain benefit out of such training. 4 of them are in private service, 2 are working in jute mill, 1
is a skilled worker, 1 is doing private tuition, 1 is a share cropper and 1 is an ordinary labourer as found
during the survey. So, either there was no market for the skill acquired or the quality of training was not
good.
Expanding the economic opportunities of the family members including the women, who are
mostly confined to home is likely to be an important intervention for wellbeing of the workers’ HHs. That
may be possible by providing appropriate vocational training for enhancing skills suitable for employment
including self-employment. There is scope for facilitation of skill enhancement of the members of the
workers’ HHs for acquiring good quality training at reasonable cost as well as to make the same affordable
with suitable financial support.
3.11 Status of Health
Being in good health is an important aspect of human wellbeing. Low level of income and poor
living conditions, as described before, increase the vulnerability of the jute mill workers and their family
members and they are likely to live with higher disease burden. Some of the important aspects of health
of the workers and the members of their households were captured through the survey which are presented
in this section.
3.11.1 Illness of the workers:
Out of the 500 workers surveyed, 173 of them reported of 179 cases of illness requiring treatment
during last one year. Out of them, number of male and female were 166 and 7 respectively. Thus, the
incidence of illness in a year works out to be 34.6 per cent (34.7% for male workers and 32.0% for female
workers). Out of them 40 (22.3%) suffered from chronic diseases and 139 (77.7%) had common diseases
(some of them suffered from both common and chronic diseases). The nature of illness for common and
chronic diseases are shown in Annexure 3.11.1 and 3.11.2 respectively along with duration of illness and
cost of treatment. Table 3.11.1 presents the list of service providers from whom treatment was received
by them. The table also shows the share of different service providers.
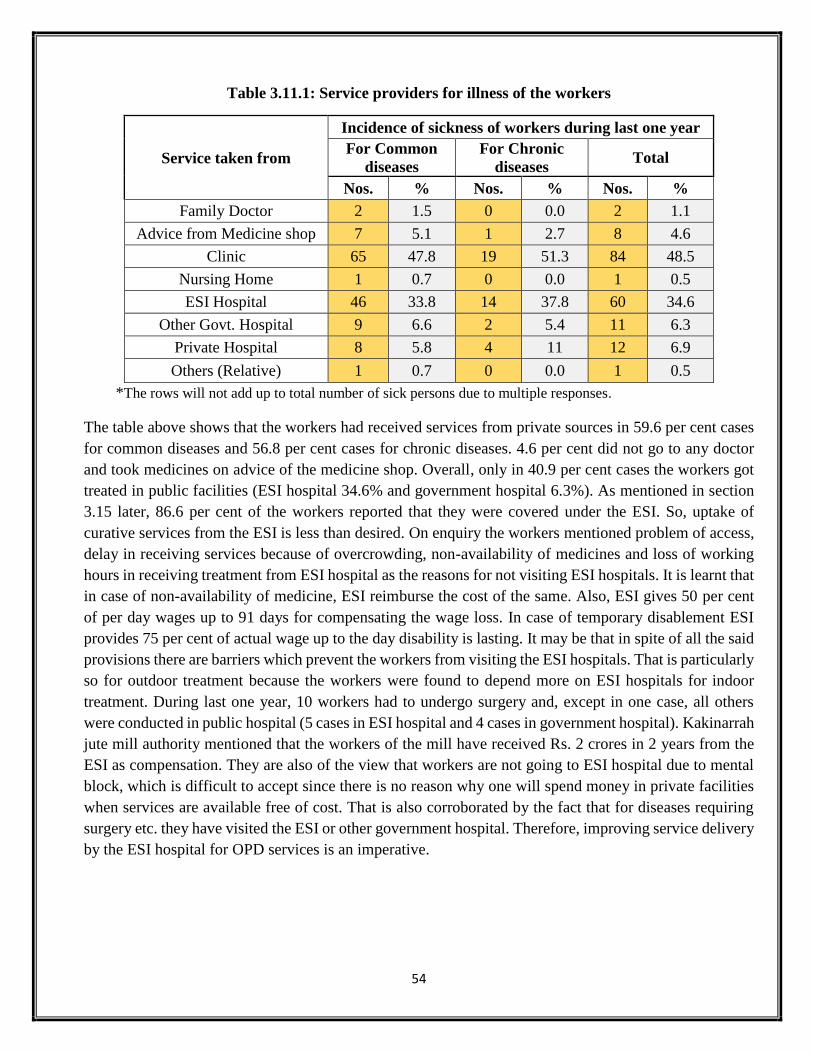
54
Table 3.11.1: Service providers for illness of the workers
Service taken from
Incidence of sickness of workers during last one year
For Common
diseases
For Chronic
diseases Total
Nos. % Nos. % Nos. %
Family Doctor 2 1.5 0 0.0 2 1.1
Advice from Medicine shop 7 5.1 1 2.7 8 4.6
Clinic 65 47.8 19 51.3 84 48.5
Nursing Home 1 0.7 0 0.0 1 0.5
ESI Hospital 46 33.8 14 37.8 60 34.6
Other Govt. Hospital 9 6.6 2 5.4 11 6.3
Private Hospital 8 5.8 4 11 12 6.9
Others (Relative) 1 0.7 0 0.0 1 0.5
*The rows will not add up to total number of sick persons due to multiple responses.
The table above shows that the workers had received services from private sources in 59.6 per cent cases
for common diseases and 56.8 per cent cases for chronic diseases. 4.6 per cent did not go to any doctor
and took medicines on advice of the medicine shop. Overall, only in 40.9 per cent cases the workers got
treated in public facilities (ESI hospital 34.6% and government hospital 6.3%). As mentioned in section
3.15 later, 86.6 per cent of the workers reported that they were covered under the ESI. So, uptake of
curative services from the ESI is less than desired. On enquiry the workers mentioned problem of access,
delay in receiving services because of overcrowding, non-availability of medicines and loss of working
hours in receiving treatment from ESI hospital as the reasons for not visiting ESI hospitals. It is learnt that
in case of non-availability of medicine, ESI reimburse the cost of the same. Also, ESI gives 50 per cent
of per day wages up to 91 days for compensating the wage loss. In case of temporary disablement ESI
provides 75 per cent of actual wage up to the day disability is lasting. It may be that in spite of all the said
provisions there are barriers which prevent the workers from visiting the ESI hospitals. That is particularly
so for outdoor treatment because the workers were found to depend more on ESI hospitals for indoor
treatment. During last one year, 10 workers had to undergo surgery and, except in one case, all others
were conducted in public hospital (5 cases in ESI hospital and 4 cases in government hospital). Kakinarrah
jute mill authority mentioned that the workers of the mill have received Rs. 2 crores in 2 years from the
ESI as compensation. They are also of the view that workers are not going to ESI hospital due to mental
block, which is difficult to accept since there is no reason why one will spend money in private facilities
when services are available free of cost. That is also corroborated by the fact that for diseases requiring
surgery etc. they have visited the ESI or other government hospital. Therefore, improving service delivery
by the ESI hospital for OPD services is an imperative.
55
3.11.2 Illness related to occupational hazard:
Working environment within the jute mills is hazardous for the health of the workers. Jute is the
most accident prone among all categories of industries in West Bengal. The Table 3.11.2 shows the
incidence of accidents across major industry types for the period 2012-13 to 2014-1530.
Table 3.11.2: Industry-wise accidents in West Bengal
Industry
2012-13 2013-14 2014-15
Total
Incidence
rate (per
1000
workers)
% of total
accidents Total
Incide
nce
rate
% of total
accidents Total
Incide
nce
rate
% of
total
accidents
Jute 10,120 47.13 56.76 10,112 46.98 52.32 8,964 47.06 47.69
Engineering 4,234 10.09 23.75 4,760 10.05 24.63 5,129 13.71 27.29
Cotton 2,332 48.03 13.08 2,467 49.14 12.76 2,602 52.31 13.84
Chemicals 1,145 20.95 6.42 2,602 52.31 13.84 1,619 36.51 8.61
The table shows that there were 8,964 accidents in jute mills of West Bengal during the year 2014-
15 and that amounts to 47.06 accidents per 1000 workers during the year, which is marginally lower than
that in cotton industries but much higher than that in engineering or chemical industries. The workers have
to bear the burden of these injuries. Jute dust is known to contribute to certain non-specific lung diseases
like bronchitis, emphysema and pneumonia. Workers in the jute industry are liable, especially on first
employment, to 'mill fever'. There are a number of cases of 'occupational asthma' reported from jute mills.
Cases of dermatitis arising from jute dust, batching oil and dyes are also common. Excessive noise in
weaving operations can result in irreversible hearing loss and excessive heat and humidity in the spinning
and weaving sections can result in health disorders.31The present survey found 196 workers reporting of
occupation hazard related illnesses (not all were treated and, therefore, could not be compared with the
number in the previous section) and there were 222 incidences of illness during the last one year as
mentioned in Table 3.11.3 for which they sought treatment. Some workers have reported occurrence of
more than one type of diseases on account of occupational hazard. They complained of even stomach
problem and repeated incidence of cold and cough because they have to handle wet raw jute throughout
the day. The labour union in Kakinarrah complained of lack of supply of gloves and masks specially in
batching department and poor exhaust system, which increases pollution within the working place32.
Many respondents have reported about hard and laborious work. There were also cases of injury of finger
requiring surgery. NJB had conducted a study on “Measuring the Impact of Occupational Hazards on the
Health of the Workers in the Jute Producing Units in India.” In that study also it was found that
Eosinophilia being present in some workers which may be due to the allergic reaction to jute fibres. The
study also showed that no application of ear mufflers would be causing hearing loss along the age of the
workers. Thus, mixture of Obstructive & Restrictive diseases may be caused by Jute fibres.
30Govt. of West Bengal, Department of Labour (2014-15): Labour in West Bengal 31Nath Surendra (1987); “Occupational Diseases In The Jute Industry”; Labour Inspection in the Jute Industry; ILO 32IDI with BMS of Kakinarrah jute mill.
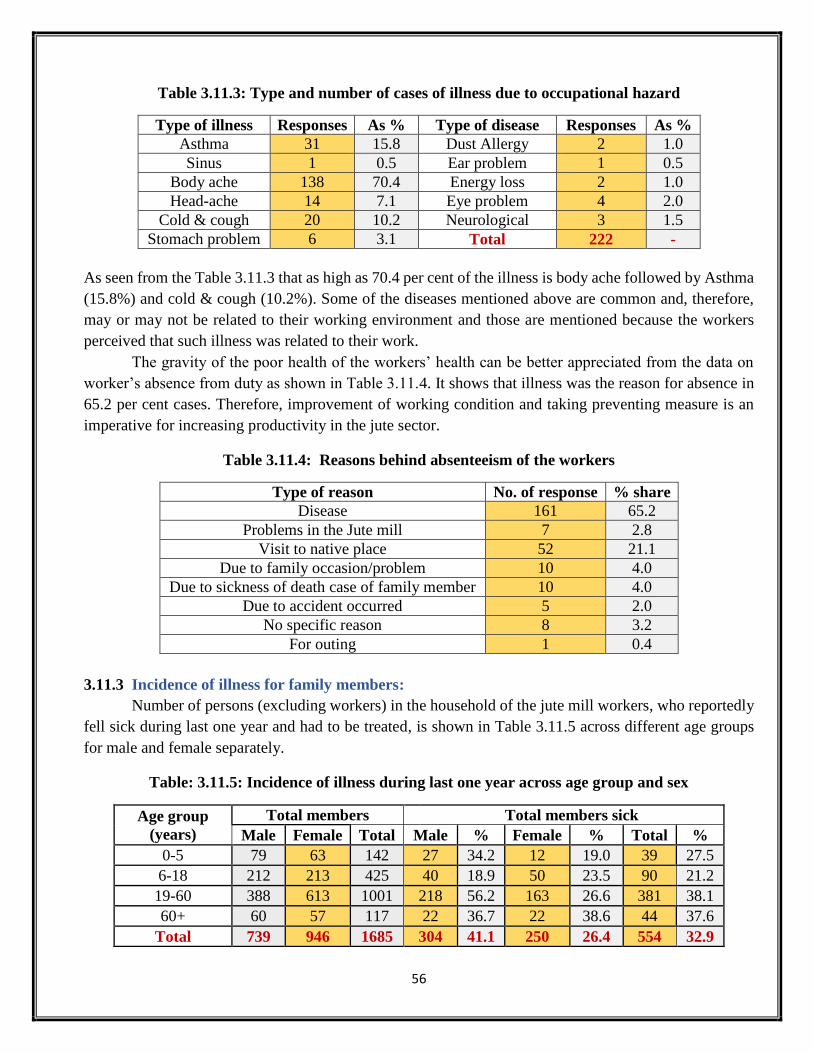
56
Table 3.11.3: Type and number of cases of illness due to occupational hazard
Type of illness Responses As % Type of disease Responses As %
Asthma 31 15.8 Dust Allergy 2 1.0
Sinus 1 0.5 Ear problem 1 0.5
Body ache 138 70.4 Energy loss 2 1.0
Head-ache 14 7.1 Eye problem 4 2.0
Cold & cough 20 10.2 Neurological 3 1.5
Stomach problem 6 3.1 Total 222 -
As seen from the Table 3.11.3 that as high as 70.4 per cent of the illness is body ache followed by Asthma
(15.8%) and cold & cough (10.2%). Some of the diseases mentioned above are common and, therefore,
may or may not be related to their working environment and those are mentioned because the workers
perceived that such illness was related to their work.
The gravity of the poor health of the workers’ health can be better appreciated from the data on
worker’s absence from duty as shown in Table 3.11.4. It shows that illness was the reason for absence in
65.2 per cent cases. Therefore, improvement of working condition and taking preventing measure is an
imperative for increasing productivity in the jute sector.
Table 3.11.4: Reasons behind absenteeism of the workers
Type of reason No. of response % share
Disease 161 65.2
Problems in the Jute mill 7 2.8
Visit to native place 52 21.1
Due to family occasion/problem 10 4.0
Due to sickness of death case of family member 10 4.0
Due to accident occurred 5 2.0
No specific reason 8 3.2
For outing 1 0.4
3.11.3 Incidence of illness for family members:
Number of persons (excluding workers) in the household of the jute mill workers, who reportedly
fell sick during last one year and had to be treated, is shown in Table 3.11.5 across different age groups
for male and female separately.
Table: 3.11.5: Incidence of illness during last one year across age group and sex
Age group
(years)
Total members Total members sick
Male Female Total Male % Female % Total %
0-5 79 63 142 27 34.2 12 19.0 39 27.5
6-18 212 213 425 40 18.9 50 23.5 90 21.2
19-60 388 613 1001 218 56.2 163 26.6 381 38.1
60+ 60 57 117 22 36.7 22 38.6 44 37.6
Total 739 946 1685 304 41.1 250 26.4 554 32.9
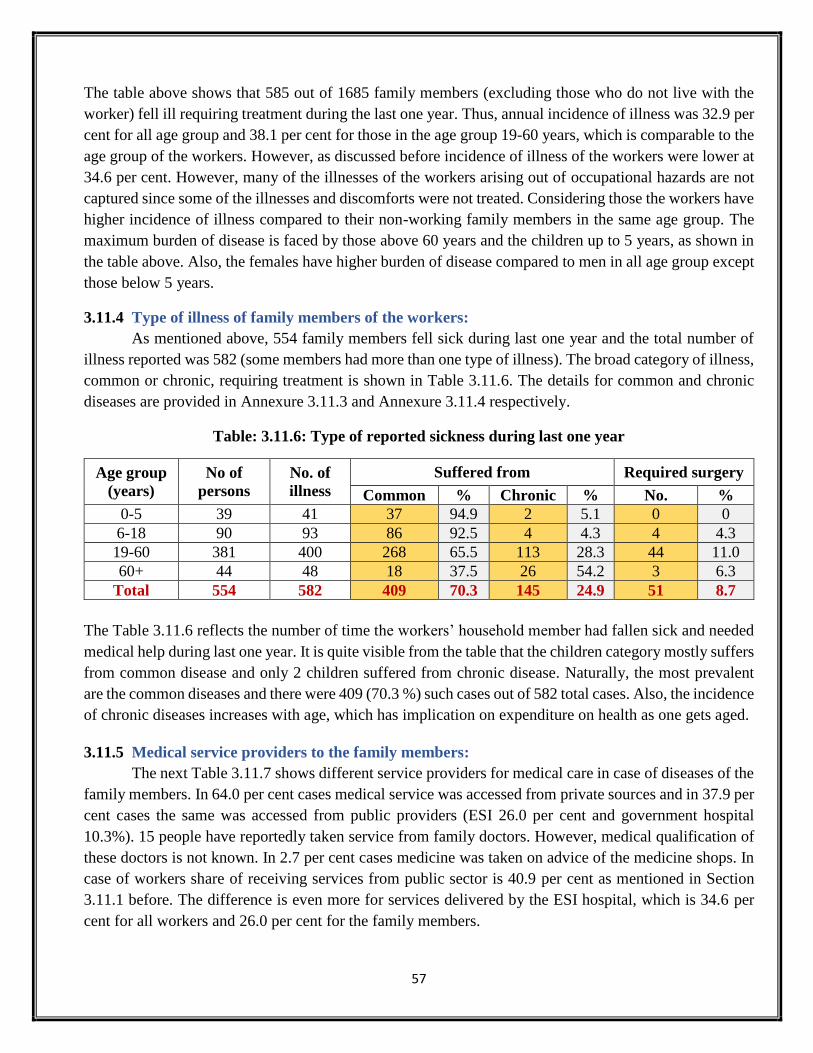
57
The table above shows that 585 out of 1685 family members (excluding those who do not live with the
worker) fell ill requiring treatment during the last one year. Thus, annual incidence of illness was 32.9 per
cent for all age group and 38.1 per cent for those in the age group 19-60 years, which is comparable to the
age group of the workers. However, as discussed before incidence of illness of the workers were lower at
34.6 per cent. However, many of the illnesses of the workers arising out of occupational hazards are not
captured since some of the illnesses and discomforts were not treated. Considering those the workers have
higher incidence of illness compared to their non-working family members in the same age group. The
maximum burden of disease is faced by those above 60 years and the children up to 5 years, as shown in
the table above. Also, the females have higher burden of disease compared to men in all age group except
those below 5 years.
3.11.4 Type of illness of family members of the workers:
As mentioned above, 554 family members fell sick during last one year and the total number of
illness reported was 582 (some members had more than one type of illness). The broad category of illness,
common or chronic, requiring treatment is shown in Table 3.11.6. The details for common and chronic
diseases are provided in Annexure 3.11.3 and Annexure 3.11.4 respectively.
Table: 3.11.6: Type of reported sickness during last one year
Age group
(years)
No of
persons
No. of
illness
Suffered from Required surgery
Common % Chronic % No. %
0-5 39 41 37 94.9 2 5.1 0 0
6-18 90 93 86 92.5 4 4.3 4 4.3
19-60 381 400 268 65.5 113 28.3 44 11.0
60+ 44 48 18 37.5 26 54.2 3 6.3
Total 554 582 409 70.3 145 24.9 51 8.7
The Table 3.11.6 reflects the number of time the workers’ household member had fallen sick and needed
medical help during last one year. It is quite visible from the table that the children category mostly suffers
from common disease and only 2 children suffered from chronic disease. Naturally, the most prevalent
are the common diseases and there were 409 (70.3 %) such cases out of 582 total cases. Also, the incidence
of chronic diseases increases with age, which has implication on expenditure on health as one gets aged.
3.11.5 Medical service providers to the family members:
The next Table 3.11.7 shows different service providers for medical care in case of diseases of the
family members. In 64.0 per cent cases medical service was accessed from private sources and in 37.9 per
cent cases the same was accessed from public providers (ESI 26.0 per cent and government hospital
10.3%). 15 people have reportedly taken service from family doctors. However, medical qualification of
these doctors is not known. In 2.7 per cent cases medicine was taken on advice of the medicine shops. In
case of workers share of receiving services from public sector is 40.9 per cent as mentioned in Section
3.11.1 before. The difference is even more for services delivered by the ESI hospital, which is 34.6 per
cent for all workers and 26.0 per cent for the family members.
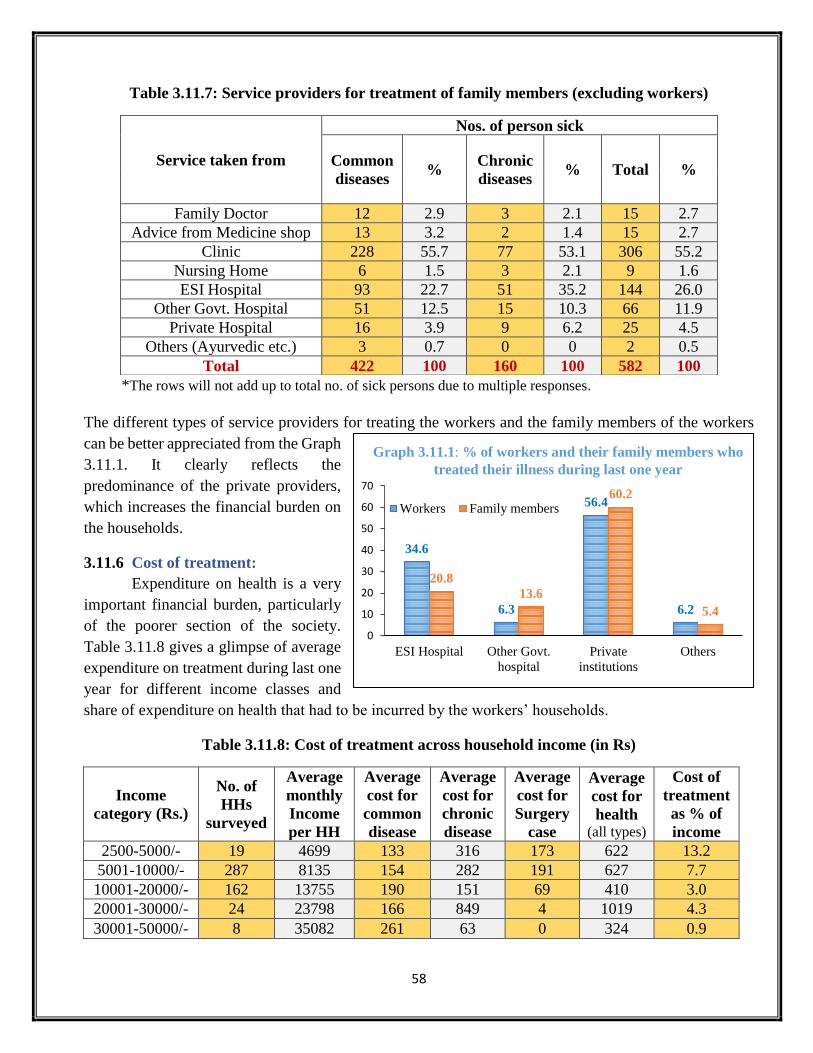
58
Table 3.11.7: Service providers for treatment of family members (excluding workers)
*The rows will not add up to total no. of sick persons due to multiple responses.
The different types of service providers for treating the workers and the family members of the workers
can be better appreciated from the Graph
3.11.1. It clearly reflects the
predominance of the private providers,
which increases the financial burden on
the households.
3.11.6 Cost of treatment:
Expenditure on health is a very
important financial burden, particularly
of the poorer section of the society.
Table 3.11.8 gives a glimpse of average
expenditure on treatment during last one
year for different income classes and
share of expenditure on health that had to be incurred by the workers’ households.
Table 3.11.8: Cost of treatment across household income (in Rs)
Income
category (Rs.)
No. of
HHs
surveyed
Average
monthly
Income
per HH
Average
cost for
common
disease
Average
cost for
chronic
disease
Average
cost for
Surgery
case
Average
cost for
health (all types)
Cost of
treatment
as % of
income
2500-5000/- 19 4699 133 316 173 622 13.2
5001-10000/- 287 8135 154 282 191 627 7.7
10001-20000/- 162 13755 190 151 69 410 3.0
20001-30000/- 24 23798 166 849 4 1019 4.3
30001-50000/- 8 35082 261 63 0 324 0.9
Service taken from
Nos. of person sick
Common
diseases %
Chronic
diseases % Total %
Family Doctor 12 2.9 3 2.1 15 2.7
Advice from Medicine shop 13 3.2 2 1.4 15 2.7
Clinic 228 55.7 77 53.1 306 55.2
Nursing Home 6 1.5 3 2.1 9 1.6
ESI Hospital 93 22.7 51 35.2 144 26.0
Other Govt. Hospital 51 12.5 15 10.3 66 11.9
Private Hospital 16 3.9 9 6.2 25 4.5
Others (Ayurvedic etc.) 3 0.7 0 0 2 0.5
Total 422 100 160 100 582 100
34.6
6.3
56.4
6.2
20.8
13.6
60.2
5.4
0
10
20
30
40
50
60
70
ESI Hospital Other Govt.
hospital
Private
institutions
Others
Workers Family members
Graph 3.11.1: % of workers and their family members who
treated their illness during last one year

59
Total 500 11015 167 264 139 570 5.1
The table shows that average cost of treatment per HH is 5.1 per cent of their income. However,
the poorer HHs spend much more than an average worker HH spend on health and, therefore, they bear a
much higher burden on health related expenditure.
3.11.7 Immunization:
Immunization for preventing diseases is a critical service for protecting the life of the pregnant
women and the children. The coverage of immunization for preventing various diseases were captured
during the survey and the same is presented in the Table 3.11.9 below.
Table 3.11.9: Coverage of immunization against various diseases
Type of Immunization No. of child %
BCG Completed 141 99.3
BCG Going On 1 0.7
BCG Discontinued 0 0.0
BCG Never Immunized 0 0.0
Total 142 100.0
DPT Completed 130 91.5
DPT Going On 6 4.2
DPT Discontinued 4 2.8
DPT Never Immunized 2 1.4
Total 142 100.0
Hepatitis B Completed 131 92.3
Hepatitis B Going On 11 7.7
Hepatitis B Discontinued 0 0.0
Hepatitis B Never Immunized 0 0.0
Total 142 100.0
Table 3.11.9 shows that BCG dose have been completed by 141 out 142 children (99.3%) while
immunization against Diphtheria, Pertussis and Whooping cough (DPT) has been completed by 130
children i.e. 91.5 per cent. In case of Hepatitis B dose, 92.3 per cent children have completed their course.
Thus, coverage of these three type of immunization is high among the children of workers’ households
and overall immunization coverage is satisfactory though there is some scope for improvement.
3.11.8 Provider of immunization services:
The status of immunization services is shown in Table 3.11.10 below.
Table 3.11.10: Service provider for Immunization of Child
Type of services Response (Nos.) % share
ICDS Center 69 48.6
Govt. hospital 71 50.0
Others (Pvt. School) 2 1.4
Total 142 100.0
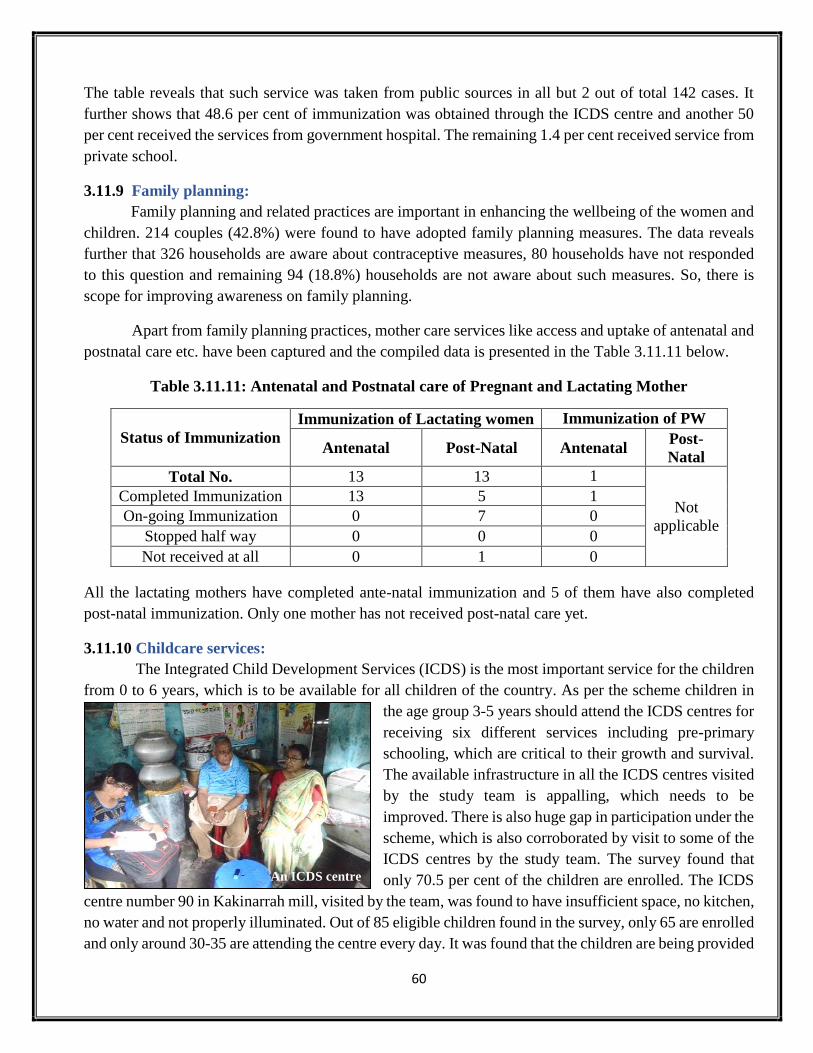
60
The table reveals that such service was taken from public sources in all but 2 out of total 142 cases. It
further shows that 48.6 per cent of immunization was obtained through the ICDS centre and another 50
per cent received the services from government hospital. The remaining 1.4 per cent received service from
private school.
3.11.9 Family planning:
Family planning and related practices are important in enhancing the wellbeing of the women and
children. 214 couples (42.8%) were found to have adopted family planning measures. The data reveals
further that 326 households are aware about contraceptive measures, 80 households have not responded
to this question and remaining 94 (18.8%) households are not aware about such measures. So, there is
scope for improving awareness on family planning.
Apart from family planning practices, mother care services like access and uptake of antenatal and
postnatal care etc. have been captured and the compiled data is presented in the Table 3.11.11 below.
Table 3.11.11: Antenatal and Postnatal care of Pregnant and Lactating Mother
Status of Immunization
Immunization of Lactating women Immunization of PW
Antenatal Post-Natal Antenatal Post-
Natal
Total No. 13 13 1
Not
applicable
Completed Immunization 13 5 1
On-going Immunization 0 7 0
Stopped half way 0 0 0
Not received at all 0 1 0
All the lactating mothers have completed ante-natal immunization and 5 of them have also completed
post-natal immunization. Only one mother has not received post-natal care yet.
3.11.10 Childcare services:
The Integrated Child Development Services (ICDS) is the most important service for the children
from 0 to 6 years, which is to be available for all children of the country. As per the scheme children in
the age group 3-5 years should attend the ICDS centres for
receiving six different services including pre-primary
schooling, which are critical to their growth and survival.
The available infrastructure in all the ICDS centres visited
by the study team is appalling, which needs to be
improved. There is also huge gap in participation under the
scheme, which is also corroborated by visit to some of the
ICDS centres by the study team. The survey found that
only 70.5 per cent of the children are enrolled. The ICDS
centre number 90 in Kakinarrah mill, visited by the team, was found to have insufficient space, no kitchen,
no water and not properly illuminated. Out of 85 eligible children found in the survey, only 65 are enrolled
and only around 30-35 are attending the centre every day. It was found that the children are being provided
An ICDS centre
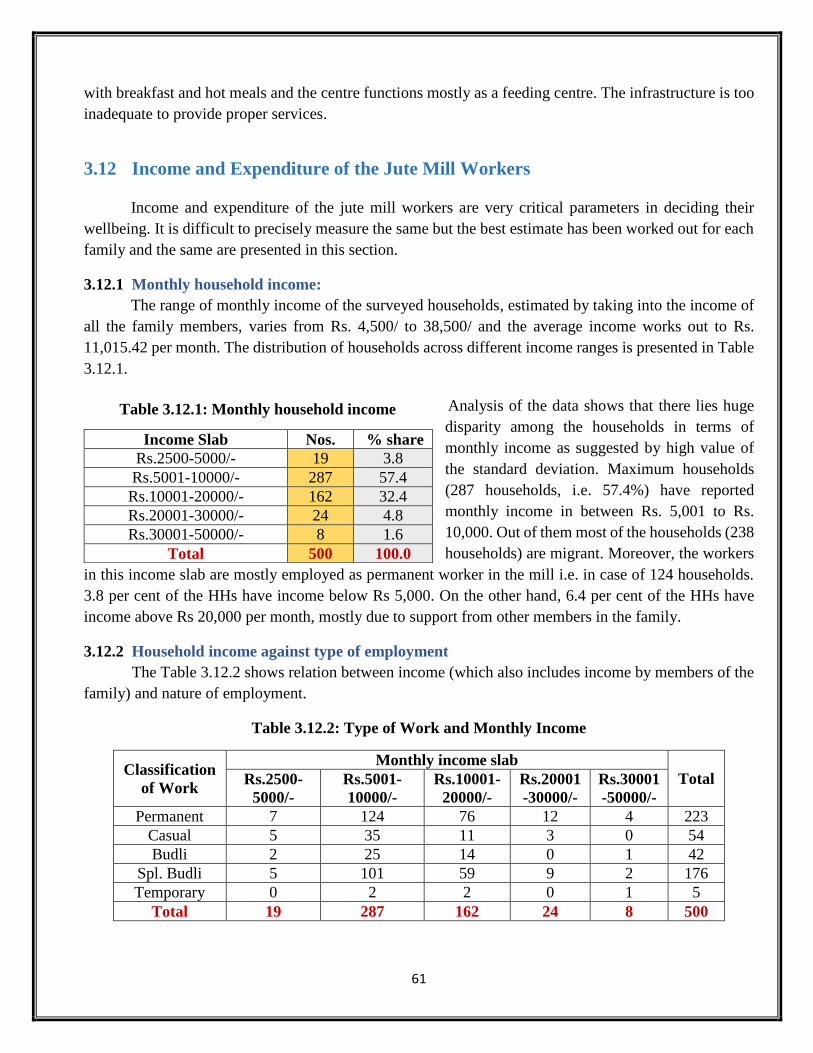
61
with breakfast and hot meals and the centre functions mostly as a feeding centre. The infrastructure is too
inadequate to provide proper services.
3.12 Income and Expenditure of the Jute Mill Workers
Income and expenditure of the jute mill workers are very critical parameters in deciding their
wellbeing. It is difficult to precisely measure the same but the best estimate has been worked out for each
family and the same are presented in this section.
3.12.1 Monthly household income:
The range of monthly income of the surveyed households, estimated by taking into the income of
all the family members, varies from Rs. 4,500/ to 38,500/ and the average income works out to Rs.
11,015.42 per month. The distribution of households across different income ranges is presented in Table
3.12.1.
Analysis of the data shows that there lies huge
disparity among the households in terms of
monthly income as suggested by high value of
the standard deviation. Maximum households
(287 households, i.e. 57.4%) have reported
monthly income in between Rs. 5,001 to Rs.
10,000. Out of them most of the households (238
households) are migrant. Moreover, the workers
in this income slab are mostly employed as permanent worker in the mill i.e. in case of 124 households.
3.8 per cent of the HHs have income below Rs 5,000. On the other hand, 6.4 per cent of the HHs have
income above Rs 20,000 per month, mostly due to support from other members in the family.
3.12.2 Household income against type of employment
The Table 3.12.2 shows relation between income (which also includes income by members of the
family) and nature of employment.
Table 3.12.2: Type of Work and Monthly Income
Classification
of Work
Monthly income slab
Total Rs.2500-
5000/-
Rs.5001-
10000/-
Rs.10001-
20000/-
Rs.20001
-30000/-
Rs.30001
-50000/-
Permanent 7 124 76 12 4 223
Casual 5 35 11 3 0 54
Budli 2 25 14 0 1 42
Spl. Budli 5 101 59 9 2 176
Temporary 0 2 2 0 1 5
Total 19 287 162 24 8 500
Income Slab Nos. % share
Rs.2500-5000/- 19 3.8
Rs.5001-10000/- 287 57.4
Rs.10001-20000/- 162 32.4
Rs.20001-30000/- 24 4.8
Rs.30001-50000/- 8 1.6
Total 500 100.0
Table 3.12.1: Monthly household income
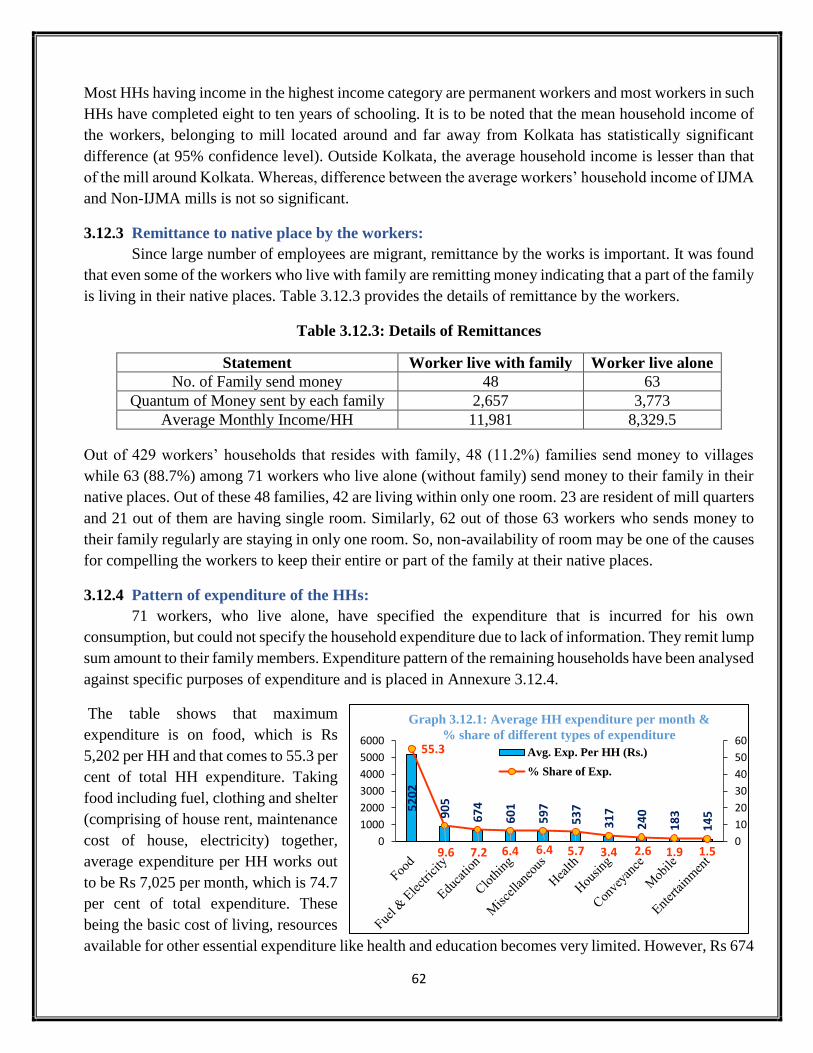
62
Most HHs having income in the highest income category are permanent workers and most workers in such
HHs have completed eight to ten years of schooling. It is to be noted that the mean household income of
the workers, belonging to mill located around and far away from Kolkata has statistically significant
difference (at 95% confidence level). Outside Kolkata, the average household income is lesser than that
of the mill around Kolkata. Whereas, difference between the average workers’ household income of IJMA
and Non-IJMA mills is not so significant.
3.12.3 Remittance to native place by the workers:
Since large number of employees are migrant, remittance by the works is important. It was found
that even some of the workers who live with family are remitting money indicating that a part of the family
is living in their native places. Table 3.12.3 provides the details of remittance by the workers.
Table 3.12.3: Details of Remittances
Statement Worker live with family Worker live alone
No. of Family send money 48 63
Quantum of Money sent by each family 2,657 3,773
Average Monthly Income/HH 11,981 8,329.5
Out of 429 workers’ households that resides with family, 48 (11.2%) families send money to villages
while 63 (88.7%) among 71 workers who live alone (without family) send money to their family in their
native places. Out of these 48 families, 42 are living within only one room. 23 are resident of mill quarters
and 21 out of them are having single room. Similarly, 62 out of those 63 workers who sends money to
their family regularly are staying in only one room. So, non-availability of room may be one of the causes
for compelling the workers to keep their entire or part of the family at their native places.
3.12.4 Pattern of expenditure of the HHs:
71 workers, who live alone, have specified the expenditure that is incurred for his own
consumption, but could not specify the household expenditure due to lack of information. They remit lump
sum amount to their family members. Expenditure pattern of the remaining households have been analysed
against specific purposes of expenditure and is placed in Annexure 3.12.4.
The table shows that maximum
expenditure is on food, which is Rs
5,202 per HH and that comes to 55.3 per
cent of total HH expenditure. Taking
food including fuel, clothing and shelter
(comprising of house rent, maintenance
cost of house, electricity) together,
average expenditure per HH works out
to be Rs 7,025 per month, which is 74.7
per cent of total expenditure. These
being the basic cost of living, resources
available for other essential expenditure like health and education becomes very limited. However, Rs 674
52
02
90
5
67
4
60
1
59
7
53
7
31
7
24
0
18
3
14
5
55.3
9.6 7.2 6.4 6.4 5.7 3.4 2.6 1.9 1.50
10
20
30
40
50
60
0
1000
2000
3000
4000
5000
6000Avg. Exp. Per HH (Rs.)
% Share of Exp.
Graph 3.12.1: Average HH expenditure per month &
% share of different types of expenditure

63
(7.2%) of expenses are made per month on education and Rs 537 (5.7%) is spent per month on health.
Within education component the share of expenses for private tuition is Rs 410 (4.4%), which is rather
high. Even, expenditure on mobile phones is around 2.5 per cent of expenditure, which is also high.
3.13 Household Assets
Possession of assets of daily use is an indicator of the economic status of the household and these
also help in maintaining the quality of life. Availability of common HH assets of the jute mill workers are
presented below in Table 3.13.1.
Table 3.13.1: Household assets owned by the jute mill workers
Type of Assets No. of HHs who
responded
Yes No
Nos. % Nos. %
TV Set 500 344 68.8 156 31.2
Refrigerator 500 68 13.6 432 86.4
Telephone/Mobile Phone 500 474 94.8 26 5.2
Bicycle 500 282 56.4 218 43.6
Motorcycle, Scooter 500 17 3.4 483 96.6
Car/Jeep 500 1 0.2 499 99.8
Computer 500 5 1.0 495 99.0
Internet facility 500 5 1.0 495 99.0
Sewing Machine 500 64 12.8 436 87.2
Electric water purifier 500 2 0.4 498 99.6
Ownership pattern of asset among workers’ households reveals that mobile/telephone (94.8%), TV set
(68.8%) and bicycle (56.4%) are possessed by more than half of the surveyed households irrespective of
any income class as reflected in Table 3.13.1. Hence, these three items could be termed as necessary asset
for the jute mill workers in general. Other two assets viz, refrigerator and sewing machine are showing
increasingly higher percentage of ownership as the income class moves from lowest category to the
highest class of households. This implies that these items are purchased with rise in household income.
These items can be classified as moderately normal necessities in case of surveyed households. Similarly,
motorcycle or scooter, computer and internet facility are available to only 3.4 per cent to 1.0 per cent of
the workers’ households and may be treated more as a luxury good. Remaining two assets i.e. electric
water purifier and car/jeep are only available to 3 out of 500 households. Hence, no conclusion could be
drawn for these two asset regarding the type of economic classification of the asset.
3.14 Indebtedness and Reasons Thereof
The available literature mentions of indebtedness of many of the jute mill workers and, therefore,
special care has been taken to capture the extent of indebtedness, the source from which the loans were
taken, the purpose behind borrowing etc., which are presented in this section.
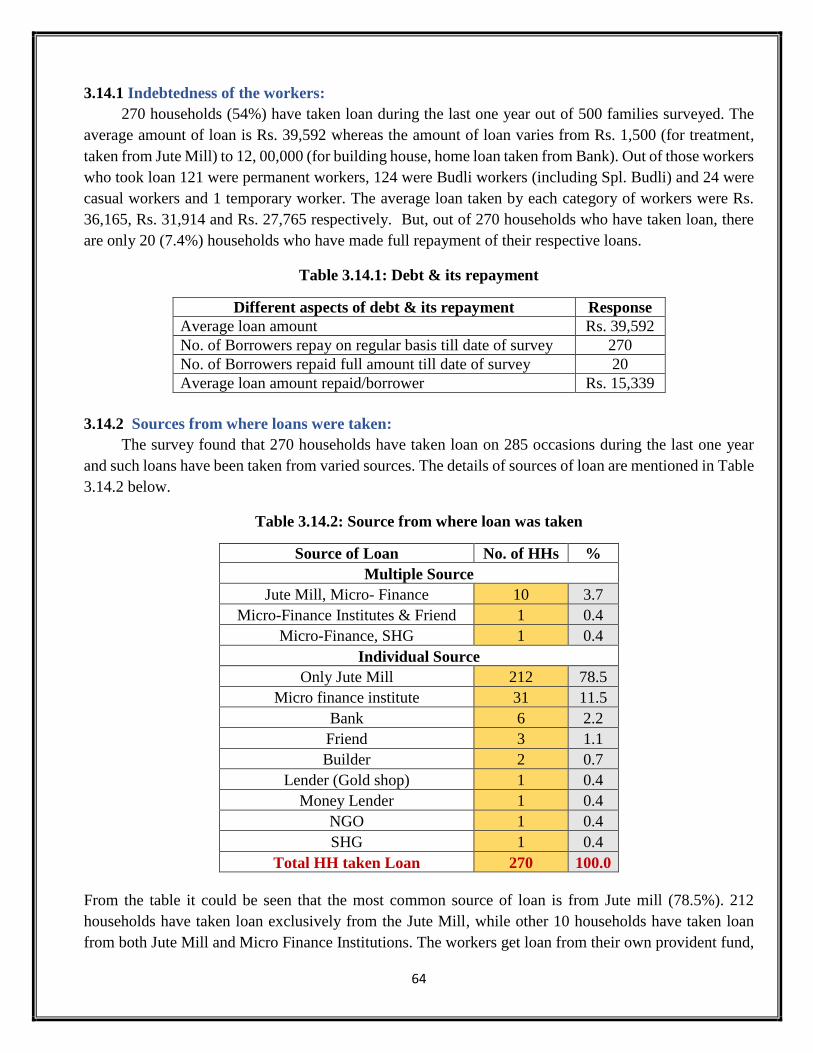
64
3.14.1 Indebtedness of the workers:
270 households (54%) have taken loan during the last one year out of 500 families surveyed. The
average amount of loan is Rs. 39,592 whereas the amount of loan varies from Rs. 1,500 (for treatment,
taken from Jute Mill) to 12, 00,000 (for building house, home loan taken from Bank). Out of those workers
who took loan 121 were permanent workers, 124 were Budli workers (including Spl. Budli) and 24 were
casual workers and 1 temporary worker. The average loan taken by each category of workers were Rs.
36,165, Rs. 31,914 and Rs. 27,765 respectively. But, out of 270 households who have taken loan, there
are only 20 (7.4%) households who have made full repayment of their respective loans.
Table 3.14.1: Debt & its repayment
Different aspects of debt & its repayment Response
Average loan amount Rs. 39,592
No. of Borrowers repay on regular basis till date of survey 270
No. of Borrowers repaid full amount till date of survey 20
Average loan amount repaid/borrower Rs. 15,339
3.14.2 Sources from where loans were taken:
The survey found that 270 households have taken loan on 285 occasions during the last one year
and such loans have been taken from varied sources. The details of sources of loan are mentioned in Table
3.14.2 below.
Table 3.14.2: Source from where loan was taken
Source of Loan No. of HHs %
Multiple Source
Jute Mill, Micro- Finance 10 3.7
Micro-Finance Institutes & Friend 1 0.4
Micro-Finance, SHG 1 0.4
Individual Source
Only Jute Mill 212 78.5
Micro finance institute 31 11.5
Bank 6 2.2
Friend 3 1.1
Builder 2 0.7
Lender (Gold shop) 1 0.4
Money Lender 1 0.4
NGO 1 0.4
SHG 1 0.4
Total HH taken Loan 270 100.0
From the table it could be seen that the most common source of loan is from Jute mill (78.5%). 212
households have taken loan exclusively from the Jute Mill, while other 10 households have taken loan
from both Jute Mill and Micro Finance Institutions. The workers get loan from their own provident fund,
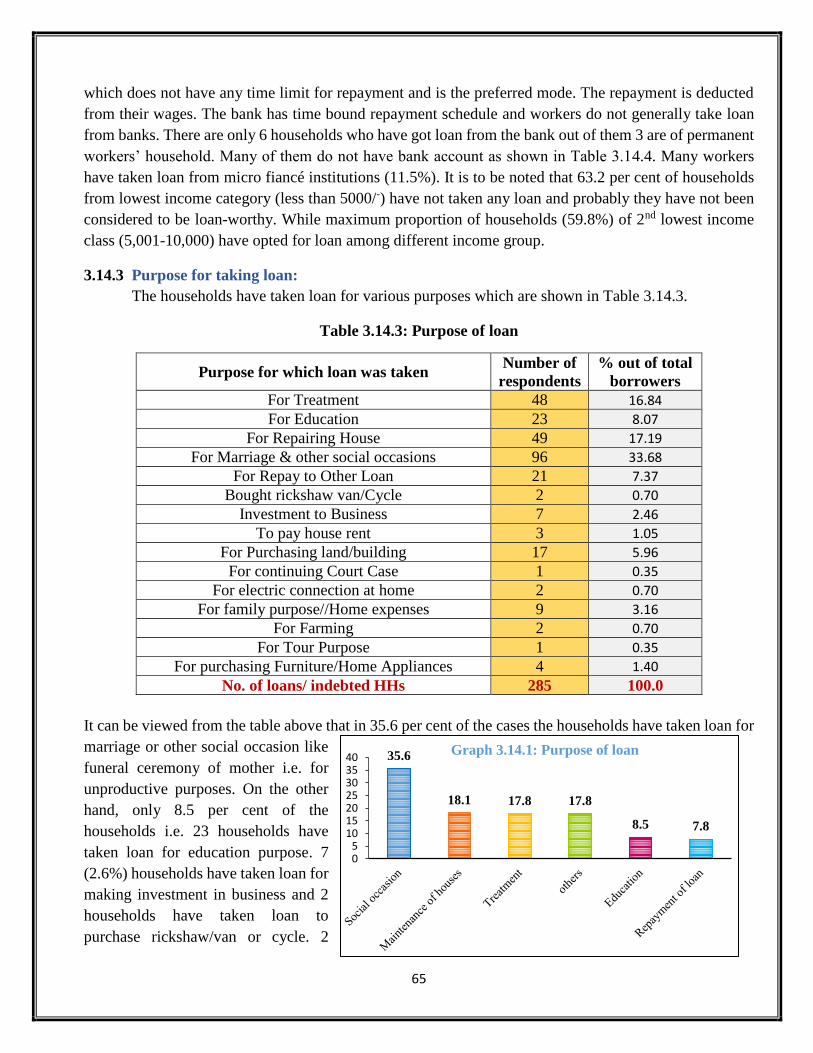
65
which does not have any time limit for repayment and is the preferred mode. The repayment is deducted
from their wages. The bank has time bound repayment schedule and workers do not generally take loan
from banks. There are only 6 households who have got loan from the bank out of them 3 are of permanent
workers’ household. Many of them do not have bank account as shown in Table 3.14.4. Many workers
have taken loan from micro fiancé institutions (11.5%). It is to be noted that 63.2 per cent of households
from lowest income category (less than 5000/-) have not taken any loan and probably they have not been
considered to be loan-worthy. While maximum proportion of households (59.8%) of 2nd lowest income
class (5,001-10,000) have opted for loan among different income group.
3.14.3 Purpose for taking loan:
The households have taken loan for various purposes which are shown in Table 3.14.3.
Table 3.14.3: Purpose of loan
Purpose for which loan was taken Number of
respondents
% out of total
borrowers
For Treatment 48 16.84
For Education 23 8.07
For Repairing House 49 17.19
For Marriage & other social occasions 96 33.68
For Repay to Other Loan 21 7.37
Bought rickshaw van/Cycle 2 0.70
Investment to Business 7 2.46
To pay house rent 3 1.05
For Purchasing land/building 17 5.96
For continuing Court Case 1 0.35
For electric connection at home 2 0.70
For family purpose//Home expenses 9 3.16
For Farming 2 0.70
For Tour Purpose 1 0.35
For purchasing Furniture/Home Appliances 4 1.40
No. of loans/ indebted HHs 285 100.0
It can be viewed from the table above that in 35.6 per cent of the cases the households have taken loan for
marriage or other social occasion like
funeral ceremony of mother i.e. for
unproductive purposes. On the other
hand, only 8.5 per cent of the
households i.e. 23 households have
taken loan for education purpose. 7
(2.6%) households have taken loan for
making investment in business and 2
households have taken loan to
purchase rickshaw/van or cycle. 2
35.6
18.1 17.8 17.8
8.5 7.8
05
10152025303540
Graph 3.14.1: Purpose of loan
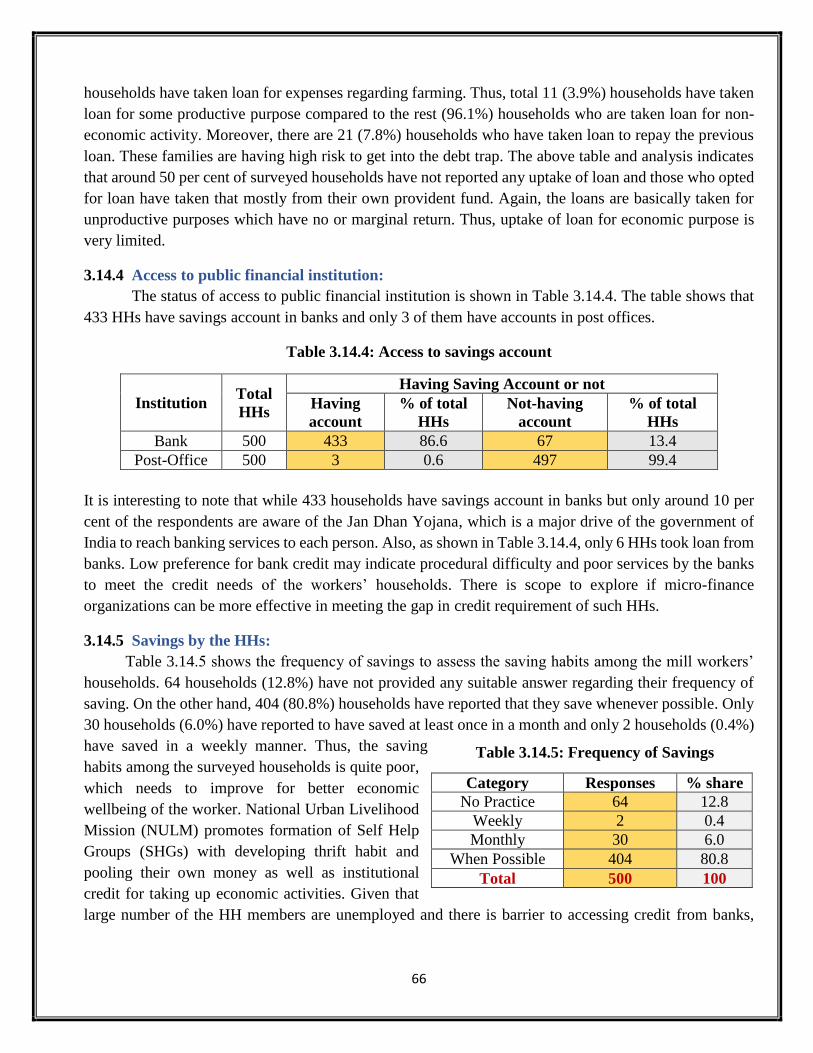
66
households have taken loan for expenses regarding farming. Thus, total 11 (3.9%) households have taken
loan for some productive purpose compared to the rest (96.1%) households who are taken loan for non-
economic activity. Moreover, there are 21 (7.8%) households who have taken loan to repay the previous
loan. These families are having high risk to get into the debt trap. The above table and analysis indicates
that around 50 per cent of surveyed households have not reported any uptake of loan and those who opted
for loan have taken that mostly from their own provident fund. Again, the loans are basically taken for
unproductive purposes which have no or marginal return. Thus, uptake of loan for economic purpose is
very limited.
3.14.4 Access to public financial institution:
The status of access to public financial institution is shown in Table 3.14.4. The table shows that
433 HHs have savings account in banks and only 3 of them have accounts in post offices.
Table 3.14.4: Access to savings account
Institution Total
HHs
Having Saving Account or not
Having
account
% of total
HHs
Not-having
account
% of total
HHs
Bank 500 433 86.6 67 13.4
Post-Office 500 3 0.6 497 99.4
It is interesting to note that while 433 households have savings account in banks but only around 10 per
cent of the respondents are aware of the Jan Dhan Yojana, which is a major drive of the government of
India to reach banking services to each person. Also, as shown in Table 3.14.4, only 6 HHs took loan from
banks. Low preference for bank credit may indicate procedural difficulty and poor services by the banks
to meet the credit needs of the workers’ households. There is scope to explore if micro-finance
organizations can be more effective in meeting the gap in credit requirement of such HHs.
3.14.5 Savings by the HHs:
Table 3.14.5 shows the frequency of savings to assess the saving habits among the mill workers’
households. 64 households (12.8%) have not provided any suitable answer regarding their frequency of
saving. On the other hand, 404 (80.8%) households have reported that they save whenever possible. Only
30 households (6.0%) have reported to have saved at least once in a month and only 2 households (0.4%)
have saved in a weekly manner. Thus, the saving
habits among the surveyed households is quite poor,
which needs to improve for better economic
wellbeing of the worker. National Urban Livelihood
Mission (NULM) promotes formation of Self Help
Groups (SHGs) with developing thrift habit and
pooling their own money as well as institutional
credit for taking up economic activities. Given that
large number of the HH members are unemployed and there is barrier to accessing credit from banks,
Category Responses % share
No Practice 64 12.8
Weekly 2 0.4
Monthly 30 6.0
When Possible 404 80.8
Total 500 100
Table 3.14.5: Frequency of Savings
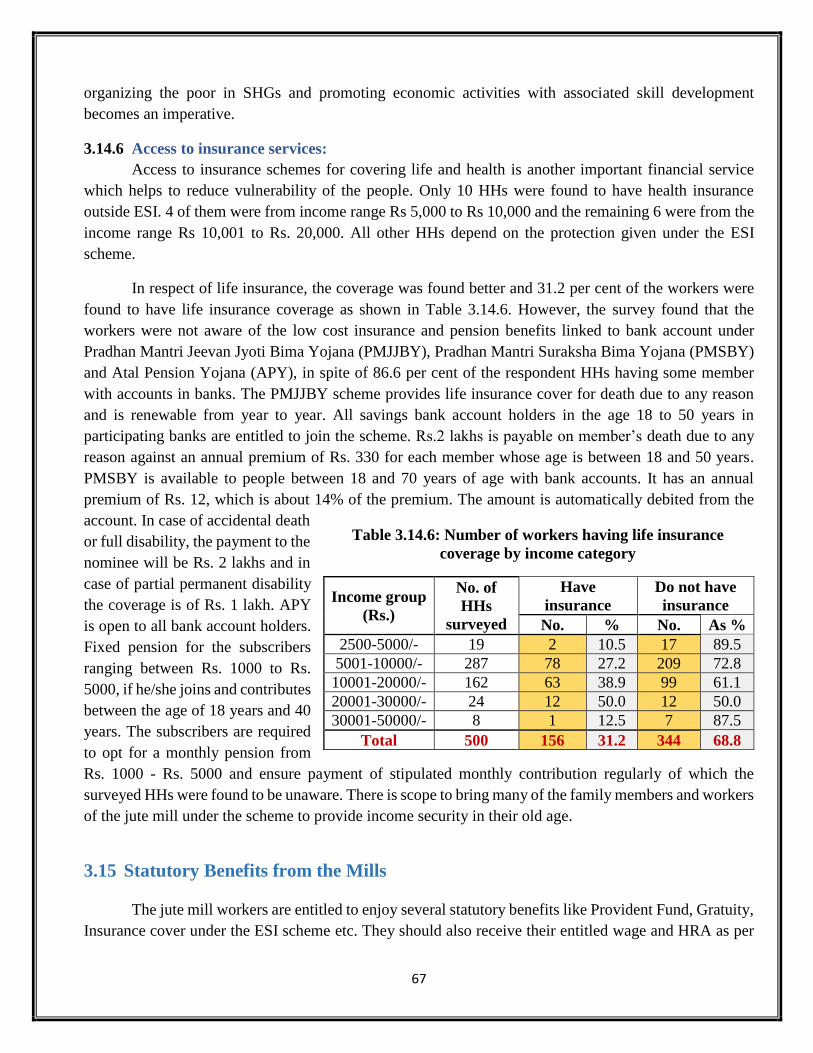
67
organizing the poor in SHGs and promoting economic activities with associated skill development
becomes an imperative.
3.14.6 Access to insurance services:
Access to insurance schemes for covering life and health is another important financial service
which helps to reduce vulnerability of the people. Only 10 HHs were found to have health insurance
outside ESI. 4 of them were from income range Rs 5,000 to Rs 10,000 and the remaining 6 were from the
income range Rs 10,001 to Rs. 20,000. All other HHs depend on the protection given under the ESI
scheme.
In respect of life insurance, the coverage was found better and 31.2 per cent of the workers were
found to have life insurance coverage as shown in Table 3.14.6. However, the survey found that the
workers were not aware of the low cost insurance and pension benefits linked to bank account under
Pradhan Mantri Jeevan Jyoti Bima Yojana (PMJJBY), Pradhan Mantri Suraksha Bima Yojana (PMSBY)
and Atal Pension Yojana (APY), in spite of 86.6 per cent of the respondent HHs having some member
with accounts in banks. The PMJJBY scheme provides life insurance cover for death due to any reason
and is renewable from year to year. All savings bank account holders in the age 18 to 50 years in
participating banks are entitled to join the scheme. Rs.2 lakhs is payable on member’s death due to any
reason against an annual premium of Rs. 330 for each member whose age is between 18 and 50 years.
PMSBY is available to people between 18 and 70 years of age with bank accounts. It has an annual
premium of Rs. 12, which is about 14% of the premium. The amount is automatically debited from the
account. In case of accidental death
or full disability, the payment to the
nominee will be Rs. 2 lakhs and in
case of partial permanent disability
the coverage is of Rs. 1 lakh. APY
is open to all bank account holders.
Fixed pension for the subscribers
ranging between Rs. 1000 to Rs.
5000, if he/she joins and contributes
between the age of 18 years and 40
years. The subscribers are required
to opt for a monthly pension from
Rs. 1000 - Rs. 5000 and ensure payment of stipulated monthly contribution regularly of which the
surveyed HHs were found to be unaware. There is scope to bring many of the family members and workers
of the jute mill under the scheme to provide income security in their old age.
3.15 Statutory Benefits from the Mills
The jute mill workers are entitled to enjoy several statutory benefits like Provident Fund, Gratuity,
Insurance cover under the ESI scheme etc. They should also receive their entitled wage and HRA as per
Income group
(Rs.)
No. of
HHs
surveyed
Have
insurance
Do not have
insurance
No. % No. As %
2500-5000/- 19 2 10.5 17 89.5
5001-10000/- 287 78 27.2 209 72.8
10001-20000/- 162 63 38.9 99 61.1
20001-30000/- 24 12 50.0 12 50.0
30001-50000/- 8 1 12.5 7 87.5
Total 500 156 31.2 344 68.8
Table 3.14.6: Number of workers having life insurance
coverage by income category
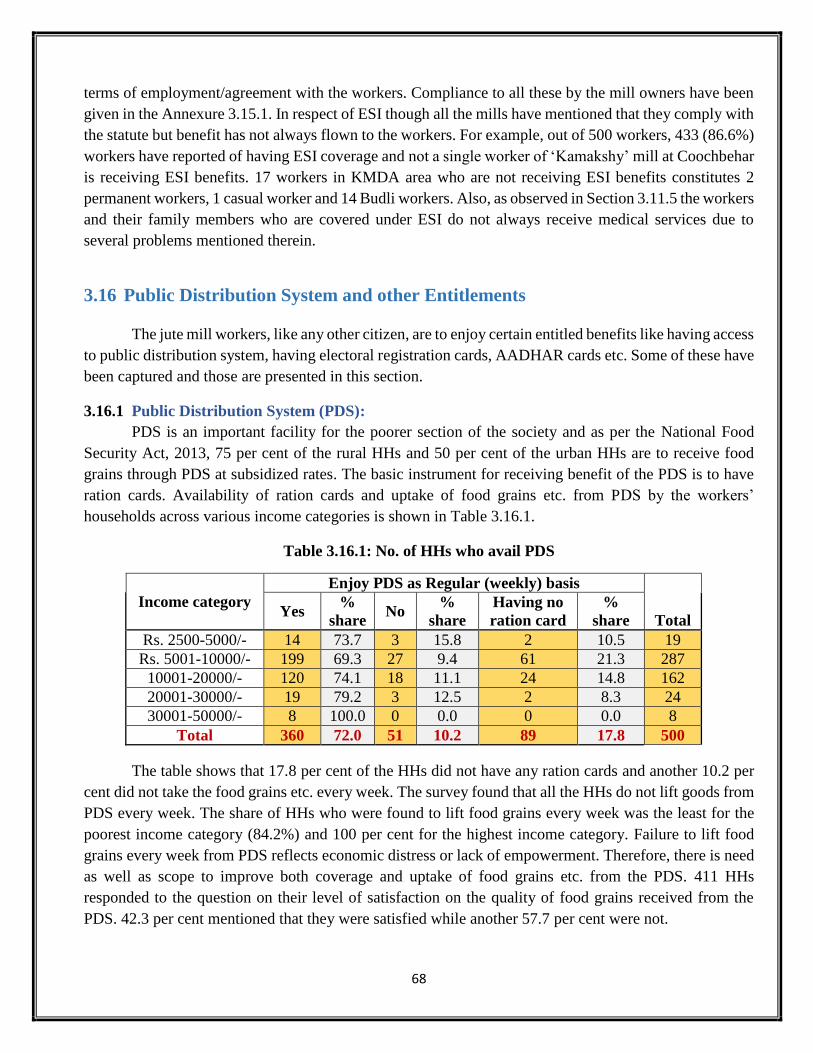
68
terms of employment/agreement with the workers. Compliance to all these by the mill owners have been
given in the Annexure 3.15.1. In respect of ESI though all the mills have mentioned that they comply with
the statute but benefit has not always flown to the workers. For example, out of 500 workers, 433 (86.6%)
workers have reported of having ESI coverage and not a single worker of ‘Kamakshy’ mill at Coochbehar
is receiving ESI benefits. 17 workers in KMDA area who are not receiving ESI benefits constitutes 2
permanent workers, 1 casual worker and 14 Budli workers. Also, as observed in Section 3.11.5 the workers
and their family members who are covered under ESI do not always receive medical services due to
several problems mentioned therein.
3.16 Public Distribution System and other Entitlements
The jute mill workers, like any other citizen, are to enjoy certain entitled benefits like having access
to public distribution system, having electoral registration cards, AADHAR cards etc. Some of these have
been captured and those are presented in this section.
3.16.1 Public Distribution System (PDS):
PDS is an important facility for the poorer section of the society and as per the National Food
Security Act, 2013, 75 per cent of the rural HHs and 50 per cent of the urban HHs are to receive food
grains through PDS at subsidized rates. The basic instrument for receiving benefit of the PDS is to have
ration cards. Availability of ration cards and uptake of food grains etc. from PDS by the workers’
households across various income categories is shown in Table 3.16.1.
Table 3.16.1: No. of HHs who avail PDS
Income category
Enjoy PDS as Regular (weekly) basis
Total Yes
%
share No
%
share
Having no
ration card
%
share
Rs. 2500-5000/- 14 73.7 3 15.8 2 10.5 19
Rs. 5001-10000/- 199 69.3 27 9.4 61 21.3 287
10001-20000/- 120 74.1 18 11.1 24 14.8 162
20001-30000/- 19 79.2 3 12.5 2 8.3 24
30001-50000/- 8 100.0 0 0.0 0 0.0 8
Total 360 72.0 51 10.2 89 17.8 500
The table shows that 17.8 per cent of the HHs did not have any ration cards and another 10.2 per
cent did not take the food grains etc. every week. The survey found that all the HHs do not lift goods from
PDS every week. The share of HHs who were found to lift food grains every week was the least for the
poorest income category (84.2%) and 100 per cent for the highest income category. Failure to lift food
grains every week from PDS reflects economic distress or lack of empowerment. Therefore, there is need
as well as scope to improve both coverage and uptake of food grains etc. from the PDS. 411 HHs
responded to the question on their level of satisfaction on the quality of food grains received from the
PDS. 42.3 per cent mentioned that they were satisfied while another 57.7 per cent were not.
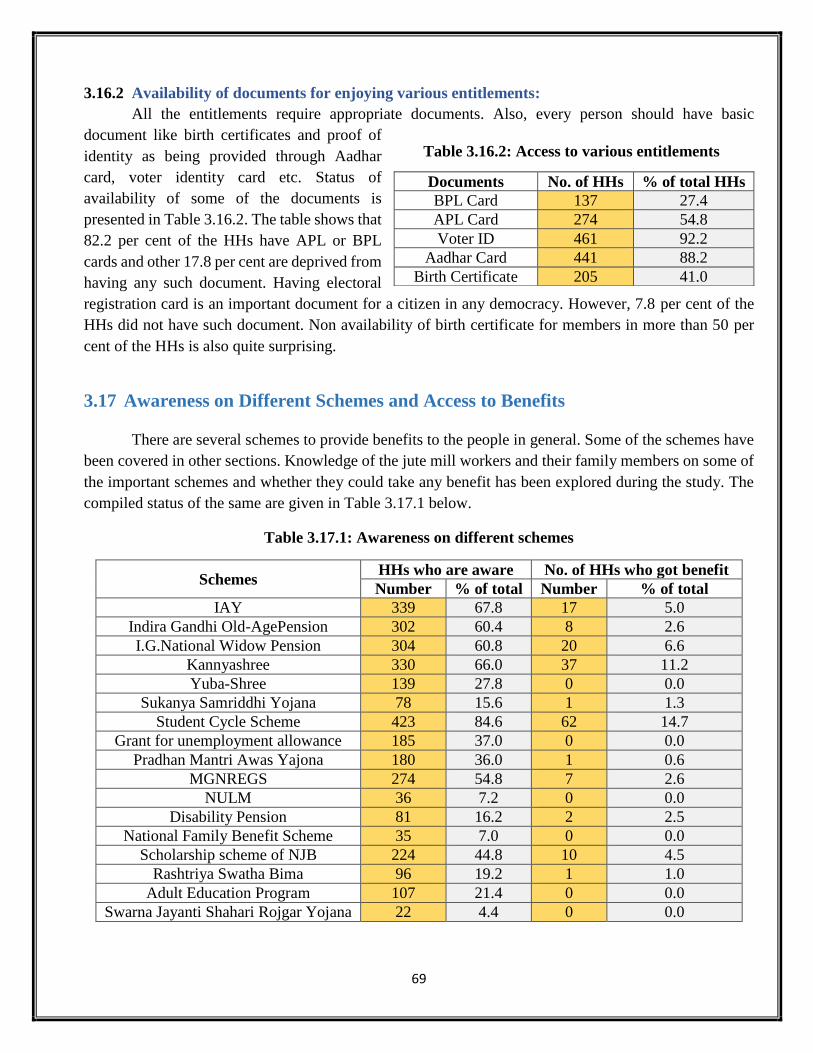
69
3.16.2 Availability of documents for enjoying various entitlements:
All the entitlements require appropriate documents. Also, every person should have basic
document like birth certificates and proof of
identity as being provided through Aadhar
card, voter identity card etc. Status of
availability of some of the documents is
presented in Table 3.16.2. The table shows that
82.2 per cent of the HHs have APL or BPL
cards and other 17.8 per cent are deprived from
having any such document. Having electoral
registration card is an important document for a citizen in any democracy. However, 7.8 per cent of the
HHs did not have such document. Non availability of birth certificate for members in more than 50 per
cent of the HHs is also quite surprising.
3.17 Awareness on Different Schemes and Access to Benefits
There are several schemes to provide benefits to the people in general. Some of the schemes have
been covered in other sections. Knowledge of the jute mill workers and their family members on some of
the important schemes and whether they could take any benefit has been explored during the study. The
compiled status of the same are given in Table 3.17.1 below.
Table 3.17.1: Awareness on different schemes
Schemes HHs who are aware No. of HHs who got benefit
Number % of total Number % of total
IAY 339 67.8 17 5.0
Indira Gandhi Old-AgePension 302 60.4 8 2.6
I.G.National Widow Pension 304 60.8 20 6.6
Kannyashree 330 66.0 37 11.2
Yuba-Shree 139 27.8 0 0.0
Sukanya Samriddhi Yojana 78 15.6 1 1.3
Student Cycle Scheme 423 84.6 62 14.7
Grant for unemployment allowance 185 37.0 0 0.0
Pradhan Mantri Awas Yajona 180 36.0 1 0.6
MGNREGS 274 54.8 7 2.6
NULM 36 7.2 0 0.0
Disability Pension 81 16.2 2 2.5
National Family Benefit Scheme 35 7.0 0 0.0
Scholarship scheme of NJB 224 44.8 10 4.5
Rashtriya Swatha Bima 96 19.2 1 1.0
Adult Education Program 107 21.4 0 0.0
Swarna Jayanti Shahari Rojgar Yojana 22 4.4 0 0.0
Documents No. of HHs % of total HHs
BPL Card 137 27.4
APL Card 274 54.8
Voter ID 461 92.2
Aadhar Card 441 88.2
Birth Certificate 205 41.0
Table 3.16.2: Access to various entitlements
70
The above table shows that the level of awareness varies from 84.6 per cent for student’s cycle
scheme to as low as 4 per cent for Swarna Jayanti Shahari Rojgar Yojana. The scheme has since been
changed to NULM with effect from 1st April 2014 and 45,034 persons of the state have been benefited so
far33 . However, only 7.2 per cent of the respondents were aware of the scheme and there was no
beneficiary. The awareness level is above 60 per cent for schemes like IAY, Indira Gandhi Old-Age
Pension, Indira Gandhi National Widow pension, Kanyashree and student cycle scheme. The level of
awareness, however, is quite low in some of the schemes, like NULM, scholarship scheme of NJB etc.,
which are very relevant for the worker’s HHs. Though it could not be assessed whether benefit flowing to
the eligible persons from jute mill workers’ HHs is at par with that flowing to other sections of the society
living in the same area but it appears that not enough benefits are flowing. For example, not a single family
member of the jute workers has received grant for unemployment allowance. There is substantial demand
side constraint mostly due to ignorance of the workers about the schemes as well as lack of knowledge
about the procedures for accessing the benefits. Therefore, improving awareness about various schemes
relevant for the workers’ HHs and empowering them for receiving due benefit are very important to
enhance wellbeing of the workers and their family members.
3.18 Benefit from the Schemes of NJB
As mentioned in Chapter I, NJB has started two schemes, one on sanitation and the other on education,
for the welfare of the jute mill workers. The jute mills visited are aware of the sanitation scheme and 3 out
of the 8 mills have already received the benefit. One mill has applied to Sulabh International and the
inspection of the mill is awaited. Three other mills have not yet approached to take benefit of the scheme.
Benefits received by the surveyed mills under both the schemes are shown in Annexure 3.18.1. Details of
the benefits drawn so far by different mills have been received from NJB and these are shown in Annexure
3.18.2 & 3.18.3 from which it may be seen that only 44 mills have applied for scholarship scheme and 27
mills have applied for the sanitation scheme. Both from the list of sample mills and total mills, it is seen
that there is lack of awareness regarding these schemes. The mills must be made aware and proper
implementation is required to make the schemes more successful.
Since the sanitary conditions within the mills are far from satisfactory there may be closer watch
on implementation of the scheme.
The list of beneficiaries of the sample mills under the schemes of NJB is given in Annexure 3.18.1,
3.18.2 and 3.18.3 the list of all the beneficiaries are given. From the list of the sample mills it is seen that
the education scheme has been more popular and the benefits are flowing to children of the workers in all
the mills in pursuing their studies. 416 girls and 9 boys from 8 mills have been benefitted from the scheme.
However, the number of beneficiaries have varied widely from 117 (all girls) in Kamarhaty Company
Limited to only 34 (32 girls and 2 boys) in Baranagore jute mill. Table 3.17.1 shows that there is
33 Information collected from State Urban Development Agency
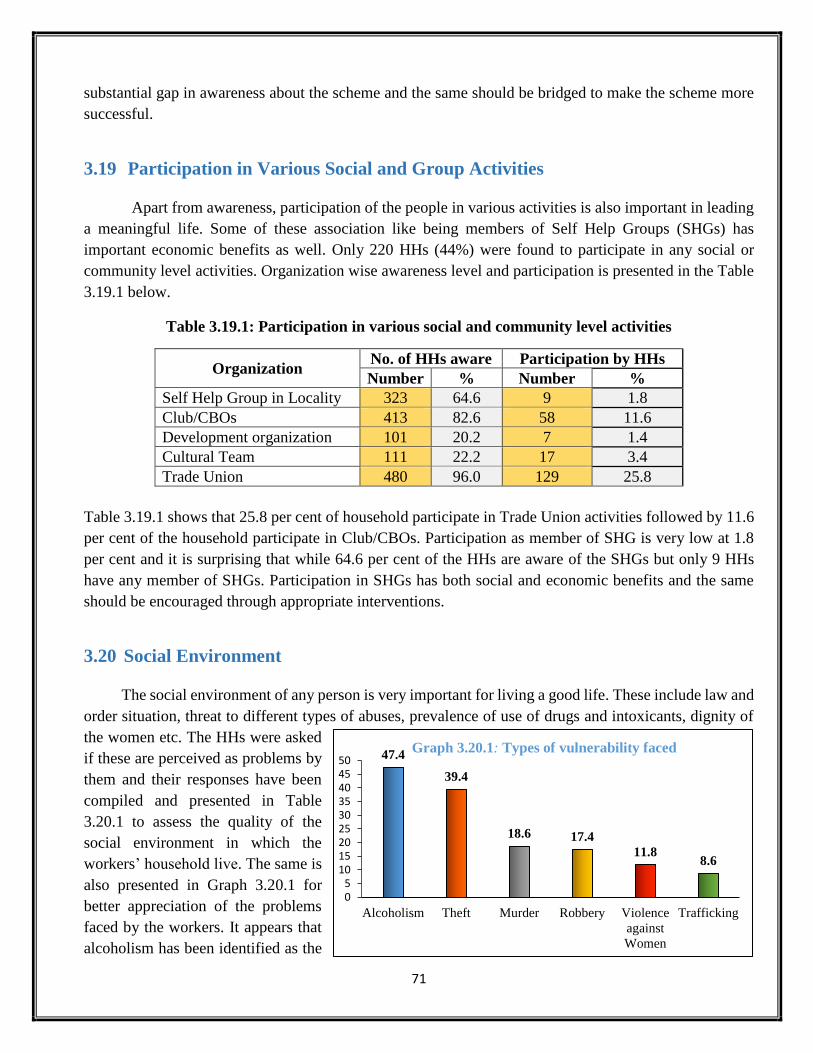
71
substantial gap in awareness about the scheme and the same should be bridged to make the scheme more
successful.
3.19 Participation in Various Social and Group Activities
Apart from awareness, participation of the people in various activities is also important in leading
a meaningful life. Some of these association like being members of Self Help Groups (SHGs) has
important economic benefits as well. Only 220 HHs (44%) were found to participate in any social or
community level activities. Organization wise awareness level and participation is presented in the Table
3.19.1 below.
Table 3.19.1: Participation in various social and community level activities
Organization No. of HHs aware Participation by HHs
Number % Number %
Self Help Group in Locality 323 64.6 9 1.8
Club/CBOs 413 82.6 58 11.6
Development organization 101 20.2 7 1.4
Cultural Team 111 22.2 17 3.4
Trade Union 480 96.0 129 25.8
Table 3.19.1 shows that 25.8 per cent of household participate in Trade Union activities followed by 11.6
per cent of the household participate in Club/CBOs. Participation as member of SHG is very low at 1.8
per cent and it is surprising that while 64.6 per cent of the HHs are aware of the SHGs but only 9 HHs
have any member of SHGs. Participation in SHGs has both social and economic benefits and the same
should be encouraged through appropriate interventions.
3.20 Social Environment
The social environment of any person is very important for living a good life. These include law and
order situation, threat to different types of abuses, prevalence of use of drugs and intoxicants, dignity of
the women etc. The HHs were asked
if these are perceived as problems by
them and their responses have been
compiled and presented in Table
3.20.1 to assess the quality of the
social environment in which the
workers’ household live. The same is
also presented in Graph 3.20.1 for
better appreciation of the problems
faced by the workers. It appears that
alcoholism has been identified as the
47.4
39.4
18.6 17.4
11.88.6
05
101520253035404550
Alcoholism Theft Murder Robbery Violence
against
Women
Trafficking
Graph 3.20.1: Types of vulnerability faced

72
most common problem followed by theft. Violence against women and trafficking are also perceived as
serious problems for which organizing women in SHGs could be a mitigating factor.
Table 3.20.1: Perceived vulnerability from various social evils
Social evils Responses: ‘Very High/Some-what’ As %
Alcoholism 237 47.4
Theft 197 39.4
Murder 93 18.6
Robbery 87 17.4
Violence against Women 59 11.8
Trafficking 43 8.6
3.21 Mills Related Issues
Some of the mill specific issues, particularly those related to industrial relationship have been
obtained from the mill management and those are placed in Table 3.21.1. The responses of the workers
have also been taken for some of the issues like suspension of work.
3.21.1 Suspension of work:
The workers were asked to mention if the work in the mills remained suspended during last one
year. Their responses are presented in Table 3.21.1. 32.4 per cent of them mentioned that the mills faced
suspension during last one
year. As per their response, in
69.1 per cent cases the mills
were suspended only once
during the last one year and in
22 per cent cases the
suspensions took place five
times during the last one year as shown in Table 3.21.2. This reflects high degree of vulnerability of the
workers, which has adverse impact on wellbeing of the households. The millers however have reported of
suspension of work in 3 mills during the last one year. Two of those were closed once and the other one
was closed 4 times.
Table 3.21.2: Number of times the mill remains closed in Last Year
No. of times the mill got closed No. of respondents % share
One time 112 69.1
Two times 3 1.9
Three times 1 0.6
Four times 10 6.2
Five times 36 22.2
Total 162 100.0
Indicators No. of Responses As %
Work in the mill remain suspended at
least once in last 1 year 162 32.4
Not Suspended 338 67.6
Total 500 100.0
Table 3.21.1: Suspension of work in the mills during last one year
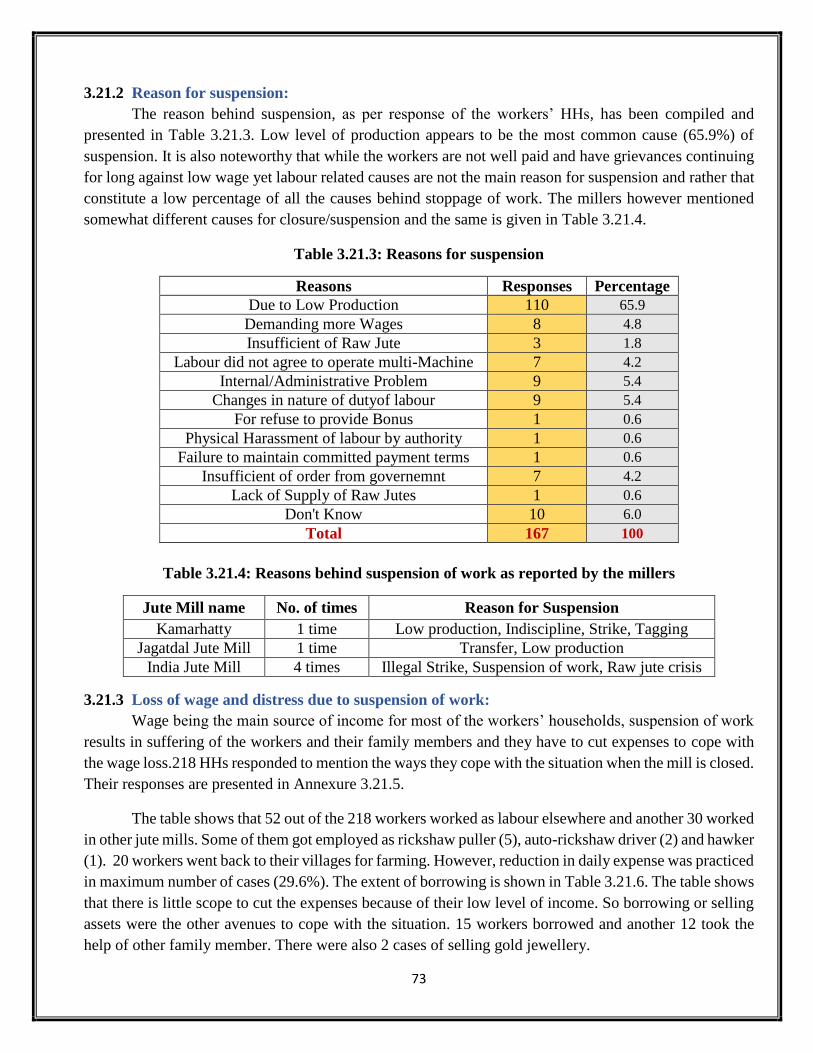
73
3.21.2 Reason for suspension:
The reason behind suspension, as per response of the workers’ HHs, has been compiled and
presented in Table 3.21.3. Low level of production appears to be the most common cause (65.9%) of
suspension. It is also noteworthy that while the workers are not well paid and have grievances continuing
for long against low wage yet labour related causes are not the main reason for suspension and rather that
constitute a low percentage of all the causes behind stoppage of work. The millers however mentioned
somewhat different causes for closure/suspension and the same is given in Table 3.21.4.
Table 3.21.3: Reasons for suspension
Reasons Responses Percentage
Due to Low Production 110 65.9
Demanding more Wages 8 4.8
Insufficient of Raw Jute 3 1.8
Labour did not agree to operate multi-Machine 7 4.2
Internal/Administrative Problem 9 5.4
Changes in nature of dutyof labour 9 5.4
For refuse to provide Bonus 1 0.6
Physical Harassment of labour by authority 1 0.6
Failure to maintain committed payment terms 1 0.6
Insufficient of order from governemnt 7 4.2
Lack of Supply of Raw Jutes 1 0.6
Don't Know 10 6.0
Total 167 100
Table 3.21.4: Reasons behind suspension of work as reported by the millers
3.21.3 Loss of wage and distress due to suspension of work:
Wage being the main source of income for most of the workers’ households, suspension of work
results in suffering of the workers and their family members and they have to cut expenses to cope with
the wage loss.218 HHs responded to mention the ways they cope with the situation when the mill is closed.
Their responses are presented in Annexure 3.21.5.
The table shows that 52 out of the 218 workers worked as labour elsewhere and another 30 worked
in other jute mills. Some of them got employed as rickshaw puller (5), auto-rickshaw driver (2) and hawker
(1). 20 workers went back to their villages for farming. However, reduction in daily expense was practiced
in maximum number of cases (29.6%). The extent of borrowing is shown in Table 3.21.6. The table shows
that there is little scope to cut the expenses because of their low level of income. So borrowing or selling
assets were the other avenues to cope with the situation. 15 workers borrowed and another 12 took the
help of other family member. There were also 2 cases of selling gold jewellery.
Jute Mill name No. of times Reason for Suspension
Kamarhatty 1 time Low production, Indiscipline, Strike, Tagging
Jagatdal Jute Mill 1 time Transfer, Low production
India Jute Mill 4 times Illegal Strike, Suspension of work, Raw jute crisis
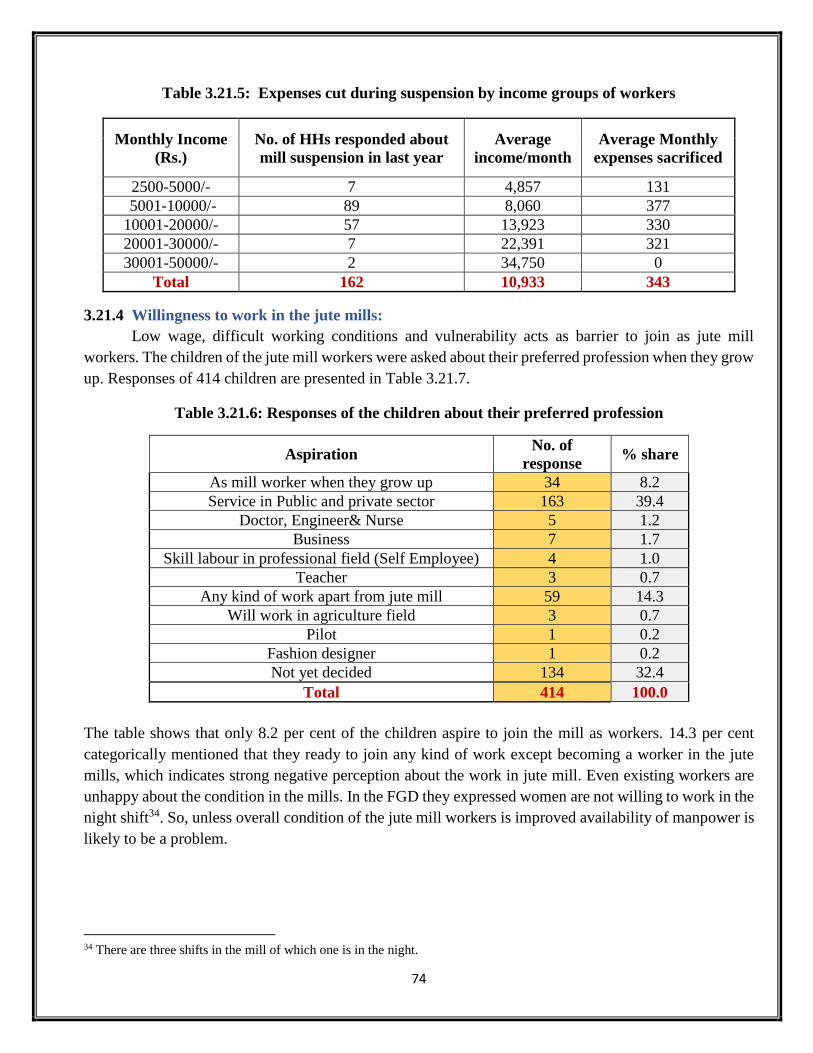
74
Table 3.21.5: Expenses cut during suspension by income groups of workers
Monthly Income
(Rs.)
No. of HHs responded about
mill suspension in last year
Average
income/month
Average Monthly
expenses sacrificed
2500-5000/- 7 4,857 131
5001-10000/- 89 8,060 377
10001-20000/- 57 13,923 330
20001-30000/- 7 22,391 321
30001-50000/- 2 34,750 0
Total 162 10,933 343
3.21.4 Willingness to work in the jute mills:
Low wage, difficult working conditions and vulnerability acts as barrier to join as jute mill
workers. The children of the jute mill workers were asked about their preferred profession when they grow
up. Responses of 414 children are presented in Table 3.21.7.
Table 3.21.6: Responses of the children about their preferred profession
Aspiration No. of
response % share
As mill worker when they grow up 34 8.2
Service in Public and private sector 163 39.4
Doctor, Engineer& Nurse 5 1.2
Business 7 1.7
Skill labour in professional field (Self Employee) 4 1.0
Teacher 3 0.7
Any kind of work apart from jute mill 59 14.3
Will work in agriculture field 3 0.7
Pilot 1 0.2
Fashion designer 1 0.2
Not yet decided 134 32.4
Total 414 100.0
The table shows that only 8.2 per cent of the children aspire to join the mill as workers. 14.3 per cent
categorically mentioned that they ready to join any kind of work except becoming a worker in the jute
mills, which indicates strong negative perception about the work in jute mill. Even existing workers are
unhappy about the condition in the mills. In the FGD they expressed women are not willing to work in the
night shift34. So, unless overall condition of the jute mill workers is improved availability of manpower is
likely to be a problem.
34 There are three shifts in the mill of which one is in the night.
75
Chapter 4
Recommendations
4.1 Introduction
The previous chapter describes the status of the mill workers and their family members in respect
of different aspects of their wellbeing as found in the survey. The analysis brings out several problems
and deprivations faced by the workers of the jute mills and their family members. It is necessary to
intervene appropriately to improve their existing conditions. There are four major stakeholders who can
play a role in this regards as stated below and all should join to make a difference in the lives of the jute
mill workers and their family members:
i. Owners of the jute mills may enhance the economic benefits to the employees and improve
the working environment as well as living conditions in the quarters.
ii. The government at the state and the centre may ensure that all rights, entitlements and
various public services available to any citizen are accessed by the jute mill workers at par
with other citizens. The local governments can also ensure that all civic and other services
are extended to the mill workers residing within their jurisdiction, whether inside or outside
the mill campuses.
iii. The worker and their family members need to empower themselves, which has to be duly
facilitated, for accessing various social and economic services and receiving due benefits.
iv. The National Jute Board, which has the mandate to improve the conditions of the jute mill
workers and their family members.
The spectrum of the need and scope for enhancing wellbeing of the jute mill workers and their
family members is quite vast and that has several dimensions. Many of these are beyond the scope of the
NJB to intervene. Some of those are related to the social structure and the socio-economic ambience in
which the workers are living, which are generally difficult to change through interventions specifically
designed for the jute mill workers. Similarly, enhancement of economic benefits like wage etc., which are
decided through tripartite agreement is beyond the scope of NJB alone for its enhancement. However,
there is scope to negotiate with the mill authorities in improving the working environment and to reduce
the extent of occupational hazard they face. Also, some of the jute mills which are better managed and
financially sound may be persuaded to take up projects for improving conditions of the jute mill workers
directly or in collaboration with the NJB. The focus of the present study is to pick up those issues which
may be easier to address with available resources and may be facilitated by the NJB.
Some of the possible areas of interventions are related to improvement in the amenities and civic
services the workers’ household enjoy in their place of residence. The NJB may take up such matters with
the jute mills as well as with the municipalities concerned in some cases. The other broad areas are the
services for economic development and social justice which the families access from the public utilities
76
or the market like any other citizen. In such cases there is scope to identify the bottlenecks in receiving
due services by the jute mill workers and their family members so as to take up those issues with
appropriate authorities and to facilitate improving service delivery. These include access to education,
vocational training, healthcare, financial services and taking advantage of the existing government
schemes and the market opportunities for economic development. There are special benefits for which
some of the sections of the society like the SC, ST and Minorities are entitled and that could be another
area of possible interventions in improving the wellbeing of those categories of workers. This chapter
discusses only the possible areas of interventions on these specific themes. In some cases, that may require
further exploration for designing the exact interventions as per the local context, which have also been
indicated to the extent possible.
4.2 Improving Living Conditions of the Jute Mill Workers
The condition of housing and related amenities has been found to be quite poor. The minimum
requirement for a household to live a healthy life is to have a room, a separate kitchen and a living space
along with water supply within the premises. 69.5 percent of the families live in one room and the number
of rooms per HH on average works out to be 1.5. Average number of rooms available in the mill quarters
is 1.1 only against 2.2 for owned houses. Also, only 24.2 percent had separate kitchen, which makes living
of the family difficult. The best scenario for having separate kitchen, as found in the study, is that only
47.0 percent of the workers who own houses have kitchens. The worst is those who live in mills in which
case only 7.9 percent have kitchens. Thus, the mill quarters have the poorest amenities in terms of both
number of rooms and availability of kitchens. The quarters were constructed as single rooms when the
worker migrated alone without family and the same has not been upgraded to meet the current
requirement. Even for the economically weaker section, the norm fixed under Pradhan Mantri Awas
Yojana (PMAY) is to have a house with 30 sq. meter floor space and the present floor space available to
the jute mill workers’ HHs living in the mill quarter is well below the same and in most cases that is even
less than 50 per cent of the recommended norm under PMAY. So, there is need to upgrade the basic stock
of housing of the jute mills.
4.2.1 Improving facilities for housing:
(i) Most of the jute mills have land where new houses may be constructed. The mills may be
persuaded to explore if they can take up construction of new quarters with desired amenities and having
minimum 30 sq. meter floor space for the workers. Only around 28 per cent of the workers live in the jute
mills. Construction of quarters with reasonable amenities may attract new workers to ensure supply of
adequate workers for the industry and total number of quarters may be augmented based on demand.
(ii) The other parallel option is to explore who are willing to take the benefit of PMAY and to
facilitate their taking loan to construct new houses. Since 36.2 per cent of the workers have own houses
some of them may improve their houses by taking loan under PMAY for improving their living condition.
It may be mentioned that many of the municipalities where jute mills are located are covered under the
scheme.
77
4.2.2 Improving water supply and its quality:
Availability of water in the jute mills is not a problem as found in the study. However, the present
arrangement for sharing of water in the mill quarters appears to be inconvenient. Given the nature of
quarters, which, in many cases, are actually rows of rooms within a cluster, it may be difficult to do so.
However, it may be worthwhile to request the jute mills to explore the possibility. The quality of water
being supplied is not tested. As per perception of the residents of the quarters nearly 21 per cent are not
satisfied with the quality of water and there is need to test the water quality at the source as well as at the
user end. The mills may be advised to take it up as a good practice and NJB may tie up with the Public
Health Engineering Department of the state government to test the water supplied by the mill on payment
of usual charges. Establishment of a system of monitoring water quality may be adopted to help
maintaining the required quality of water and reducing the burden of water borne diseases.
4.2.3 Improving sanitation facilities:
(i) Poor sanitary conditions have been found to be a major problem in the mills. As the country is
campaigning for ‘Swachh Bharat’ the mills can be persuaded to join the movement by improving
sanitation facilities within the residential quarters as well as in the production area. That also require
changing the attitude towards sanitation and adoption of healthy practices like hand washing with soap.
The possible interventions include improvement in toilet infrastructure, proper solid and liquid waste
management and improvement of menstrual hygiene. The mills may take a drive to improve the toilet
infrastructure and to prevent open or unhygienic mode of defecation completely within the mill premises
including the quarters. Sanitation facilities in the work place may also be improved. Implementation of
the scheme of NJB for improving sanitation both in the residential quarters as well as in the work place
need to be strengthened for extending the benefit in all the mills.
(ii) Plan for liquid waste management and garbage disposal are to be taken up in association with
the municipalities concerned since the same has to be integrated with the overall management plan of
respective municipalities. Negotiations are required to be held with the municipalities concerned for
improving the quality of services which are enjoyed by the residents of the mill quarters. Others who
remain in their own houses or rented houses are difficult to be covered unless they live in a cluster. One
possibility is to identify slums or cluster of houses nearer the mill quarters where good number of workers
live and to take up with the municipalities for improving their services to those houses. However, this will
not be easy till detail information of such clusters are available. The trade unions may be associated with
the task of getting the information quickly. If that is not possible the benefit may be extended to only those
who live within the mills. The recent increase in the flow of funds to the municipalities under the grants
recommended by the 14th Finance Commission and possible benefit of scheme like "Atal Mission for
Rejuvenation and Urban Transformation" (AMRUT), which aims at improvement in urban infrastructure
like water supply, drainage etc. in municipalities in a planned manner, may be explored and the
municipalities may be moved by the mill authorities for that purpose.
(iii) Improvement of menstrual hygiene, particularly for the adolescent girls is an important step
towards improving their health. Possible support from the National Health Mission and suitable
partnership with NGOs working in this field may be explored in this regard.
78
4.2.4 Arrangement for clean fuel:
53 per cent of the workers’ HHs have been found to use LPG for cooking and the coverage is 49
per cent for those with monthly income less than Rs. 10,000. Therefore, affordability is not a major issue.
On the other hand, use of non-clean fuel like coal, fire wood etc. is hazardous to the health of the family
members, particularly when they live in a small and not so well ventilated room and many of them do not
have proper kitchen. NJB may consider taking up a drive through respective mills to assist the HHs in
getting LPG connection. Since the amount to take LPG connection is a one-time requirement, it may be
considered if some incentive can be provided for ensuring complete shifting to clean fuel.
4.3 Education and Skill Development
Investment in education is one of the most important steps towards empowerment and wellbeing
of the people. As the Nobel winning economist James Heckman has observed, “Investing in quality early
childhood development for disadvantaged children from birth through age 5 will help prevent achievement
deficits and produce better education, health, social and economic outcomes. Such investments will reduce
the need for costly remediation and social spending while increasing the value, productivity and earning
potential of individuals. In fact, every dollar invested in quality early childhood development for
disadvantaged children produces a 7 percent to 10 percent return, per child, per year.”35 Keeping the child
deprived of early childhood education is a sure way of ensuring that the family remains poor even in the
succeeding generation and, therefore, the best possible education for the children is an imperative.
However, the situation among jute mill workers is far from satisfactory. As shown in Chapter III, there is
a sharp decline in percentage of the family members who passed beyond middle level schooling. Among
the children in the age group 6-14 years nearly 5.5 percent are out of school and the same increases to
nearly 30 percent in the age group 15-18 years, which is alarming. Also, 33.3 percent of students between
the age group 15-18 years have dropped out of their school to earn money and another 30.8 percent of the
students of the same age group are dropping out for attending household works. From the literature it is
seen that most of students involved in household work are female. 19.4 percent of the students of the age
group 15-18 years are dropping out of school as they don’t want to study and 8.3 percent of the students
of the same age group are leaving their school as they are unable to follow the lessons. It is also noted that
around 66 percent of the households were aware of Kanyashree programme and around 11.2 per cent
households have benefitted from this programme, However, that has not arrested the incidence of drop
outs among the older girl children fully although the incidence of dropping out by girls have become much
lower compared to those of boys. 25.3 per cent of the boys in the age group 15-18 are found to be dropping
out whereas percentage of the same is 16.9 for the girls. It is evident from the analyses that there is need
for more investment in education of the children of the jute mill workers.
4.3.1 Improving uptake of the scholarship scheme:
As mentioned in the Chapter III, only 44.8 per cent of the households are aware of the scholarship
scheme. Therefore, there is need for increasing awareness about the scheme by directly informing all the
35 http://heckmanequation.org/content/starting-ahead-better-catching

79
eligible students for which help of the trade unions may also be sought for. Communication with the
workers/family members should be in both Bengali and Hindi since majority of the workers are found to
be Hindi speaking. High dropout rate among the boys is alarming and all the eligible students may be
covered under the scheme of the NJB to arrest their dropping out of school. Simultaneously, the
Kanyashree scheme may also be popularized among the workers’ HHs and the cases of those who are yet
to be covered may be mediated with the appropriate authorities by the respective jute mills. The progress
may be monitored by the jute mill to ensure that all eligible students are benefitted from the said two
schemes.
4.3.2 Arresting drop out:
The education scheme of the NJB covers students who have passed the secondary examination
and the scheme can only improve continuation of studies beyond that level. It does not help to stop
dropping out of school before completing the secondary level, incidence of which is rather high. NJB may
consider extending the scheme to cover all children of class IX and X, since the dropout rate has been
found to increase several times beyond the age of 14 years. It is also necessary to make the parents aware
about educating their children and to provide possible support at home. The HHs have been found to spend
4.4 percent of their income on private tuition. The mills may be encouraged to organize evening coaching
near the quarters with support from volunteers by giving token remuneration to reduce the burden of
engaging private tutor by the HHs. The children, particularly, those who live in the mill quarter, have only
one room to live, which may not provide the right environment to study. Making provision for a place
within the mill to allow the children to come and study and arranging coaching there on demand may
improve the level of learning of the students. That is likely to prevent drop out and will also help in
improving the level of learning.
4.3.3 Promoting vocational education:
Imparting vocational education is a critical need for enhancing scope for employment and
improving economic condition. As discussed in Chapter III, trainings are being taken by the individuals
from the market and they are incurring an average cost of Rs 16,772 per head, which is 12.7 per cent of
their average annual income. Yet, the result is not encouraging and many such trained persons have not
received employment commensurate with their training. Apparently the workers’ families are not aware
of various schemes for vocational education even though a fairly large number of them are being
administered by various government departments. The National Skill Development Corporation (NSDC)
has also programmes for a) Vocational Training for Women, b) for Disadvantaged Groups: Scheduled
Castes, Scheduled Tribes, Other Backward Classes c) Minorities, d) Persons with Disabilities, e) The
School Drop-Outs and Child labour, f) Economically Challenged: Persons below Poverty Line, etc. These
programmes are being implemented through the Departments of :i) Technical Education & Training, ii)
Labour, iii) Micro & Small Scale Enterprises & Textile, iv) Panchayat & Rural Development; v) Food
Processing & Horticulture Development; vi) Information Technology etc. Labour department also
provides 50 per cent fund assistance to the registered job seekers participating in vocational training. NJB
may negotiate with the National Skill Development Mission as well as the departments concerned of the
state government to enhance the opportunities for vocational training to the children of jute mill workers.
The engineering wing of the jute mills requires skilled persons. The existing employees as well as youth
80
from the family of the jute mill workers may be imparted training to acquire necessary skill using the
existing facilities of the state and the union government. However, linking the families with the schemes
would be beyond the competence of the jute mill authorities or the workers themselves. NJB might
consider engaging a suitable agency / CSOs with specific assignment for building up the capacities of
identified families in accessing these programmes. NJB may also consider providing some financial
assistance, at least on some selected trades having high demand, to persons trained on such trades.
4.4 Improving Services to the Children
Proper growth, physical and cognitive is a critical requirement for human development and the
country is implementing the largest child care programme of the world through the ICDS by delivering
services like nutrition and growth monitoring, feeding and early childhood education etc. through the
ICDS Centres in an integrated manner. However, the study found that only 75.5 per cent of the children
in the age group 3-5 years are enrolled in the ICDS centres and there is little awareness about the
programme and many eligible children are not enrolled. There is need to ensure coverage all children from
0 to 6 years under the ICDS for their growth and survival. At the same time many enrolled children are
not attending the centres regularly for which both awareness of the parents as well as infrastructures of
the ICDS centres are to be improved. The infrastructures of the ICDS centres in the mills is not conducive
to proper child care and the space is usually very inadequate. The ambience is not at all suitable for
attracting the children. Each centre should have adequate space with separate kitchen and arrangement for
water supply and toilet, which hardly exist. NJB may take up with the Department of Women and Child
Development and Social Welfare of the government of West Bengal for strengthening the ICDS
infrastructure and the municipalities may also be approached to participate in the initiative. Improving
infrastructure has to be associated with developing awareness of the parents for sending their children to
the ICDS centre regularly, which may also be done with the support of the officials of the ICDS
directorate.
4.4.1 Improving health of the workers and their family members:
There are several issues related to health of the workers and their family members. The most
important is the high level of morbidity of the workers. That is also leading to more absenteeism of the
jute mill workers and related loss of production, as mentioned in Chapter III. There must be appropriate
interventions for improving the health of the jute mill workers, particularly in preventing diseases by
improving living conditions in the houses as well as in the factories.
4.4.2 Reducing health hazards of the workers:
The jute mill workers face lot of occupational hazards as discussed in Chapter III. The high level
of pollution due to jute dust, absence of proper ventilation etc. was quite apparent on visit to the factories.
The workers complained of body ache probably caused by ergonomic stress. Complaint about unhealthy
environment of particularly the batching unit was also very common. They also mentioned of non-
availability of masks and gloves to protect them. As already mentioned in Chapter III, the jute industries
in the state accounted for 47.7 per cent of all accidents in the factories of West Bengal with 47.06 accidents

81
per 1000 workers in a year. This is alarming and needs to be prevented. It seems that many of the problems
related to high incidence of accidents and disease burden can be overcome to a good extent by simply
following the provisions of the Factory Act, some of which may be supported by the NJB. As mentioned
in the Chapter III, NJB had conducted a detailed study on the occupational hazards. That study suggested
various measures like:
Suppressing noise from machines
To increase awareness among the workers for using face musk for protection against dust while
working,
Ensuring proper ventilation, periodic health checkups and rotation of workers across departments.
There is need to follow up the findings of the study to ensure providing a safer and healthier working
environment to the workers. NJB may also consider organizing camps with support of doctors from ESI
or even private sources to organize regular health camp in the jute mills to check the health of the workers
for possible prevention of diseases and early treatment.
4.4.3 Improving delivery of services from ESI hospitals:
The jute mill workers and their family members are supposed to receive medical care under the
ESI. Though the authorities of the mill mentioned that there is no problem of receiving benefit from the
ESI but the workers and their family members narrated a different story. Their responses have been
analysed in Section 3.11.1 and 3.11.5 of Chapter III, which shows that the percentage of cases in which
they have received medical care from ESI facilities were 34.6 for workers and 20.8 for the family
members. The workers have generally undergone surgeries, some of which are related to injury from
accidents within mill from the ESI, which has increased their share of ESI as a service provider. It seems
that for common diseases they mostly visit private facilities and incur high expenditure. ESI hospitals are
not visited for smaller ailments because of several problems in receiving treatment from the ESI facilities
as mentioned in Chapter III. There has to be improvement of service delivery from the ESI facilities,
which are already overcrowded. The issues may be taken up with ESI authorities to explore possible
solutions. The jute mill worker at Coochbehar do not get any support from ESI and are left largely to their
own resources when it comes to treatment following illness. Attempts may be made to link up the workers
not being served through ESI with Rastriya Swastha Beema Yojana (RSBY).
4.4.4 Intervention for improving health of the family members:
Though the family members have lower incidence of diseases but the same is higher for the aged
and the children. Also, the family members have been found to seek medical care from private sources in
60.2 per cent of the cases and 5.1 per cent of the households’ expenditure has to be made on health. At the
same time, as the Section 3.14.3 shows, that 17.8 per cent cases of all borrowing by the households are
for the purpose of treatment. One possible way out is to make ESI services friendlier, which will encourage
both the workers and the family members to visit the ESI facilities for all types of medical care. The jute
mills having sound finances may be persuaded to organize health camps regularly to take care of the
chronic diseases from which many family members as well as the workers suffer.
82
Since poor living environment and insanitary conditions prevail in many residential areas within
the mill quarters, the other essential step is to improve the quality of housing and sanitation facilities as
mentioned before.
4.5 Facilitating Economic Development
Life is quite uncertain for a jute mill worker with frequent closures and suspensions of work. Since
this situation is a fallout of a combination of many factors beyond the scope of this study and are not likely
to be corrected in the short term, the financial conditions of the workers can only be improved by providing
them with additional sources of income to tide over difficult days. This study revealed that the family
members of the jute mill workers are neither well aware of the opportunities around nor do they have the
capacity to access various schemes that may be helpful in augmenting their income. They are also
somewhat shy or ignorant to take the benefit of various banking and insurances services specially designed
for the poorer sections. The following interventions are possible to enhance access to various financial
services and to augment family income.
4.5.1 Access to banking and insurance services:
The survey found that 13.4 per cent HHs do not have any bank account and 68.8% do not have
any coverage for life insurance. They are generally not aware of the Jan Dhan Yojana. The workers and
other adult members lack knowledge of banking and the mills can increase their general awareness for
which support of the trade unions may be obtained for accessing banking services when needed.
They are also ignorant about the benefit for pension in their old age under the APY, benefit under
PMJJBY for life insurance and that under PMSBY for accidental insurance benefit, all of which are
targeted towards the poor for giving them security. NJB may ask the jute mills to make a survey on how
many adult members of the workers’ HHs are receiving the benefits and to make them aware of the same
as well as to mediate with the banks for giving coverage to the willing persons and at least to all the
workers under the said schemes. Support of the State Level bankers Committee may be taken in this
respect.
4.5.2 Training and coaching the unemployed youths for employment:
There are several schemes, some of them specifically for different sections of the society as
described in other sections, for providing vocational training as well as guiding them to appear in different
examinations for improving their employability. Some of them may also be trained on micro-enterprise
development and guided to set up their own enterprises.
4.5.3 Organizing the women in SHGs and promoting micro-enterprises:
There is a growing movement across the country to organize the people, particularly the women,
in SHGs for empowering them as well as imparting them skill for starting economic activities in groups
or as individual. The movement is strong particularly in rural areas with the support of the Rural
Livelihood Missions at the centre and state levels and family members of jute mill workers living in rural
areas may be benefited by taking advantage of the initiative. However, most of the jute mill workers live
83
in urban areas and the National Urban Livelihood Mission (NULM) has been launched recently for
organizing and empowering the urban poor for strengthening their livelihood. It was observed during the
study that the women members are not generally willing to come forward to join activities in the public
domain and that keeps them disempowered and deprived from many other benefits. There is high potential
as well as return in mobilizing the women members of the jute mill workers and organizing them in SHGs
followed by imparting skill for taking up micro-enterprises. The jute mills may be urged to participate in
the programme and give the women SHGs of the mill some space to meet and conduct affairs of the group.
Many of them can be trained on developing value added jute products, which is being done by several
groups in North 24 Parganas, where large number of mills are located. The jute mills may also think of
supplying them jute based raw materials wherever possible on credit to reduce their level of investment.
Mobilizing women and to form SHGs is a specialized job and NJB may partner with suitable NGOs to
take up such activities against remuneration based on the output of organizing groups and outcome of
augmenting their income. NJB may also take up the issues of receiving due assistance under the NULM
and the municipalities for effective implementation of NULM among the family members of the mill
workers.
4.6 Enhancing Participation in Schemes for Minorities, SC and ST
Share of Muslim, SC and ST among the jute mill workers is around 24 per cent, 15.6 per cent and
2.0 per cent respectively and their social backwardness is a barrier to their economic development by not
being able to take the benefit of several schemes targeted towards them. Empowerment of members of the
said communities and guiding them appropriately may help in flow of desired benefits towards them. NJB
may consider engaging one or more professional NGOs to facilitate the process.
4.6.1 Schemes for the Minorities:
The Minority Affairs and Madrasah Education (MA&ME) Department of the State Government
has several schemes available for these categories of people. These are - a) Educational Loan: (Maximum
Rs.20 lakh for pursuing professional courses like Medical, Engineering, Management, Nursing, Law etc.);
b) Merit-cum-Means Scholarship: (Scholarship up to Rs. 30,000/- (Rs.20000 for Course fee & Rs.10000
maintenance allowance for Hosteller and Rs.5000/- for Day Scholar) per year per student is given for
pursuing professional / technical courses at graduate and post graduate level); c) Post Matric Scholarship:
(Scholarship is given to students for pursuing studies from class XI to PhD.); d) Pre-Matric Scholarship:
(Scholarship is given to students for pursuing studies from class I to X ranging from Rs. 1000/- to 10,700/-
per year); e) Post Matric Stipend (Under Talent Support Programme) f) Haji Md. Mohsin: (One-time
award of Rs. 20,000/- is being provided to Muslim students passing out the Madyamik examination, High
Madrasah and Alim examination in order of merit out of the Endowment Fund of Haji Mohd. Mohsin).
Apart from the formal mainstream education programmes linkages could also be made with different
vocational educational programmes. The important schemes of the MA & ME departments are providing
(i) Vocational Training: (For upgrading the skill in various trades training is conducted mainly through
reputed institutions) and (ii) Job Oriented Coaching. WBMDFC (West Bengal Minorities Finance
84
Development Corporation) also provides coaching for job oriented examination like School Service
Commission, Bank, IBPS training, Police recruitment training etc. to the minorities candidates; call center
training has also been imparted as a part of this coaching scheme. NJB may ask the jute mills to make the
Muslim workers and their family members aware of these schemes and develop partnership with
organization like the WBMFDC or suitable other organization in public/ private sector for facilitating
extension of benefits to the minority.
4.6.2 Schemes for the SCs and the STs:
The following schemes are available for the members of the SC and ST communities.
Centrally Sponsored National Scheme of Incentive to Girls for Secondary Education: The
scheme covers- (i) All SC/ST girls who pass Class VIII and enroll in Class IX in State Govt., Govt.
Aided and Local Body Schools in the academic session 2008-09 onwards, and (ii) All Girls who pass
Class VIII from Kasturba Gandhi Balika Vidyalaya (irrespective from SC/ST or not) and enroll in
Class IX in state government., Govt. Aided and Local Body Schools in the academic session 2008-
09 onwards. The Girl student who are unmarried and below 16 years of age (as on 31st March) on
joining Class-IX will be eligible for the scheme. Under the scheme, a sum of Rs. 3,000/- is deposited
in the name of each eligible Girl student and the student are entitled to withdraw the amount after
reaching 18 years of age.
West Bengal Scheduled Castes and Scheduled Tribes Development and Finance Corporation:
They extends loan to eligible Scheduled Castes students for pursuing full-time professional / technical
/ higher education under "Education Loan Scheme" of National Scheduled Castes Finance and
Development Corporation (NSFDC).
National Means-cum Merit Scholarship Scheme: Introduced by the MHRD for providing with the
scholarship in favour of meritorious students belonging to economically weaker sections to arrest
dropout rate in class VIII. Family Income should not exceed Rs. 1, 50,000/- per year and the students
have to secure at least 55 per cent marks and 50 per cent in case of General and SC/ST/Disabled
students respectively in the Annual Examination of Class VIII.
National Scheduled Caste Finance Development Corporation has several schemes for the scheduled
castes36. The schemes are both credit based and non-credit based. There is a state level agency of
NSCFDC in West Bengal37. Information on the relevant schemes may be disseminated among the SC
jute mill workers.
4.7 Increasing Awareness about various schemes
Pamphlets must be prepared, both in Bengali and Hindi, containing details of the schemes and the
same must be distributed among the workers. Details about the various schemes can be explained
to their children in higher classes since it is seen that the children are more educated. They can
explain the benefits of the schemes to their parents and other family members.
36 More information is available from their website http://www.nsfdc.nic.in 37 More information is available in the website https://wbscstcorp.gov.in
85
Training programs can be conducted in each mills where the workers will be explained about the
benefits of the schemes.
Every mill must have a Welfare Officer for looking after the welfare related issues of the workers.
The existing Welfare Officer must be oriented on all the schemes to enable them to guide the
workers appropriately.
Brief information about some of the important schemes are given in Annexure 4.7.
4.8 Reducing problems faced in accessing various benefits
The workers of Kanknarrah Jute Mills said that the spellings of the name of the workers in the
pay roll is different from that of the spellings in the voter ID, Aadhar or any such documents. As a result,
in most of the cases they are unable to access the schemes. According to them this is a serious obstruction
in the path of receiving benefits from the schemes and this must be taken care of. The mills may be
requested to check with the workers/trade unions about the extent of such problem and to sort those out
in case the problem is of serious nature.
4.9 Improving Access to PDS
The National Food Security Act, 2013 ensures that around 50 per cent of the urban population is
covered with subsidized food grains. In West Bengal the coverage has been further improved through the
Rajya Khadya Suraksha Yojana (RKSY) and ideally almost all the jute mill workers are to be covered
under either of the schemes with same benefit. However, the survey found that 17.8 per cent do not have
ration card (section 3.16.1) and another 10.2 per cent are unable to lift food grains every week. Being
covered under PDS to receive rice at Rs 2/ per kg is an important benefit and all the mill workers should
be covered under the scheme. NJB may consider taking a drive in association with the municipalities
concerned and involving the trade unions to identify those who are yet to have ration cards and to mediate
with the authorities concerned to give them coverage as per scheme guidelines.
4.10 Reducing vulnerability and improving social environment: Section 3.20 in Chapter III describes the social environment in which the jute mill workers live
and the extent of vulnerability they face. These issues cannot be solved in isolation for the jute mill
workers alone. However, organizing the women and empowering them to protest all social evils including
atrocities against women can protect them substantially. It has been already recommended that mobilizing
and empowering the women in SHGs should be an important intervention and they should be specially
sensitized and trained to perceive their united strength in fighting the social evils. The women group get
emboldened by meeting similar groups and discussing their common issues as well as knowing about the
activities of the other groups both for economic development and social justice. This is being done
successfully in many places by federating the women SHGs in to a larger organization and such Federation
may be formed of all the SHGs within a mill or a group of adjoining mills. This will require intense
capacity building and sustained handholding, which requires outsourcing of competent professional
86
organizations. The jute mill authorities and the NJB may collaborate with or engage suitable such
organization to facilitate the process and to motivate them to participate in improving their social
environment with support of all possible allies like the police, government department and other
organizations whose involvement will be helpful in removing the social evils. This intervention will help
in both economic development and social justice including empowering the women to reduce gender
discrimination.
4.11 More Direct Investment towards the Benefit of the Workers’ HHs
The Union Government spent Rs 5589.1 crore during the year 2015-16 in purchasing jute bags so
that the jute mills have adequate order and production may continue. The overall objective is to provide
livelihood to the jute growers and the jute mill workers. However, given the condition of the jute mill
workers there is need for some direct investment for enhancing their wellbeing. Many of the interventions
proposed above does not require huge cost compared to what the government is spending to keep the jute
sector going with the expectation that the jute growers and mill workers will be benefitted. NJB may
consider increasing direct investment towards wellbeing of the jute mill workers.
4.12 Creation of a Cell for Looking after Wellbeing of the Workers’ HHs
The interventions proposed above requires sustained efforts and coordination with many agencies.
There should be some institutional arrangement in the NJB for carrying out these tasks. This will be
possible only if there is a dedicated cell within NJB to plan and implement the interventions as well as to
monitor the impact of the investments to be made in enhancing the wellbeing of the workers and their
family members. NJB may consider to establish the cell with a couple of dedicated officials to remain
exclusively engaged with wellbeing of the workers.
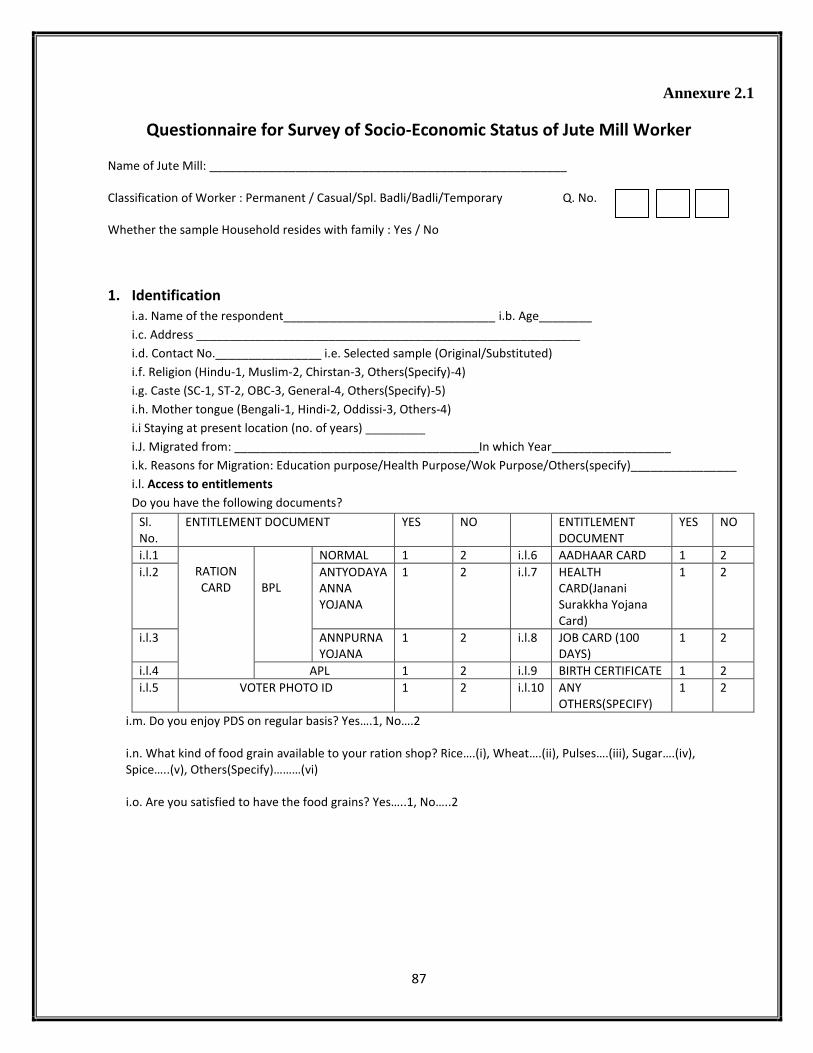
87
Annexure 2.1
Questionnaire for Survey of Socio-Economic Status of Jute Mill Worker
Name of Jute Mill: ______________________________________________________
Classification of Worker : Permanent / Casual/Spl. Badli/Badli/Temporary Q. No.
Whether the sample Household resides with family : Yes / No
1. Identification i.a. Name of the respondent________________________________ i.b. Age________
i.c. Address __________________________________________________________
i.d. Contact No.________________ i.e. Selected sample (Original/Substituted)
i.f. Religion (Hindu-1, Muslim-2, Chirstan-3, Others(Specify)-4)
i.g. Caste (SC-1, ST-2, OBC-3, General-4, Others(Specify)-5)
i.h. Mother tongue (Bengali-1, Hindi-2, Oddissi-3, Others-4)
i.i Staying at present location (no. of years) _________
i.J. Migrated from: _____________________________________In which Year__________________
i.k. Reasons for Migration: Education purpose/Health Purpose/Wok Purpose/Others(specify)________________
i.l. Access to entitlements
Do you have the following documents?
Sl. No.
ENTITLEMENT DOCUMENT YES NO ENTITLEMENT DOCUMENT
YES NO
i.l.1 RATION CARD
BPL
NORMAL 1 2 i.l.6 AADHAAR CARD 1 2
i.l.2 ANTYODAYA ANNA YOJANA
1 2 i.l.7 HEALTH CARD(Janani Surakkha Yojana Card)
1 2
i.l.3 ANNPURNA YOJANA
1 2 i.l.8 JOB CARD (100 DAYS)
1 2
i.l.4 APL 1 2 i.l.9 BIRTH CERTIFICATE 1 2
i.l.5 VOTER PHOTO ID 1 2 i.l.10 ANY OTHERS(SPECIFY)
1 2
i.m. Do you enjoy PDS on regular basis? Yes….1, No….2 i.n. What kind of food grain available to your ration shop? Rice….(i), Wheat….(ii), Pulses….(iii), Sugar….(iv), Spice…..(v), Others(Specify)………(vi) i.o. Are you satisfied to have the food grains? Yes…..1, No…..2
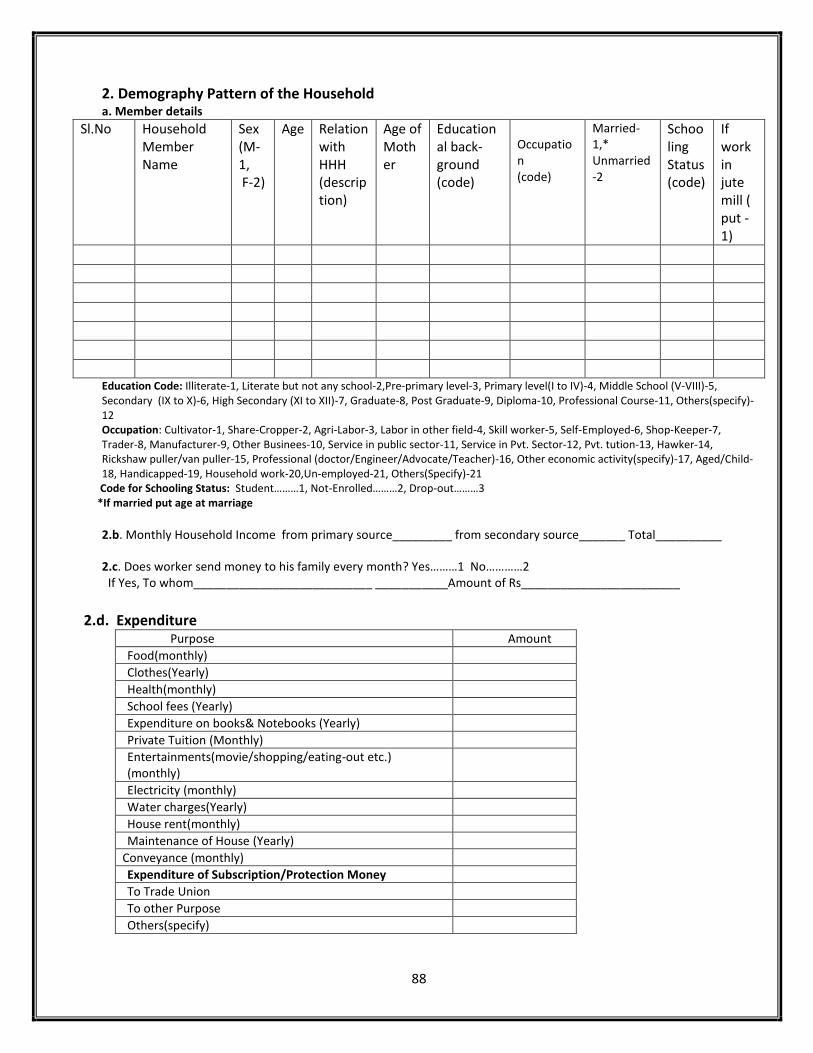
88
2. Demography Pattern of the Household a. Member details
Sl.No Household Member Name
Sex (M-1, F-2)
Age Relation with HHH (description)
Age of Mother
Educational back-ground (code)
Occupation (code)
Married-1,* Unmarried-2
Schooling Status (code)
If work in jute mill ( put -1)
Education Code: Illiterate-1, Literate but not any school-2,Pre-primary level-3, Primary level(I to IV)-4, Middle School (V-VIII)-5, Secondary (IX to X)-6, High Secondary (XI to XII)-7, Graduate-8, Post Graduate-9, Diploma-10, Professional Course-11, Others(specify)-12 Occupation: Cultivator-1, Share-Cropper-2, Agri-Labor-3, Labor in other field-4, Skill worker-5, Self-Employed-6, Shop-Keeper-7, Trader-8, Manufacturer-9, Other Businees-10, Service in public sector-11, Service in Pvt. Sector-12, Pvt. tution-13, Hawker-14, Rickshaw puller/van puller-15, Professional (doctor/Engineer/Advocate/Teacher)-16, Other economic activity(specify)-17, Aged/Child-18, Handicapped-19, Household work-20,Un-employed-21, Others(Specify)-21
Code for Schooling Status: Student………1, Not-Enrolled………2, Drop-out………3 *If married put age at marriage
2.b. Monthly Household Income from primary source_________ from secondary source_______ Total__________
2.c. Does worker send money to his family every month? Yes………1 No…………2 If Yes, To whom___________________________ ___________Amount of Rs________________________
2.d. Expenditure
Purpose Amount
Food(monthly)
Clothes(Yearly)
Health(monthly)
School fees (Yearly)
Expenditure on books& Notebooks (Yearly)
Private Tuition (Monthly)
Entertainments(movie/shopping/eating-out etc.) (monthly)
Electricity (monthly)
Water charges(Yearly)
House rent(monthly)
Maintenance of House (Yearly)
Conveyance (monthly)
Expenditure of Subscription/Protection Money
To Trade Union
To other Purpose
Others(specify)
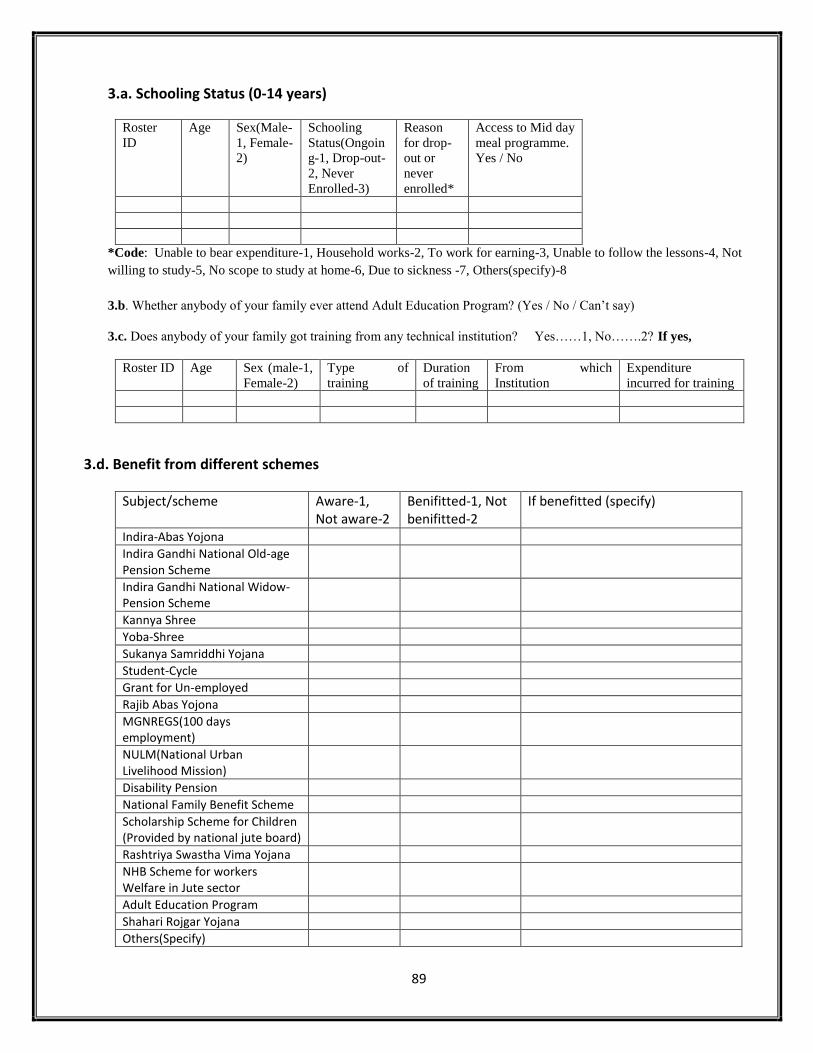
89
3.a. Schooling Status (0-14 years)
Roster
ID
Age Sex(Male-
1, Female-
2)
Schooling
Status(Ongoin
g-1, Drop-out-
2, Never
Enrolled-3)
Reason
for drop-
out or
never
enrolled*
Access to Mid day
meal programme.
Yes / No
*Code: Unable to bear expenditure-1, Household works-2, To work for earning-3, Unable to follow the lessons-4, Not
willing to study-5, No scope to study at home-6, Due to sickness -7, Others(specify)-8
3.b. Whether anybody of your family ever attend Adult Education Program? (Yes / No / Can’t say)
3.c. Does anybody of your family got training from any technical institution? Yes……1, No…….2? If yes,
Roster ID Age Sex (male-1,
Female-2)
Type of
training
Duration
of training
From which
Institution
Expenditure
incurred for training
3.d. Benefit from different schemes
Subject/scheme Aware-1, Not aware-2
Benifitted-1, Not benifitted-2
If benefitted (specify)
Indira-Abas Yojona
Indira Gandhi National Old-age Pension Scheme
Indira Gandhi National Widow-Pension Scheme
Kannya Shree
Yoba-Shree
Sukanya Samriddhi Yojana
Student-Cycle
Grant for Un-employed
Rajib Abas Yojona
MGNREGS(100 days employment)
NULM(National Urban Livelihood Mission)
Disability Pension
National Family Benefit Scheme
Scholarship Scheme for Children (Provided by national jute board)
Rashtriya Swastha Vima Yojana
NHB Scheme for workers Welfare in Jute sector
Adult Education Program
Shahari Rojgar Yojana
Others(Specify)
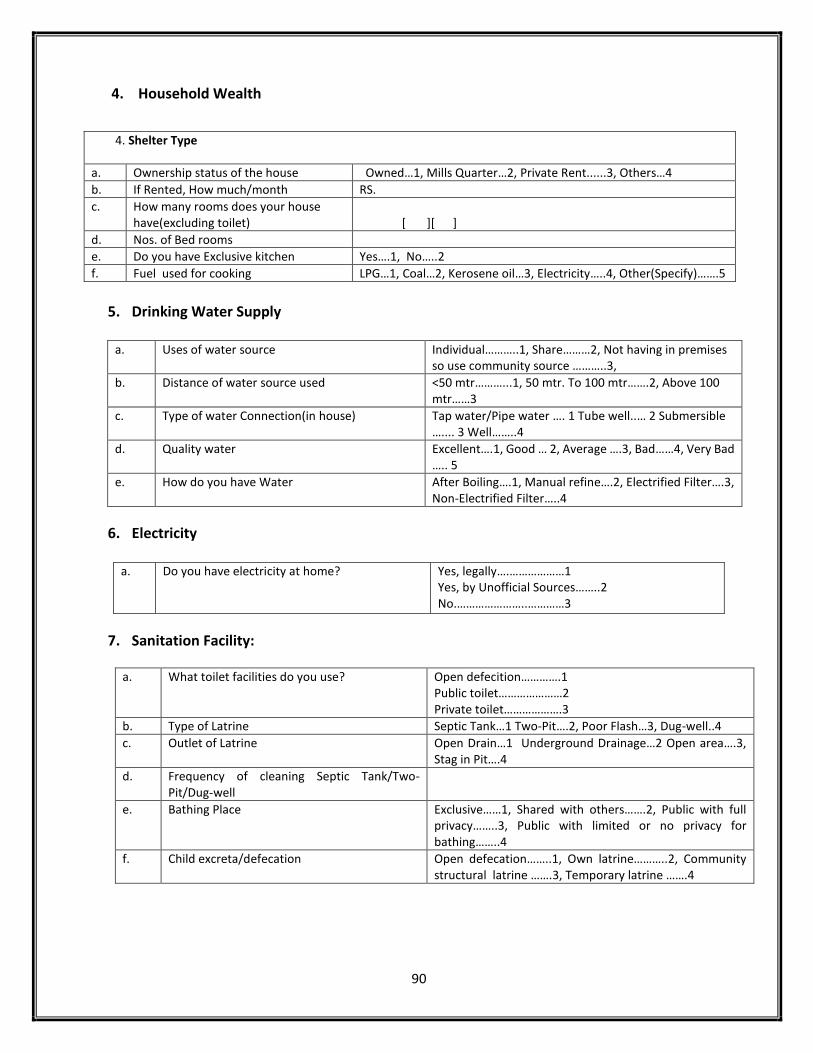
90
4. Household Wealth
5. Drinking Water Supply
a. Uses of water source Individual………..1, Share………2, Not having in premises
so use community source ………..3,
b. Distance of water source used <50 mtr………...1, 50 mtr. To 100 mtr…….2, Above 100 mtr……3
c. Type of water Connection(in house) Tap water/Pipe water …. 1 Tube well..… 2 Submersible ….... 3 Well……..4
d. Quality water Excellent….1, Good … 2, Average ….3, Bad……4, Very Bad ….. 5
e. How do you have Water After Boiling….1, Manual refine….2, Electrified Filter….3, Non-Electrified Filter…..4
6. Electricity
a. Do you have electricity at home? Yes, legally….………………1 Yes, by Unofficial Sources……..2 No.…………………..…………3
7. Sanitation Facility:
a. What toilet facilities do you use? Open defecition………….1 Public toilet…………………2 Private toilet……………….3
b. Type of Latrine Septic Tank…1 Two-Pit….2, Poor Flash…3, Dug-well..4
c. Outlet of Latrine Open Drain…1 Underground Drainage…2 Open area….3, Stag in Pit….4
d. Frequency of cleaning Septic Tank/Two-Pit/Dug-well
e. Bathing Place Exclusive……1, Shared with others…….2, Public with full privacy……..3, Public with limited or no privacy for bathing……..4
f. Child excreta/defecation Open defecation……..1, Own latrine………..2, Community structural latrine …….3, Temporary latrine …….4
4. Shelter Type
a. Ownership status of the house Owned…1, Mills Quarter…2, Private Rent......3, Others…4
b. If Rented, How much/month RS.
c. How many rooms does your house have(excluding toilet)
[ ][ ]
d. Nos. of Bed rooms
e. Do you have Exclusive kitchen Yes….1, No…..2
f. Fuel used for cooking LPG…1, Coal…2, Kerosene oil…3, Electricity…..4, Other(Specify)…….5
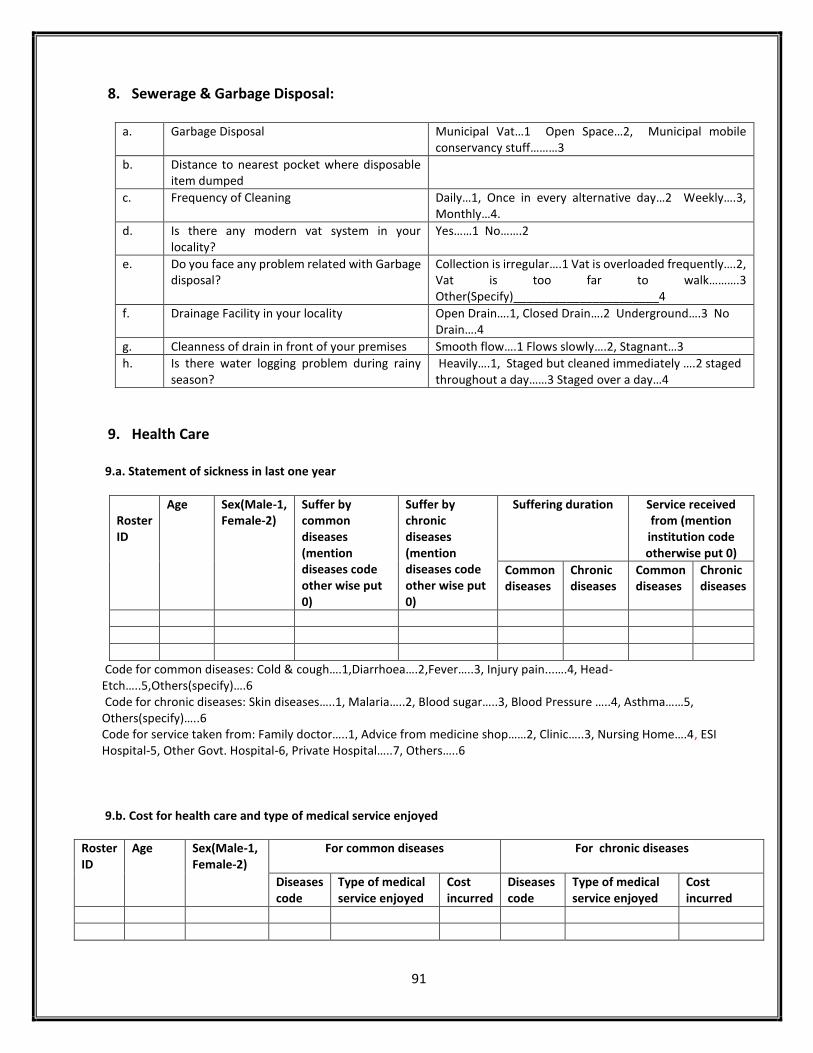
91
8. Sewerage & Garbage Disposal:
a. Garbage Disposal Municipal Vat…1 Open Space…2, Municipal mobile conservancy stuff………3
b. Distance to nearest pocket where disposable item dumped
c. Frequency of Cleaning Daily…1, Once in every alternative day…2 Weekly….3, Monthly…4.
d. Is there any modern vat system in your locality?
Yes……1 No…….2
e. Do you face any problem related with Garbage disposal?
Collection is irregular….1 Vat is overloaded frequently….2, Vat is too far to walk……….3 Other(Specify)______________________4
f. Drainage Facility in your locality Open Drain….1, Closed Drain….2 Underground….3 No Drain….4
g. Cleanness of drain in front of your premises Smooth flow….1 Flows slowly….2, Stagnant…3
h. Is there water logging problem during rainy season?
Heavily….1, Staged but cleaned immediately ….2 staged throughout a day……3 Staged over a day…4
9. Health Care
9.a. Statement of sickness in last one year
Roster ID
Age Sex(Male-1, Female-2)
Suffer by common diseases (mention diseases code other wise put 0)
Suffer by chronic diseases (mention diseases code other wise put 0)
Suffering duration Service received from (mention
institution code otherwise put 0)
Common diseases
Chronic diseases
Common diseases
Chronic diseases
Code for common diseases: Cold & cough….1,Diarrhoea….2,Fever…..3, Injury pain...….4, Head-Etch…..5,Others(specify)….6 Code for chronic diseases: Skin diseases…..1, Malaria…..2, Blood sugar…..3, Blood Pressure …..4, Asthma……5, Others(specify)…..6 Code for service taken from: Family doctor…..1, Advice from medicine shop……2, Clinic…..3, Nursing Home….4, ESI Hospital-5, Other Govt. Hospital-6, Private Hospital…..7, Others…..6
9.b. Cost for health care and type of medical service enjoyed
Roster ID
Age Sex(Male-1, Female-2)
For common diseases For chronic diseases
Diseases code
Type of medical service enjoyed
Cost incurred
Diseases code
Type of medical service enjoyed
Cost incurred
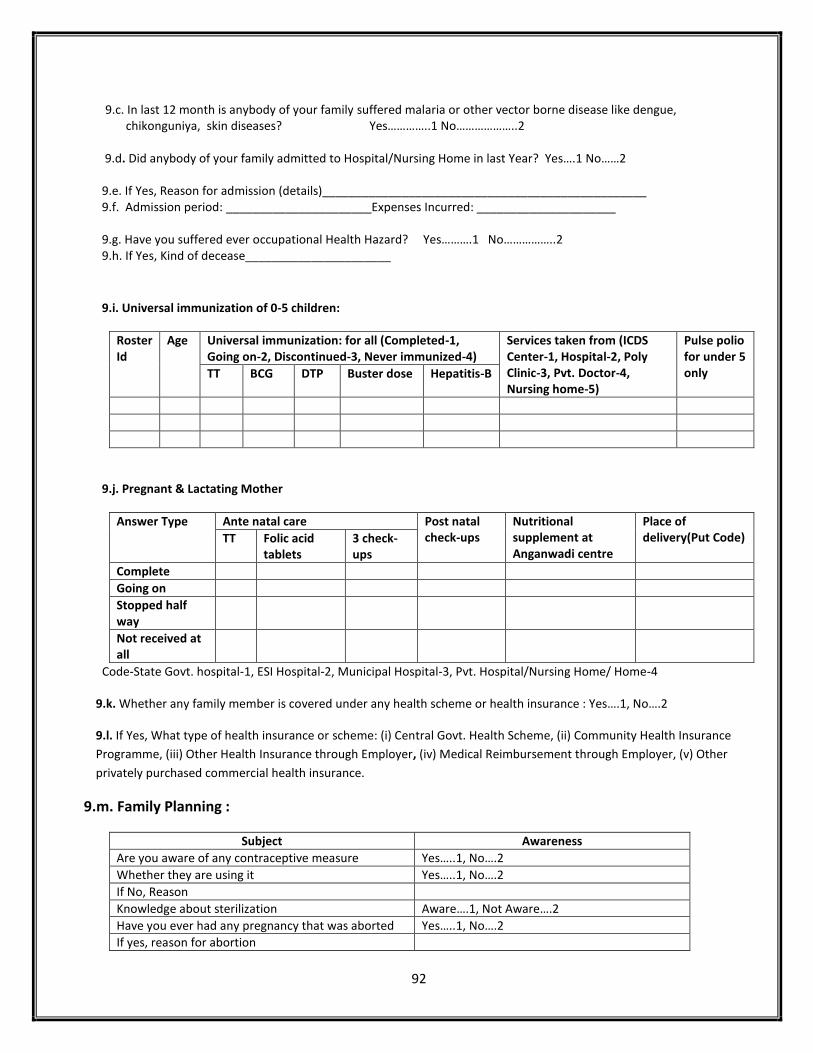
92
9.c. In last 12 month is anybody of your family suffered malaria or other vector borne disease like dengue,
chikonguniya, skin diseases? Yes…………..1 No………………..2 9.d. Did anybody of your family admitted to Hospital/Nursing Home in last Year? Yes….1 No……2 9.e. If Yes, Reason for admission (details)_________________________________________________ 9.f. Admission period: ______________________Expenses Incurred: _____________________ 9.g. Have you suffered ever occupational Health Hazard? Yes……….1 No……………..2 9.h. If Yes, Kind of decease______________________
9.i. Universal immunization of 0-5 children:
Roster Id
Age Universal immunization: for all (Completed-1, Going on-2, Discontinued-3, Never immunized-4)
Services taken from (ICDS Center-1, Hospital-2, Poly Clinic-3, Pvt. Doctor-4, Nursing home-5)
Pulse polio for under 5 only TT BCG DTP Buster dose Hepatitis-B
9.j. Pregnant & Lactating Mother
Answer Type Ante natal care Post natal check-ups
Nutritional supplement at Anganwadi centre
Place of delivery(Put Code) TT Folic acid
tablets 3 check-ups
Complete
Going on
Stopped half way
Not received at all
Code-State Govt. hospital-1, ESI Hospital-2, Municipal Hospital-3, Pvt. Hospital/Nursing Home/ Home-4
9.k. Whether any family member is covered under any health scheme or health insurance : Yes….1, No….2
9.l. If Yes, What type of health insurance or scheme: (i) Central Govt. Health Scheme, (ii) Community Health Insurance
Programme, (iii) Other Health Insurance through Employer, (iv) Medical Reimbursement through Employer, (v) Other
privately purchased commercial health insurance.
9.m. Family Planning :
Subject Awareness
Are you aware of any contraceptive measure Yes…..1, No….2
Whether they are using it Yes…..1, No….2
If No, Reason
Knowledge about sterilization Aware….1, Not Aware….2
Have you ever had any pregnancy that was aborted Yes…..1, No….2
If yes, reason for abortion

93
10. Savings and Debts
a. Is anybody of your family member having any savings account? Bank…..1, Post Office…..2 Other(specify)…..3
b. Practice of savings : Weekly……1Monthly…..2, When Possible…….3, Others(Specify)……4
c. Is anybody of your family member having Life Insurance? Yes….1 No…..2
d. Whether family have loan? Yes…….1 No…..2
e. If Yes, from which Institutions? Bank…..1, Post-Office….2, Private Financer……3, Money Lender…..4,
Friends/Relative…5
Micro-Finance Institutes……6, Chit Fund……….7, Others(Specify)……..8
f. Loan amount: _____________from_____________
g. Repayment till date: Rs.__________________
h. Purpose of loan : For Treatment……1, For Education……..2, Repairing House……..3, Marriage or other Occasion……4
For repay to other loan……5, Others(specify)……………..6
11. Awareness
11.A. Participation in Social Organization/ Activities/ Events
Events Aware-1, Not aware-2,
If aware, Is anybody of your family member (Yes-1, No-2)
Self Help group in your locality
Club/CBOs in your locality
Samity who work for development
Cultural team in your locality
Member of Trade Union Active member……1, Ordinary member……2, No….3
11.A.i. If anybody of your family is member of SHG, When SHG was formed? ______________
ii. Saving of Rs. till date: __________________ iii. Got Bank loan? Yes….1 No……….2
iv. If got Bank Loan, Amount(Rs.)______________, v. Did you get loan from SHG? Yes…..1 No……2
vi. Purpose of loan; ________________
11.B. Awareness of Environment
a. Theft : Very High…..1 Somewhat…..2, Never……..3, Don’tKnow………4
b. Robbery : Very High…..1 Somewhat…..2, Never……..3, Don’tKnow………4
c. Murder : Very High…..1 Somewhat…..2, Never……..3, Don’tKnow………4
d. Violence against women : Very High…..1 Somewhat…..2, Never……..3, Don’tKnow………4
e. Trafficking : Very High…..1 Somewhat…..2, Never……..3, Don’tKnow………4
f. Alcoholism : Very High…..1 Somewhat…..2, Never……..3, Don’tKnow………4

94
12. About Jute Mill
A. If the Mill had any closer/suspension of works : Yes….1, No….2 B. (i) If yes, give the reason :_____________________________________________________________
(ii) How many times in the last one year the Mill was under suspension?________________
(iii) Amount of expenditures that were sacrificed for suspension/ closer of the Mill ? Rs.__________/- (iv) Amount of debt taken for the period of suspension of the mill Rs._____________/-
(v) How to overcome the situation________________________________________________________ ______________________________________________________________________________________. C. Did you absent your duty in last year for any reasons? (Yes…1, No….2)
If yes, then reason , type of problem: (a) Disease. (b) Problems in the mill, (c) Visit to native place (d) Others(Specify)_________________________
D.If response is (b) then give the details for problem in the Mill_____________________________________ E. Did you find alternative scope of work when Mill was closed? Yes…………1 No………..2 F. If Yes, Work type___________________________ G. Aspiration on your child : (i)As Mill worker when they grow up, (ii)Others Profession_____________ H. If response (ii), Reason for not-willing as a Mill worker___________________________________________
______________________________________________________________________________________
I. Do you have ESI coverage? Yes….1, No….2 If Yes, (i) how many family members have been covered?____________________ (ii) Benefits received from ESI in last one year : (a) Outdoor treatment, (b) Medicine, (c) Diagnostic service & (d) Indoor services (iii) Difficulty, if any, faced in accessing services from ESI
13. Household Assets
a. Please tell me whether the household has the following items YES NO If yes, How many?
1 2 3 4 5 6 7 8 9 10
TV Set………………………………………………… Refrigerator………………………………………. Telephone/Mobile Phone………………… Bicycle………………………………………………… Motorcycle, Moped or Scooter…………. Car/Jeep……………………………………………. Computer………………………………………… Internet facility………………………………… Sewing machine………………………………. Aquaguard
1 1 1 1 1
2 2 2 2 2
XX [ ] [ ] [ ] [ ] [ ] [ ]
XX
1 1 1 1 1
2 2 2 2 2
[ ] [ ] [ ] [ ]
XX [ ] [ ] [ ] [ ]
Name of Investigator:______________________ Back-Checked By :__________________________________ date_____________
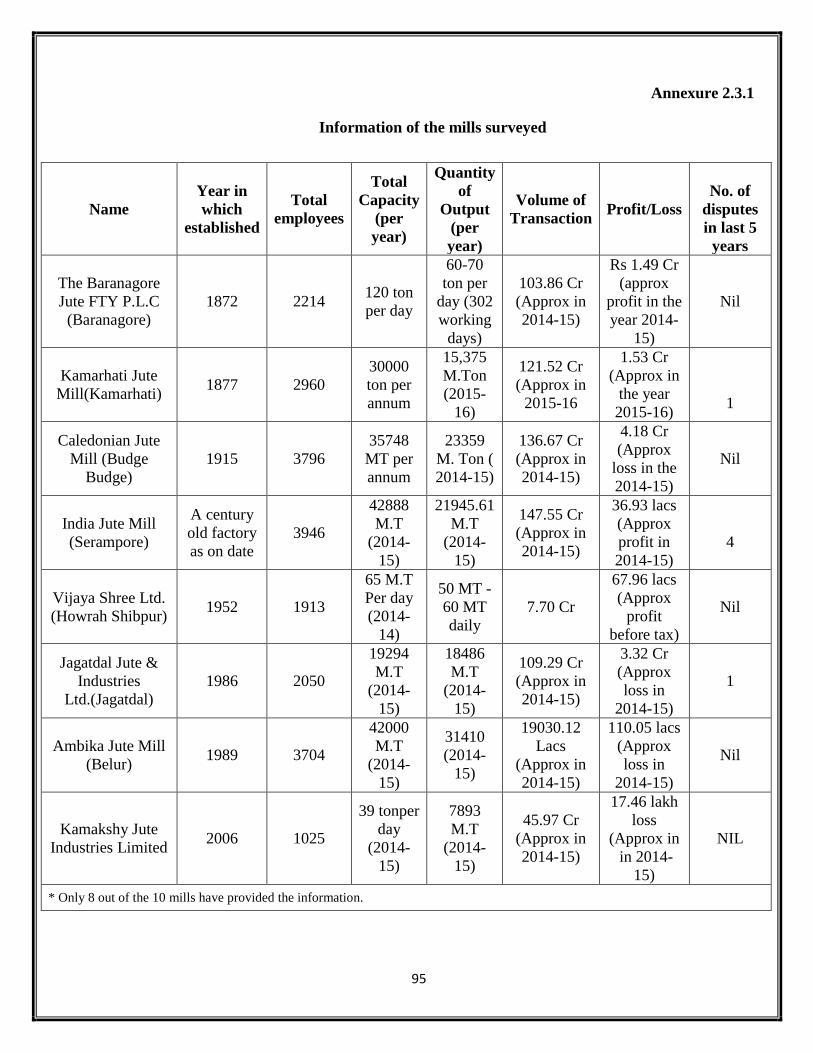
95
Annexure 2.3.1
Information of the mills surveyed
Name
Year in
which
established
Total
employees
Total
Capacity
(per
year)
Quantity
of
Output
(per
year)
Volume of
Transaction Profit/Loss
No. of
disputes
in last 5
years
The Baranagore
Jute FTY P.L.C
(Baranagore)
1872 2214 120 ton
per day
60-70
ton per
day (302
working
days)
103.86 Cr
(Approx in
2014-15)
Rs 1.49 Cr
(approx
profit in the
year 2014-
15)
Nil
Kamarhati Jute
Mill(Kamarhati) 1877 2960
30000
ton per
annum
15,375
M.Ton
(2015-
16)
121.52 Cr
(Approx in
2015-16
1.53 Cr
(Approx in
the year
2015-16)
1
Caledonian Jute
Mill (Budge
Budge)
1915 3796
35748
MT per
annum
23359
M. Ton (
2014-15)
136.67 Cr
(Approx in
2014-15)
4.18 Cr
(Approx
loss in the
2014-15)
Nil
India Jute Mill
(Serampore)
A century
old factory
as on date
3946
42888
M.T
(2014-
15)
21945.61
M.T
(2014-
15)
147.55 Cr
(Approx in
2014-15)
36.93 lacs
(Approx
profit in
2014-15)
4
Vijaya Shree Ltd.
(Howrah Shibpur) 1952 1913
65 M.T
Per day
(2014-
14)
50 MT -
60 MT
daily
7.70 Cr
67.96 lacs
(Approx
profit
before tax)
Nil
Jagatdal Jute &
Industries
Ltd.(Jagatdal)
1986 2050
19294
M.T
(2014-
15)
18486
M.T
(2014-
15)
109.29 Cr
(Approx in
2014-15)
3.32 Cr
(Approx
loss in
2014-15)
1
Ambika Jute Mill
(Belur) 1989 3704
42000
M.T
(2014-
15)
31410
(2014-
15)
19030.12
Lacs
(Approx in
2014-15)
110.05 lacs
(Approx
loss in
2014-15)
Nil
Kamakshy Jute
Industries Limited 2006 1025
39 tonper
day
(2014-
15)
7893
M.T
(2014-
15)
45.97 Cr
(Approx in
2014-15)
17.46 lakh
loss
(Approx in
in 2014-
15)
NIL
* Only 8 out of the 10 mills have provided the information.
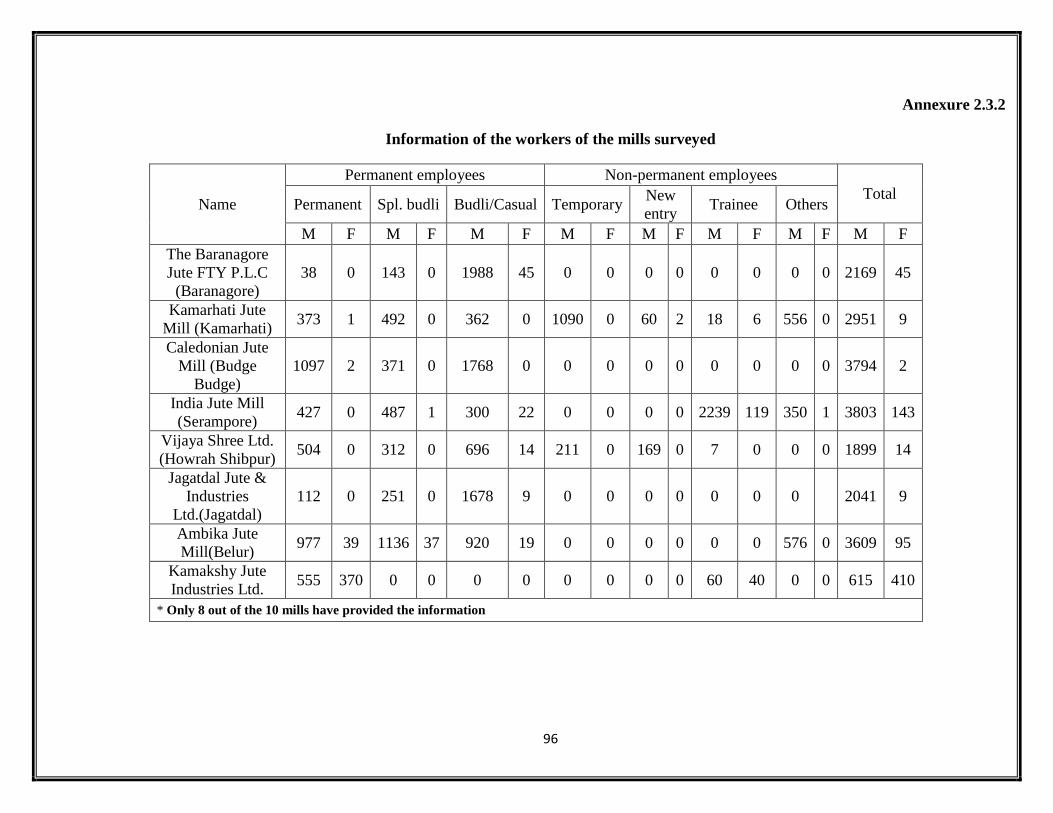
96
Annexure 2.3.2
Information of the workers of the mills surveyed
Name
Permanent employees Non-permanent employees
Total Permanent Spl. budli Budli/Casual Temporary
New
entry Trainee Others
M F M F M F M F M F M F M F M F
The Baranagore
Jute FTY P.L.C
(Baranagore)
38 0 143 0 1988 45 0 0 0 0 0 0 0 0 2169 45
Kamarhati Jute
Mill (Kamarhati) 373 1 492 0 362 0 1090 0 60 2 18 6 556 0 2951 9
Caledonian Jute
Mill (Budge
Budge)
1097 2 371 0 1768 0 0 0 0 0 0 0 0 0 3794 2
India Jute Mill
(Serampore) 427 0 487 1 300 22 0 0 0 0 2239 119 350 1 3803 143
Vijaya Shree Ltd.
(Howrah Shibpur) 504 0 312 0 696 14 211 0 169 0 7 0 0 0 1899 14
Jagatdal Jute &
Industries
Ltd.(Jagatdal)
112 0 251 0 1678 9 0 0 0 0 0 0 0 2041 9
Ambika Jute
Mill(Belur) 977 39 1136 37 920 19 0 0 0 0 0 0 576 0 3609 95
Kamakshy Jute
Industries Ltd. 555 370 0 0 0 0 0 0 0 0 60 40 0 0 615 410
* Only 8 out of the 10 mills have provided the information

97
Annexure 3.10.1
Vocational Training
Name of worker
Relation
with
worker
Age Sex Education Type of
training
Training
duration Expenses
Whether
he/she
having
economic
occupation
If yes, type of
occupation
GhousAlam Daughter 18 Female Middle
School
Computer
Application 6 months 20000 No
GhousAlam Daughter 17 Female Secondary Computer
Application 1 year 70000 No
Anwar Ali Self 34 Male Middle
School Tailoring 6 months 17000 Yes Skill Worker
Punwasi Thakur Son 21 Male Professional
Course ITI
1year 6
months 65000 No
Faruk Brother 27 Male High
Secondary
Personality
development 3 months 3500 Yes
Labor in other
field
Amir Hussain Son 24 Male High
Secondary
Computer
Application 6 months 1200 No
Abdul Wahal Son 19 Male High
Secondary
Air-Conditioner
& Refrigerator 6 months 6000 No
Alok Kumar Dey Daughter 20 Female High
Secondary
Computer
Application 9 months 2000 No
Iqbal Ahmed Wife 36 Female Secondary Computer
Application 3 months 600 No
MD. Salauddin Brother 18 Male Middle
School
Marble
Designing 1 year 4000 Yes Share-Cropper
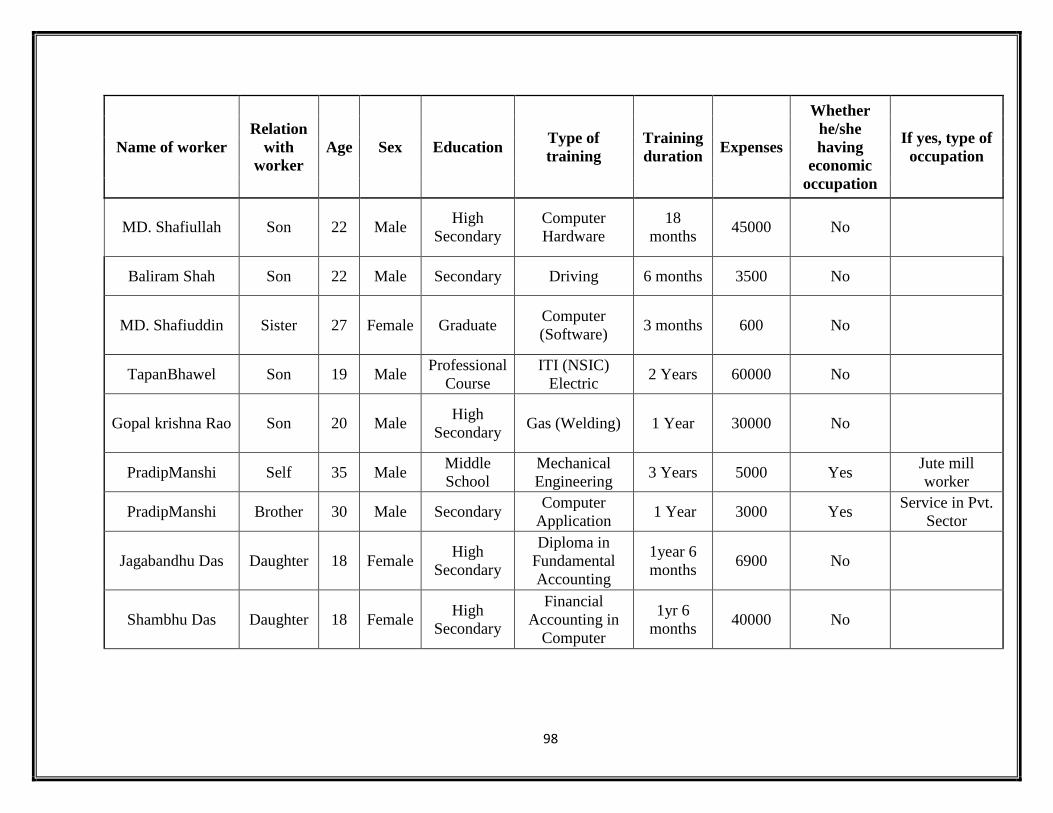
98
Name of worker
Relation
with
worker
Age Sex Education Type of
training
Training
duration Expenses
Whether
he/she
having
economic
occupation
If yes, type of
occupation
MD. Shafiullah Son 22 Male High
Secondary
Computer
Hardware
18
months 45000 No
Baliram Shah Son 22 Male Secondary Driving 6 months 3500 No
MD. Shafiuddin Sister 27 Female Graduate Computer
(Software) 3 months 600 No
TapanBhawel Son 19 Male Professional
Course
ITI (NSIC)
Electric 2 Years 60000 No
Gopal krishna Rao Son 20 Male High
Secondary Gas (Welding) 1 Year 30000 No
PradipManshi Self 35 Male Middle
School
Mechanical
Engineering 3 Years 5000 Yes
Jute mill
worker
PradipManshi Brother 30 Male Secondary Computer
Application 1 Year 3000 Yes
Service in Pvt.
Sector
Jagabandhu Das Daughter 18 Female High
Secondary
Diploma in
Fundamental
Accounting
1year 6
months 6900 No
Shambhu Das Daughter 18 Female High
Secondary
Financial
Accounting in
Computer
1yr 6
months 40000 No
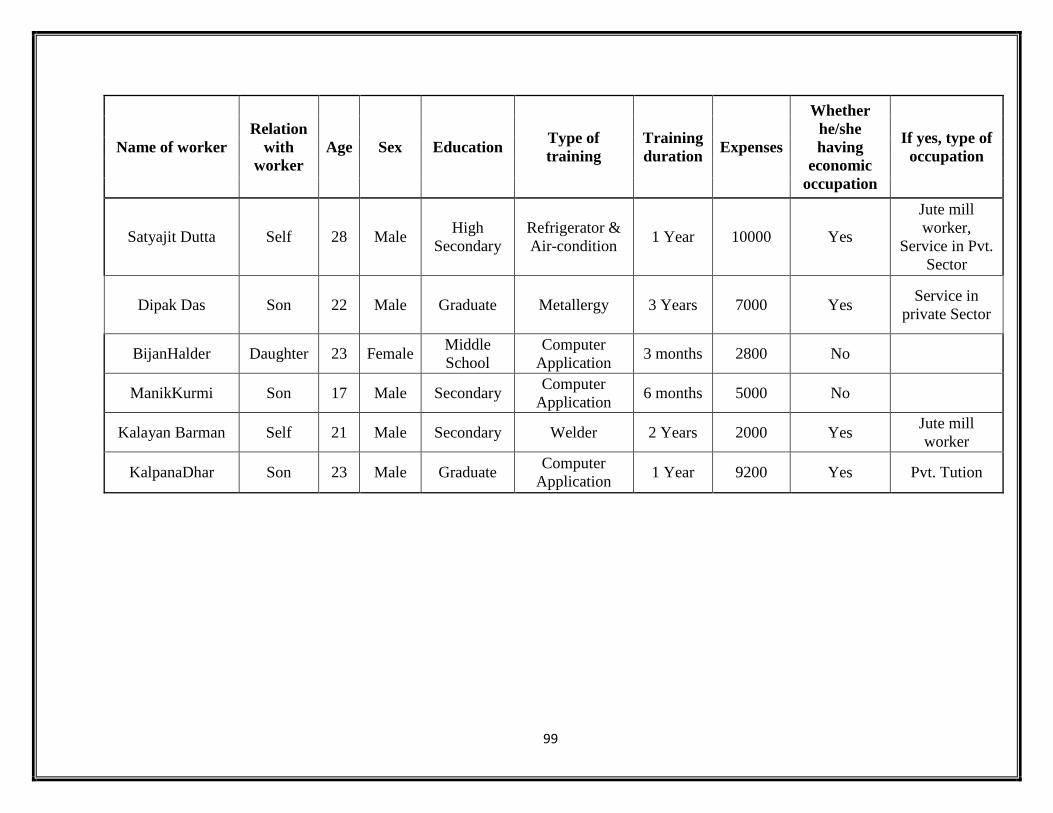
99
Name of worker
Relation
with
worker
Age Sex Education Type of
training
Training
duration Expenses
Whether
he/she
having
economic
occupation
If yes, type of
occupation
Satyajit Dutta Self 28 Male High
Secondary
Refrigerator &
Air-condition 1 Year 10000 Yes
Jute mill
worker,
Service in Pvt.
Sector
Dipak Das Son 22 Male Graduate Metallergy 3 Years 7000 Yes Service in
private Sector
BijanHalder Daughter 23 Female Middle
School
Computer
Application 3 months 2800 No
ManikKurmi Son 17 Male Secondary Computer
Application 6 months 5000 No
Kalayan Barman Self 21 Male Secondary Welder 2 Years 2000 Yes Jute mill
worker
KalpanaDhar Son 23 Male Graduate Computer
Application 1 Year 9200 Yes Pvt. Tution

100
Annexure 3.11.1
Classification and Incidence of Common diseases suffered by the workers, average
duration period and Cost incurred
Classification
Incidence of
Common diseases
suffered by the
workers
As %
Average
duration
period (Day)
Average
Cost
Body Pain 15 11.0 382 4550
Chest Pain 2 1.5 24.5 2500
Cold & Cough 24 17.6 15 750
Dengue 1 0.7 9 600
Diarrhoea 10 7.4 5 710
Eye Infection 1 0.7 22 1500
Fever 62 45.6 7 1233
Head-Ache 2 1.5 22 750
Jaundice 5 3.7 56 5360
Malaria 1 0.7 15 2500
Mouth Infection 1 0.7 30 2000
Pain related to injury 7 5.1 92 5700
Pox 4 2.9 29 1512
Stomach 6 4.4 48.6 6250
T.B. 2 1.5 330 8750
Teeth Pain 2 1.5 97 1050
Typhoid 1 0.7 90 2000 *The rows will not add up to total no. of sick persons due to multiple responses and the percentage
has been calculated on the total no of persons suffered. (136)
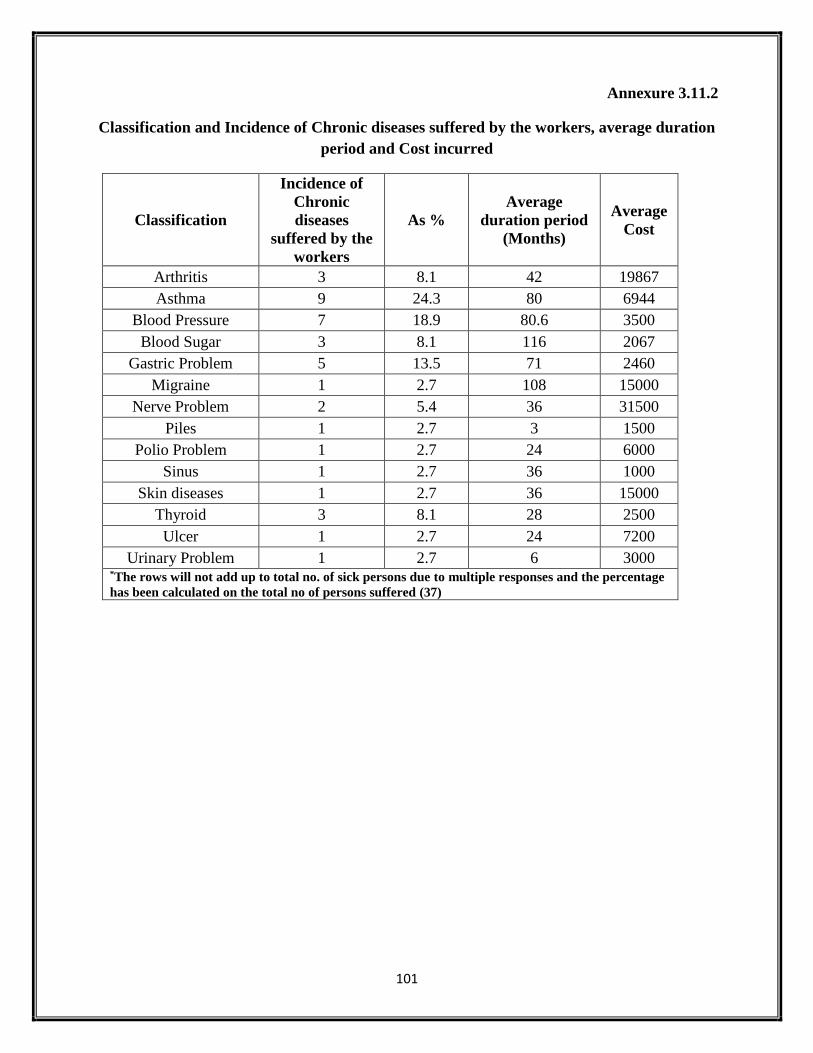
101
Annexure 3.11.2
Classification and Incidence of Chronic diseases suffered by the workers, average duration
period and Cost incurred
Classification
Incidence of
Chronic
diseases
suffered by the
workers
As %
Average
duration period
(Months)
Average
Cost
Arthritis 3 8.1 42 19867
Asthma 9 24.3 80 6944
Blood Pressure 7 18.9 80.6 3500
Blood Sugar 3 8.1 116 2067
Gastric Problem 5 13.5 71 2460
Migraine 1 2.7 108 15000
Nerve Problem 2 5.4 36 31500
Piles 1 2.7 3 1500
Polio Problem 1 2.7 24 6000
Sinus 1 2.7 36 1000
Skin diseases 1 2.7 36 15000
Thyroid 3 8.1 28 2500
Ulcer 1 2.7 24 7200
Urinary Problem 1 2.7 6 3000 *The rows will not add up to total no. of sick persons due to multiple responses and the percentage
has been calculated on the total no of persons suffered (37)
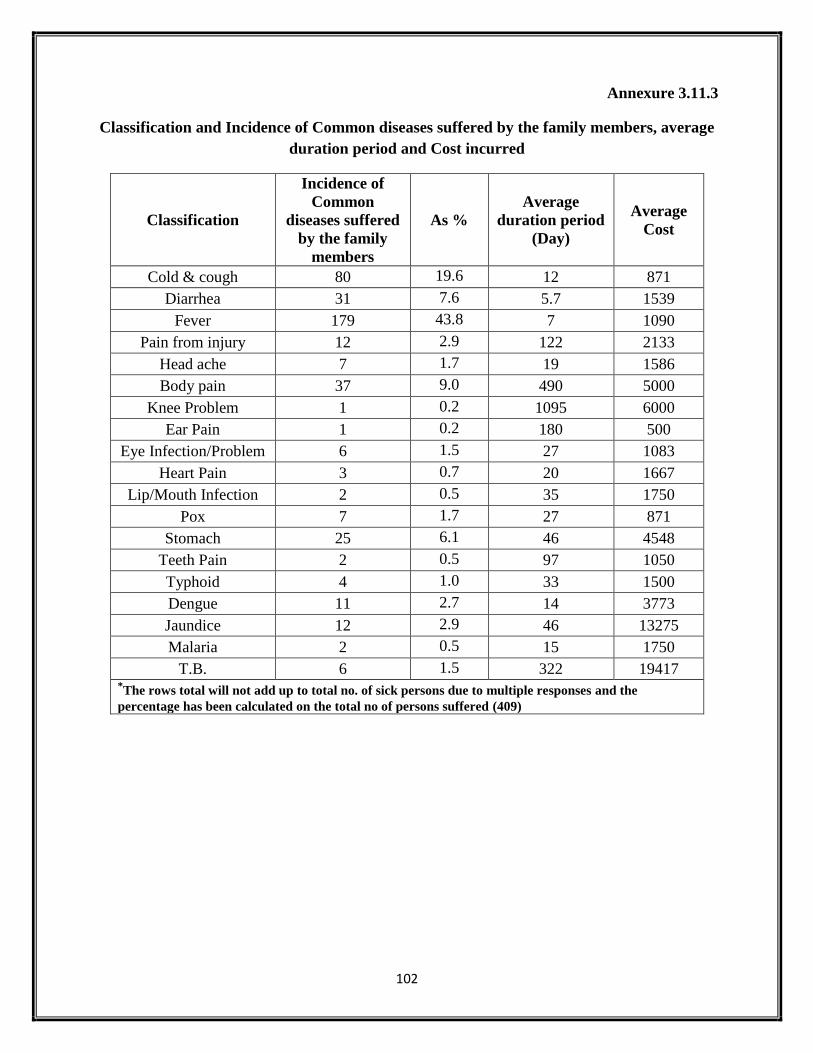
102
Annexure 3.11.3
Classification and Incidence of Common diseases suffered by the family members, average
duration period and Cost incurred
Classification
Incidence of
Common
diseases suffered
by the family
members
As %
Average
duration period
(Day)
Average
Cost
Cold & cough 80 19.6 12 871
Diarrhea 31 7.6 5.7 1539
Fever 179 43.8 7 1090
Pain from injury 12 2.9 122 2133
Head ache 7 1.7 19 1586
Body pain 37 9.0 490 5000
Knee Problem 1 0.2 1095 6000
Ear Pain 1 0.2 180 500
Eye Infection/Problem 6 1.5 27 1083
Heart Pain 3 0.7 20 1667
Lip/Mouth Infection 2 0.5 35 1750
Pox 7 1.7 27 871
Stomach 25 6.1 46 4548
Teeth Pain 2 0.5 97 1050
Typhoid 4 1.0 33 1500
Dengue 11 2.7 14 3773
Jaundice 12 2.9 46 13275
Malaria 2 0.5 15 1750
T.B. 6 1.5 322 19417 *The rows total will not add up to total no. of sick persons due to multiple responses and the
percentage has been calculated on the total no of persons suffered (409)

103
Annexure 3.11.4
Classification and Incidence of Chronic diseases suffered by the family members, average
duration period and Cost incurred
Classification
Incidence of
Chronic diseases
suffered by the
family members
As %
Average
duration period
(Months)
Average
Cost
Allergy 1 4.8 84 800
Arthritis 10 23.4 54 15100
Asthma 18 24.1 65 6078
Blood Pressure 35 12.4 48 3817
Blood Sugar 34 6.9 61 4056
Bone Problem 3 0.7 40 3067
Gastric Problem 12 1.4 59 2600
Hydrosyl 1 0.7 3 3000
Hysteria 1 2.1 240 150000
Kidney problem 1 8.3 36 20000
Leprosy 1 0.7 24 4000
Liver problem 1 0.7 180 0
Migraine 4 2.8 81 7563
Nerve Problem 8 5.5 50 14400
Paralysis 1 0.7 6 10000
Piles 1 0.7 3 1500
Polio Problem 1 0.7 24 6000
Sinus 2 4.1 66 3500
Skin diseases 7 2.1 101 18500
Spondylitis 1 0.7 24 1350
Thyroid 6 0.7 44 2250
Ulcer 3 0.7 32 6067
Urinary Problem 2 1.4 93 251500 *The row total will not add up to total no. of sick persons due to multiple responses and the
percentage has been calculated on the total no of persons suffered (145)
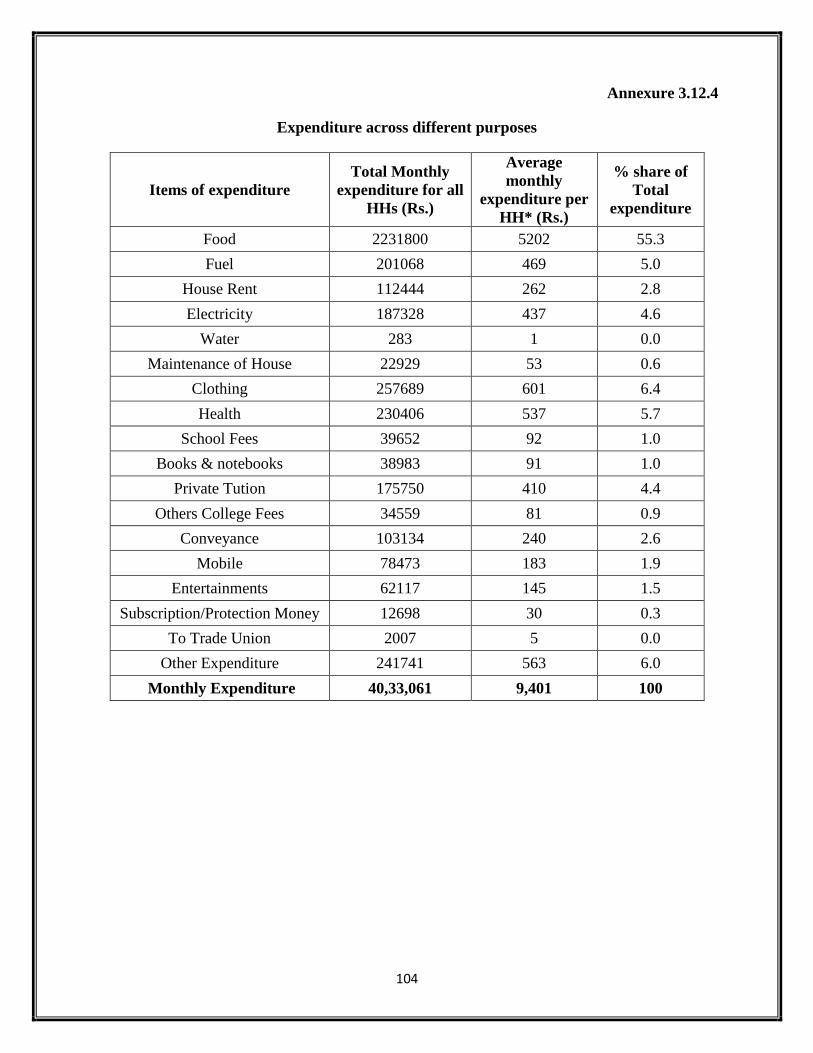
104
Annexure 3.12.4
Expenditure across different purposes
Items of expenditure
Total Monthly
expenditure for all
HHs (Rs.)
Average
monthly
expenditure per
HH* (Rs.)
% share of
Total
expenditure
Food 2231800 5202 55.3
Fuel 201068 469 5.0
House Rent 112444 262 2.8
Electricity 187328 437 4.6
Water 283 1 0.0
Maintenance of House 22929 53 0.6
Clothing 257689 601 6.4
Health 230406 537 5.7
School Fees 39652 92 1.0
Books & notebooks 38983 91 1.0
Private Tution 175750 410 4.4
Others College Fees 34559 81 0.9
Conveyance 103134 240 2.6
Mobile 78473 183 1.9
Entertainments 62117 145 1.5
Subscription/Protection Money 12698 30 0.3
To Trade Union 2007 5 0.0
Other Expenditure 241741 563 6.0
Monthly Expenditure 40,33,061 9,401 100
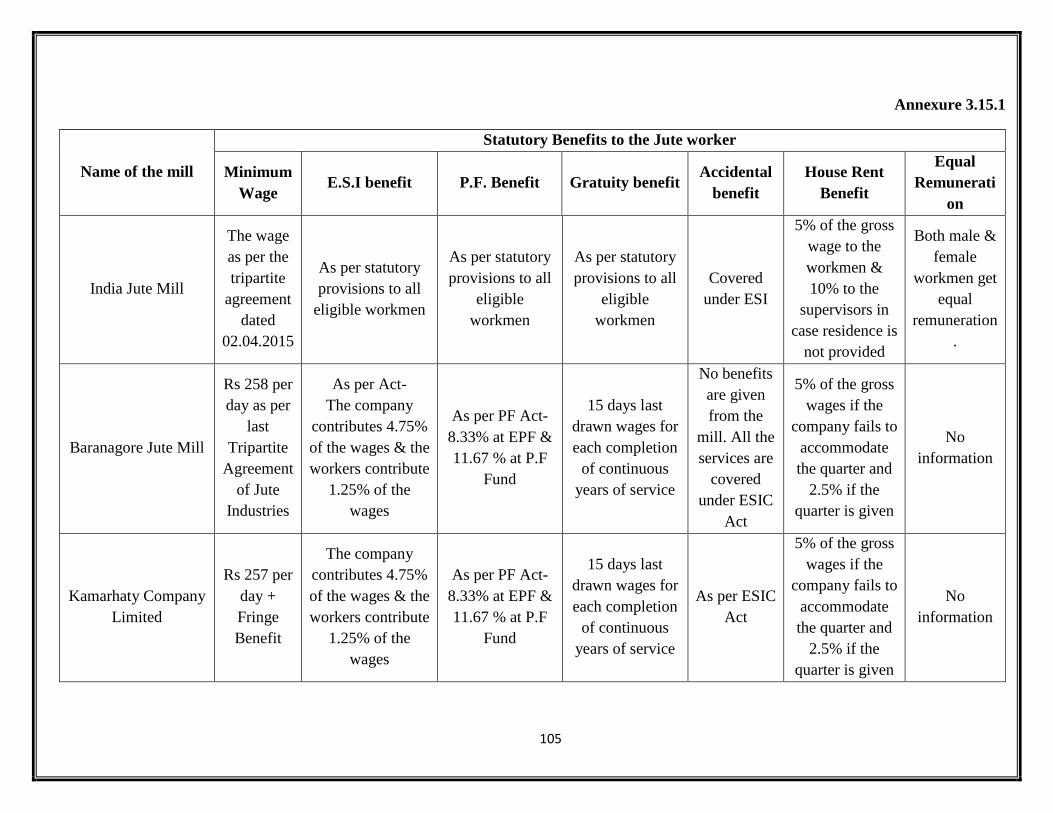
105
Annexure 3.15.1
Name of the mill
Statutory Benefits to the Jute worker
Minimum
Wage E.S.I benefit P.F. Benefit Gratuity benefit
Accidental
benefit
House Rent
Benefit
Equal
Remunerati
on
India Jute Mill
The wage
as per the
tripartite
agreement
dated
02.04.2015
As per statutory
provisions to all
eligible workmen
As per statutory
provisions to all
eligible
workmen
As per statutory
provisions to all
eligible
workmen
Covered
under ESI
5% of the gross
wage to the
workmen &
10% to the
supervisors in
case residence is
not provided
Both male &
female
workmen get
equal
remuneration
.
Baranagore Jute Mill
Rs 258 per
day as per
last
Tripartite
Agreement
of Jute
Industries
As per Act-
The company
contributes 4.75%
of the wages & the
workers contribute
1.25% of the
wages
As per PF Act-
8.33% at EPF &
11.67 % at P.F
Fund
15 days last
drawn wages for
each completion
of continuous
years of service
No benefits
are given
from the
mill. All the
services are
covered
under ESIC
Act
5% of the gross
wages if the
company fails to
accommodate
the quarter and
2.5% if the
quarter is given
No
information
Kamarhaty Company
Limited
Rs 257 per
day +
Fringe
Benefit
The company
contributes 4.75%
of the wages & the
workers contribute
1.25% of the
wages
As per PF Act-
8.33% at EPF &
11.67 % at P.F
Fund
15 days last
drawn wages for
each completion
of continuous
years of service
As per ESIC
Act
5% of the gross
wages if the
company fails to
accommodate
the quarter and
2.5% if the
quarter is given
No
information
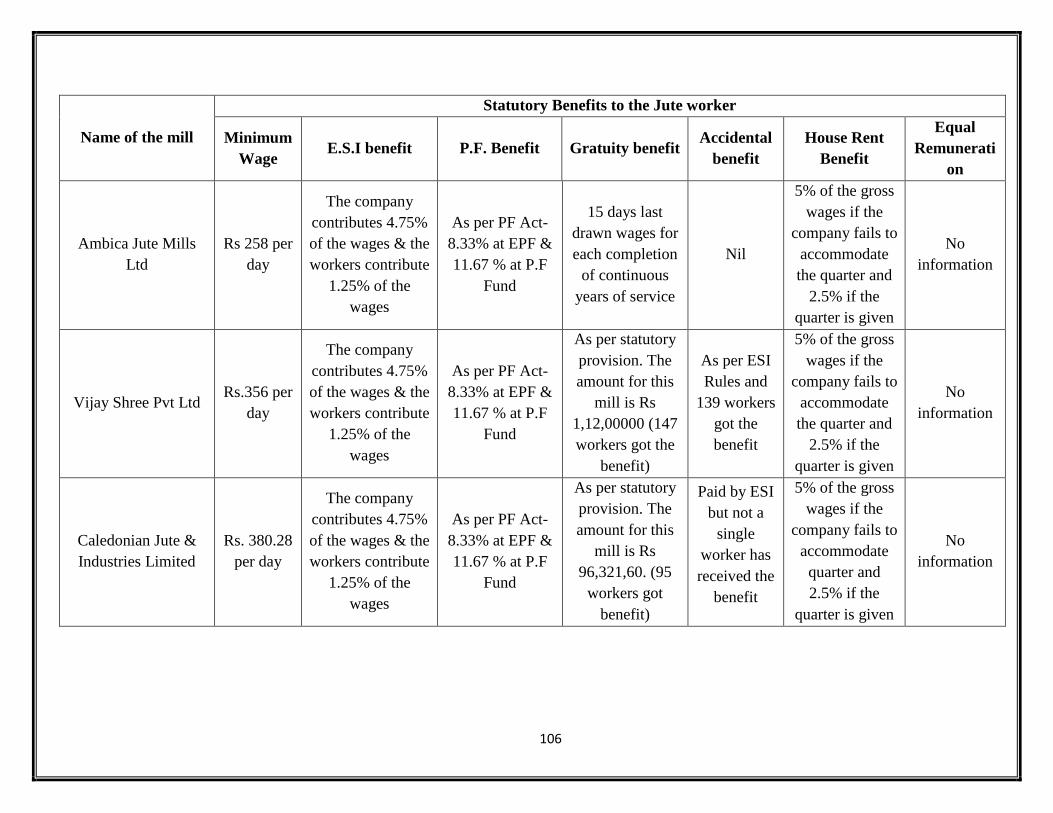
106
Name of the mill
Statutory Benefits to the Jute worker
Minimum
Wage E.S.I benefit P.F. Benefit Gratuity benefit
Accidental
benefit
House Rent
Benefit
Equal
Remunerati
on
Ambica Jute Mills
Ltd
Rs 258 per
day
The company
contributes 4.75%
of the wages & the
workers contribute
1.25% of the
wages
As per PF Act-
8.33% at EPF &
11.67 % at P.F
Fund
15 days last
drawn wages for
each completion
of continuous
years of service
Nil
5% of the gross
wages if the
company fails to
accommodate
the quarter and
2.5% if the
quarter is given
No
information
Vijay Shree Pvt Ltd Rs.356 per
day
The company
contributes 4.75%
of the wages & the
workers contribute
1.25% of the
wages
As per PF Act-
8.33% at EPF &
11.67 % at P.F
Fund
As per statutory
provision. The
amount for this
mill is Rs
1,12,00000 (147
workers got the
benefit)
As per ESI
Rules and
139 workers
got the
benefit
5% of the gross
wages if the
company fails to
accommodate
the quarter and
2.5% if the
quarter is given
No
information
Caledonian Jute &
Industries Limited
Rs. 380.28
per day
The company
contributes 4.75%
of the wages & the
workers contribute
1.25% of the
wages
As per PF Act-
8.33% at EPF &
11.67 % at P.F
Fund
As per statutory
provision. The
amount for this
mill is Rs
96,321,60. (95
workers got
benefit)
Paid by ESI
but not a
single
worker has
received the
benefit
5% of the gross
wages if the
company fails to
accommodate
quarter and
2.5% if the
quarter is given
No
information
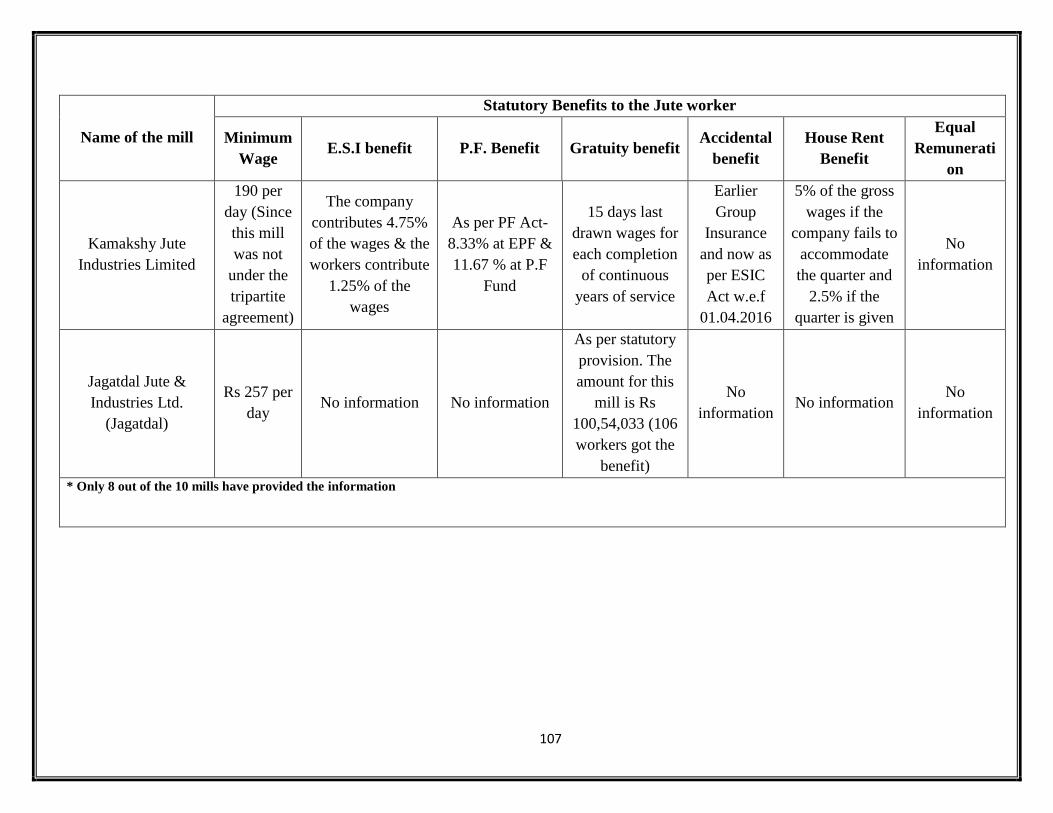
107
Name of the mill
Statutory Benefits to the Jute worker
Minimum
Wage E.S.I benefit P.F. Benefit Gratuity benefit
Accidental
benefit
House Rent
Benefit
Equal
Remunerati
on
Kamakshy Jute
Industries Limited
190 per
day (Since
this mill
was not
under the
tripartite
agreement)
The company
contributes 4.75%
of the wages & the
workers contribute
1.25% of the
wages
As per PF Act-
8.33% at EPF &
11.67 % at P.F
Fund
15 days last
drawn wages for
each completion
of continuous
years of service
Earlier
Group
Insurance
and now as
per ESIC
Act w.e.f
01.04.2016
5% of the gross
wages if the
company fails to
accommodate
the quarter and
2.5% if the
quarter is given
No
information
Jagatdal Jute &
Industries Ltd.
(Jagatdal)
Rs 257 per
day No information No information
As per statutory
provision. The
amount for this
mill is Rs
100,54,033 (106
workers got the
benefit)
No
information No information
No
information
* Only 8 out of the 10 mills have provided the information
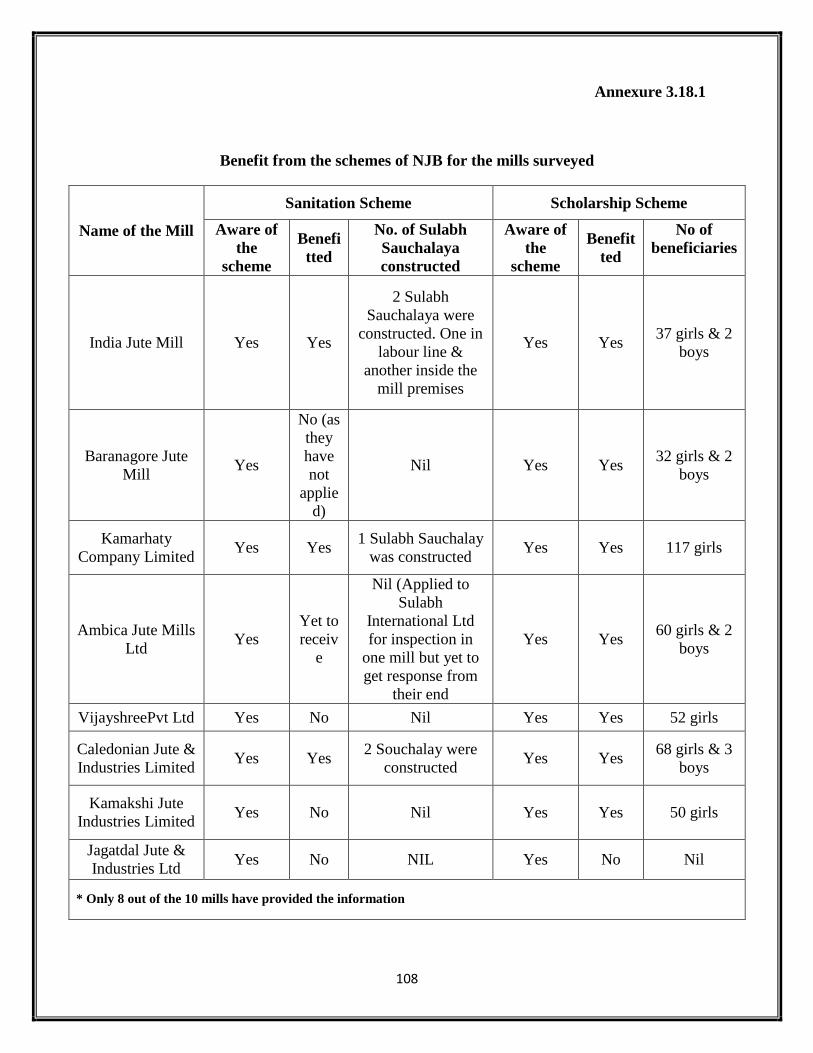
108
Annexure 3.18.1
Benefit from the schemes of NJB for the mills surveyed
Name of the Mill
Sanitation Scheme Scholarship Scheme
Aware of
the
scheme
Benefi
tted
No. of Sulabh
Sauchalaya
constructed
Aware of
the
scheme
Benefit
ted
No of
beneficiaries
India Jute Mill Yes Yes
2 Sulabh
Sauchalaya were
constructed. One in
labour line &
another inside the
mill premises
Yes Yes 37 girls & 2
boys
Baranagore Jute
Mill Yes
No (as
they
have
not
applie
d)
Nil Yes Yes 32 girls & 2
boys
Kamarhaty
Company Limited Yes Yes
1 Sulabh Sauchalay
was constructed Yes Yes 117 girls
Ambica Jute Mills
Ltd Yes
Yet to
receiv
e
Nil (Applied to
Sulabh
International Ltd
for inspection in
one mill but yet to
get response from
their end
Yes Yes 60 girls & 2
boys
VijayshreePvt Ltd Yes No Nil Yes Yes 52 girls
Caledonian Jute &
Industries Limited Yes Yes
2 Souchalay were
constructed Yes Yes
68 girls & 3
boys
Kamakshi Jute
Industries Limited Yes No Nil Yes Yes 50 girls
Jagatdal Jute &
Industries Ltd Yes No NIL Yes No Nil
* Only 8 out of the 10 mills have provided the information

109
Annexure 3.18.2
Status of Sanitation Schemes provided by NJB (2015-16)
Sl.
No. Mill Name Amt disbursed (Rs)
1 Aditya Translink Private Limited 3,615,012
2 Alliance Mills (Lessees) 8,000,000
3 Angus Jute Works 1,744,596
4 Auckland International Limited 4,267,835
5 Birla Corporation Limited 5,797,482
6 Bowreah Jute Mills Pvt. Ltd 5,869,553
7 Budge Budge Co. Ltd. 2,188.458
8 Caledonian Jute &Industreis Ltd 4,230,247
9 Ganges Jute Private Limited 5,044,326
10 Gloster Ltd 7,729,145
11 Hoogly Infrastructure Pvt. Ltd. 5,616,584
12 Kamarhatty Company Limited 4,521,330
13 Kanknarrah Company Limited 1,972,381
14 Khardah Jute Mills 1,522.010
15 Kinnison Jute Mill 1,522.010
16 Ludlow Jute Specialities Ltd 2,000,000
17 MurlidharRatanlal Exports Ltd 5,095,398
18 MurlidharRatanlal Exports Ltd [Goldalpara Jute Mill] 3,344,933
19 MurlidharRatanlal Exports Ltd [Hastings Jute Mill] 5,583,595
20 MurlidharRatanlal Exports Ltd [India Jute Mill] 1,740,531
21 Premchand Jute & Industries Pvt. Ltd 3,618,440
22 R.B.H.M 1,522,010
23 Shree Gouri Shankar Jute Mills Ltd 2,278,103
24 Tepcon International Ltd. 1,538,783
25 The Ganges Manufacturing Co. Ltd 4,051,419
26 The Hoogly Mills Company Ltd 1,444,426
27 The Naihati Jute Mills Company Ltd 3,511,165
TOTAL 99,369,772

110
Annexure 3.18.3
Status of Scholarship Scheme provided by NJB (2015-16)
Sl.
No. Mill Name State
Applications
considered by NJB
Amt. Released
(Rs)
1 Jankalyan W.B 19 1,25,000
2 Kanknarrah Co. Ltd. W.B 60 4,35,000
3 Auckland Jute Mill W.B 39 2,90,000
4 AI Champdany WB 4 20,000
5 Ambica Jute Mills Ltd WB 62 5,15,000
6 Kamarhatty Co. Ltd WB 48 3,80,000
7 Kamakshi jute WB 25 1,90,000
8 Alliance Mills (Lessees) WB 74 6,80,000
9 Angus Jute Works WB 100 7,96,750
Angus Jute Works 61,000
10 Murlidhar Ratanlal, Barsul WB 23 1,40,000
11 Birla Corporation WB 116 8,80,000
12 Bally Jute Co. Ltd. WB 12 90,000
13 Premchand Jute & Industries Pvt Ltd. WB 54 3,65,000
14 Sunbeam Vanijya Pvt Ltd WB 33 2,60,000
15 Reliance Industries Ltd WB 145 12,15,000
16 Budge Budge Co. Ltd. WB 55 4,25,000
17 Bowreah Jute Mills Pvt Ltd WB 185 15,15,000
18 Cheviot Company Ltd. WB 79 6,40,000
19 Aditya Translink WB 116 7,75,000
20 Caledonian Jute & Industries Ltd WB 71 6,25,000
21 Shree Gourishankar Jute Mill WB 53 4,30,000
22 Shree Sitarama Lakshmi AP 2 15,000
23 The Assam Co-op Mills Co. Ltd Assam 18 1,45,000
24 Dalhousie Jute Mill WB 222 18,07,000
25 Tripura Jute Mills Tripura 22 2,50,000
26 Trend Vyaapar (Kelvin Jute) WB 56 4,00,000
27 Vijayshree Ltd WB 33 2,35,000
28 Weaverly Jute Mills WB 59 4,30,000
29 Ganges Manufacturing Co. Ltd WB 188 14,05,000
30 Naihati Jute Mill WB 109 8,75,000
31 The Empire Jute WB 15 1,10,000
32 Baranagore Jute Factory WB 33 2,60,000
33 Gloster Ltd. WB 158 12,81,400
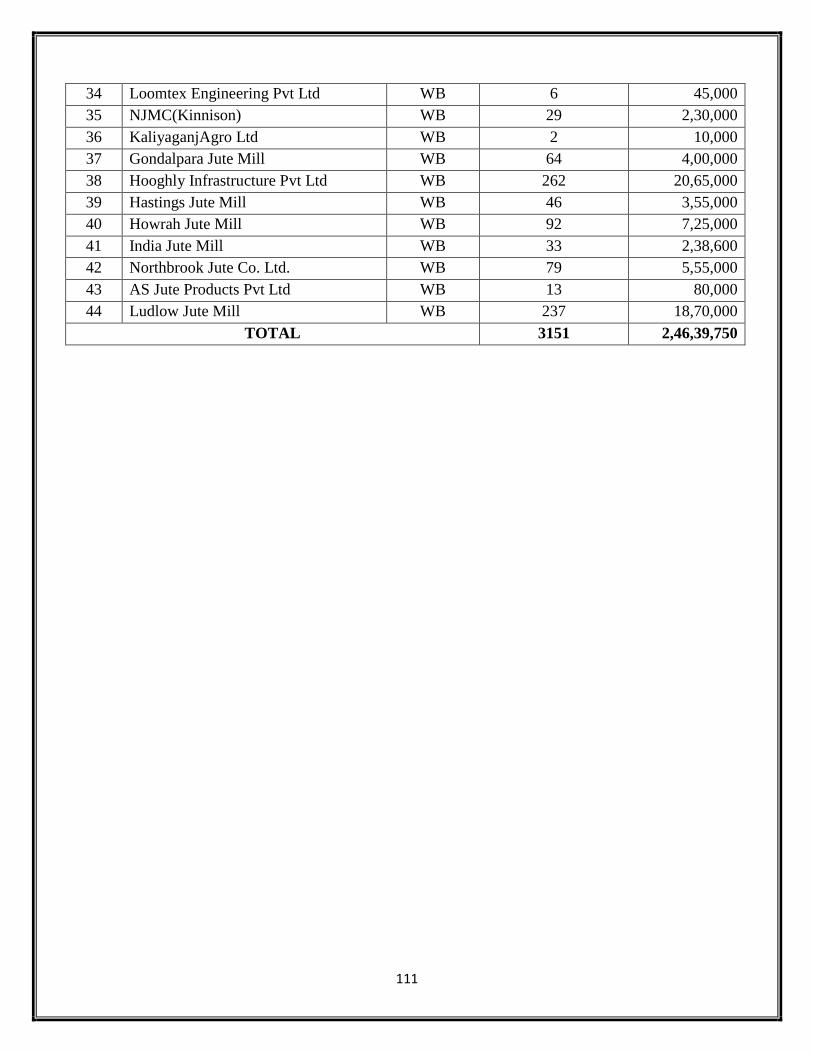
111
34 Loomtex Engineering Pvt Ltd WB 6 45,000
35 NJMC(Kinnison) WB 29 2,30,000
36 KaliyaganjAgro Ltd WB 2 10,000
37 Gondalpara Jute Mill WB 64 4,00,000
38 Hooghly Infrastructure Pvt Ltd WB 262 20,65,000
39 Hastings Jute Mill WB 46 3,55,000
40 Howrah Jute Mill WB 92 7,25,000
41 India Jute Mill WB 33 2,38,600
42 Northbrook Jute Co. Ltd. WB 79 5,55,000
43 AS Jute Products Pvt Ltd WB 13 80,000
44 Ludlow Jute Mill WB 237 18,70,000
TOTAL 3151 2,46,39,750

112
Annexure 3.21.5
Ways of overcoming the situation when the mill was closed
Ways Responses As
%
Reduced expenditures on food 1 0.5
Reduced expenditures on daily needs 1 0.5
Reduced Daily expenses 48 22.0
Withdrew from Savings 23 10.6
Worked in other Jute-Mills 30 13.8
Stopped the habit of eating-out 1 0.5
Stopped purchasing new cloths 1 0.5
Worked as a day labor in profession like Mason, TV repairing,
Electrical works, Tailoring etc. 43 19.7
Borrowed from friends/relatives 11 5.0
Went back to Village and started farming 20 9.2
Worked as Rickshaw-Puller 5 2.3
Bought food grains from their native villages 2 0.9
Worked as vegetable seller 0 0.0
Took loan from some shopkeepers who were known to them 2 0.9
Worked as Hawkers 1 0.5
Worked in shops 5 2.3
Amount of remittance sent to the family was reduced 1 0.5
Took help from the family members 12 5.5
Engaged in part time work 1 0.5
Worked as unskilled labours 4 1.8
Took debt from money lenders 2 0.9
Worked as auto driver 2 0.9
Sold out gold 2 0.9
Total 218
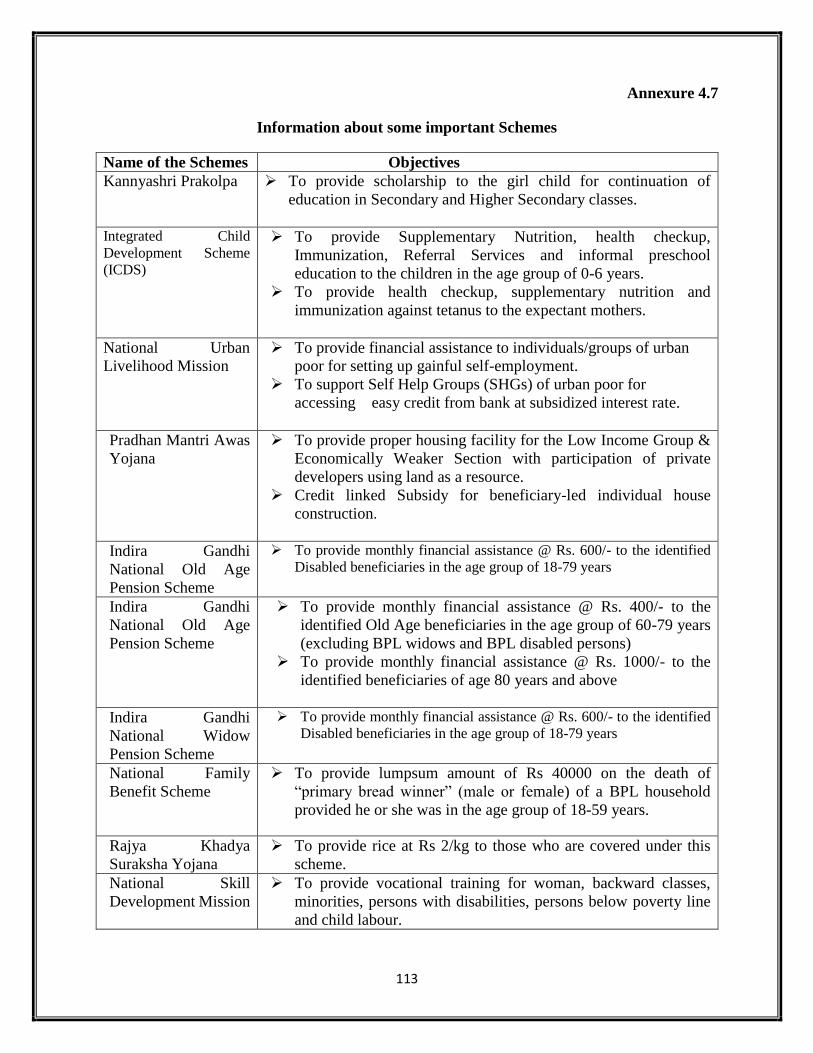
113
Annexure 4.7
Information about some important Schemes
Name of the Schemes Objectives
Kannyashri Prakolpa
To provide scholarship to the girl child for continuation of
education in Secondary and Higher Secondary classes.
Integrated Child
Development Scheme
(ICDS)
To provide Supplementary Nutrition, health checkup,
Immunization, Referral Services and informal preschool
education to the children in the age group of 0-6 years.
To provide health checkup, supplementary nutrition and
immunization against tetanus to the expectant mothers.
National Urban
Livelihood Mission
To provide financial assistance to individuals/groups of urban
poor for setting up gainful self-employment.
To support Self Help Groups (SHGs) of urban poor for
accessing easy credit from bank at subsidized interest rate.
Pradhan Mantri Awas
Yojana
To provide proper housing facility for the Low Income Group &
Economically Weaker Section with participation of private
developers using land as a resource.
Credit linked Subsidy for beneficiary-led individual house
construction.
Indira Gandhi
National Old Age
Pension Scheme
To provide monthly financial assistance @ Rs. 600/- to the identified
Disabled beneficiaries in the age group of 18-79 years
Indira Gandhi
National Old Age
Pension Scheme
To provide monthly financial assistance @ Rs. 400/- to the
identified Old Age beneficiaries in the age group of 60-79 years
(excluding BPL widows and BPL disabled persons)
To provide monthly financial assistance @ Rs. 1000/- to the
identified beneficiaries of age 80 years and above
Indira Gandhi
National Widow
Pension Scheme
To provide monthly financial assistance @ Rs. 600/- to the identified
Disabled beneficiaries in the age group of 18-79 years
National Family
Benefit Scheme
To provide lumpsum amount of Rs 40000 on the death of
“primary bread winner” (male or female) of a BPL household
provided he or she was in the age group of 18-59 years.
Rajya Khadya
Suraksha Yojana
To provide rice at Rs 2/kg to those who are covered under this
scheme.
National Skill
Development Mission
To provide vocational training for woman, backward classes,
minorities, persons with disabilities, persons below poverty line
and child labour.


![[XLS] · Web viewBHOSALE NETRA DINANATH DAYA ANSARI TUGHRIL FAHEEM TARANNUM MORE ROHINI BHASKAR SULBHA HINDI JOSHI MARISHA NIMESH RASHMI CHHEDA RIDDHI NAVIN AMRUT SHAH SHAILEE DILIP](https://static.fdocuments.us/doc/165x107/5af6640a7f8b9a954690b6fa/xls-viewbhosale-netra-dinanath-daya-ansari-tughril-faheem-tarannum-more-rohini.jpg)