Justice and self-efficacy: Implications for influence on ...
22
Southwest Business and Economics Journal/2013 35 Justice and self-efficacy: Implications for influence on performance and satisfaction Lisa M. Russell, Ph. D. Indiana University Southeast Zhen Li, Ph. D. Middle Tennessee State University Abstract This paper fills a gap in the literature by evaluating whether perceptions of justice or self-efficacy has a stronger influence on student’s performance and satisfaction. We evaluate the mediating effect of student performance on the relationship between distributive justice and two dimensions of self-efficacy (i.e., task self-efficacy and learning self-efficacy) and student satisfaction. Findings indicate that justice perceptions explain more variance in satisfaction than self-efficacy, but that task self-efficacy explains more variance in performance than justice. Performance partially mediates the relationship between justice and satisfaction but fully mediates the relationship between task self-efficacy and satisfaction. One of the more interesting findings stems from the negative effect learning self-efficacy has on satisfaction providing support for findings that individuals may either overestimate their abilities or underestimate difficulty and/or affect satisfaction in learning environments. Theoretical, academic, and managerial implications are explored. Introduction Justice is a substantially important issue to individuals and organizations. Indeed, editors have increased attention to these topics in organizational journals (Colquitt & Rodell, 2011). Researchers find that justice perceptions are consistent predictors of employee behavior and attitudes, and meta-analytic results support relationships between justice perceptions and key organizational outcomes such as organizational citizenship behavior, organizational commitment, and task performance (Cohen-Charash & Spector, 2001; Colquitt, Conolon, Wesson, Porter, & Ng, 2001). The importance of justice as a core requirement for both the effective functioning of an organization and the personal satisfaction of those associated with the organization has been long recognized by researchers (Greenberg, 1990a). Indeed, Rawls (1971) identified justice as the “first virtue of social institutions” (p. 3). More recently scholars have integrated multiple theories to derive predictions about relationships among justice and other variables like trustworthiness and trust (Colquitt & Rodell, 2011), and meta-analysis have investigated employee justice across cultures (Shao, Rupp, Skarlicki, & Jones, 2013). While justice has received attention from various scholars, most notably in the political science and organizational behavior areas, scholars have recently identified a gap in investigating these variables in instructional settings (Chory-Assad, 2002; Tyler, 1987). The term organizational justice describes the role of fairness as it directly relates to the workplace. Moorman (1991) suggests that organizational justice is concerned with
Transcript of Justice and self-efficacy: Implications for influence on ...
Southwest Business and Economics Journal/2013
35
Justice and self-efficacy:
Implications for influence on performance and satisfaction
Lisa M. Russell, Ph. D.
Indiana University Southeast
Zhen Li, Ph. D.
Middle Tennessee State University
Abstract
This paper fills a gap in the literature by evaluating whether perceptions of
justice or self-efficacy has a stronger influence on student’s performance and
satisfaction. We evaluate the mediating effect of student performance on the relationship
between distributive justice and two dimensions of self-efficacy (i.e., task self-efficacy and
learning self-efficacy) and student satisfaction. Findings indicate that justice perceptions
explain more variance in satisfaction than self-efficacy, but that task self-efficacy
explains more variance in performance than justice. Performance partially mediates the
relationship between justice and satisfaction but fully mediates the relationship between
task self-efficacy and satisfaction. One of the more interesting findings stems from the
negative effect learning self-efficacy has on satisfaction providing support for findings
that individuals may either overestimate their abilities or underestimate difficulty and/or
affect satisfaction in learning environments. Theoretical, academic, and managerial
implications are explored.
Introduction
Justice is a substantially important issue to individuals and organizations. Indeed,
editors have increased attention to these topics in organizational journals (Colquitt &
Rodell, 2011). Researchers find that justice perceptions are consistent predictors of
employee behavior and attitudes, and meta-analytic results support relationships between
justice perceptions and key organizational outcomes such as organizational citizenship
behavior, organizational commitment, and task performance (Cohen-Charash & Spector,
2001; Colquitt, Conolon, Wesson, Porter, & Ng, 2001). The importance of justice as a
core requirement for both the effective functioning of an organization and the personal
satisfaction of those associated with the organization has been long recognized by
researchers (Greenberg, 1990a). Indeed, Rawls (1971) identified justice as the “first
virtue of social institutions” (p. 3). More recently scholars have integrated multiple
theories to derive predictions about relationships among justice and other variables like
trustworthiness and trust (Colquitt & Rodell, 2011), and meta-analysis have investigated
employee justice across cultures (Shao, Rupp, Skarlicki, & Jones, 2013). While justice
has received attention from various scholars, most notably in the political science and
organizational behavior areas, scholars have recently identified a gap in investigating
these variables in instructional settings (Chory-Assad, 2002; Tyler, 1987).
The term organizational justice describes the role of fairness as it directly relates
to the workplace. Moorman (1991) suggests that organizational justice is concerned with
Justice and Self-Efficacy:
Implications for Influence on Performance and Satisfaction
36
individual’s perceptions of whether they have been treated fairly in the workplace and
how these perceptions influence other work related variables. Distributive justice and
procedural justice are two sources of organizational justice frequently cited in the
literature (Folger & Greenberg, 1985). Distributive justice describes the fairness of
outcomes an individual receives and procedural justice describes the fairness of the
procedures used to determine those outcomes. Distributive justice, however, appears to
be a more important predictor of personal outcomes (e.g., satisfaction with pay level or
grades) than procedural justice (McFarlin & Sweeney, 1992). Just as instructional
researchers have examined traditionally organizational concepts (e.g., Chen 2000; Chory-
Assad, 2002; Chory & McCrosky, 1999; Richmond & McCrosky, 1993), the present
study draws from organizational justice literature in examining justice perceptions and
consequences in an instructional setting.
Satisfaction in the workplace is directly related to the performance of an
individual, and Cohen-Charash and Spector (2001) found that most satisfaction measures
are related to organizational justice. The extent to which individuals are able to satiate
their needs through task performance is reflected in their level of satisfaction. Fryxell &
Gordon (1989) found that perceptions of linkages between effort, performance, and
reward were important correlates of their satisfaction. Instructional researchers evaluate
student outcomes such as satisfaction and affective learning in both traditional and
nontraditional classrooms such as online classes (Chory-Assad, 2002; Swan, 2001), and
the present study evaluates satisfaction among students.
Self-efficacy is considered one of the best dispositional predictors of satisfaction
and performance (Judge & Bono, 2001). In their meta-analysis of the relationships
between 4 traits with satisfaction, Judge and Bono (2001) found the estimated true score
correlations to be 0.26 for self-esteem, 0.45 for generalized self-efficacy, 0.32 for locus
of control, and 0.24 for emotional stability. The estimated true score correlations between
the 4 traits with job performance were 0.26 for self-esteem, 0.23 for generalized self-
efficacy, 0.22 for locus of control, and 0.19 for emotional stability.
Although the justice-performance-satisfaction relationship and the self-efficacy-
performance-satisfaction relationships have been considered separately in the literature
(e.g., Awamlch & Al-Dmour, 2004; Ang, & Van Dyne & Begley, 2003), there is no
evidence the streams of research have been simultaneously integrated. The purpose of
this study is to test a model of justice and self-efficacy that has implications for student
performance and satisfaction. Specifically, we want to determine which construct, justice
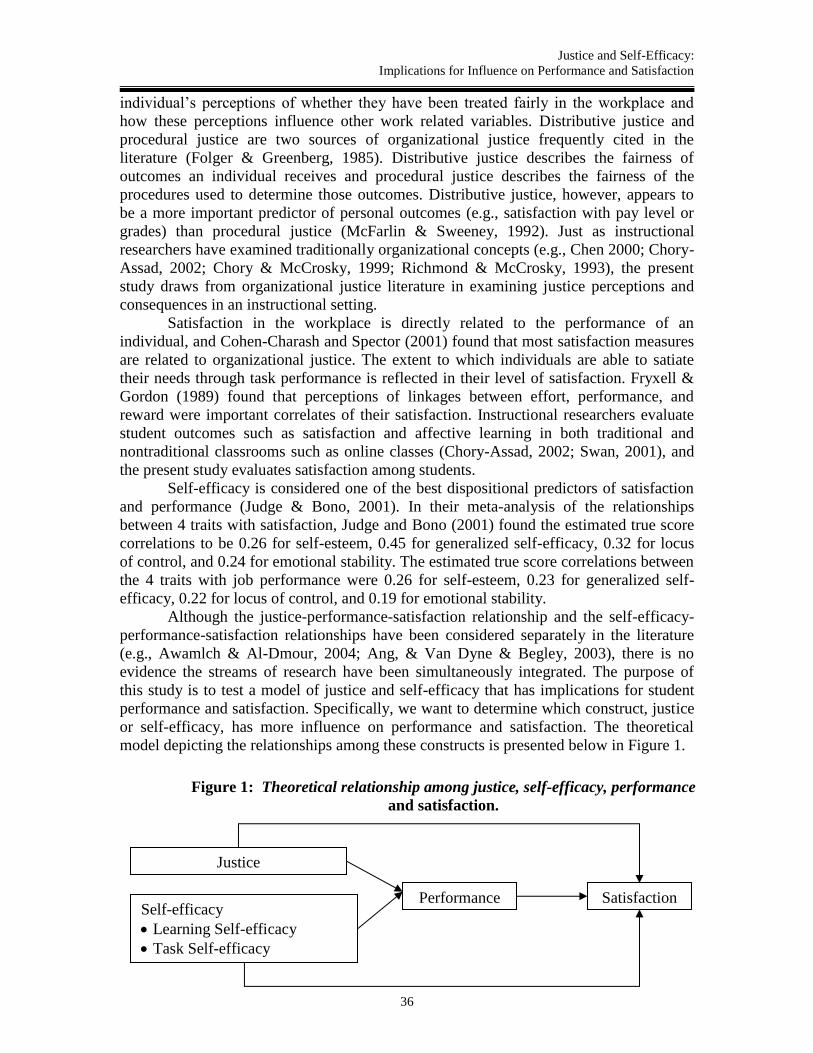
or self-efficacy, has more influence on performance and satisfaction. The theoretical
model depicting the relationships among these constructs is presented below in Figure 1.
Justice
Self-efficacy
Learning Self-efficacy
Task Self-efficacy
Performance Satisfaction
Figure 1: Theoretical relationship among justice, self-efficacy, performance
and satisfaction.
Southwest Business and Economics Journal/2013
37
Theoretical Framework and Hypotheses
Organizational Justice
Organizational justice has received increased attention as a research stream in
organizational behavior (Colquitt & Rodell, 2011) and instructional research (e.g., Chen
2000; Chory-Assad, 2002; Chory & McCrosky, 1999; Richmond & McCrosky, 1993).
While early studies of fairness in psychology date back to Adams’ (1963, 1965) work on
equity theory, studies conducted over the last two decades comprise the bulk of research
involving organizational justice and researchers have studied the influence of justice in
various contexts on multiple outcomes. Monin, Noorderhaven, Vaara, & Kroon (2013)
recently evaluated the role of justice norms in post-merger integration, how they evolve
as organizational integration unfolds over time, and how norms of justice are enacted
through intergroup dynamics. Thus, researchers attribute importance to fairness in
organizational life. This is evidenced by the over 500 empirical and theoretical papers
focusing on issues of fairness and justice (Cohen-Charash & Spector, 2001, Shao, et al.,
2013). For the purpose of this paper, organizational fairness and organizational justice are
viewed as interchangeable terms.
Distributive justice models were among the first justice archetypes (Adams, 1963,
1965) emphasizing the perceived fairness of outcomes. The study of procedural justice –
“the perceived fairness of the process by which outcomes are arrived” (Cohen-Charash &
Spector, 2001: 279) – followed when equity theory and other distributive justice models
failed to adequately explain and predict peoples’ reactions to perceived injustice.
Greenberg (1990a) cautions researchers to remember that the earliest theories of social
justice, which were applied to organizations, were derived for a specific purpose – to test
principles of justice in general social interaction, not organizations in particular. More
recent research and conceptual models are sensitive to variables and issues that directly
affect organizations, and management researchers have studied justice at multiple levels
(e.g., individual, group, and organizational). Bies & Moag (1986) introduced the concept
of interactional justice, focusing on the interpersonal treatment and communication by
managers to employees. Cohen-Charash and Spector (2001) have since found empirical
merit of the distinction among the three types of organizational justice – distributive
justice, procedural justice, and interactional justice. The distinction between interactional
justice and distributive justice is clearly supported (Alexander & Ruderman, 1987; Folger
& Konovsky, 1989; Gollinad, 1994; Sweeney & McFarlin, 1993), and Cropanzano &
Greenberg (1997) confirm the basic distinction between fairness of process and fairness
of outcome when they suggest that interactional justice is really a subcomponent of
procedural justice.
There is less agreement, however, on the distinction between procedural justice
and distributive justice, with some authors supporting the distinction (Colquitt, 1999;
Cropanzano & Prehar, 1999; Moorman, 1991) and others questioning it (Tyler & Bies,
1990). McFarlin and Sweeney (1992) found distributive justice measures to be a more
important predictor of personal outcomes, whereas procedural justice measures are a
more important predictor of organizational outcomes. Thus, we use distributive justice
scales to measure perceptions of organizational justice. The term justice will be used to
describe our findings from these distributive justice scales, and we investigate the
relationship among perceived fairness of outcomes, dimensions of self-efficacy,
performance, and satisfaction – operationalized at the individual level.
Justice and Self-Efficacy:
Implications for Influence on Performance and Satisfaction
38
Justice, Performance, and Satisfaction
There are conceptual reasons, and both empirical and theoretical support, for
expectations that justice is directly related to performance and satisfaction, albeit for
different reasons. Distributive justice is fostered when appropriate allocation norms are
utilized in delivering key outcomes (Leventhal, 1976). In both business and academic
contexts, the appropriate norm is equity, where allocation of outcomes is largely tied
directly to inputs (e.g., hour/years worked toward a promotion or reward; hours allocated
to study of course materials). Justice is likely to be relevant to performance because the
harder one works or prepares the more likely they are to optimize performance relative to
respective input. Justice is germane to satisfaction because equity has important affective
and cognitive consequences. Inequity distress (e.g., anger from underpayment inequity,
guilt form overpayment inequity) is often a direct consequence of inequitable allocations
(Adams, 1965). Moreover, failing to make equitable decisions about something as salient
to the individual as a job promotion, bonus, or course grades could undermine the
competence, reliability, and dedication of an authority figure.
Researchers have examined the perceived fairness and the relationship of justice
perceptions to numerous criterion variables (Walster, Walster, & Bersheid, 1978). In their
investigation of justice for example, Walster and colleagues (1978) found that both
quality and quantity of work are two outcome variables. Because distributive justice
focuses on outcomes, it is related primarily to cognitive, affective, and behavioral
reactions to specific outcomes (Cohen-Charash & Spector, 2001). Perceptions of the
fairness of a particular outcome affect both emotions and cognitions. As these
perceptions either persist or increase, behavior such as performance and/or satisfaction is
influenced.
Equity theory (Adams, 1963, 1965) suggests that both fairness and satisfaction are
influenced by perceptions of equity in outcome distributions. Gilliand & Chan (2001)
suggest that a conceptual overlap and a distinction between outcome fairness and
outcome satisfaction exist. McFarlin and Sweeney (1992), however, distinguish between
fairness and satisfaction. They suggest that fairness is an antecedent to satisfaction.
Adams’ equity theory also provides a theoretical explanation to the distributive
justice effect on performance, which indicates that individuals can alter their work
performance to restore justice. When perceived they are treated fairly, individuals are
more likely to be motivated to improve task performance; however, when they feel
unfairly treated, individuals may decrease their quality and quantity of work to seek a
stronger sense of balance. The direct relationship between distributive justice and
performance is affirmed in a recent empirical study conducted by Wang et al. (2010).
Social exchange theory is used by a growing number of researchers to explain the
connection between distributive justice and performance (Colquitt, LePine, Piccolo,
Zapata, & Rich, 2012; Dirks & Ferrin, 2002). If justice is perceived as fairly allocated, a
high quality of social exchange will ensue. Researchers have used occupational trust in
evaluating self-efficacy (Otto, Glaser, & Dalbert, 2009), and studies evaluating trust are
pertinent in establishing theoretical and empirical associations between justice, self-
efficacy, and both satisfaction and performance. A number of meta-analytic studies
reveal a positive relationship between organizational justice and outcomes such as trust
(Dirks & Ferrin 2002).
When trust is present, uncertainty about outcomes is reduced and individuals are
more convinced to contribute to their performance. Colquitt et al. (2012) conducted an
empirical study to demonstrate that trust, as an uncertainty reducer and an exchange
Southwest Business and Economics Journal/2013
39
deepener, can foster the positive relationship between the organizational justice and
performance.
As such, we predict that justice will be positively related to both satisfaction and
performance.
H1a: Justice is positively related to satisfaction.
H1b: Justice is positively related to performance.
Self-efficacy
Self-efficacy is embodied in Bandura’s social cognitive theory. Bandura (1977)
defined self-efficacy as judgment of one’s own capabilities to organize and execute
courses of action required to achieve a desired objective. The effort one expends, and the
persistence which they exhibit in the face of obstacles or failures, are influenced by
efficacy expectations.
Individuals possess various levels of self-efficacy. Individuals with high self-
efficacy view themselves successfully completing a task (Bandura, 1977). This high self-
efficacy is then reinforced and can generalize to other, distinct tasks. Individuals with
low self-efficacy view themselves as failing at a task or focusing on the negative aspects
of how things can go wrong. The effects of failure are partly dependent on the timing and
total pattern of experiences surrounding the failure. Low self-efficacy can function as a
self-fulfilling prophecy and affect other tasks as well.
Self-efficacy, Performance, and Satisfaction
There are shared origins to efficacy expectations (Smith, Kass, Rotunda, &
Schnieder, 2006). Bandura (1977) identifies four principal sources upon which one’s self-
efficacy is based. These include performance accomplishments, vicarious experience,
verbal persuasion, and physiological states/emotional arousal. Because it is based on
personal mastery experiences, performance is considered especially influential (Bandura,
1977).
Self-efficacy has been shown to affect performance in a variety of situations.
Studies of self-efficacy and the workplace, sports, sales, and employee training are but a
few. Stajkovic and Luthans (1998) conducted a meta-analysis considering self-efficacy in
the workplace. Their review of 114 studies found a significant positive relationship
between self-efficacy and work-related performance. Mortiz et al. (2000) conducted an
additional meta-analytic review of 45 studies involving sports. They found a significant
positive correlation between self-efficacy measures and performance.
Self-efficacy has also been found to be an antecedent to performance among
salespersons. Krishnan, Netenmeyer, and Boles (2003) found that self-efficacy has both
direct and indirect effects on sales performance. The self-efficacy-performance
relationship has also been examined in employee training. Both general and specific self-
efficacy improves performance through enhanced performance expectancy associated
with employee training intervention (Schwoerer, May, Hollensbe, and Mencl, 2005).
These studies coupled with the moderate, positive findings of the above cited meta-
analyses clearly indicate that there is a positive relationship between self-efficacy and
performance. Researchers have also found relationships between justice perceptions and
self-efficacy. Otto and colleagues (Otto et al., 2009) investigated whether justice
perceptions would enhance evaluations of working life (i.e., job satisfaction,
organizational commitment) and both increase occupational trust (i.e., entrepreneurial
Justice and Self-Efficacy:
Implications for Influence on Performance and Satisfaction
40
self-efficacy, occupational self-efficacy) and mental health (i.e., life satisfaction, self-
esteem). Findings indicate that justice perceptions positively influence both mental health
and occupational trust among all participant groups.
Learning Self-efficacy, Performance, and Satisfaction
Another area of self-efficacy involves learning. Potosky and Ramakrishna (2002)
distinguish between self-efficacy and learning self-efficacy (LSE) in their study
investigating the moderating role of updating climate perceptions in the relationship
between goal orientation, self-efficacy, and job performance. They identify LSE as the
beliefs associated with one’s ability to learn and adapt in an organizational environment.
Their study found that learning self-efficacy mediated the relationship between
performance goal orientation and job performance.
A substantial amount of research has focused on the role that self-efficacy plays
as a motivational mechanism allowing the mobilization of effort, cognitive resources, and
actions necessary for performance (Gist & Mitchell, 1992), yet little research has focused
on the direct effects of LSE on performance or satisfaction outcomes. Zimmerman and
colleagues found general support for the relationship between efficacy and learning
performance, but efficacy generally functioned indirectly as a mediator or moderator.
Zimmerman (1995) investigated the relationship between self-efficacy and academic
performance and results from that study indicate that a high sense of self-efficacy results
in better academic achievement and performance at the college level. Zimmerman,
Bandura, and Martinez-Pons (1992) found a positive relationship between student’s
beliefs in their efficacy for self-regulated learning and their perceived self-efficacy for
academic achievement. This, in turn, influences the individual’s academic goals and
ultimately their academic achievement.
While the overall relationship between LSE and performance has been studied,
the direction of the relationship has not been directly investigated. Steele-Johnson et al.
(2000) found a positive relationship between performance orientation and self-efficacy,
but this relationship was conditional. The relationship only held when scheduling tasks
were simple and required fewer attentional resources. Phillips and Gully (1997) report a
similar finding between performance-goal orientation and self-efficacy, but under more
challenging circumstances of a college exam. Nesbit & Burton (2006) found an
interaction between grade outcomes and negative justice perceptions. Specifically, poor
performers with negative justice perceptions had subsequently lower self-efficacy and
satisfaction than those with no injustice perceptions. Self-efficacy rose, however, if
students with negative justice perceptions also received high performance feedback.
Thus, justice, self-efficacy, satisfaction and performance are related for students
participating in this study. The following hypotheses are based on the above discussion:
H2a: Learning self-efficacy is positively related to performance.
H2b: Learning self-efficacy is positively related to satisfaction.
Task Self-efficacy, Performance and Satisfaction
Bandura (1982, 1986, and 1997) suggests that self-efficacy is primarily task-
specific. Kanfer (1987) defines task-specific self-efficacy (TSE) as an individual’s
intention to allocate effort to achieve targeted levels of performance. Weigane &
Stockhan (2000) contend that task-specific measurement of self-efficacy is necessary to
Southwest Business and Economics Journal/2013
41
successfully predict behavior. Other researchers believe that self-efficacy is a measurable
trait predicting behavior across domains (Chen, Gully & Eaden, 2001; Chen, Gully,
Whiteman & Kilcullen, 2000). Chen et al. (2000) found a high correlation between TSE
and generalized self-efficacy (GSE). They also found that TSE mediates the effects of
trait-like GSE. This finding supports Bandura’s (1997) contention that generalized beliefs
about the self are not good proximal predictors of behavior (Smith et al., 2006).
The predictive power of TSE has been demonstrated in major meta-analyses
(Mortiz, Feltz, Fahrbach, and Mack, 2000; Stajkovic & Luthans, 1998). Scholz, Dona,
Sud, & Schwarzer (2002) suggest that TSE predicts task performance better than GSE.
We will examine the relationship between TSE, performance, and satisfaction in our final
model.
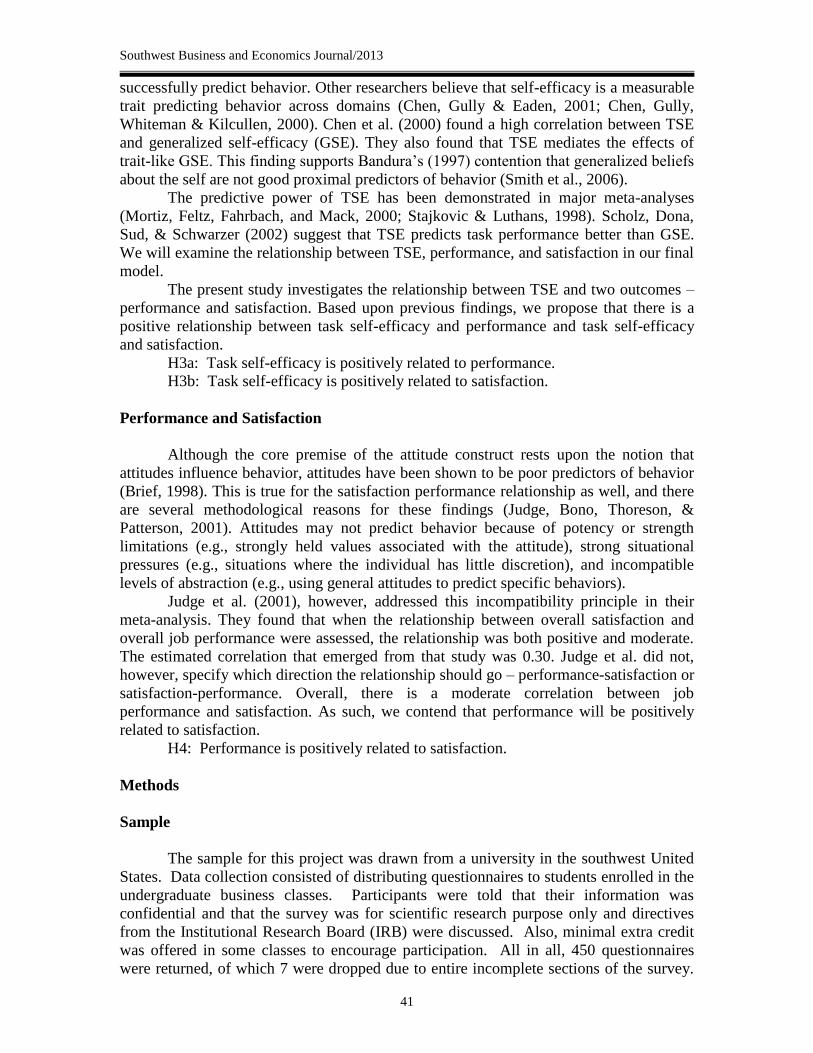
The present study investigates the relationship between TSE and two outcomes –
performance and satisfaction. Based upon previous findings, we propose that there is a
positive relationship between task self-efficacy and performance and task self-efficacy
and satisfaction.
H3a: Task self-efficacy is positively related to performance.
H3b: Task self-efficacy is positively related to satisfaction.
Performance and Satisfaction
Although the core premise of the attitude construct rests upon the notion that
attitudes influence behavior, attitudes have been shown to be poor predictors of behavior
(Brief, 1998). This is true for the satisfaction performance relationship as well, and there
are several methodological reasons for these findings (Judge, Bono, Thoreson, &
Patterson, 2001). Attitudes may not predict behavior because of potency or strength
limitations (e.g., strongly held values associated with the attitude), strong situational
pressures (e.g., situations where the individual has little discretion), and incompatible
levels of abstraction (e.g., using general attitudes to predict specific behaviors).
Judge et al. (2001), however, addressed this incompatibility principle in their
meta-analysis. They found that when the relationship between overall satisfaction and
overall job performance were assessed, the relationship was both positive and moderate.
The estimated correlation that emerged from that study was 0.30. Judge et al. did not,
however, specify which direction the relationship should go – performance-satisfaction or
satisfaction-performance. Overall, there is a moderate correlation between job
performance and satisfaction. As such, we contend that performance will be positively
related to satisfaction.
H4: Performance is positively related to satisfaction.
Methods
Sample
The sample for this project was drawn from a university in the southwest United
States. Data collection consisted of distributing questionnaires to students enrolled in the
undergraduate business classes. Participants were told that their information was
confidential and that the survey was for scientific research purpose only and directives
from the Institutional Research Board (IRB) were discussed. Also, minimal extra credit
was offered in some classes to encourage participation. All in all, 450 questionnaires
were returned, of which 7 were dropped due to entire incomplete sections of the survey.
Justice and Self-Efficacy:
Implications for Influence on Performance and Satisfaction
42
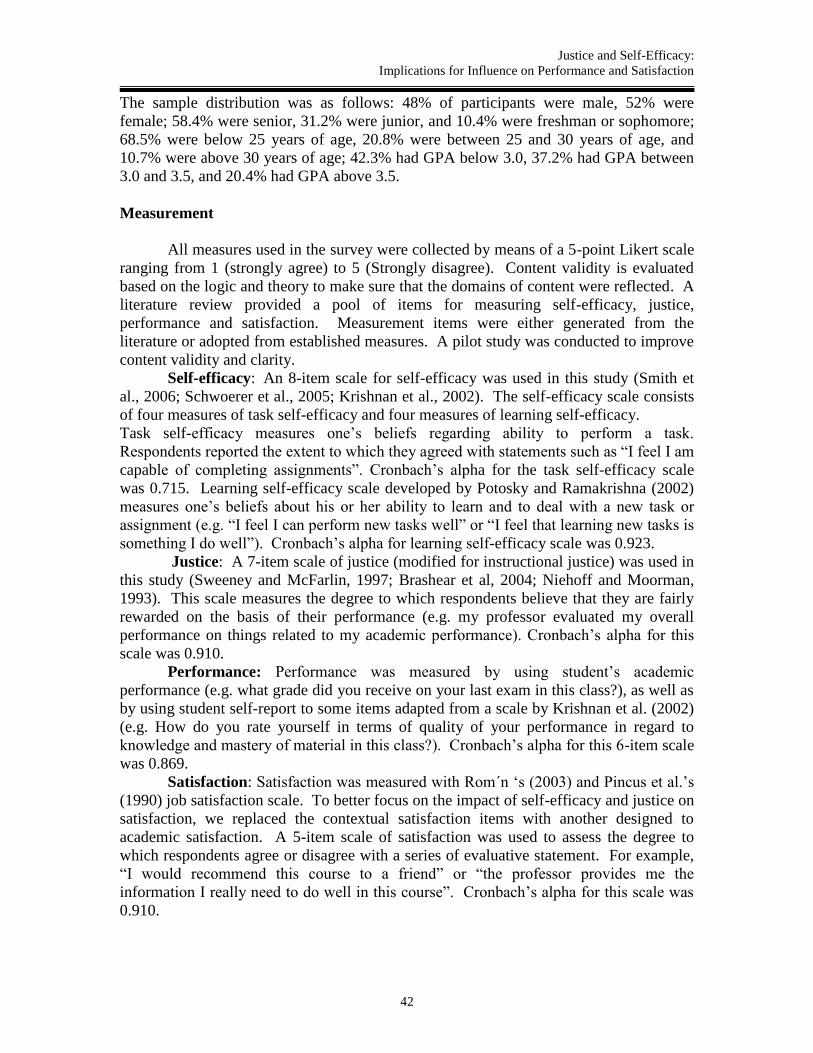
The sample distribution was as follows: 48% of participants were male, 52% were
female; 58.4% were senior, 31.2% were junior, and 10.4% were freshman or sophomore;
68.5% were below 25 years of age, 20.8% were between 25 and 30 years of age, and
10.7% were above 30 years of age; 42.3% had GPA below 3.0, 37.2% had GPA between
3.0 and 3.5, and 20.4% had GPA above 3.5.
Measurement
All measures used in the survey were collected by means of a 5-point Likert scale
ranging from 1 (strongly agree) to 5 (Strongly disagree). Content validity is evaluated
based on the logic and theory to make sure that the domains of content were reflected. A
literature review provided a pool of items for measuring self-efficacy, justice,
performance and satisfaction. Measurement items were either generated from the
literature or adopted from established measures. A pilot study was conducted to improve
content validity and clarity.
Self-efficacy: An 8-item scale for self-efficacy was used in this study (Smith et
al., 2006; Schwoerer et al., 2005; Krishnan et al., 2002). The self-efficacy scale consists
of four measures of task self-efficacy and four measures of learning self-efficacy.
Task self-efficacy measures one’s beliefs regarding ability to perform a task.
Respondents reported the extent to which they agreed with statements such as “I feel I am
capable of completing assignments”. Cronbach’s alpha for the task self-efficacy scale
was 0.715. Learning self-efficacy scale developed by Potosky and Ramakrishna (2002)
measures one’s beliefs about his or her ability to learn and to deal with a new task or
assignment (e.g. “I feel I can perform new tasks well” or “I feel that learning new tasks is
something I do well”). Cronbach’s alpha for learning self-efficacy scale was 0.923.
Justice: A 7-item scale of justice (modified for instructional justice) was used in
this study (Sweeney and McFarlin, 1997; Brashear et al, 2004; Niehoff and Moorman,
1993). This scale measures the degree to which respondents believe that they are fairly
rewarded on the basis of their performance (e.g. my professor evaluated my overall
performance on things related to my academic performance). Cronbach’s alpha for this
scale was 0.910.
Performance: Performance was measured by using student’s academic
performance (e.g. what grade did you receive on your last exam in this class?), as well as
by using student self-report to some items adapted from a scale by Krishnan et al. (2002)
(e.g. How do you rate yourself in terms of quality of your performance in regard to
knowledge and mastery of material in this class?). Cronbach’s alpha for this 6-item scale
was 0.869.
Satisfaction: Satisfaction was measured with Rom´n ‘s (2003) and Pincus et al.’s
(1990) job satisfaction scale. To better focus on the impact of self-efficacy and justice on
satisfaction, we replaced the contextual satisfaction items with another designed to
academic satisfaction. A 5-item scale of satisfaction was used to assess the degree to
which respondents agree or disagree with a series of evaluative statement. For example,
“I would recommend this course to a friend” or “the professor provides me the
information I really need to do well in this course”. Cronbach’s alpha for this scale was
0.910.
Southwest Business and Economics Journal/2013
43
Data Analysis Strategy
First, we conducted an exploratory factor analysis (EFA). As a conservative
heuristic, items with a loading smaller than 0.4 on any factor were deleted. Moreover,
the Kaiser (1960) eigenvalue-one criterion was used to identify the number of factors.
Next, a confirmatory factor analysis (CFA) was conducted because this technique
provides the more rigorous interpretation of reliability, validity and unidimensionality
than is provided by the exploratory factor analysis (Olorunniwo, Hsu, & Udo, 2006).
LISREL 8.54 was used to construct the measurement and structural equation models
discussed below. Following recommendations by Olorunniwo and colleagues (2006) and
Joreskog and Sorbom (1993), this study includes the following fit indices: chi-squared
statistic, adjusted goodness of fit index (AGFI), comparative fit index (CFI), normed fit
index (NFI), nonnormed fit index (NNFI), and root-mean-square error of approximation
index (RMSEA). An AGFI value greater than 0.8 is considered acceptable. Brown and
Cudeck (1989) suggest that RMSEA values at or below 0.08 indicate a good fit between
the model estimated by the sample data and the population. For the remaining fit indices
described above, values above 0.9 indicate a good fit. Modifications were performed
after the degree of fit was assessed by several generally accepted measures.
Results
Factor Analysis
Exploratory factor analysis was first used to determine which items should
contribute to justice perceptions and self-efficacy perceptions. Reliability was tested by
of 0.7 established by Nunnally (1978) (Tables 1a & 1b) indicating acceptable reliability.
Convergent and discriminant validity using inter-item correlation was then
assessed (Churchill 1979). The inter-item correlations (Table 2) between items were
generally higher within a factor than across factors. These indicate acceptable levels of
internal consistency as well as convergent and discriminant validity.
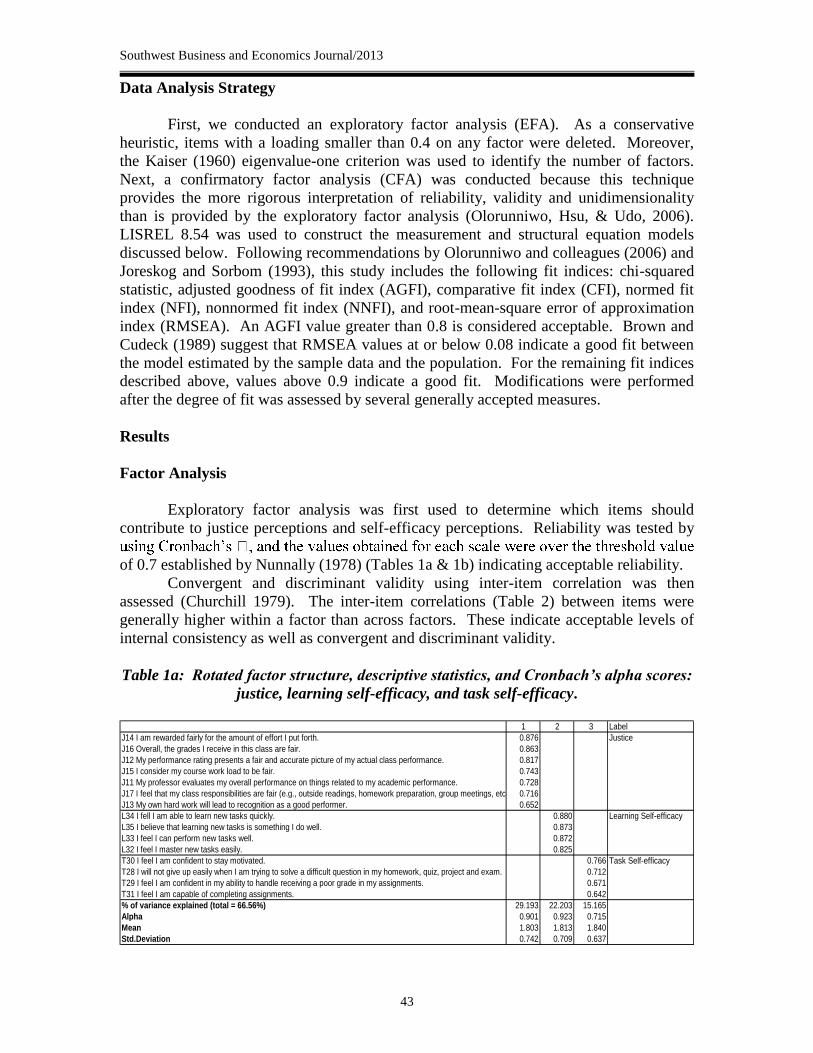
Table 1a: Rotated factor structure, descriptive statistics, and Cronbach’s alpha scores:
justice, learning self-efficacy, and task self-efficacy.
1 2 3 Label
J14 I am rewarded fairly for the amount of effort I put forth. 0.876 Justice
J16 Overall, the grades I receive in this class are fair. 0.863
J12 My performance rating presents a fair and accurate picture of my actual class performance. 0.817
J15 I consider my course work load to be fair. 0.743
J11 My professor evaluates my overall performance on things related to my academic performance. 0.728
J17 I feel that my class responsibilities are fair (e.g., outside readings, homework preparation, group meetings, etc.) 0.716
J13 My own hard work will lead to recognition as a good performer. 0.652
L34 I fell I am able to learn new tasks quickly. 0.880 Learning Self-efficacy
L35 I believe that learning new tasks is something I do well. 0.873
L33 I feel I can perform new tasks well. 0.872
L32 I feel I master new tasks easily. 0.825
T30 I feel I am confident to stay motivated. 0.766 Task Self-efficacy
T28 I will not give up easily when I am trying to solve a difficult question in my homework, quiz, project and exam. 0.712
T29 I feel I am confident in my ability to handle receiving a poor grade in my assignments. 0.671
T31 I feel I am capable of completing assignments. 0.642
% of variance explained (total = 66.56%) 29.193 22.203 15.165
Alpha 0.901 0.923 0.715
Mean 1.803 1.813 1.840
Std.Deviation 0.742 0.709 0.637

Justice and Self-Efficacy:
Implications for Influence on Performance and Satisfaction
44
Table 1b: Items measuring performance and satisfaction
N Mean SD Overall
Performance:
P38 What grade did you receive on your last exam in
this class? 442 2.602 1.104 Mean = 2.117
P47 How would you rate yourself in terms of the grades
you receive among students in this class? 439 2.405 0.919 SD = 0.666
P42 What grade do you expect to get in this class? 437 1.801 0.710 Alpha = 0.869
P43 What is the best grade you can get in this class
(Considering your specific circumstances)? 443 1.528 0.653
P48 How would you rate yourself in terms of the grades
you receive among your friends in school? 441 2.088 0.833
P49 How do you rate yourself in terms of quality of
your performance in regard to knowledge and
mastery of the material? 441 2.261 0.824
Satisfaction:
S51 I would recommend this course to a friend. 440 2.230 1.275 Mean = 2.020
S52 Overall, I am very satisfied with this course. 441 2.154 1.190 SD = 0.996
S54 I am kept informed of how I am progressing in this
course. 441 1.912 1.132 Alpha = 0.910
S55 The professor provides me the information I really
need to do well in this course. 441 1.916 1.083
S56 My course assignments are specified in clear and
concise language. 440 1.886 1.116
Table 2: Inter-item correlation: justice, learning self-efficacy, task self-efficacy,
performance, satisfaction
J11 J12 J13 J14 J15 J16 J17 L32 L33 L34 L35 T28 T29 T30 T31 P38 P42 P43 P47 P48 P49 S51 S52 S54 S55 S56
J11 1.0 0.6 0.4 0.5 0.4 0.6 0.5 0.2 0.2 0.2 0.2 0.2 0.2 0.2 0.3 0.1 0.2 0.1 0.2 0.1 0.2 0.4 0.4 0.4 0.5 0.5
J12 0.6 1.0 0.5 0.7 0.5 0.7 0.5 0.2 0.2 0.2 0.2 0.2 0.2 0.3 0.2 0.2 0.3 0.2 0.3 0.1 0.3 0.5 0.5 0.4 0.5 0.5
J13 0.4 0.5 1.0 0.6 0.4 0.5 0.3 0.3 0.3 0.2 0.2 0.2 0.2 0.2 0.2 0.1 0.2 0.2 0.2 0.1 0.2 0.4 0.4 0.4 0.4 0.4
J14 0.5 0.7 0.6 1.0 0.6 0.7 0.6 0.2 0.2 0.2 0.2 0.2 0.2 0.2 0.2 0.2 0.3 0.2 0.2 0.0 0.3 0.5 0.6 0.4 0.6 0.5
J15 0.4 0.5 0.4 0.6 1.0 0.6 0.6 0.3 0.2 0.3 0.2 0.2 0.2 0.2 0.3 0.1 0.2 0.2 0.2 0.0 0.2 0.4 0.5 0.3 0.5 0.4
J16 0.6 0.7 0.5 0.7 0.6 1.0 0.6 0.3 0.2 0.3 0.2 0.2 0.2 0.2 0.3 0.3 0.3 0.3 0.3 0.0 0.3 0.6 0.6 0.4 0.7 0.6
J17 0.5 0.5 0.3 0.6 0.6 0.6 1.0 0.2 0.2 0.2 0.2 0.3 0.2 0.3 0.3 0.2 0.2 0.1 0.2 0.1 0.2 0.4 0.4 0.3 0.5 0.5
L32 0.2 0.2 0.3 0.2 0.3 0.3 0.2 1.0 0.8 0.7 0.7 0.5 0.2 0.4 0.5 0.2 0.1 0.1 0.3 0.3 0.3 0.2 0.2 0.2 0.1 0.2
L33 0.2 0.2 0.3 0.2 0.2 0.2 0.2 0.8 1.0 0.7 0.7 0.4 0.2 0.4 0.4 0.1 0.1 0.1 0.3 0.2 0.3 0.1 0.2 0.2 0.1 0.2
L34 0.2 0.2 0.2 0.2 0.3 0.3 0.2 0.7 0.7 1.0 0.8 0.4 0.2 0.3 0.4 0.2 0.1 0.1 0.2 0.3 0.3 0.1 0.2 0.2 0.2 0.2
L35 0.2 0.2 0.2 0.2 0.2 0.2 0.2 0.7 0.7 0.8 1.0 0.4 0.3 0.3 0.4 0.2 0.1 0.1 0.3 0.3 0.3 0.1 0.1 0.2 0.2 0.2
T28 0.2 0.2 0.2 0.2 0.2 0.2 0.3 0.5 0.4 0.4 0.4 1.0 0.4 0.5 0.5 0.2 0.1 0.1 0.2 0.2 0.3 0.2 0.1 0.2 0.2 0.2
T29 0.2 0.2 0.2 0.2 0.2 0.2 0.2 0.2 0.2 0.2 0.3 0.4 1.0 0.4 0.3 0.1 0.0 0.1 0.1 0.0 0.1 0.2 0.2 0.2 0.2 0.3
T30 0.2 0.3 0.2 0.2 0.2 0.2 0.3 0.4 0.4 0.3 0.3 0.5 0.4 1.0 0.5 0.1 0.2 0.2 0.2 0.2 0.3 0.2 0.2 0.2 0.2 0.2
T31 0.3 0.2 0.2 0.2 0.3 0.3 0.3 0.5 0.4 0.4 0.4 0.5 0.3 0.5 1.0 0.2 0.2 0.2 0.3 0.3 0.3 0.2 0.3 0.2 0.2 0.3
P38 0.1 0.2 0.1 0.2 0.1 0.3 0.2 0.2 0.1 0.2 0.2 0.2 0.1 0.1 0.2 1.0 0.6 0.6 0.7 0.5 0.5 0.3 0.3 0.2 0.3 0.2
P42 0.2 0.3 0.2 0.3 0.2 0.3 0.2 0.1 0.1 0.1 0.1 0.1 0.0 0.2 0.2 0.6 1.0 0.7 0.6 0.4 0.5 0.4 0.4 0.3 0.4 0.3
P43 0.1 0.2 0.2 0.2 0.2 0.3 0.1 0.1 0.1 0.1 0.1 0.1 0.1 0.2 0.2 0.6 0.7 1.0 0.6 0.4 0.4 0.4 0.4 0.3 0.3 0.3
P47 0.2 0.3 0.2 0.2 0.2 0.3 0.2 0.3 0.3 0.2 0.3 0.2 0.1 0.2 0.3 0.7 0.6 0.6 1.0 0.6 0.6 0.2 0.3 0.3 0.2 0.2
P48 0.1 0.1 0.1 0.0 0.0 0.0 0.1 0.3 0.2 0.3 0.3 0.2 0.0 0.2 0.3 0.5 0.4 0.4 0.6 1.0 0.5 0.0 0.0 0.2 0.1 0.1
P49 0.2 0.3 0.2 0.3 0.2 0.3 0.2 0.3 0.3 0.3 0.3 0.3 0.1 0.3 0.3 0.5 0.5 0.4 0.6 0.5 1.0 0.3 0.3 0.3 0.3 0.3
S51 0.4 0.5 0.4 0.5 0.4 0.6 0.4 0.2 0.1 0.1 0.1 0.2 0.2 0.2 0.2 0.3 0.4 0.4 0.2 0.0 0.3 1.0 0.9 0.5 0.7 0.6
S52 0.4 0.5 0.4 0.6 0.5 0.6 0.4 0.2 0.2 0.2 0.1 0.1 0.2 0.2 0.3 0.3 0.4 0.4 0.3 0.0 0.3 0.9 1.0 0.5 0.7 0.7
S54 0.4 0.4 0.4 0.4 0.3 0.4 0.3 0.2 0.2 0.2 0.2 0.2 0.2 0.2 0.2 0.2 0.3 0.3 0.3 0.2 0.3 0.5 0.5 1.0 0.7 0.6
S55 0.5 0.5 0.4 0.6 0.5 0.7 0.5 0.1 0.1 0.2 0.2 0.2 0.2 0.2 0.2 0.3 0.4 0.3 0.2 0.1 0.3 0.7 0.7 0.7 1.0 0.7
S56 0.5 0.5 0.4 0.5 0.4 0.6 0.5 0.2 0.2 0.2 0.2 0.2 0.3 0.2 0.3 0.2 0.3 0.3 0.2 0.1 0.3 0.6 0.7 0.6 0.7 1.0

Southwest Business and Economics Journal/2013
45
Table 3 reports the correlations between the constructs in this study, which were
calculated from scales scores for all the latent variables. The significance of this set of
correlations offers support for the hypotheses in this study because significant
correlations exist between the justice and performance, justice and satisfaction,
performance and satisfaction, self-efficacy and performance, and self-efficacy and
satisfaction relationships.
Table 3: Intercorrelations of latent variables
1 2 3 4 5
1. Justice (0.74)
2. Learning Self-efficacy 0.31** (0.71)
3.Task Self-efficacy 0.37** 0.49** (0.64)
4. Performance 0.30** 0.28** 0.30** (0.67)
5. Satisfaction 0.70** 0.19** 0.33** 0.38** (1.00)
Note: Standard deviations are reported along the diagonal
** Correlation is significant at the 0.01 level (2-tailed).
Guided by results generated from the above analyses, a more rigid procedure (i.e.,
confirmatory factor analysis) was performed to further assess the unidimensionality of
each latent variable. Structural equation measurement modeling was used to test
unidimensionality in order to examine if an item measures one and only one construct
(Bagozzi, 1980). Jöreskog and Sörbom (1993) suggest that the separate measurement
model for each factor should be estimated, then, the measurement model for all factors is
constructed. At both steps, goodness-of-fit test should be used to assess whether or not
the model fits the data.
Three measurement models for all exogenous factors were evaluated, that is, the
measurement models represent justice, learning self-efficacy, and task self-efficacy
separately. All goodness-of-fit indices indicated an acceptable fit. By combining all the
factors into a full measurement model, further evidence can be obtained to assess the
convergent and discriminant validity of all of the five latent factors and facilitate the
analysis as to whether the full model fit the data as measured. Convergent validity was
assessed by reviewing the t-test for the factor loadings (Olorunniwo et al., 2006). If the t-
value of each item is greater than 2, it means that loadings of the items on their respective
factors are significant. Significant t-statistics values (p-value < 0.01) suggest that all
indicators provide good measures of their respective constructs (see results of factor
loadings and their t-statistics in Table 4). Goodness-of-fit indices were indicated by a
RMSEA of 0.053, a NFI of 0.96, a CFI of 0.98, a GFI of 0.89, and an AGFI of 0.87.
Justice and Self-Efficacy:
Implications for Influence on Performance and Satisfaction
46
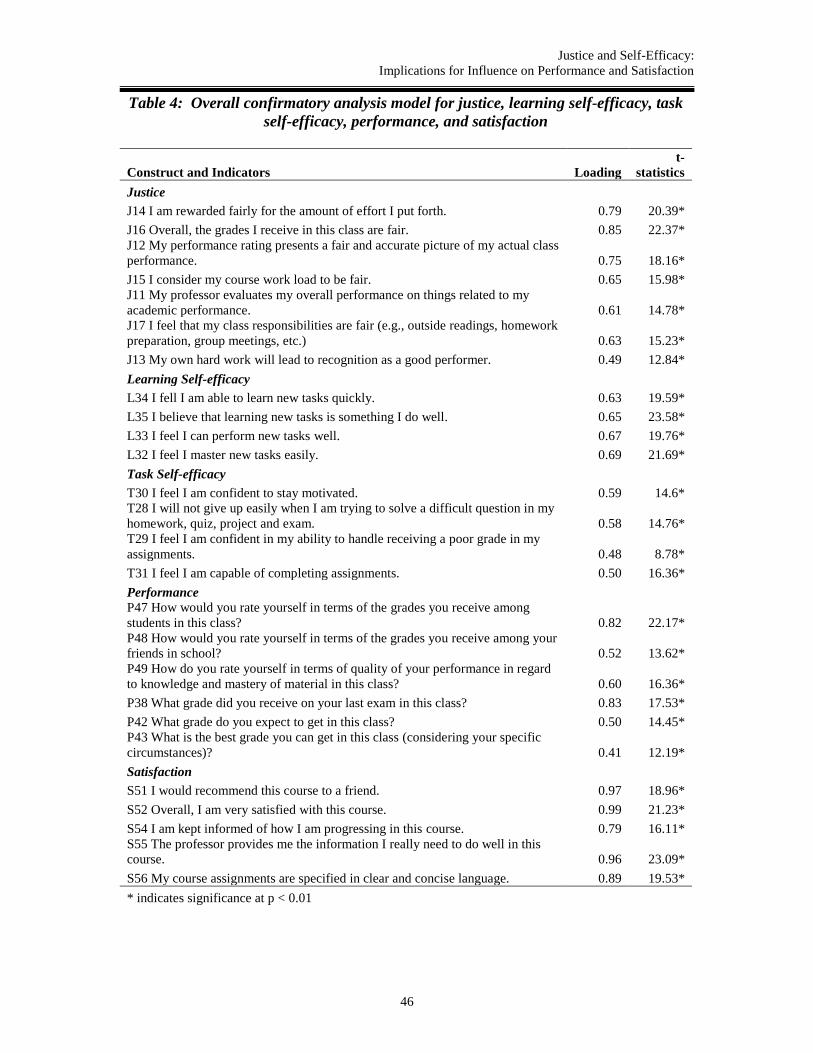
Table 4: Overall confirmatory analysis model for justice, learning self-efficacy, task
self-efficacy, performance, and satisfaction
Construct and Indicators Loading
t-
statistics
Justice
J14 I am rewarded fairly for the amount of effort I put forth. 0.79 20.39*
J16 Overall, the grades I receive in this class are fair. 0.85 22.37*
J12 My performance rating presents a fair and accurate picture of my actual class
performance. 0.75 18.16*
J15 I consider my course work load to be fair. 0.65 15.98*
J11 My professor evaluates my overall performance on things related to my
academic performance. 0.61 14.78*
J17 I feel that my class responsibilities are fair (e.g., outside readings, homework
preparation, group meetings, etc.) 0.63 15.23*
J13 My own hard work will lead to recognition as a good performer. 0.49 12.84*
Learning Self-efficacy
L34 I fell I am able to learn new tasks quickly. 0.63 19.59*
L35 I believe that learning new tasks is something I do well. 0.65 23.58*
L33 I feel I can perform new tasks well. 0.67 19.76*
L32 I feel I master new tasks easily. 0.69 21.69*
Task Self-efficacy
T30 I feel I am confident to stay motivated. 0.59 14.6*
T28 I will not give up easily when I am trying to solve a difficult question in my
homework, quiz, project and exam. 0.58 14.76*
T29 I feel I am confident in my ability to handle receiving a poor grade in my
assignments. 0.48 8.78*
T31 I feel I am capable of completing assignments. 0.50 16.36*
Performance
P47 How would you rate yourself in terms of the grades you receive among
students in this class? 0.82 22.17*
P48 How would you rate yourself in terms of the grades you receive among your
friends in school? 0.52 13.62*
P49 How do you rate yourself in terms of quality of your performance in regard
to knowledge and mastery of material in this class? 0.60 16.36*
P38 What grade did you receive on your last exam in this class? 0.83 17.53*
P42 What grade do you expect to get in this class? 0.50 14.45*
P43 What is the best grade you can get in this class (considering your specific
circumstances)? 0.41 12.19*
Satisfaction
S51 I would recommend this course to a friend. 0.97 18.96*
S52 Overall, I am very satisfied with this course. 0.99 21.23*
S54 I am kept informed of how I am progressing in this course. 0.79 16.11*
S55 The professor provides me the information I really need to do well in this
course. 0.96 23.09*
S56 My course assignments are specified in clear and concise language. 0.89 19.53*
* indicates significance at p < 0.01

Southwest Business and Economics Journal/2013
47
Discriminant validity was further assessed by χ2 difference tests between the
constrained and unconstrained model. In the constrained model, each pair of factors was
restricted to zero. Therefore, the change in χ2 reflects the effect of removing this pair of
factors and thus is a test of its significance to the model. The significant χ2 difference
(lower χ2 for the unconstrained model) suggests that the factors demonstrate discriminant
validity. Results indicate that all χ2 differences are statistically significant at p-value of
0.01.
Analysis of the Structural Model
The structural model was tested to determine the significance of each path based
on the results of the measurement models by using LISREL 8.54. The overall model fit
statistics indicate that the sample data fit the hypothesized model well. The χ2 test for the
fit of the full structural model has a value of 601.04 with 289 (P < 0.01) degrees freedom.
The χ2 test is sensitive to the sample size, however, and most studies obtain significant χ2
values when the sample size is more than 200 (Hair, Anderson, Yatham, & Black, 1995).
Meyer and Collier (2001) suggest that the RMSEA is not dependent on sample size. The
RMSEA of 0.051 for the model estimated here indicates good fit. Other overall model fit
statistics also reflect a good fit (NFI = 0.97, GFI = 0.90, CFI = 0.98, and AGFI = 0.88).
Significance of the individual paths was also examined. These tests allow for the
determination of the direction of the effects as well as their significance. The results for
each individual path provide empirical support for the estimated causal relationships in
the theoretical model (see Table 5). Hypothesis 1 states justice influences satisfaction
and performance. The t-test for H1a and H1b reveals that both are significant at the level
of 0.01. The support of these hypotheses indicates that justice is an overall driver of
satisfaction and performance. The path estimates for justice’s significant relationship are:
performance (γ = 0.22, p < 0.01) and satisfaction (γ = 0.84, p < 0.01).
Hypotheses 2 (a & b) suggest that learning self-efficacy has a direct positive
effect on both satisfaction and performance. The results in Table 5 indicate that learning
self-efficacy positively correlates with performance; however, it is not significant at α =
0.05. Also, the sample data indicate that learning self-efficacy has a significant, but
negative, influence on satisfaction, a direction opposite of that hypothesized (H2b).
Hypothesis 3 states that task self-efficacy is positively related to both
performance and satisfaction. H3a is supported by the results in Table 5 (γ = 0.40, p <
0.05), which indicate a significant positive influence of task self-efficacy on performance.
While our findings indicate that task self-efficacy positively correlates with satisfaction,
it is not significant at the level of 0.05. Thus, H3a is supported and H3b is rejected.
We also tested the premise that performance is positively related to satisfaction (γ
= 0.20, p < 0.01). Hypothesis 4 is therefore supported by the sample data. This finding
indicates that better performance is the reason for satisfaction.
Overall, the significance of the individual paths suggests that self-efficacy has
significant influence on performance; however, this relationship may be explained as the
improvement in performance mostly due to task self-efficacy, not learning self-efficacy.
Moreover, the direct and indirect effect of justice indicates the partial mediating influence
of performance on the relationship between justice and satisfaction. Furthermore, the
results of H3 and H4 suggest that performance fully mediates the relationship between
task self-efficacy and satisfaction.

Justice and Self-Efficacy:
Implications for Influence on Performance and Satisfaction
48
Table 5: Parameter estimates for the individual paths
Path Description Coefficient t-value
Performance Satisfaction 0.20** 4.01
Justice Performance 0.22** 3.91
Justice Satisfaction 0.84** 15.22
Learning Self-efficacy Performance 0.09 0.97
Task Self-efficacy Performance 0.40* 3.32
Learning Self-efficacy Satisfaction -0.22* -2.92
Task Self-efficacy Satisfaction 0.17 1.62
* p < 0.05 **p < 0.01
Discussion
The purpose of this paper was to determine which had more influence on
performance and satisfaction, justice perceptions or an individual’s self-efficacy. There
is an interesting finding regarding hypothesis 2b. While the coefficient is significant, the
direction of the coefficient is negative.
Research indicates that there are some instances where high degrees of self-
efficacy can actually have an inverse effect on performance (Vancouver, Thompson,
Tishner, & Putka, 2002; Vancouver, Thompson, & Williams, 2001). Individuals with
high learning self-efficacy may become overconfident in their ability to master a
cognitive task. In addition, the increased learning self-efficacy may cause the individual
to underestimate the level of difficulty associated learning the new material, process, or
function resulting in the individual actually reducing the amount of effort they expend.
Performance and satisfaction, under these circumstances, will be affected. It would be
interesting to learn if this situation is more likely to occur under more challenging
circumstances or when the perceived level of difficulty is either very high or very low.
Future research should explore these questions.
Justice is more strongly related to satisfaction (γ = 0.84, p < 0.01) than it is to
performance (γ = 0.22, p < 0.01). The justice-satisfaction relationship was also much
stronger than any of the other relationships indicating that the justice-satisfaction
relationship accounts for the greatest amount of variance in the model. The relationship
between task self-efficacy and performance explains the majority of the remaining
variance (B=0.40, p<0.01). All other significant coefficients were less than 0.22.
Overall, it appears that justice perceptions explain more of the variance in satisfaction
than self-efficacy, but that task self-efficacy explains more of the variance in
performance than justice.
The hypotheses in this study were generally supported. The exceptions are
hypothesis 2a and b and hypothesis 3b all pertaining to self-efficacy. Hypothesis 2a,
which suggested that learning self-efficacy is positively related to performance, was not
supported. Hypothesis 3b proposing a positive relationship between task self-efficacy
and performance was also non-significant. While hypothesis 2b was significant
indicating a relationship between learning self-efficacy exists, the coefficient sign was in
the opposite direction of the hypothesized relationship.
Results indicate that performance is significantly related to satisfaction providing
support for hypothesis 4. That is, the better one performs the more satisfied he or she
will be with his or her performance. Judge et al. (2001) suggested that the relationship
Southwest Business and Economics Journal/2013
49
between performance and satisfaction could be non-recursive, and that higher levels of
satisfaction could reinforce strong performance. Future research should evaluate this
proposition. In sum, our findings support that performance has a partial mediating effect
on the relationship between justice and satisfaction; simultaneously, performance also has
a full mediating effect on the relationship between task self-efficacy and satisfaction.
Limitations
One of the basic limitations to this study is its reliance on cross-sectional, self-
report data. This reliance precludes us from making strong causal statements about, or
generalizing from these results. Future research should employ a longitudinal study
designs to improve the assessment of causality.
Another potential limitation associated with this study is mono-method bias, a
threat to construct validity because only one method of measurement was used (Trochim
and Donnelly, 2007). Procedural and statistical remedies were applied to minimize the
effects of consistency artifacts (Podsakoff, MacKenzie, Lee, & Podsakoff, 2003;
Podsakoff & Organ, 1986). Furthermore, structural equation modeling (SEM) was used
to minimize the effects of common method variance (Podsakoff et al., 2003). Temporal
separation of data collection between criterion and predictor variables to contend with
another issue associated with common method variance (CMV), in which CMV saturates
higher order multidimensional constructs, is recommended by researchers (Johnson,
Rosen, & Djurdjevic, 2011). Various constraints (i.e., time, financial, etc.) prohibited
temporal separation of data collection for the present study. Thus, while researchers
suggest that common method variance presents less of a concern in some studies
(Spector, 2006), correlations in the bivariate correlation analysis point to the notion that
common method variance may be present in this study. Hence, it is impossible to rule out
potential bias due to CMV even though every effort was used to minimize potential
effects, and results should be considered accordingly.
Theoretical and Practical Contributions
There is an abundance of research evaluating organizational justice relationships
(e.g., Cohen-Charash & Spector, 2001; Colquitt, et al., 2001; Colquitt & Rodell, 2011;
Cropanzano & Greenberg, 1997; Greenberg, 1990; Monin, Noorderhaven, Vaara, &
Kroon, 2013; Moorman, 1991, etc.). Similarly, there is copious research evaluating
relationships associated with self-efficacy (e.g., Bandura, 1977; Chen, Gully, Whiteman,
& Kilcullen, 2000; Gist, & Mitchell, 1992; Krishnan et al., 2003; Mortiz et al., 2000;
Scholz et al., 2002; Schwoerer et al., 2005; Smith et al., 2006; Zimmerman, 1995;
Zimmerman et al., 1992, etc.). There is a dearth of research, however, integrating these
two areas of inquiry, particularly in the instructional literature. This study provides a first
step in addressing this important gap in the literature. As such, one of the major
theoretical contributions of this study is the assessment of the mediating role of
performance on the relationship between both justice and self-efficacy on perceptions of
satisfaction among students.
Results from this study also have implications both in business organizations and
in the classroom. First and foremost, findings are in alignment with both management
and instructional research (e.g., Bollliger, 2004; Cohen-Charash & Spector, 2001;
Colquitt et al., 2001; Colquitt et al., 2012; Colquitt & Rodell, 2011; Cropanzano &
Greenberg, 1997; Folger & Greenberg, 1985; Krishnan et al., 2003, Nesbit & Burton,
Justice and Self-Efficacy:
Implications for Influence on Performance and Satisfaction
50
2006; Swan, 2001) confirming that justice perceptions influence performance and
satisfaction. Specifically, findings indicate that justice is an overall driver of satisfaction
and performance. Those in charge should ensure that justice norms are embraced as part
of an organization or institution’s culture to ensure that individual performance and
satisfaction are maximized.
Findings from this study indicate that self-efficacy does not influence
performance but rather self-efficacy negatively influences satisfaction. These findings
align with research (Vancouver et al., 2002; Vancouver et al., 2001) suggesting that
individuals high in self-efficacy can underestimate the level of difficulty or overestimate
their abilities (due to overconfidence). Thus, establishing clear expectations regarding
difficulty can assist individuals in expending the appropriate amount of effort in reaching
performance and satisfaction outcomes. It is important for professors and instructors to
clarify expectations regarding coursework so that students do not underestimate either
difficulty level or time allocation necessary in preparation for assignments and exams.
Moreover, expectations should be explored and discussed to bring student’s confidence
levels in line with actual ability to perform well in challenging courses.
Future Research
Future research should evaluate whether increasingly challenging circumstances
influence performance and satisfaction for individuals both high and low in perceived
self-efficacy. Moreover, evaluating perceived levels of difficulty (either very high or
very low) would help expand the nomological network related to these associations.
Future research efforts investigating these hypotheses, with other samples from both
academia and various occupations to determine the robustness of results is also
necessary. Additionally, studies with other consequences such as task performance,
organizational citizenship behavior, turnover and organizational commitment would help
extend understanding related to these associations. We encourage future studies that
examine these outcomes, as well as research efforts with other, related consequences and
longitudinal research designs as these types of investigations would be insightful.
Southwest Business and Economics Journal/2013
51
References
Adams, J. S. (1963). Toward and understanding of inequity. Journal of Abnormal and
Social Psychology, 76, 422-436.
Adams, J. S. (1965). Inequity in social exchange. In L. Berkowitz (Ed.), Advances in
Experimental Social Psychology, 2, 267-299. New York: Academic Press.
Alexander, S., & Ruderman, M. (1987). The role of procedural and distributive justice in
organizational behavior. Social Justice Research, 1, 177-198.
Ang, S., Van Dyne, L. & Begley, T. M. (2003). The employment relationship of foreign
workers versus local employees: A field study of organizational justice, job
satisfaction, performance, and OCB. Journal of Organizational Behavior, 24, 561-
583.
Awamlch, R. & Al-Dmour, H. (2004). The impact of transformational leadership on job
satisfaction and self-perceived performance of banking employees: The case of
Jordan. International Business and Economics Journal, 3(11), 29-42.
Bandura, A. (1977). Self-efficacy: Toward a unifying theory of behavioral change.
Psychological Review, 84, 191-215.
Bandura, A. (1977). Self-efficacy: The exercise of control. New York: Freeman.
Barrick, M. R., Mount, M. K., & Strauss, J. P. (1993). Conscientiousness and
performance of sales representatives: Test of the mediating effects of goal setting.
Journal of Applied Psychology, 5: 715-722.
Bies, R. J., & Moag, J. F. (1986). Interactional justice: Communication criteria of
fairness. In R. J. Lewicki, B. H. Sheppard, & M. H. Bazerman (Eds.), Research
on negotiations in organization (Vol. 1, pp. 43-55). Greenwhich, CT: JAI Press.
Bolliger, D.U. (2004). Key Factors for Determining Student Satisfaction in Online
Courses. International Journal on E-Learning, 3(1), 61-67. Norfolk, VA: AACE.
Retrieved February 8, 2014.`
Brief, A. P. (1998). The social psychology of attitudes. In Attitudes in and around
organizations, 49-83, Sage Publications.
Brown, M. W. and Cudeck, R. (1989). Single sample cross-validation indices for
covariance structures. Multivariate Behavioral Research, 24: 445-455.
Chen, Z.J. (2000). The impact of teacher-student relationships on college students'
learning: Exploring the organizational cultures in the classroom. Qualitative
Research Reports in Communication, 1, 76-83.
Chen, G., Gully, L. M., & Eden, D. (2001). Validation of a new general self-efficacy
scale. Organizational Research Methods, 4, 62-83.

Justice and Self-Efficacy:
Implications for Influence on Performance and Satisfaction
52
Chen, G., Gully, S. A., Whiteman, J. A., & Kilcullen, R. N. (2000). Examination of
relationships among trait-like individual differences, state-like individual
differences, and learning performance. Journal of Applied Psychology, 85, 835-
847.
Chory, R.M. & McCroskcy, J.C. (1999). The relationship between teacher management
communication style and affective learning. Communication Quarterly, 47, 1-11.
Chory-Assad, R.M. (2002). Classroom justice: Perceptions of fairness as a predictor of
student motivation, learning, and aggression. Communication Quarterly, 50(1),
58-77.
Churchill, G.A. (1979). A paradigm for developing better measures of marketing
constructs. Journal of Marketing Research, 16, 64-73.
Cohen-Charash, Y. & Spector, P. E. (2001). The role of justice in organizations: A meta-
analysis. Organizational Behavior and Human Decision Processes, 86(2), 278-
321.
Colquitt, J. A. (1999, August). On the dimensionality of organizational justice: A
construct validation of a measure. Paper present at the Annual Meeting of the
Academy of Management, Chicago.
Colquitt, J. A., Conolon, D. E., Wesson, M, J., Porter, C. O. L. H., & Ng, K. Y. (2001).
Justice at the millennium: A meta-analytic review of 25 years of organizational
justice research. Journal of Applied Psychology, 86, 425-445.
Colquitt, J. A. & Rodell, J. B. (2011). Justice, trust, and trustworthiness: A longitudinal
analysis integrating three theoretical perspectives. Academy of Management
Journal, 54(6), 1183-1206.
Colquitt, J. A., LePine, J. A., Piccolo, R. F., Zapata, C. P., & Rich, B. L. (2012).
Explaining the justice-performance relationship: Trust as exchange deepener or
trust as uncertainty reducer? Journal of Applied Psychology, 97, 1–15.
Cropanzano, R., & Greenberg, J. (1997). Progress in organizational justice: Tunneling
through the maze. In C.L. Cooper, & LT. Robertson (Eds.), International review
of industrial and organizational psychology. 12. Chichester, UK: Wiley.
Cropanzano, R., & Prehair, C. A. (1999). Using social exchange theory to distinguish
procedural form interactional justice. Paper presented at the Annual Meeting of
the Society for Industrial and Organizational Psychology, Atlanta, GA.
Dirks, K. T., & Ferrin, D. L. (2002). Trust in leadership: Meta-analytic findings and
implications for research and practice. Journal of Applied Psychology, 87,611-
628.
Southwest Business and Economics Journal/2013
53
Folger, R., & Greenberg, J. (1985). Procedural justice: An interpretive analysis of
personnel systems. In K. M. Rowland & G. R. Ferris (Eds.), Research in
personnel and human resource management, (Vol 3, p. 141-183). Greenwich, CT: JAI
Press.
Folger, R. & Konovsky, M. A. (1989). Effects of procedural and distributive justice on
reactions to pay raise decisions. Academy of Management Journal, 32, 115-130.
Gilliand, S. W. (1994). Effects of procedural and distributive justice on reactions to a
selection system. Journal of Applied Psychology, 79, 669-691.
Gist, M. E., & Mitchell, T. R. (1992). Self-efficacy: A theoretical analysis of its
determinants and malleability. Academy of Management Journal, 17, 183-211.
Greenberg, J. (1990). Organizational justice: Yesterday, today, and tomorrow. Journal of
Management, 16(2), 399-432.
Hair, J. F. Anderson, R. E., Yatham, R. L. , & Black, W. C. (1995). Multivariate Data
Analysis, Fourth Edition. Prentice Hall, Upper Saddle River, NJ.
Johnson, R. E., Rosen, C. C., Djurdjevic, E. (2011). Assessing the impact of common
method variance on higher order multidimensional constructs. Journal of Applied
Psychology, 96, 744-761.
Joreskog, K. & Sorbom, D. (1993). LISREL 8: Structural Equation Modeling with the
SIMPLIS Command Language, Erlbaum, Hillsdale, NJ.
Judge, T., Bono, J. E., Thoresen, C. J., & Patton, G. K. (2001). The job satisfaction-job
performance relationship: A qualitative and quantitative review. Psychological
Bulletin, 127(3), 376-407.
Kaiser, H.F. (1960). The application of electric computers to factor analysis. Educational
and Psychological Measurement, 20: 141-151.
Kanifer, R. (1987). Task-specific motivation: An integrative approach to issues of
measurement, mechanisms, processes, and determinants. Journal of Social and
Clinical Psychology, 5, 237-264.
Krishnan, B. C., Netenmeyer, R. G., & Boles, J. S. (2003). Self-efficacy,
competitiveness, and effort as antecedents of salesperson performance. Journal of
personal Selling & Sales Management, 22 (4), 285-295.
Leventhal, G. S. (1976). The distribution of rewards and resources in groups and
organizations. In L. Berkowitz & W. Walster (Eds.), Advances in experimental
social psychology (Vol. 9. Pp. 91-131). New York, NY. Academic Press.
McFarlin, D. B, & Sweeney, P. D. (1992). Distributive and procedural justice as
predictors of satisfaction with personal and organizational outcomes. Academy of
Management Journal, 35, 626-637.

Justice and Self-Efficacy:
Implications for Influence on Performance and Satisfaction
54
Meyer, S.M. & Collier, D.A (2001). An Empirical Test of the Causal Relationships in the
Baldrige Health Care Pilot Criteria. Journal of Operations Management, 19(4),
2403-425
Moorman, R. H. (1991). Relationship between organizational justice and organizational
citizenship behaviors: Do fairness perceptions influence employee citizenship?
Journal of Applied Psychology. 76, 845-855.
Monin, P., Noorderhaven, N., Vaara, E., & Kroon, D. (2013). Giving sense to and
making sense of justice in postmerger integration. Academy of Management
Journal, 56(1), 256-284.
Mortiz E., Feltz, D. L., Fahrbach, K. R., & Mack, D. E. (2000). The relation of self-
efficacy measures to sports performance: A meta-analytic review. Research
Quarterly for Exercise and Sport, 71, 280-294.
Nesbit, P. L., & Burton, S. (2006). Student justice perceptions following assignment
feedback. Assessment & Evaluation in Higher Education, 31(6), 655–670.
Niehoff, B. P., & Moorman, R. H.. (1993). Justice as a mediator of the relationship
between methods of monitoring and organizational citizenship behavior.
Academy of Management Journal, 36(3), 527-557.
Nunnally, J. C. (1978). Psychometric Theory. New York: McGraw-Hill.
Olorunniwo, F., Hsu, M. K. & Udo, G. (2006). Service quality, customer satisfaction, and
behavioral intentions in the service factory. Journal of Services Marketing, 20(1),
59-72.
Otto, K.., Glaser, D., & Dalbert, C. (2009). Mental health, occupational trust, and quality
of working life: Does belief in a just world matter? Journal of Applied Social
Psychology, 39(6), 1288–1315.
Pincus, J. D., Knipp, J. E. & Rayfield, R. E. (1990). Internal communication and job
satisfaction revisited: The impact of organizational trust and influence on
commercial bank supervisors. Public Relations Research Annual, 2, 173-192.
Podsakoff, P. M., MacKenzie, S. B., Lee, J-Y. & Podsakoff, N. P. (2003). Common
method bias in behavioral research: A critical view of the literature and
recommended remedies. Journal of Applied Psychology, 88(5), 879-903.
Podsakoff, P. A. & Organ, D. W. (1986). Self-reports in organizational research:
Problems and prospects. Journal of Management, 12, 531-544.
Potosky, D., & Ramakrishna, H. V. (2002). The Moderating Role of Updating Climate
Perceptions in the Relationship between Goal Orientation, Self-Efficacy, and Job
Performance. Human Performance, 15(3), 275-297.
Southwest Business and Economics Journal/2013
55
Rawls, J. (1971). A theory of justice. Cambridge, MA: Harvard University Press.
Richmond, V.P. & Mi-Croskey, J.C. (Eds.) (1992). Power in the classroom:
Communication, control, and concern. Hillsdale, NJ: Lawrence Erlbaum
Associates.
Rom´n, S. (2003). The impact of ethical sales behavior on customer satisfaction, trust,
and loyalty to the company: An empirical study in the financial services industry.
Journal of Marketing Management, 19(9/10), 915-939.
Scholz, U., Dona, B. G., Sug, S., & Schwarzer, R. (2002). Is general self-efficacy a
universal construct? Psychometric findings from 25 countries. European Journal
of Psychological Assessment, 18, 242-251.
Schwarzer, R. (Ed.) (1992). Self-efficacy: Thought control of action. Washington, DC:
Hemisphere.
Schwarzer, R., & Jerusalem, M. (1995). Genrealized Self-Efficacy scale. In J. Weinman,
S. Wright, & M. Johnston, Measures in health psychology: A user’s portfolio.
Causal and control beliefs (pp. 35-37). Windsor, UK: NFER-Nelson.
Schwoerer, C. E., May, D. R., Hollensbe, E. C., & Mencl, J. (2005) General and specific
self-efficacy in the context of a training intervention t enhance performance
expectancy. Human Resource Development Quarterly, 16(1), 111-128.
Shao, R., Rupp, D. E., Sharlicki, D. P., & Jones, K. S. (2013). Employee Justice Across
Cultures: A meta-analytic review. Journal of Management, 39(1): 263-301.
Smith, S. A., Kass, S. J., Rotunda, R. J., & Schneider, S. K. (2006). If at first you don’t
succeed: Effects of failure on general and task-specific self-efficacy and
performance. North American Journal of Psychology, 8(1), 171-182.
Spector, P. E. (2006). Method variance in organizational research: Truth or urban legend?
Organizational Research Methods, 9, 221-232.
Stajkovic, A. D., & Luthans, F. (1998). Self-efficacy and work related performance: A
meta-analysis. Psychological Bulletin, 124(2), 240-261.
Swan, K. (2001). Virtual interactivity: design factors affecting student satisfaction and
perceived learning in asynchronous online courses. Distance Education, 22, (2),
306-331.
Sweeney, P. D., & McFarlin, D. B. (1997). Process and outcome: gender difference in the
assessment of justice. Journal of Organizational Behavior, 18, 83-98.
Sweeney, P. D., & McFarlin, D. B. (1993). Workers’ evaluations of the “ends” and the
“means”: An examination of four models of distributive and procedural justice.
Organizational Behavior and Human Decision Processes, 55, 23-40.
Justice and Self-Efficacy:
Implications for Influence on Performance and Satisfaction
56
Tyler, T.R. (1987). Procedural justice research. Social Justice Research, 1, 41-65.
Tyler, T. R., & Biex, R. J. (1990). Beyond formal procedures: The interpersonal context
of procedural justice. In J. S. Carrol (Ed.), Applied social and psychology and
organizational settings (pp. 77-98). Hillsdale, NJ: Erlbaum.
Trochim, W. K. M., and Donnelly, J. P, (2007). Research methods knowledge base.
Mason, OH: Thompson.
Walster, E., Walster, G. W., & Bersheid, E. (1978). Equity: Theory and research. Boston:
Allyn & Bacon.
Wang, X., Liao, J., Xia, D., & Tao, C. (2010). The impact of organizational justice on
work performance: Mediating effects of organizational commitment and leader-
member exchange. International Journal of Manpower, 31(6), 660-677.
Zimmerman, B. J. (1995). Self-efficacy in educational development. In A. Bandura, Self-
efficacy in changing societies (pp. 202-231). New York: Cambridge University
Press.
Zimmerman, B. J., Bandura, A., & Martinez-Ponz, M. (1992). Self-motivation for
academic attainment: The role of self-efficacy beliefs and personal goal setting.
American Educational Research Journal, 29, 663-676.