Jussi Pesonen President and CEO 29 April, 2009 › siteassets › asset › investors › ...Jussi...
30
UPM Q1 RESULTS 2009 Jussi Pesonen President and CEO 29 April, 2009
Transcript of Jussi Pesonen President and CEO 29 April, 2009 › siteassets › asset › investors › ...Jussi...

UPM Q1 RESULTS 2009
Jussi PesonenPresident and CEO
29 April, 2009
UPM 2
Q1 2009 in brief
Demand for paper, labels, plywood and sawn timber declined significantly - competing devaluations further affected sales from Finland
The company reported an operating loss due to low delivery volumes, despite increases in paper and label prices and cost savings
Focus on cash preservation and cost savings– Operating cash flow was €274 million (€50 million)– Restructuring and flexible way of operating saved costs
Liquidity remained good. The new revolving credit facility was signed in March
UPM 3
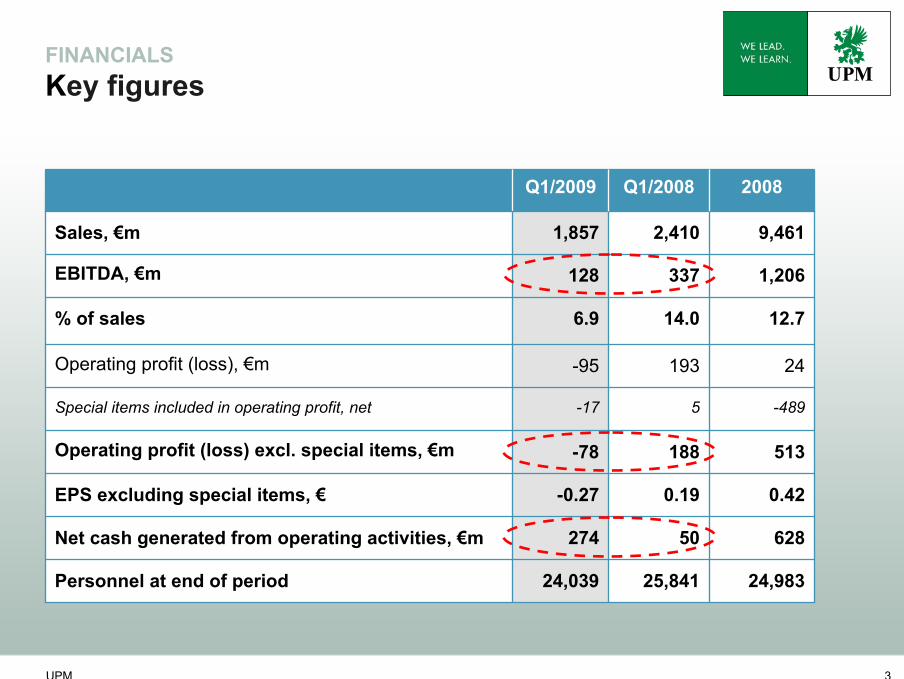
24,039
274
-0.27
-78
-17
-95
6.9
128
1,857
Q1/2009
25,841
50
0.19
188
5
193
14.0
337
2,410
Q1/2008
24,983
628
0.42
513
-489
24
12.7
1,206
9,461
2008
EBITDA, €m
% of sales
Net cash generated from operating activities, €m
Personnel at end of period
Operating profit (loss) excl. special items, €m
Special items included in operating profit, net
EPS excluding special items, €
Operating profit (loss), €m
Sales, €m
FINANCIALSKey figures
UPM 4
-75
-50
-25
0
25
50
75
100
125
150
175
200
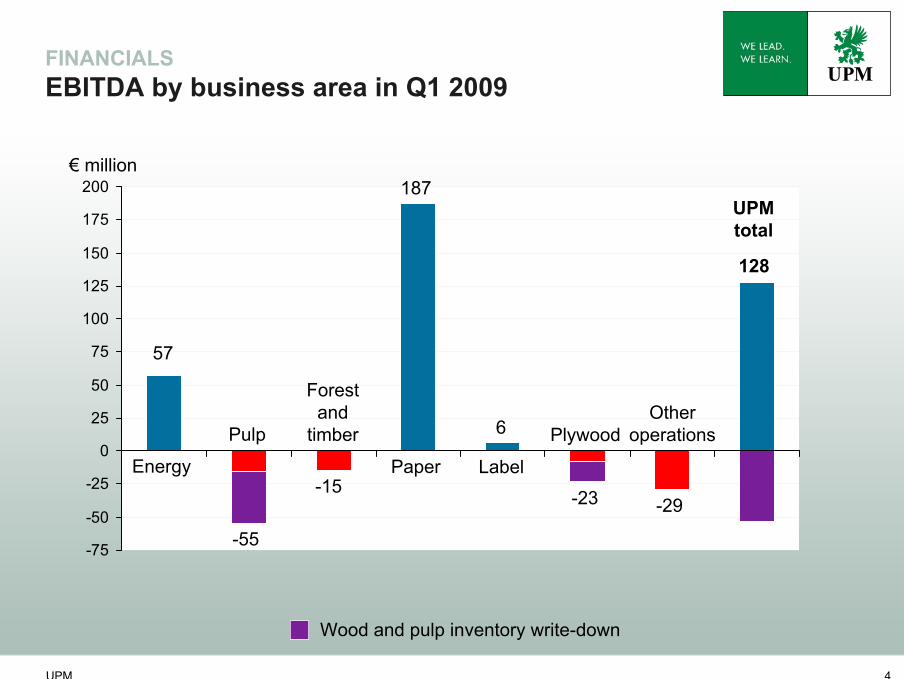
FINANCIALSEBITDA by business area in Q1 2009
57
Energy
Pulp
Forestand
timber
Paper Label
Plywood
€ million
-55
-15
187
6
-23 -29
UPMtotal
128
Wood and pulp inventory write-down
Otheroperations
UPM 5
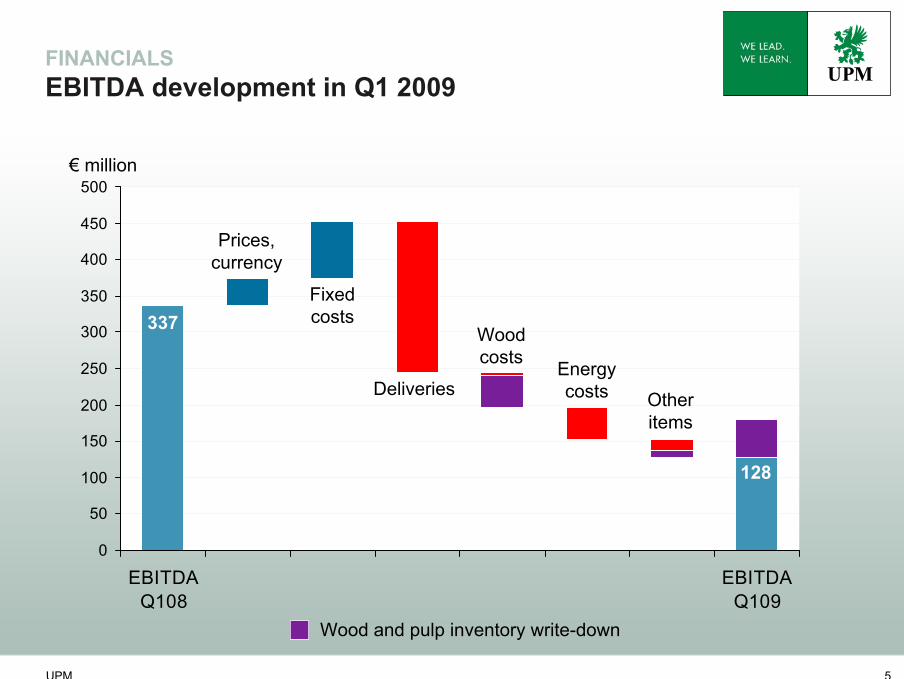
FINANCIALSEBITDA development in Q1 2009
0
50
100
150
200
250
300
350
400
450
500
EBITDAQ108
EBITDAQ109
€ million
337
128
Prices, currency
Deliveries
Wood costs Energy
costs Otheritems
Fixed costs
Wood and pulp inventory write-down
UPM 6
-100
-80
-60
-40
-20
0
20
40
60
80
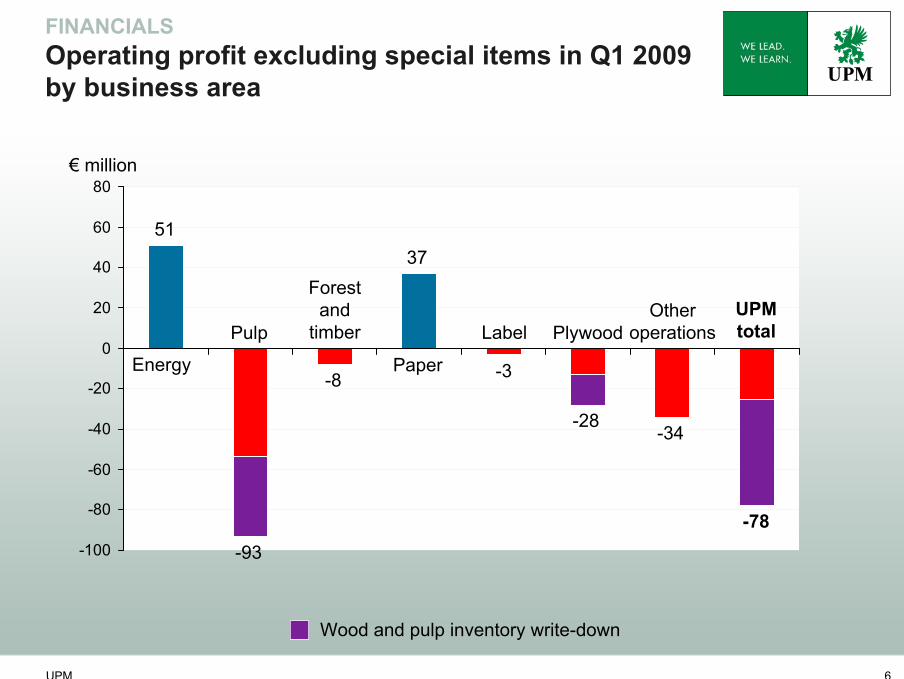
FINANCIALSOperating profit excluding special items in Q1 2009 by business area
51
Energy
Pulp
Forestand
timber
Paper
Label PlywoodOther
operations
€ million
-93
-8
37
-3
-28-34
UPMtotal
-78
Wood and pulp inventory write-down

UPM 7
FINANCIALSOperating in a low-demand environment Case Paper
Sales declined by 22%Higher prices maintainedSignificant reduction in fixed costs through restructuring and flexible way of workingLower pulp costs compensated for the increase in energy costs
EBITDA margin increased to 13.7% (11.8%)
-4%-1%-22%Sales growth, %
10,6412,7532,028Paper deliveries, 1,000 t
885209187EBITDA, M€
0%
50
11.8
1,773
Q1 2008
12,613.7EBITDA, % of sales
-26%
37
1,367
Q1 2009
-7%Paper deliveries, % change
250Operating profit, M€excl. special items
7,011Sales, M€
2008Paper
DEMAND AND DELIVERIES
UPM 9
-9,0
-7,4
-5,9
-4,3
-2,8
-1,2
0,3
1,9
3,4
5,0
1996 1997 1998 1999 2000 2001 2002 2003 2004 2005 2006 2007 2008 2009-25
-20
-15
-10
-5
0
5
10
15
20
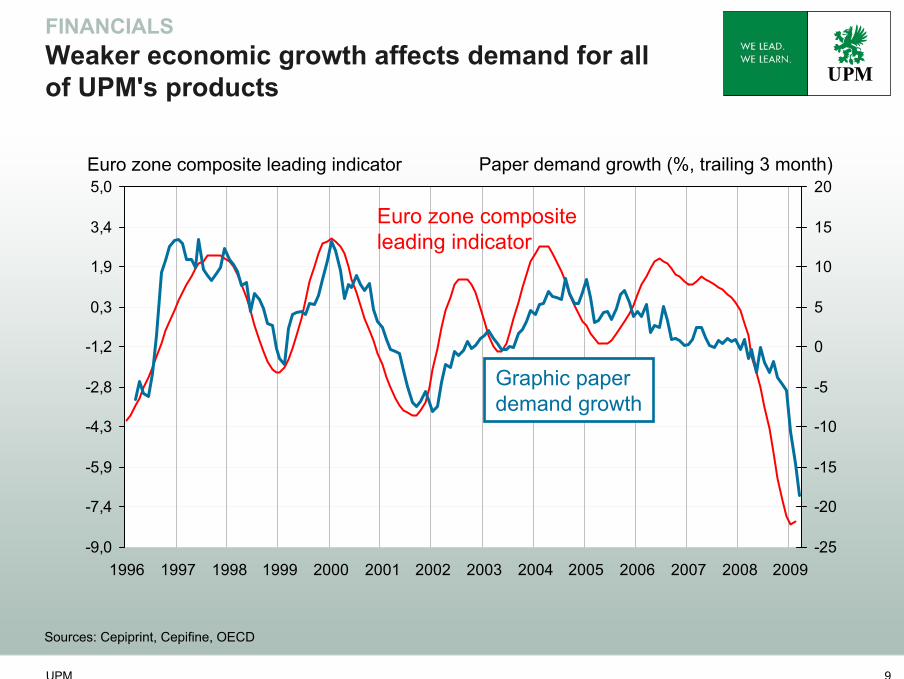
FINANCIALSWeaker economic growth affects demand for all of UPM's products
Paper demand growth (%, trailing 3 month)
Sources: Cepiprint, Cepifine, OECD
Euro zone composite leading indicator
Graphic paper demand growth
Euro zone composite leading indicator
UPM 10
0
1 000
2 000
3 000
4 000
5 000
6 000
7 000
8 000
Q1 08 Q2 08 Q3 08 Q4 08 Q1 09
Europe Exports
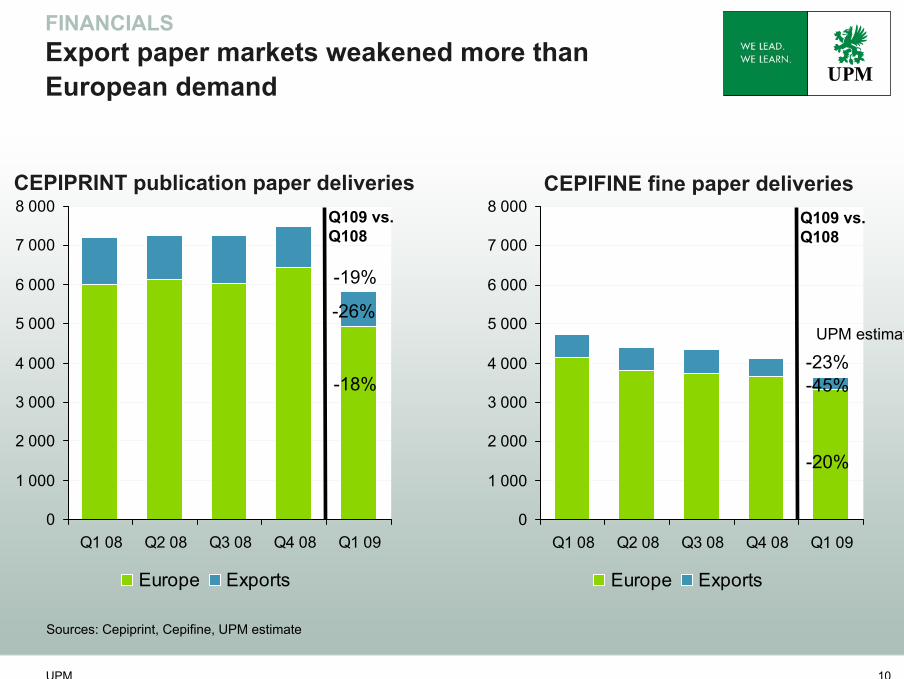
FINANCIALSExport paper markets weakened more than European demand
0
1 000
2 000
3 000
4 000
5 000
6 000
7 000
8 000
Q1 08 Q2 08 Q3 08 Q4 08 Q1 09
Europe Exports
Sources: Cepiprint, Cepifine, UPM estimate
-19%
-18%
-26%
-23%
-20%
-45%
CEPIPRINT publication paper deliveries CEPIFINE fine paper deliveriesQ109 vs. Q108
Q109 vs. Q108
UPM estimate
UPM 11
-80
-70
-60
-50
-40
-30
-20
-10
0
10
20
Q107 Q207 Q307 Q407 Q108 Q208 Q308 Q408 Q109
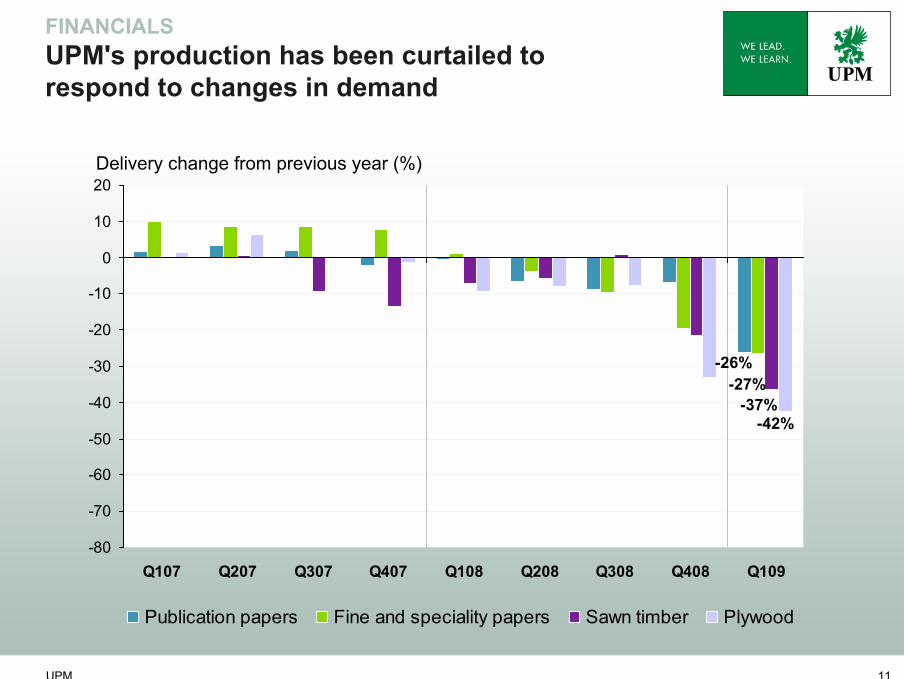
Publication papers Fine and speciality papers Sawn timber Plywood
FINANCIALSUPM's production has been curtailed to respond to changes in demand
Delivery change from previous year (%)
-26%-27%
-37%-42%

PRICES AND COSTS
UPM 13
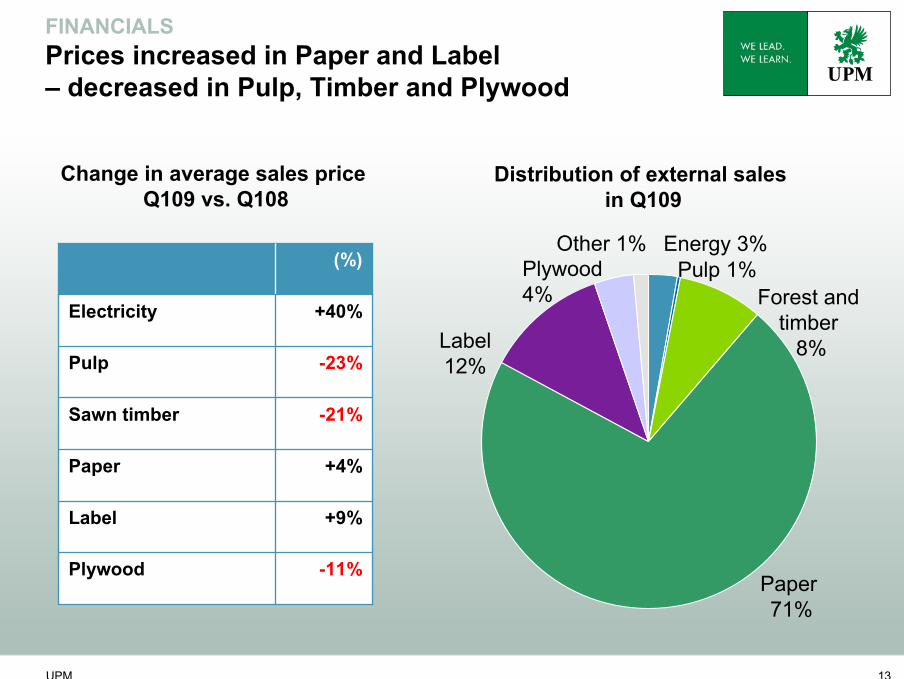
FINANCIALSPrices increased in Paper and Label – decreased in Pulp, Timber and Plywood
-11%Plywood
+9%Label
+4%Paper
-21%Sawn timber
-23%Pulp
+40%Electricity
(%)
Change in average sales price Q109 vs. Q108
Distribution of external sales in Q109
Paper 71%
Forest and timber
8%
Pulp 1%Energy 3%
Label12%
Plywood4%
Other 1%
UPM 14
10
11
12
13
14
15
16
17
18
19
20
2004 2005 2006 2007 2008 2009
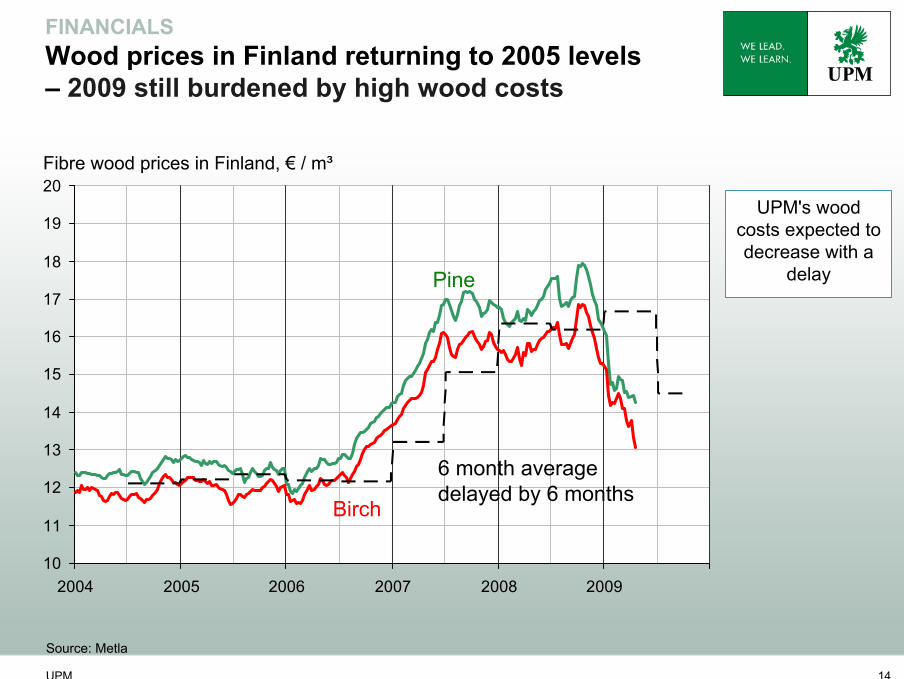
FINANCIALSWood prices in Finland returning to 2005 levels – 2009 still burdened by high wood costs
Fibre wood prices in Finland, € / m³
Source: Metla
UPM's wood costs expected to decrease with a
delay
Birch
Pine
6 month averagedelayed by 6 months
UPM 15
80
90
100
110
120
130
140
150
160
170
2005 2006 2007 2008 200980
90
100
110
120
130
140
150
160
170
2005 2006 2007 2008 2009
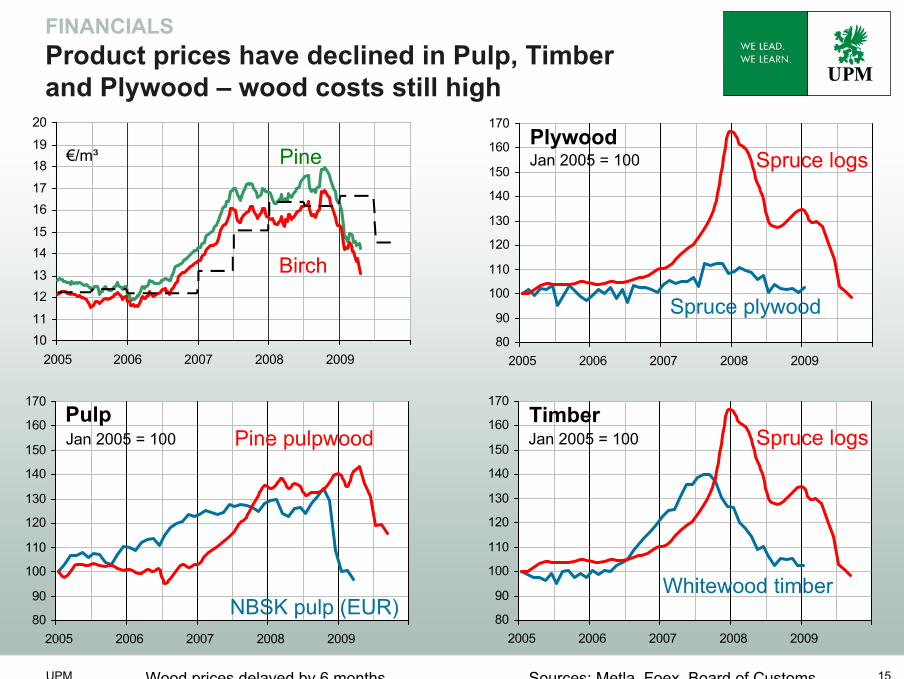
FINANCIALSProduct prices have declined in Pulp, Timber and Plywood – wood costs still high
80
90
100
110
120
130
140
150
160
170
2005 2006 2007 2008 2009
Pine pulpwood
NBSK pulp (EUR)
Spruce logs
Spruce plywood
Spruce logs
Whitewood timber
Wood prices delayed by 6 months Sources: Metla, Foex, Board of Customs
Pulp
Plywood
Timber
1011
1213
1415
1617
1819
20
2005 2006 2007 2008 2009
Birch
Pine Jan 2005 = 100
Jan 2005 = 100Jan 2005 = 100
€/m³
UPM 16
0
10
20
30
40
50
60
70
80
90
100
2004 2005 2006 2007 2008 20090
15
30
45
60
75
90
105
120
135
150
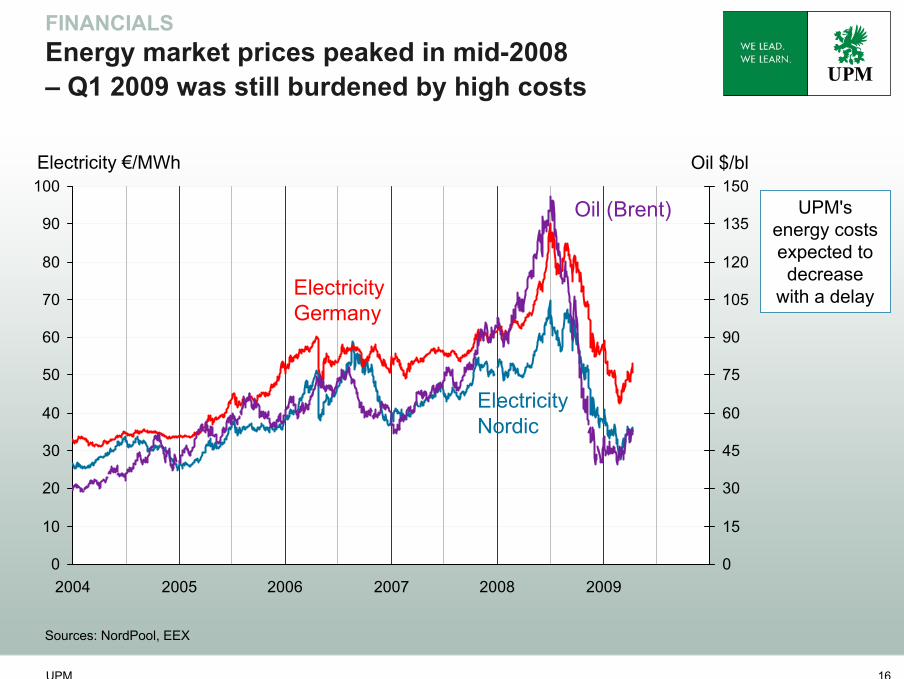
FINANCIALSEnergy market prices peaked in mid-2008 – Q1 2009 was still burdened by high costs
Electricity €/MWh
Sources: NordPool, EEX
Oil $/bl
ElectricityNordic
ElectricityGermany
Oil (Brent) UPM's energy costs expected to decrease
with a delay
FINANCIALS

UPM 18
210
14
196
-78
274
-73
216
131
128
Q1 2009
-121
4
-125
-175
50
-99
-106
255
337
Q1 2008
70Cash flow after capex
-292Finance costs and income taxes
-558Capital expenditure
26Asset sales and acquisitions
96Cash flow after investing activities
-132Change in working capital
628Net cash from operating activities
1,052Cash flow before change in working capital
1,206EBITDA
2008€, million
FINANCIALSCash flow

UPM 19
0
200
400
600
800
1000
04 05 06 07 08 09e
FINANCIALS Capital expenditure2009 estimate lowered to € 300 million
€ million
Depreciation excl. amortization of goodwill
Strategic investments
Operational investments
551
300
Estimate
Q1 2009 capital expenditure was € 67 million
UPM 20
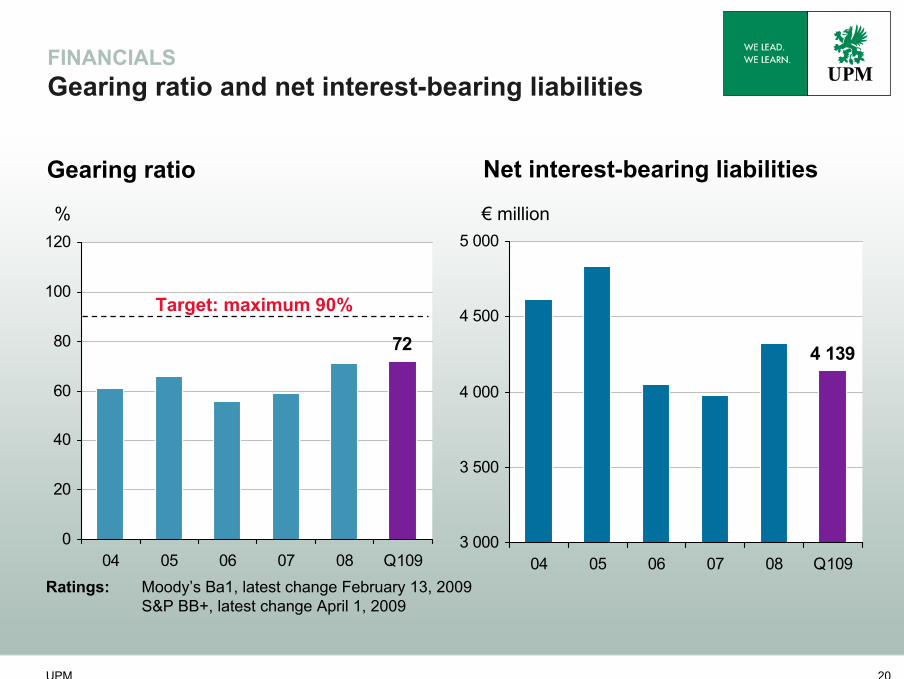
4 139
3 000
3 500
4 000
4 500
5 000
04 05 06 07 08 Q109
72
0
20
40
60
80
100
120
04 05 06 07 08 Q109
Gearing ratio Net interest-bearing liabilities
% € million
Target: maximum 90%
FINANCIALS Gearing ratio and net interest-bearing liabilities
Ratings: Moody’s Ba1, latest change February 13, 2009S&P BB+, latest change April 1, 2009
UPM 21
0200400600800
1 0001 2001 4001 6001 8002 000
Res
t of
2009
2010
2011
2012
2013
2014
2015
2016
2017
2018
2019
-202
6
2027
2028
2029
2030
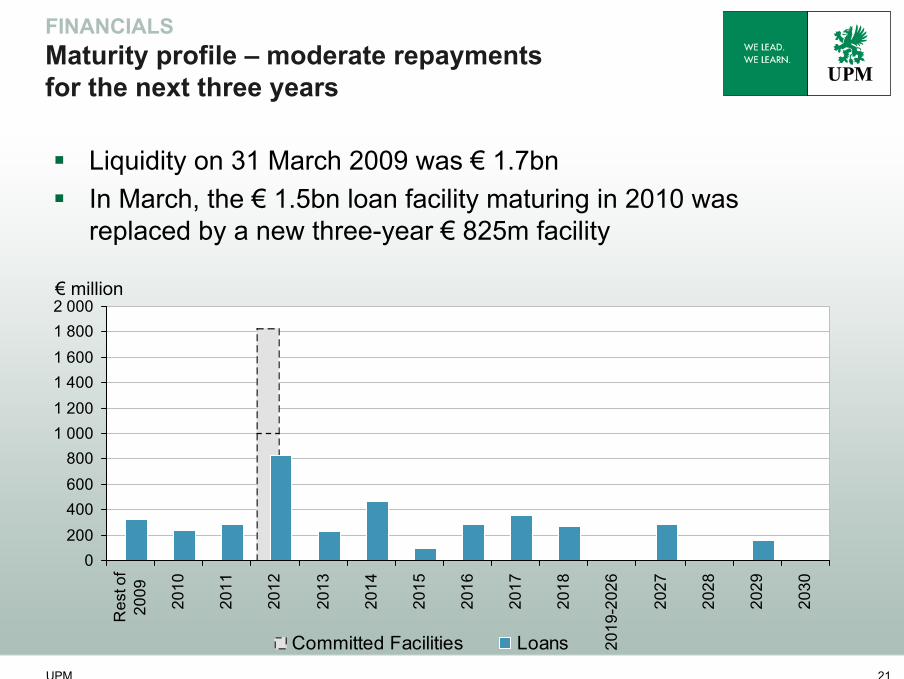
Committed Facilities Loans
Liquidity on 31 March 2009 was € 1.7bnIn March, the € 1.5bn loan facility maturing in 2010 was replaced by a new three-year € 825m facility
FINANCIALSMaturity profile – moderate repayments for the next three years
€ million

UPM 22
Outlook for 2009 (*
Economic activity in main markets contracts during 2009
For UPM this is expected to mean:- weak demand in most of products continues- markedly lower deliveries than in 2008 and long production downtime- increased competition and potential loss of sales due tocompeting devaluations (e.g. SEK, GBP and Rouble)
- lower wood costs for the group will materialize with a delay
UPM's own actions continue:- Focus on cost saving and cash preservation- Lower capital expenditure – new estimate €300 million
(* See complete wording of the "Outlook" in the Interim Report Q1 2009
UPM 23
It should be noted that certain statements herein which are not historical facts, including, without limitation, those regarding expectations for market growth and developments; expectations for growth and profitability; and statements preceded by "believes", "expects", "anticipates", "foresees", or similar expressions, are forward-looking statements. Since these statements are based on current plans, estimates and projections, they involve risks and uncertainties which may cause actual results to materially differ from those expressed in such forward-looking statements. Such factors include, but are not limited to: (1) operating factors such as continued success of manufacturing activities and the achievement of efficiencies therein including the availability and cost of production inputs, continued success of product development, acceptance of new products or services by the Group's targeted customers, success of the existing and future collaboration arrangements, changes in business strategy or development plans or targets, changes in the degree of protection created by the Group's patents and other intellectual property rights, the availability of capital on acceptable terms; (2) industry conditions, such as strength of product demand, intensity of competition, prevailing and future global market prices for the Group's products and the pricing pressures thereto, financial condition of the customers and the competitors of the Group, the potential introduction of competing products and technologies by competitors; and (3) general economic conditions, such as rates of economic growth in the Group's principal geographic markets or fluctuations in exchange and interest rates.
Forward-looking statement

UPM 24

UPM 25
FINANCIALSEnergy
Operating profit improvedSales increased by 30%Average sales price for electricity increased by 40%
0
20
40
60
80
Q1 07 Q2 07 Q3 07 Q4 07 Q1 08 Q2 08 Q3 08 Q4 08 Q1 09
€, million
33
5131.4%
37.5%
n.a.40%Average price, change %
2.5
51
136
Q1 2009
2.4Electricity sales, TWh
33Operating profit M€excl. special items
105Sales, M€
Q1 2008
Operating profit excluding special items
UPM 26
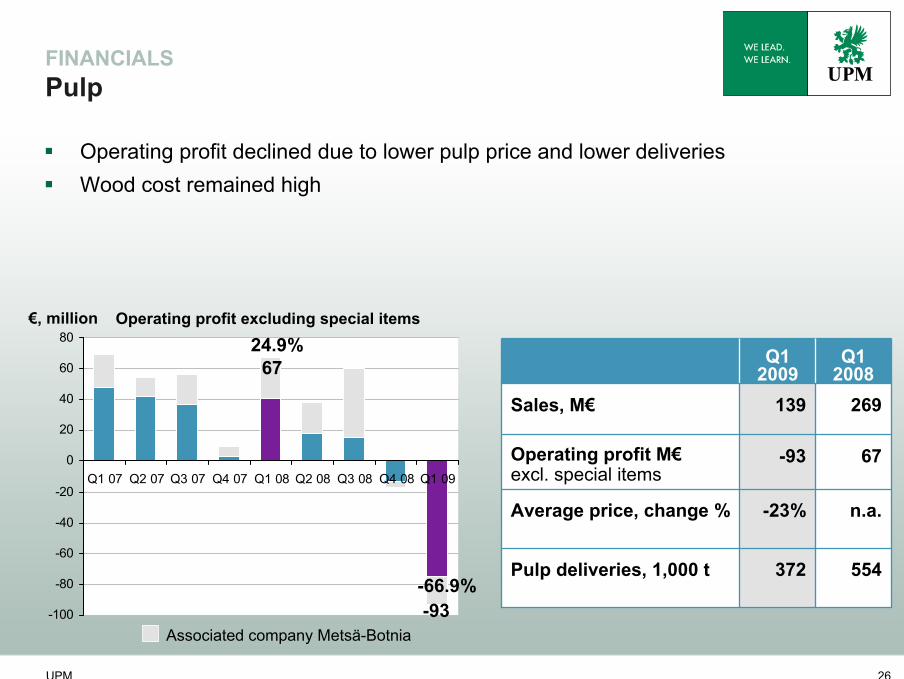
FINANCIALSPulp
Operating profit declined due to lower pulp price and lower deliveriesWood cost remained high
-100
-80
-60
-40
-20
0
20
40
60
80
Q1 07 Q2 07 Q3 07 Q4 07 Q1 08 Q2 08 Q3 08 Q4 08 Q1 09
67
-93
24.9%
-66.9%
n.a.-23%Average price, change %
372
-93
139
Q1 2009
554Pulp deliveries, 1,000 t
67Operating profit M€excl. special items
269Sales, M€
Q1 2008
Associated company Metsä-Botnia
€, million Operating profit excluding special items

UPM 27
FINANCIALSForest and timber
-60
-40
-20
0
20
40
60
80
Q1 07 Q2 07 Q3 07 Q4 07 Q1 08 Q2 08 Q3 08 Q4 08 Q1 09
26
-8
5.1%
-2.1%2811Fair value change of
biological assets
363
-21%
-8
385
Q12009
573Sawn timber deliveries, 1,000 m3
n.a.Average price of sawn timber, change %
26Operating profit M€excl. special items
508Sales, M€
Q1 2008
Operating profit declined due 21% to lower average price and lower deliveries of sawn timberWood cost remained at a high level
Fair value change of biological assets
€, million Operating profit excluding special items
UPM 28
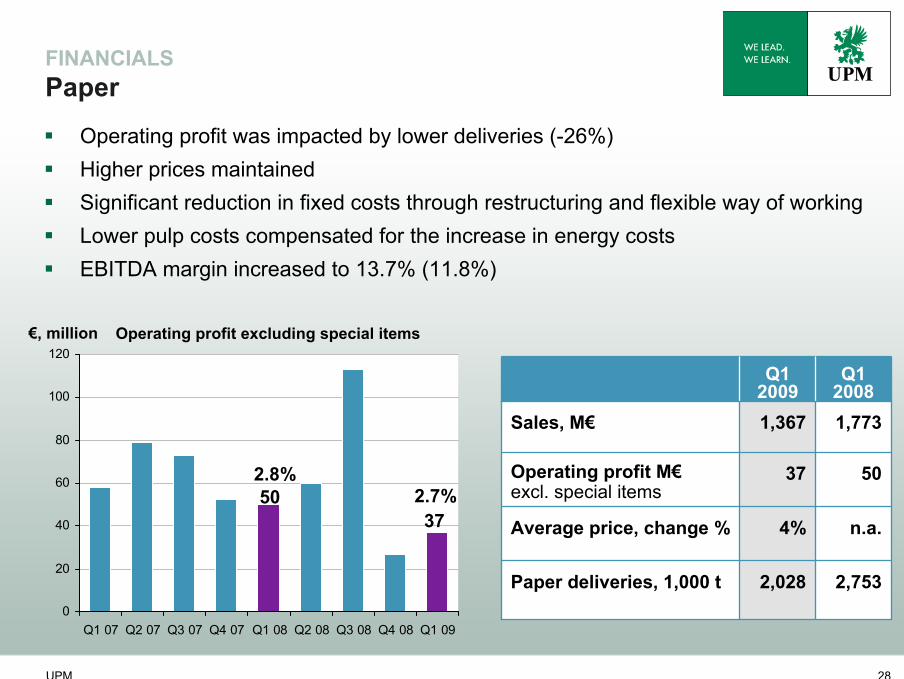
FINANCIALSPaper
0
20
40
60
80
100
120
Q1 07 Q2 07 Q3 07 Q4 07 Q1 08 Q2 08 Q3 08 Q4 08 Q1 09
5037
2.8%2.7%
Operating profit was impacted by lower deliveries (-26%)Higher prices maintainedSignificant reduction in fixed costs through restructuring and flexible way of workingLower pulp costs compensated for the increase in energy costsEBITDA margin increased to 13.7% (11.8%)
2,028
4%
37
1,367
Q1 2009
2,753Paper deliveries, 1,000 t
n.a.Average price, change %
50Operating profit M€excl. special items
1,773Sales, M€
Q1 2008
€, million Operating profit excluding special items
UPM 29
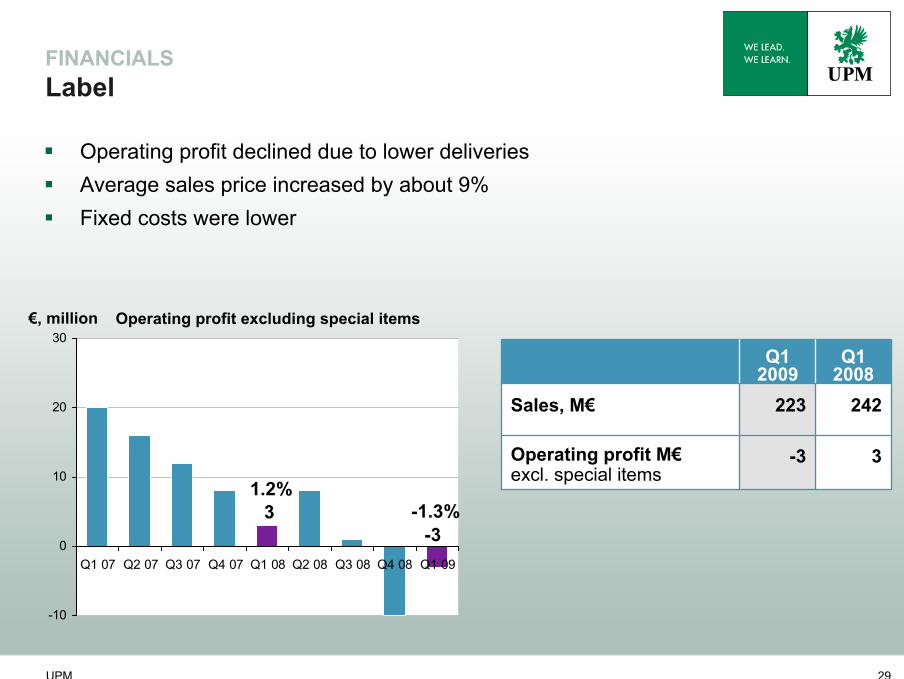
FINANCIALSLabel
-10
0
10
20
30
Q1 07 Q2 07 Q3 07 Q4 07 Q1 08 Q2 08 Q3 08 Q4 08 Q1 09
3-3
1.2%-1.3%
-3
223
Q1 2009
3Operating profit M€excl. special items
242Sales, M€
Q1 2008
Operating profit declined due to lower deliveriesAverage sales price increased by about 9%Fixed costs were lower
€, million Operating profit excluding special items
UPM 30
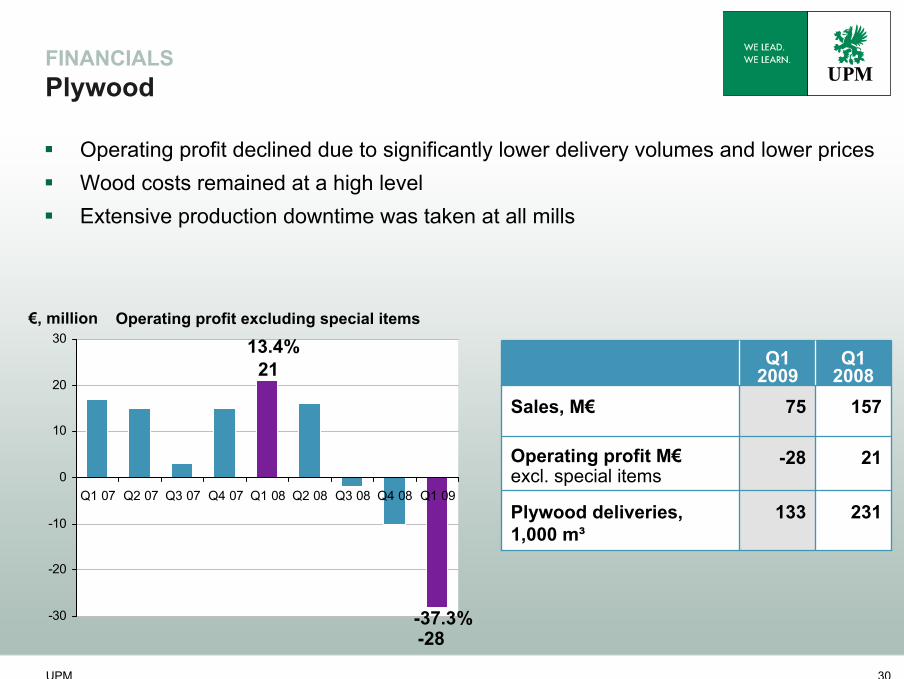
FINANCIALSPlywood
Operating profit declined due to significantly lower delivery volumes and lower pricesWood costs remained at a high levelExtensive production downtime was taken at all mills
-30
-20
-10
0
10
20
30
Q1 07 Q2 07 Q3 07 Q4 07 Q1 08 Q2 08 Q3 08 Q4 08 Q1 09
21
-28
13.4%
-37.3%
133
-28
75
Q1 2009
231Plywood deliveries, 1,000 m³
21Operating profit M€excl. special items
157Sales, M€
Q1 2008
€, million Operating profit excluding special items