Juniper High Density WLAN Testing final · WLAN Infrastructure Configuration 8 ... While the...
32
High Density WLAN Testing June 2013 Copyright 2013 Novarum Inc.
Transcript of Juniper High Density WLAN Testing final · WLAN Infrastructure Configuration 8 ... While the...

High Density WLAN Testing
June 2013
Copyright 2013 Novarum Inc.
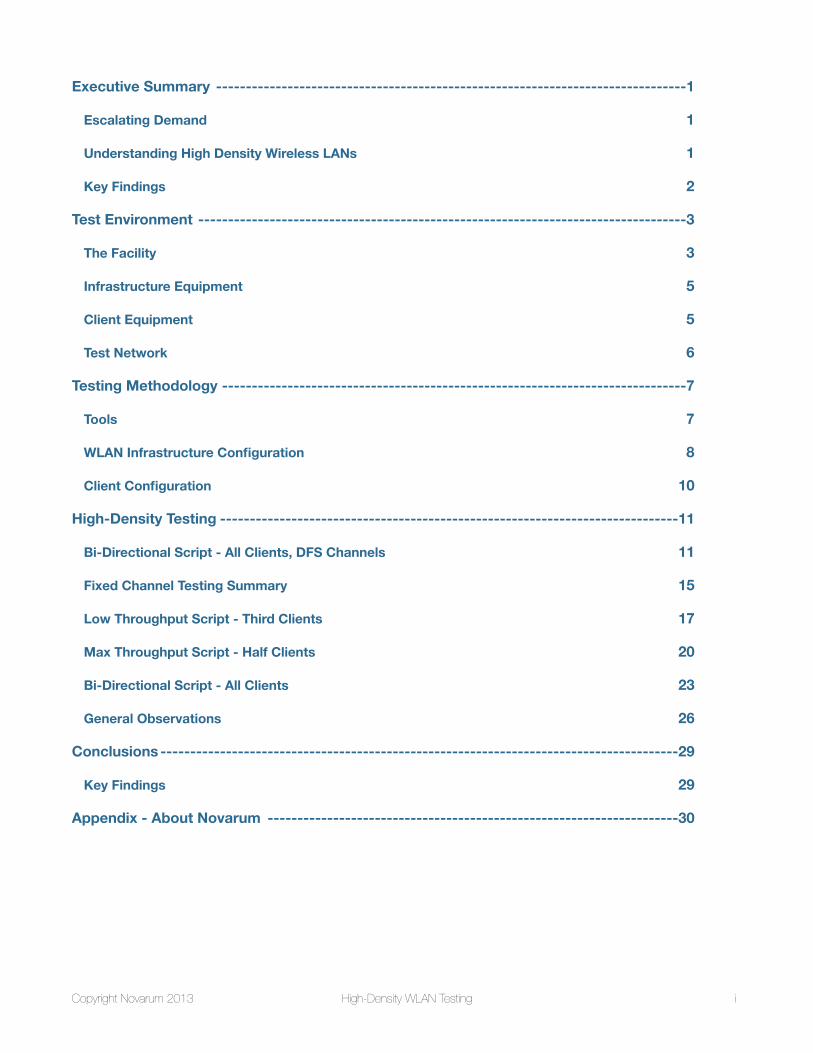
-------------------------------------------------------------------------------Executive Summary 1
Escalating Demand 1
Understanding High Density Wireless LANs 1
Key Findings 2
----------------------------------------------------------------------------------Test Environment 3
The Facility 3
Infrastructure Equipment 5
Client Equipment 5
Test Network 6
------------------------------------------------------------------------------Testing Methodology 7
Tools 7
WLAN Infrastructure Configuration 8
Client Configuration 10
-----------------------------------------------------------------------------High-Density Testing 11
Bi-Directional Script - All Clients, DFS Channels 11
Fixed Channel Testing Summary 15
Low Throughput Script - Third Clients 17
Max Throughput Script - Half Clients 20
Bi-Directional Script - All Clients 23
General Observations 26
---------------------------------------------------------------------------------------Conclusions 29
Key Findings 29
---------------------------------------------------------------------Appendix - About Novarum 30
Copyright Novarum 2013 High-Density WLAN Testing i
Executive SummaryThis is the first in a series of high density test reports conducted by Novarum. This report documents the performance of Juniper's enterprise wireless LAN system in a high density setting. Please download the second report that includes testing of competitive products in the same environment: Novarum High Density WLAN Comparison Testing: Aruba, Cisco and Juniper.
Escalating DemandThe scale and density of Wi-Fi networks has dramatically changed over the last decade. Wi-Fi in the enterprise was once a convenience for laptop toting executives. Now Wi-Fi access is a required utility. Wi-Fi networks are pervasive in modern enterprises, and for many enterprises, the edge network has transitioned from wired Ethernet to entirely wireless Wi-Fi.
There has been an explosion of new mobile devices — smartphones and tablets — in the last few years. They all include Wi-Fi and their users run applications that expect continuous internet connectivity.
Enterprises are having to deal with guest access and their authorized users bringing in their personal devices to the network. Regardless of how enterprises address this BYOD trend, it will put more load on their Wi-Fi systems.
At large public venues, Wi-Fi access has become a required amenity. The cellular carriers are offloading mobile data traffic onto Wi-Fi networks whenever possible, and standards work is underway that will automate this process in the future.
In all levels of education — from primary school through universities — demand for Wi-Fi access is increasing. Most students have a Wi-Fi smartphone in addition to whatever wireless devices are required for their schoolwork. Universities now must plan for their networks to support three wireless devices per student. Many teachers are increasingly turning to using streaming video — both downstream and upstream — as an essential element of their pedagogical style.
All of these trends combine to create the perfect storm of more devices running more demanding applications that expect wireless access anywhere. Wireless systems are being pushed to their limits and high-density Wi-Fi deployments are becoming the norm.
Understanding High Density Wireless LANsIt is important to understand how to configure and deploy wireless LANs to deal with these increasing demands. While the demand for wireless access continues to escalate, unlicensed wireless spectrum is limited. Enterprise Wi-Fi networks must be tuned to operate as efficiently as possible in high-density environments.
Juniper Networks has built a testing capability that allows them to run their wireless LAN system in a realistic high-density environment with a variety of Wi-Fi clients. This allows Juniper to optimize their system design for high-density deployments and validate new versions of their system in this harsh environment. Novarum was delighted to be able to work with Juniper to use this high-density testing facility to examine enterprise wireless LANs. We wanted to gain a better understanding of how these systems work under heavy load.
What are the important factors that lead to good system performance in high-density networks? Do the systems utilize the available spectrum efficiently? How do the systems deal with the mixture of modern clients? Does one type of client device get better service than another? Is the system fair in its allocation of the limited resources? Does the
High-Density WLAN Testing www.novarum.com 1

system steer client devices to the frequency bands and access points with the most capacity? Does the system create the right low level Wi-Fi parameters to minimize transmission errors and packet retries — the early warnings of a network on the edge of collapse?
Novarum has discovered that seemingly small changes in how vendors choose to implement Wi-Fi — and how wireless deployments are configured — can have dramatic effects on network performance in the new high-density Wi-Fi world. These effects can be the difference between a mission critical network that is stable under extremely demanding load, or a network that catastrophically collapses under stress.
Detailed system level features such as air time fairness, load balancing, rate adaptation, and band steering are what differentiates one enterprise Wireless LAN vendor from another. We wanted to construct test scenarios that allowed us to observe these features and their effect on system performance. For a variety of client loads and traffic patterns we measured system throughput and individual client throughput. We used packet capture and spectrum analysis tools during the tests to help document the behavior of the systems in this harsh test environment.
This paper describes high-density testing of Juniper’s Wireless LAN system in their facility. It describes the test environment, our testing approach, and detailed results for several test runs.
Key Findings• We were able to construct a repeatable test scenario with up to 302 typical Wi-Fi clients accessing an enterprise
wireless LAN consisting of six dual-band 802.11n enterprise access points.• Most of the tests we constructed overload the network with more traffic than is possible to deliver during the test
period. This allowed us to observe the systems under high stress. The Juniper WLAN system operated in a stable fashion under very high offered load.
• The Juniper system delivered consistent throughput. Even under the highest load, with hundreds of clients accessing the network simultaneously, almost all of the individual clients were able to deliver modest data throughput during the tests, and no client was able to grab an unfair share of the available capacity.
• Juniper’s Band Steering worked well. The 5 GHz capable clients consistently moved to the 5 GHz channels where there is more bandwidth available.
• Load Balancing worked well. On a variety of tests with different client populations, the client devices were spread evenly across the available APs.
• The 802.11 retry rates were moderate and stayed relatively flat as we increased the number of clients participating in the tests. At maximum client load with the high throughput tests, aggregate system throughput declined compared to the peak throughput we measured. However, the retry rates were lower than we expected, and it appeared that the system would remain stable with even higher loads.
• When compared to competitive systems, the Juniper system delivered more aggregate throughput under heavy load. The primary factors are: better spreading of clients to match the available resources, lower error rate and lower retry rates throughout. Comparing performance of competitive systems is covered in a separate paper.
High-Density WLAN Testing www.novarum.com 2

Test Environment
The FacilityWe conducted the testing in the Juniper Aspiration Dome, a conference facility in Sunnyvale, California, on the Juniper Networks campus adjacent to Moffett Federal Airfield.
Figures 1 and 2 - The Aspiration Dome.
The seating in the dome can be reconfigured to match the needs of specific events. For our testing the dome was configured as a large auditorium. There was a grid of seats, 20 per row, in the center of the facility. We placed a single client device on each seat. The seats were numbered 1 through 20, and we used rows a through q. The client name was set to match its seat number: “a1”, “a2”, “a3”, etc. Every time we set up the tests, the clients were placed in the same location.
Stage
AP1
AP2
AP3
AP4
AP5
AP6
Clients Clients
Chariot and Monitor Machines
High-Density WLAN Testing www.novarum.com 3

During our testing, the permanent Juniper access points in and around the facility were disabled and we verified with our tools that there were no other Wi-Fi networks that would interfere with our testing.
Figure 3 - Access Point Mounting
The access points under test were mounted on temporary stands about 10 feet above floor level as shown in Figure 3. At the base of each stand we had a MacBook Pro laptop running a packet capture program that was monitoring the 5 GHz channel being used by that AP.
High-Density WLAN Testing www.novarum.com 4

Infrastructure EquipmentThe Wi-Fi infrastructure for this testing is current three stream 802.11n enterprise Wi-Fi systems.
Juniper• WLC880 Wireless LAN Controller• WLA532 Access Point
Cisco• WLAN Controller 5508 • AP 3602
Aruba• WLAN Controller 3600• AP 135
Client EquipmentOne of the significant factors in this high-density testing is our use of real world client machines rather than traffic simulators. We used over three hundred Wi-Fi clients. There are three categories of clients - laptops, smartphones and tablets. We had a variety of clients running different operating systems: Windows 7 Laptops from Dell and HP; MacBook Pros and MacBook Airs; iOS, Windows 8 and Android tablets such as the iPad, iPad Mini, Kindle Fire, Galaxy Tab 10.1, Microsoft Surface and Surface Pro; and iOS and Android smartphones including iPhone 3, 4, and 5, Samsung Galaxy 3s, Nexus and more. These clients included all varieties of Wi-Fi devices that will typically be found in a modern BYOD environment:
• 2.4 GHz 802.11n 1x1 MIMO smartphone clients• Dual band 2.4 and 5 GHz 1x1 MIMO 20 MHz tablets • Dual band 2.4 GHz and 5 GHz 1x1 MIMO 40 MHz tablets• Dual band 2.4 GHz and 5 GHz 2x2 MIMO laptops• Dual band 2.4 GHz and 5 GHz 3x3 MIMO laptops
High-Density WLAN Testing www.novarum.com 5
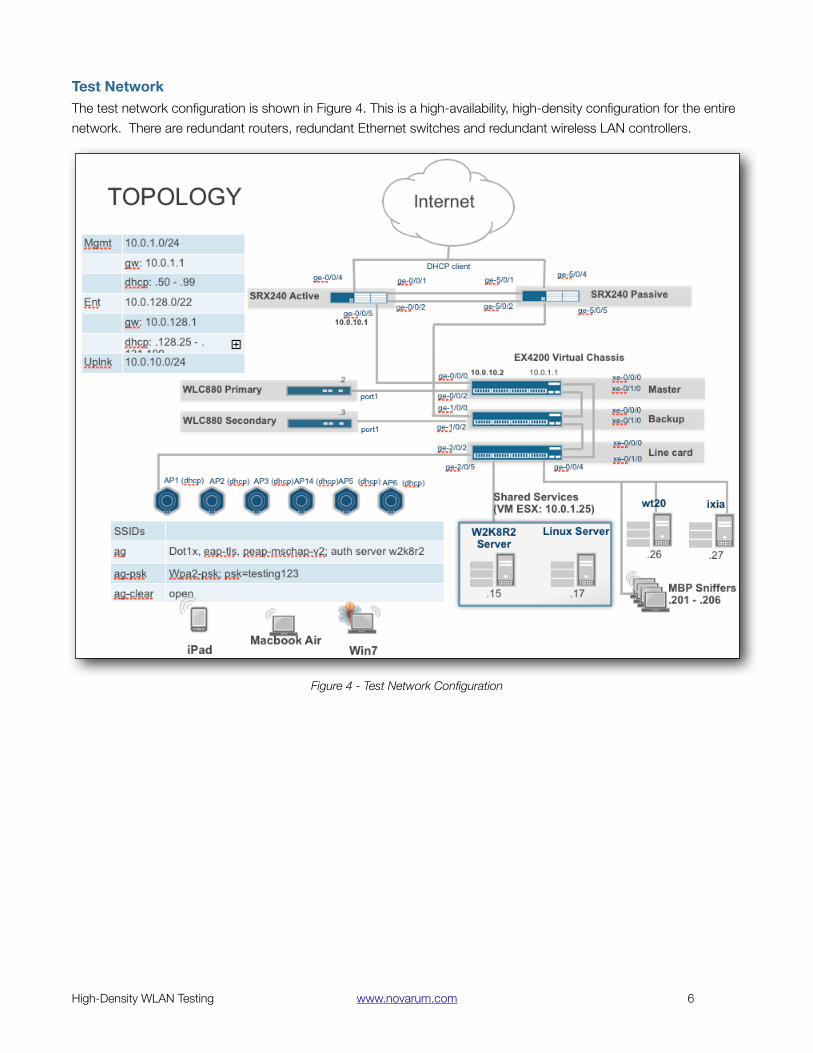
Test NetworkThe test network configuration is shown in Figure 4. This is a high-availability, high-density configuration for the entire network. There are redundant routers, redundant Ethernet switches and redundant wireless LAN controllers.
Figure 4 - Test Network Configuration
High-Density WLAN Testing www.novarum.com 6

Testing Methodology
Tools We used Ixia Chariot to generate traffic and record throughput. Chariot generates different network traffic flows between pairs of endpoints. Every client machine had the Ixia Endpoint software installed. We had a dedicated hardware Ixia Chariot server with licenses for up to 500 endpoints.
We collected packet captures in the 5 GHz band from each AP on each 5 GHz channel. During each test run, we captured packets for 30 seconds in the middle of the data transfer. We extracted data and analyzed the packet captures using EyePA and Cascade Pilot.
We used Channelyzer Pro and AirMagnet from Fluke to do spectrum analysis. The spectrum screen shots in this paper are from Channelyzer Pro. We drove the network with traffic generated from three different Chariot scripts:
Max Throughput ScriptThe "Max Throughput Script" creates a single TCP stream for smartphones and tablets. Each laptop client was configured to support two TCP streams. All TCP streams are running the High Throughput TCP script from the Chariot server to the client. The high throughput script attempts to send as much data as possible.
Bi-Directional ScriptThe "Bi-Directional Script" is a single TCP stream per client for smartphone and tablets, with each one running High Throughput TCP script from the Chariot server down to the client. For laptops there are two TCP streams per client, one running the High Throughput TCP script down from server to client and one running the script up from the client to server. The laptops are the only clients with bidirectional traffic in this test.
Low Throughput ScriptThe "Low Throughput Script" is a single TCP stream per client for all clients. All TCP streams are running the High Throughput TCP script from the Chariot server to the client, however, the throughput per client is constrained. For laptops, the throughput is constrained to 5 Mbps per stream, tablets are limited to 2 Mbps and smartphones are limited to 1 Mbps.
The scripts are configured to run for two minutes with each client generating continuous streams of traffic. This is one area where this high-density testing goes beyond the typical enterprise usage scenarios. Most wireless LANs experience bursty traffic - some very high throughput peaks, followed by longer periods of low activity. Constant load from all clients for a two minute period is very unusual, and difficult for 802.11 networks to handle. Even streaming video traffic consists of bursts of data with gaps. With bursty traffic, the pressure on the network is relieved during the gaps in offered load. With continuous offered load, retransmissions compete with new transmissions, congestion builds and there is no opportunity to relieve this pressure. This extreme traffic pattern generated by our test scripts is useful for high-density testing because it allows us to simulate what would happen to these networks with many more clients running more typical network traffic patterns.
Each time we conducted a test, we would run the test at least three times to ensure that we were getting consistent results. With over three hundred clients of different types with different operating systems, perfection was not possible. We spent a great deal of time configuring the clients to ensure that they were active on the network and running the proper software. Before running each series of tests we ran a script that would contact each client to make sure that it was active, on the network and running the Chariot endpoint software. However, there were always
High-Density WLAN Testing www.novarum.com 7

a few clients that would not initialize properly and did not complete the tests. The clients could be unavailable for a variety of reasons: their battery died, they were off-line downloading new firmware, their Wi-Fi turned off, or their network protocol stack was not running correctly. We decided that this was a realistic part of the test and since the number of such off line clients was always small, it did not materially affect the results of the test.
WLAN Infrastructure ConfigurationOverall, we followed the manufacturer recommendations and guidelines for high-density deployments. We configured the APs manually, with static channel assignment and power levels even though the vendors usually recommend automatic channel tuning. We wanted to maintain a consistency of configuration that would be repeatable throughout the testing, and we did not want any channel changes to occur during the testing.
Our testing area inside the Dome was a large open space. Every client device was close enough to “hear” every AP, and the APs were all within range of each other. In order to provide maximum capacity, we wanted to avoid sharing the same channels between APs. This is not possible in the 2.4 GHz band. With only three independent Wi-Fi channels available, we had to use each 2.4 GHz channel twice. We separated the APs operating on the same channel as far as possible, but they were clearly overlapping and any associated clients will also share the same channel. This 2.4 GHz configuration is not ideal, but it exemplifies a real world constraint that most enterprise networks have to address.
High-Density Channel ConfigurationAt 5 GHz, there is more unlicensed spectrum and more independent channels are available. For high-density environments we wanted as many independent channels as possible. Since our client devices included many modern 802.11n clients, we also wanted to use 40 MHz wide channels in the 5 GHz band for the highest data rates possible. We initially configured six independent 40 MHz channels in the 5 GHz band, one for each AP. The high-density channel layout for the APs is shown in the table at right.
This channel configuration at 5 GHz uses two Dynamic Frequency Selection (DFS) channels: 52+ and 116+. In order to use these DFS channels, the system must detect radar operating in those frequencies. If radar is detected, the wireless LAN must abandon that channel and move to an alternate channel. During the network configuration and test, we experienced at least two radar events a day. (The Dome is located very close to an active airport, Moffett Federal Airfield.) These DFS events modified the test results and made the testing less repeatable. Overall, using the DFS channels proved to be too disruptive and time consuming during our testing. Therefore we changed the 5 GHz channel plan to avoid the DFS channels and moved to a fixed configuration that was of lower capacity for most of the testing.
High-Density WLAN Testing www.novarum.com 8

Fixed 5 GHz Channel ConfigurationThe original high-density channel configuration with six independent 5 GHz channels used 300 MHz of spectrum - six 40 MHz channels in the 5 GHz band, one for each AP; and three 20 MHz channels in the 2 GHz band shared by the six APs. For the bulk of the testing we adopted a fixed 5 GHz channel configuration that avoids the DFS channels. This fixed configuration is 240 MHz total. The 2.4 GHz is the same - three 20 MHz channels shared by six APs. The 5 GHz band is four independent 40 MHz channels and one 20 MHz channel. Channel 165, the 20 MHz channel, is shared by two APs.
Overall, the potential capacity for the system under test was reduced by 20% to 25% compared to the highest capacity configuration, which is acceptable for this high-density WLAN testing. This fixed configuration is more complicated, since there is a 20 MHz channel at 5 GHz shared by two APs. The testing scenarios that we constructed will push the systems to their limits and we should be able to observe how different systems allocate the limited resources to best serve the wireless LAN clients.
High-Density WLAN Testing www.novarum.com 9
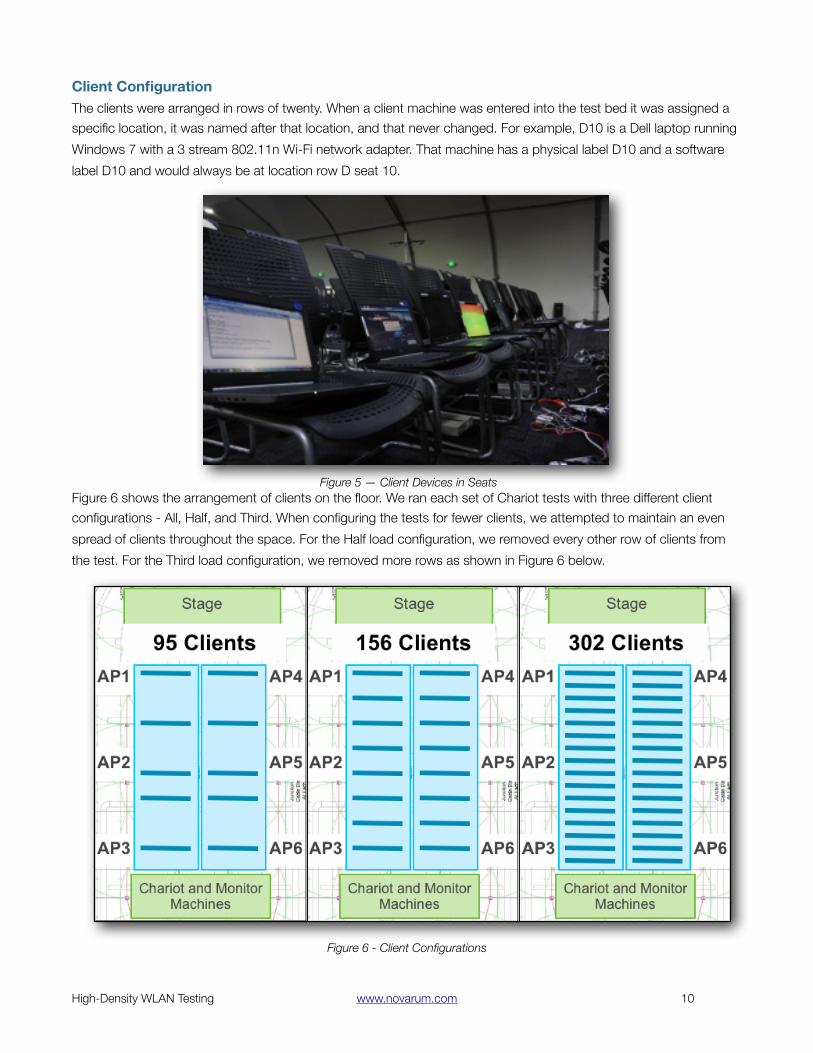
Client ConfigurationThe clients were arranged in rows of twenty. When a client machine was entered into the test bed it was assigned a specific location, it was named after that location, and that never changed. For example, D10 is a Dell laptop running Windows 7 with a 3 stream 802.11n Wi-Fi network adapter. That machine has a physical label D10 and a software label D10 and would always be at location row D seat 10.
Figure 5 — Client Devices in SeatsFigure 6 shows the arrangement of clients on the floor. We ran each set of Chariot tests with three different client configurations - All, Half, and Third. When configuring the tests for fewer clients, we attempted to maintain an even spread of clients throughout the space. For the Half load configuration, we removed every other row of clients from the test. For the Third load configuration, we removed more rows as shown in Figure 6 below.
Figure 6 - Client Configurations
High-Density WLAN Testing www.novarum.com 10

High-Density Testing While we were configuring the clients and experimenting with the wireless LAN system to get a repeatable test configuration, we were consistently getting test runs where the aggregate throughput was 625 Mbps for the Juniper infrastructure. This throughput was reported by Chariot at the TCP file transfer level. Here is one example of testing in the higher capacity configuration that used six independent 5 GHz channels.
Bi-Directional Script - All Clients, DFS ChannelsThis is the Bi-Directional throughput script with 295 clients: 118 laptops, 54 smartphones and 123 tablets. This particular test run produced 520 Mbps aggregate throughput across all the clients.
The Throughput graph above is generated by Chariot. There is a line for each TCP stream in the test. Periodically during the test, the Chariot endpoint sends a timing record that indicates its current throughput. These are plotted on the graph for each stream. Some of the instantaneous throughput is quite high, but when averaged over the entire two minute duration, the average throughput achieved by a given stream is much lower.
The histogram at right shows the percentage of the streams that delivered a given average throughput for the entire test. In this test, 6% of the streams had no throughput — these were usually Chariot initialization errors. 27% of the streams delivered less than .5 Mbps, 26% of the streams had throughput between .5 Mbps and 1 Mbps, etc. Almost 100% of the streams had throughput less than 4 Mbps, and there were a few outliers that achieved up to 20 Mbps averaged over the entire test.
This pattern is repeated in most of the very high load tests. These tests generate very high offered load for 120 seconds. Almost all of the clients get modest
0.0%$
5.0%$
10.0%$
15.0%$
20.0%$
25.0%$
30.0%$
35.0%$
40.0%$
0$ 1$ 2$ 3$ 4$ 5$ 6$ 7$ 8$ 9$ 11$ 13$ 15$ 17$ 19$Mbps%
Juniper%BiDir%All%%
High-Density WLAN Testing www.novarum.com 11

throughput - 1 or 2 Mbps - when averaged over the two minute duration of the tests. However, the available throughput is evenly distributed across the clients. Juniper’s airtime fairness was consistent. Almost all clients were able to get some data through. Most of the clients were able to get a few megabits of throughput, and no client was allowed to monopolize the airwaves at the expense of the others. This makes sense. In the highest throughput tests, the six APs in the infrastructure each delivered over 100 Mbps for two minutes. This 600+ Mbps aggregate system throughput is shared across 410 different streams of traffic. The average per stream throughput of 1.5 Mbps is exactly as expected.
The screen capture above is part of the spectrum display from Channelyzer. The top half of the display is the instantaneous RF energy in the channel and the bottom half is a “waterfall” display showing the recent past. Most of the Channelyzer displays in this paper show about 60 seconds of past history that occurred in the middle of the 120 second test runs.
The 40 MHz channels in the 5 GHz band are simply adjacent 20 MHz channels. The 40 MHz channel 36+ is actually channels 36 and 40 combined. Most modern 802.11n Wi-Fi clients support the 5 GHz band; however, some of those clients are only able to utilize 20 MHz wide channels even when the Wi-Fi infrastructure supports the wider 40 MHz channels now standard in 802.11n. For example all generations of iPads are 5 GHz capable, but did not support 40 MHz channels until the most recent versions were released. We can see in Figure 6 channel 149 has higher instantaneous RF energy and higher channel occupancy than channel 153 (the upper half of 149+ 40 MHz channel). There are likely several clients that support 20 MHz only using channel 149 in this test.
The 2.4 GHz Channelyzer view is shown below. It appears that all three channels are completely utilized, with channel 11 being slightly more loaded than the other two. It is important to note that this figure shows three, 20 MHz
High-Density WLAN Testing www.novarum.com 12

channels only. The 2 GHz channel chart is shown on a different scale than the 5 GHz channel chart. Each tick on the horizontal axis of the 5 GHz chart represents 20 MHz, each tick on the 2.4 GHz chart represents 5 MHz.
We saved the Juniper controller logs for each run and were able to examine the association table of each AP during the tests. Load balancing worked well, even during this heavily loaded test. Each of the APs supports between 40 and 50 clients, with the exception of AP2 which has 58 clients associated. That matches the Client Distribution by channel which shows the most 2.4 GHz clients on channel 6 and a fairly high number of clients on channel 44+.
0"
5"
10"
15"
20"
25"
30"
35"
40"
45"
1" 6" 11" 36" 44" 52" 116" 149" 157"
Client'Distribu-on'by'Channel'
0"
10"
20"
30"
40"
50"
60"
70"
1" 2" 3" 4" 5" 6"
Client'Distribu-on'by'AP'
This test generated the highest load of our testing and clearly saturated the network. However, the retry rate is relatively low, averaging 27%. The retry rate is also fairly flat across the different APs. When measured by channel, channel 44+ is higher than the rest, but overall retries are similar for all channels.
0%#10%#20%#30%#40%#50%#60%#70%#80%#90%#100%#
1# 6# 11# 36# 44# 52# 116# 149# 157#
Retries'by'Channel'
0%#
10%#20%#30%#40%#50%#60%#70%#80%#90%#100%#
1# 2# 3# 4# 5# 6#
Retries'by'AP'
High-Density WLAN Testing www.novarum.com 13

The 802.11 retry rate is a good indicator of system performance for high-density networks. The 802.11 Media Access Control protocol has a positive acknowledgement and retry protocol built in. (This is at the Data Link level below the network and transport layers of the IP and TCP protocols.) As the network becomes saturated, the 802.11 retry rate rises. These retransmissions compete with new packets for the airwaves, adding to the congestion. As congestion increases the probability of retransmission increases. Eventually the airwaves become filled with 802.11 packets. As the load increases a higher percentage of these packets are retransmissions. Therefore, once the airwaves are saturated with traffic, useful throughput will drop as more load is added to the system. Eventually 802.11 networks can become unstable if the retry rate continues to rise with no reduction in offered load.
For this series of tests, the system throughput did decline as we added more clients to the test as shown in the table at right. It appears that the network was saturated somewhere between the One Third and One Half client load.
Our subjective impression was that the network remained stable under this heavy load and the Retry Rates support this. Each of the APs averaged around 25% Retries for the fully loaded test, which is actually low for a fully saturated network.
High-Density WLAN Testing www.novarum.com 14
Bi-Dir Test
#Clients
Aggregate Throughput
All 295 520
Half 158 567.7
Third 95 625.0

Fixed Channel Testing SummaryUsing the fixed configuration for 5 GHz channels, we ran the Juniper wireless LAN system through the complete series of tests with all the different client loads. It appeared that the maximum aggregate capacity possible for the fixed channel configuration was just below 500 Mbps.
There are three different Chariot scripts and each one is run with three client populations.
#Clients
Bi-Dir Throughput
Max Throughput
Low Throughput
All 302 423 433 311
Half 156 479 483 312
Third 95 454 442 231
The aggregate throughput for the Bi-Directional Tests and the MaxThroughput tests are very similar and show the same trends as we add more clients to the test. This makes sense because those two test scripts involve the same number of streams exchanging data, and they are both configured so that each stream sends as much data as possible during the test. The only difference is the MaxThroughput tests are download only from the Chariot server to the clients. The smartphone and tablet clients have one stream each. The laptop clients have two streams. The Bi-Directional tests are a single download stream to each client with an additional upload stream from client to Chariot server for each of the laptop clients.
Most of the test cases overload the network during the two minute test period - illustrating the point that even a modest numbers of clients (the 156 smartphone, tablet and laptop clients of the “Half” client load) can saturate a modern dual band 802.11n Wi-Fi network if all clients are simultaneously generating continuous traffic for a sustained period of time.
0"
100"
200"
300"
400"
500"
600"
0" 50" 100" 150" 200" 250" 300" 350"
Aggregate'Th
roughp
ut'M
bps'
Client'Density'
Juniper'High'Density'Test'Summary'
Low"Throughput"
Bi5Direc9onal"
Max"Throughput"
High-Density WLAN Testing www.novarum.com 15

The Low Throughput scenario did not fully load the system with 94 clients. System throughput increased with 156 clients but then throughput levels out with 302 clients.
The Bi-Directional and Max Throughput scripts put more stress on the system. As more clients are added to these tests, throughput begins to decrease. For both tests throughput increased slightly as we went from 94 to 156 clients, but it is clear that the network is beginning to constrain overall system throughput. The load increased by 66%, but system throughput only increased by 6%. The additional clients add to the congestion and retry rates increase, decreasing the useful system capacity. Ultimately, throughput decreases when the full 302 clients run the test. We increased the load on the system by 94%, but experienced a 12% reduction in system throughput compared to the peak we measured with 156 clients.
The black lines on the chart are the linear trends for each curve. They show that although the throughput declines as we add more clients to the overload test cases, this is very gradual. It appears that the system could handle substantially more offered load before it becomes unstable.
High-Density WLAN Testing www.novarum.com 16

Low Throughput Script - Third ClientsThis is the Low Throughput script with 95 clients participating in the test - 39 laptops, 15 smartphones and 41 tablets. It is the simplest test that we ran. The aggregate throughput for this particular run is 233 Mbps, about half the maximum capacity of this network configuration.
0%#
5%#
10%#
15%#
20%#
25%#
30%#
35%#
40%#
0# 0.5# 1# 1.5# 2# 2.5# 3# 3.5# 4# 4.5# 5#Mbps%
Low%Throughput%Script2%Third%Clients%Throughput%per%Stream%%
There are 95 streams in the low throughput third load chariot script. The low throughput script caps the throughput from laptop clients at 5 Mbps, tablets at 2 Mbps and smartphones at 1 Mbps. You can clearly see the data caps in the Chariot throughput chart where each line in the chart is the throughput from a single stream in the test. No client reported a single timing record with throughput over 5 Mbps.
Channels 44+ and 165 are almost fully utilized. Channel 165 is the 20 MHz channel shared by two APs. The other 5 GHz channels have moderate utilization. It makes sense that channel 165 appears to be more occupied than the other 5 GHz channels - it is supporting twice the number of clients in a smaller channel. We don’t have an explanation for the higher usage on channel 44+. It could be as simple as a higher number of laptops were associated with channel 44+, while the lower throughput tablets chose the other 5 GHz channels.
High-Density WLAN Testing www.novarum.com 17

This is one of the few tests where the 2.4 GHz channels are not completely utilized. The instantaneous RF level in the 2.4 GHz channels is high as we would expect, but the history shows that the channels are not fully occupied during the test. Channel 11 has the most utilization and that matches the client distribution as there were nine clients using that channel while channel 6 supported five clients and channel 1 only two. The 2.4 GHz band is not fully loaded so there was likely no client load balancing that occurred for the few clients using those channels.
0"
5"
10"
15"
20"
25"
30"
1" 6" 11" 36" 44" 149" 157" 165"
Clients(by(Channel(
0"
5"
10"
15"
20"
25"
AP1" AP2" AP3" AP4" AP5" AP6"
Client'Distribu-on'by'AP'
Band steering appears to work well. 15 of the 95 clients participating in this test are smartphones that do not support the 5 GHz band. Sixteen clients were using the 2.4 GHz channels - all the smartphones and only one other client. The client distribution per AP is fairly even, indicating that the load balancing may be by AP.
High-Density WLAN Testing www.novarum.com 18

0%#
10%#
20%#
30%#
40%#
50%#
60%#
70%#
80%#
90%#
100%#
1# 6# 11# 36# 44# 149# 157# 165#
Retries'by'Channel'
0%#
10%#
20%#
30%#
40%#
50%#
60%#
70%#
80%#
90%#
100%#
1# 2# 3# 4# 5# 6#
Retries'by'AP'
High-Density WLAN Testing www.novarum.com 19
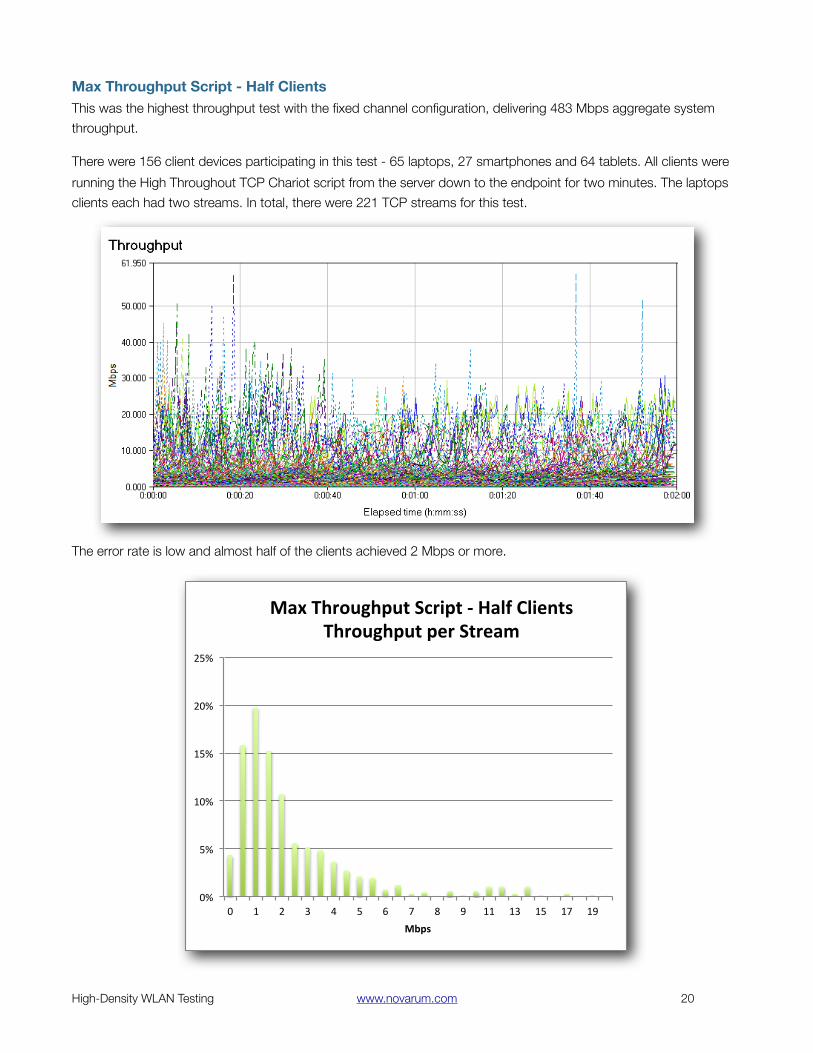
Max Throughput Script - Half ClientsThis was the highest throughput test with the fixed channel configuration, delivering 483 Mbps aggregate system throughput.
There were 156 client devices participating in this test - 65 laptops, 27 smartphones and 64 tablets. All clients were running the High Throughout TCP Chariot script from the server down to the endpoint for two minutes. The laptops clients each had two streams. In total, there were 221 TCP streams for this test.
The error rate is low and almost half of the clients achieved 2 Mbps or more.
0%#
5%#
10%#
15%#
20%#
25%#
0# 1# 2# 3# 4# 5# 6# 7# 8# 9# 11# 13# 15# 17# 19#Mbps%
Max%Throughput%Script%2%Half%Clients%%Throughput%per%Stream%
High-Density WLAN Testing www.novarum.com 20

0"
5"
10"
15"
20"
25"
30"
35"
40"
45"
50"
1" 6" 11" 36" 44" 149" 157" 165"
Client'Distribu-on'by'Channel'
0"
5"
10"
15"
20"
25"
30"
35"
40"
45"
50"
1" 2" 3" 4" 5" 6"
Client'Distribu-on'by'AP'
Clients are evenly distributed across the APs. Once again, channel 165 supports twice the number of clients, as it is the only 5 GHz channel that is shared by more than one AP.
High-Density WLAN Testing www.novarum.com 21

0%#
10%#
20%#
30%#
40%#
50%#
60%#
70%#
80%#
90%#
100%#
1# 6# 11# 36# 44# 149# 157# 165#
Retries'by'Channel'
0%#
10%#
20%#
30%#
40%#
50%#
60%#
70%#
80%#
90%#
100%#
1# 2# 3# 4# 5# 6#
Retries'by'AP'
Channel 44+ and channel 157+ have a higher percentage of retries than the others. Overall, the retry rate is surprisingly low.
High-Density WLAN Testing www.novarum.com 22

Bi-Directional Script - All ClientsThe All Clients configuration is 302 clients including 108 laptops, 53 smartphones and 141 tablets. There are 410 TCP streams in the Chariot script. Each laptop has a downstream TCP stream and an upstream stream. The tablet and smartphone clients have a single downstream pair. In this test, the Juniper system delivered 427 Mbps aggregate throughput.
The Chariot throughput report for this test run looks like chaos. All clients are attempting to send traffic continuously and there are 410 separate streams conducting data transfers. Some streams burst up to high speeds briefly but most never get above a few Mbps of throughput when averaged across the entire two minute run. In real networks with typical traffic load, clients will achieve much higher individual throughput rates during their "bursts" of traffic.
0.00%$
5.00%$
10.00%$
15.00%$
20.00%$
25.00%$
30.00%$
35.00%$
40.00%$
0$ 0.5$ 1$ 1.5$ 2$ 2.5$ 3$ 3.5$ 4$ 4.5$ 5$ 5.5$ 6$ 6.5$ 7$ 7.5$ 8$ 8.5$ 9$ 10$ 11$ 12$ 13$ 14$ 15$ 16$ 17$ 18$ 19$ 20$Mbps%
Bi(Direc-onal%Script%(%%All%Clients%Throughput%per%Stream%
High-Density WLAN Testing www.novarum.com 23

One reason for the lower aggregate system throughput is the higher error rate in this test - almost 15% of the streams did not complete the test. They were not able to send any data during the test or could not send any timing records back to the Chariot server.
0"
10"
20"
30"
40"
50"
60"
70"
80"
90"
100"
1" 6" 11" 36" 44" 149" 157" 165"
Client'Distribu-on'by'Channel'
0"
10"
20"
30"
40"
50"
60"
70"
80"
1" 2" 3" 4" 5" 6"
Client'Distribu-on'by'AP'
High-Density WLAN Testing www.novarum.com 24

The client distribution is not even for this test. In particular, AP2 and AP5 were unbalanced. AP2 had more than twice the clients of AP5. This is the only test where we did not see even balancing of clients across the APs. It is possible that clients were switching APs during the test because their packet transmissions were timing out. We observed much better distribution of clients across the APs when the network was not as heavily loaded.
0%#
10%#
20%#
30%#
40%#
50%#
60%#
70%#
80%#
90%#
100%#
1# 6# 11# 36# 44# 149# 157# 165#
Retries'by'Channel'
0%#
10%#
20%#
30%#
40%#
50%#
60%#
70%#
80%#
90%#
100%#
1# 2# 3# 4# 5# 6#
Retries'by'AP'
Channel 44+ and 157+ have the highest retry rates. This may be due to client behavior rather than the infrastructure. We noticed that Windows 7 clients seemed to have an affinity for channel 44+. They were usually trying to operate at higher data rates and this may contribute to the higher retry rate. The Windows drivers may need some adjustment to their rate adaptation algorithms.
For this clearly overloaded test, the retry rates we observed were still surprisingly low.
High-Density WLAN Testing www.novarum.com 25

General ObservationsBand steering in the Juniper system was quite effective. Most of the 5 GHz capable clients associated to the 5 GHz radio of their AP.
Retries did not increase dramatically as more clients were added to the tests. For the fixed channel configuration, the retries remained between 25% and 30% of the overall traffic. This is a surprising result. We expected to see a gradual increase in the retry rate as we increased the number of clients participating in the tests. What we observed is essentially a flat retry rate.
This reinforces the general notion of system stability that we observed throughout the testing. If the retry rates were rising, this would materially affect the aggregate capacity of the network.
As more clients are added, the error rate increases. Errors here are streams that were unable to deliver any data throughput during the Chariot test, or clients that were unable to return timing records to the Chariot server, or simply clients that were offline during the test initialization. The increasing error rate is consistent with the throughput decreasing under higher client loads. The majority of these errors are the client devices being unable to complete the Chariot test. These clients likely timed out when trying to send - they exceeded the maximum retry limit for the 802.11 network. This reflects the decreasing capacity available for each client device as the load on the network increases, and illustrates the poor responsiveness for client devices that is sometimes seen in heavily loaded networks.
0%#
5%#
10%#
15%#
20%#
25%#
30%#
35%#
95# 156# 302#Number'of'Clients'
Retry'Rate'
BiDir#
Max#
Low#
0%#
2%#
4%#
6%#
8%#
10%#
12%#
14%#
16%#
95# 156# 302#Number'of'Clients'
Error'Rate'
BiDir#
Max#
Low#
High-Density WLAN Testing www.novarum.com 26

Overall, 5 GHz traffic had a higher retry rate than 2.4 GHz traffic. In particular channel 44+ and 157+ had higher retry rates than the other channels. It may be that the clients on those channels were operating with 40 MHz channels and at higher modulation rates than the other channels, and thus were prone to higher packet errors and retries.
Channel 165 supported twice the number of clients as channel 44+ and 157+ but actually had lower retry rates on every test.
We were able to get some information about client behavior from the Juniper controller logs that may help explain the behavior. The “none” category in the Retry Rates by Device chart could be any client. These were primarily Android tablets such as the Kindle Fire which are not counted separately.
Windows 7 and Windows 8 clients have higher packet retry rates. They were using 40 MHz channels and generally were using higher modulation rates than the other client types. The wider channels and higher modulation rates are more prone to packet errors.
0%#
5%#
10%#
15%#
20%#
25%#
30%#
35%#
40%#
45%#
50%#
0# 50# 100# 150# 200# 250# 300# 350#
Retry&Ra
te&&
Number&of&Clients&
Retry&Rate&by&Channel&4&Max&Thruput&
1#
6#
11#
36#
44#
157#
165#
149#
0%#
10%#
20%#
30%#
40%#
50%#
60%#
none#
ipod#
iphone#
ipad#
ios3generic#
android3generic#
windows7#
windows8#
macos3generic#
Average'Retry'Rates'by'Device'(BiDir,'302'clients)'
High-Density WLAN Testing www.novarum.com 27

The chart below shows which channels the clients tended to use. We were able to gather this information from the Juniper controller logs which have a very detailed association table including this device type information. iPads seem to favor channels 36+ and 165. The smartphones (iPod Touch included) stay mostly in the 2.4 GHz channels.
0"
5"
10"
15"
20"
25"
30"
35"
40"
1" 6" 11" 36" 44" 149" 157" 165"
#"Clients"
Channel""
Device"Type"by"Channel"
none"
iPod"
iPhone"
iPad"
IOS"generic"
Android"
Windows7"
Windows8"
MacOS"
Channel 44+ has a number of Windows 7 clients associated. During the Bi-Directional Throughput and Max Throughput tests, laptops have two streams per device, so they are generating more traffic than tablets or smartphones. It appears as though the Windows laptops take over channel 44+ and then try to operate at higher modulation rates which causes increased packet errors and subsequently increased packet retries.
High-Density WLAN Testing www.novarum.com 28

ConclusionsAlmost all Wireless LANs will have some areas of high-density in their networks. For some networks — like stadium networks and many education networks — most of the network will be high-density. It is important to understand how these systems work under high load and with real clients in order to properly choose the right network equipment and configure it properly.
In this paper we have described a testing facility for evaluating high-density networks and understand the underlying phenomena that are occurring. We were able to construct a repeatable test scenario with up to 302 typical Wi-Fi clients accessing an enterprise wireless LAN consisting of six dual-band 802.11n enterprise access points. We used packet captures, spectrum analysis, the Chariot testing results, and even the Juniper controller logs to describe the behavior of the system and compare performance of different configurations.
High-density wireless LANs should leverage all of the available resources, and ensure that modern Wi-Fi clients can operate in the highest performance mode — configure as many 40 MHz channels as possible in the 5 GHz band. Systems that efficiently spread the available resources across the clients will perform better and remain stable under higher loads. We found that subtle network configuration and management features can lead to large differences in performance. Band steering and load balancing are important system features that contribute to this, and we were able to observe their impact on performance during the testing. We also observed air time fairness and rate adaptation algorithms in action. In general, all the clients were able to get some throughput and no client was able to dominate the network.
Key FindingsJuniper has an amazing high-density testing facility where we were able to construct a repeatable test scenario with 302 typical Wi-Fi clients accessing an enterprise wireless LAN consisting of six modern dual-band 802.11n enterprise access points. Most of the tests we conducted overload the network with more traffic than is possible to deliver during the testing period. This allowed us to observe the systems under high stress. We gathered a tremendous amount of data during the tests. After analyzing the results, the important factors that differentiate a high performing high-density WLAN are the details of subtle system level features.
Juniper’s Band Steering worked well. The 5 GHz capable clients consistently moved to the 5 GHz channels where there is more bandwidth available. Load Balancing worked well. On a variety of tests with different client populations, the client devices were spread evenly across the available APs. Rate adaptation was properly tuned for a variety of different client devices.
The Juniper WLAN system delivered consistent throughput and operated in a stable fashion under very high offered load. Under the highest load, with hundreds of clients accessing the network simultaneously, almost all of the individual clients were able to deliver modest data throughput during the tests, and no client was able to grab an unfair share of the available capacity.
The 802.11 retry rates were moderate and stayed relatively flat as we increased the number of clients participating in the tests. At maximum client load with the high throughput tests, aggregate system throughput declined compared to the peak throughput we measured. However, the retry rates were lower than we expected, and it appeared that the system would remain stable with even higher loads.
When compared to competitive systems, the Juniper system delivered more aggregate throughput under heavy load.
High-Density WLAN Testing www.novarum.com 29

Appendix - About NovarumNovarum is an independent consulting firm specializing in wireless broadband technology and business. Novarum provides consulting, strategic advice, analysis and network design for cities, service providers, enterprises and vendors in the wireless broadband industry. Our technology focus spans Wi-Fi, WiMAX and 4G cellular data systems. Novarum offers a unique insider perspective from pioneers in the wireless and networking industry who have practical experience bringing wireless products to market.
Phil BelangerPhil has over 25 years of broad leadership in the technology, marketing and standards of data networks. Phil pioneered local area networking technology with Zilog and Corvus and extended that leadership by co-leading the multi-company technical and marketing efforts that produced the original IEEE 802.11 wireless LAN standard.
Phil defined the original market position of wireless LANs for mobile computing with Xircom. While at Aironet, he broadened the market for wireless LANs and laid the foundation for Wi-Fi's success with the acquisition of Aironet by Cisco. Phil was one of the founders of the the Wi-Fi Alliance and served as the group’s initial Chairman, creating the Wi-Fi brand and promoting Wi-Fi for the entire industry. He helped create the business model for Wi-Fi service providers with Wayport and expanded the market for Wi-Fi infrastructure with extended range technology of Vivato and municipal mesh networks at BelAir Networks.
Ken BibaKen is a rocket scientist. He also has many years experience in the network information systems industry bringing a unique background of general management with a strong product and marketing focus in network systems and information security. Ken was an early engineer of the Internet in 1975. He has co-founded and managed four notable networking companies — Sytek, which was focused on cable TV-based local and metropolitan data networks, Agilis which was focused on wireless handheld computers, Xircom, which developed local area network client products for mobile computing, and Vivato, which was focused on scaling Wi-Fi infrastructure to cover campuses and metropolitan areas. Ken's perspective as CEO, board member of public and private companies, and as a technologist brings unique insight to the business, market and technology of bringing useful wireless solutions to users. Ken has a Bachelor of Science in Physics (Magna Cum Laude, Tau Beta Pi) and a Master of Science in Computer Science from Case Western Reserve University.
Wayne Gartin Wayne is a senior executive with world-wide experience at start-ups and Fortune 500 companies. He has built high level relationships and delivered business partnerships at all levels for companies in the communication, software, and semiconductor markets. Wayne has worked with industry leading suppliers in all aspects of network technology, including long haul transport, metropolitan networks, wired and wireless LANs. He has successfully run multi-million dollar sales teams for companies in the access (last mile) consumer oriented markets, Passive Optical Networks, VoIP, and IMS. Wayne has held executive and senior level positions at Centillium, Agility (now JDSU), Bandwidth 9 (now NeoPhotonics), Infineon, Lucent, Adaptec, and Intel. He is also the co-founder of a semi-conductor IP company. Wayne’s experience with multiple channels and leading successful sales teams to multi-million dollar revenue levels brings a unique insight to the strategies necessary to successfully launch new products and technologies into the market. Wayne has a BS in Math and an MBA from the University of Utah. He has been a certified instructor for sales and marketing courses in strategic planning, negotiations, and sales management.
High-Density WLAN Testing www.novarum.com 30