SnapValet ARB Team 03 1. SnapValet ARB Team Evaluation Molly Karcher 2.
Upload
esmond-crawfordCategory
view
218download
0
1
JUNE 27, 2013
ARB INFORMATIONAL UPDATE:ASSOCIATION OF BAY AREA GOVERNMENTS’/
METROPOLITAN TRANSPORTATION COMMISSION’SDRAFT SUSTAINABLE COMMUNITIES STRATEGY
• September 2010 - ARB set regional greenhouse gas emission reduction targets with per capita metric
• July 2011 - ARB developed methodology for reviewing GHG target determinations made by MPOs
• Since October 2011 - ARB Board has accepted GHG determinations from five MPOs
• July 2013 - ABAG and MTC will consider adoption of the Bay Area’s SCS
2
STATUS OF SB 375 IMPLEMENTATION

THE BAY AREA REGION
• Over 7 million people
• Region includes 9 counties, 101 cities
• Variety of transportation options
• Diverse region: urban centers, suburban, rural, open space
• Known for high tech industry
3

A HISTORY OF SUSTAINABLE PLANNING
• Transportation for Livable Communities Program (1998)
• Transit Oriented Development Policy (2005)
• FOCUS development and conservation strategy (2006)
• Many examples of current projects consistent with SB375 and GHG goals
4

New BART Station (Fremont to San Jose)
East Bay Bus Rapid Transit
5
New Transportation Projects (2014-2016 Completion)

Contra Costa Centre Transit Village
6
Emeryville Bay Street Mixed Use Village
Transit Oriented Development (Completed)
• 2009 Regional Targets Advisory Committee (RTAC) recommended bottom-up approach and a per-capita metric for the target
• ARB set targets of 7 percent in 2020, 15 percent in 2035
• MTC recommended higher targets than their initial scenarios demonstrated
• Plan would achieve 10 percent in 2020, 16 percent in 2035 7
ARB TARGET SETTING PROCESS

ABAG/MTC’S DRAFT PLAN BAY AREA
8
OVERALL VISION
• Accommodate substantial new growth, all within existing urban boundaries
• Preserve open space and retain the character of existing communities
• Maximize efficiency of the transportation system, including roads and transit
• Meet regional goals for economic, social and environmental improvement
9
DEVELOPMENT OF THE PLAN
• Visioning and planning process began in 2010
• Multiple advisory committees and working groups including those focused on equity and environmental justice
• Comprehensive performance targets adopted in 2011
• Screened the plan’s transportation projects using performance targets as criteria
• Five scenarios tested to identify preferred alternative
10
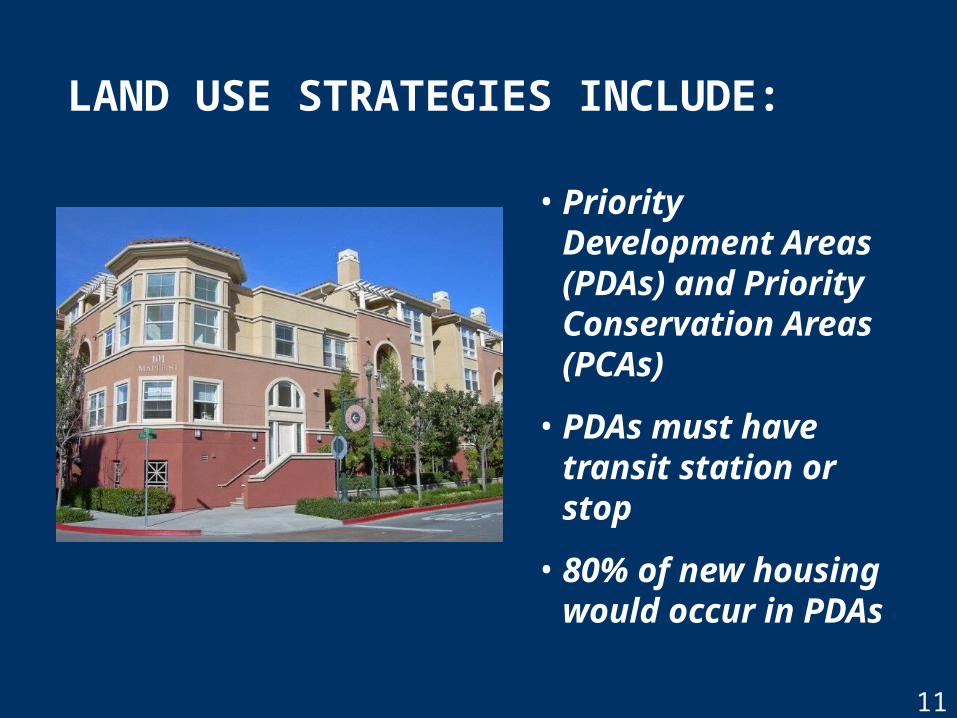
• Priority Development Areas (PDAs) and Priority Conservation Areas (PCAs)
• PDAs must have transit station or stop
• 80% of new housing would occur in PDAs
LAND USE STRATEGIES INCLUDE:
11
12
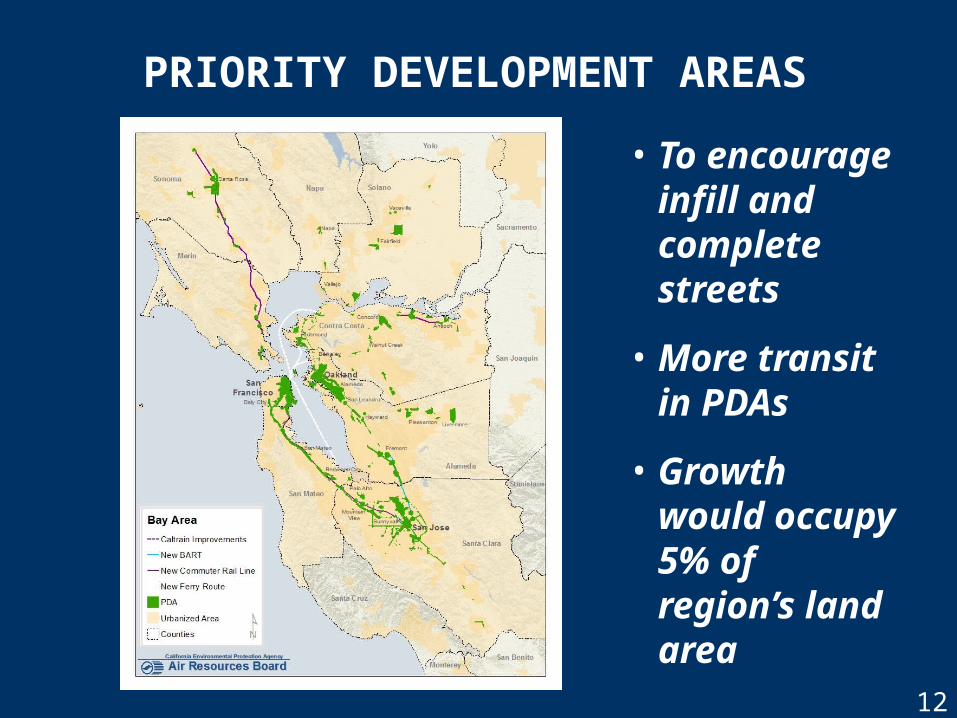
PRIORITY DEVELOPMENT AREAS
• To encourage infill and complete streets
• More transit in PDAs
• Growth would occupy 5% of region’s land area
13
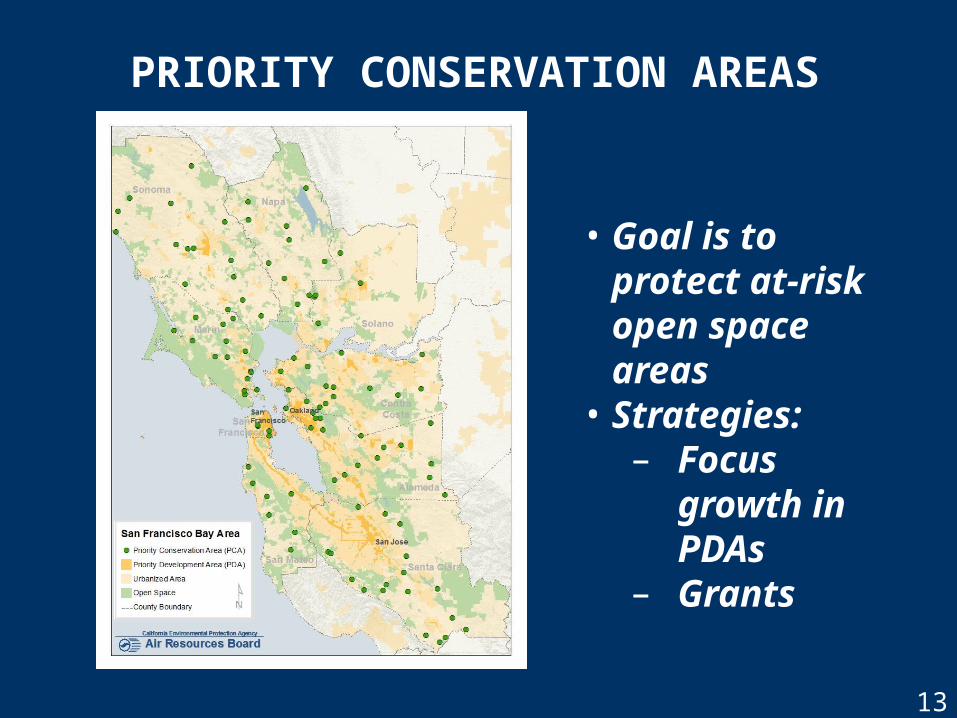
PRIORITY CONSERVATION AREAS
• Goal is to protect at-risk open space areas
• Strategies:– Focus
growth in PDAs
– Grants

• Preserve the well-established multi-modal transportation system
• Add major new transit projects (BART extension, Caltrain electrification)
• Invest in projects that support focused growth in priority development areas
TRANSPORTATION STRATEGIES
14
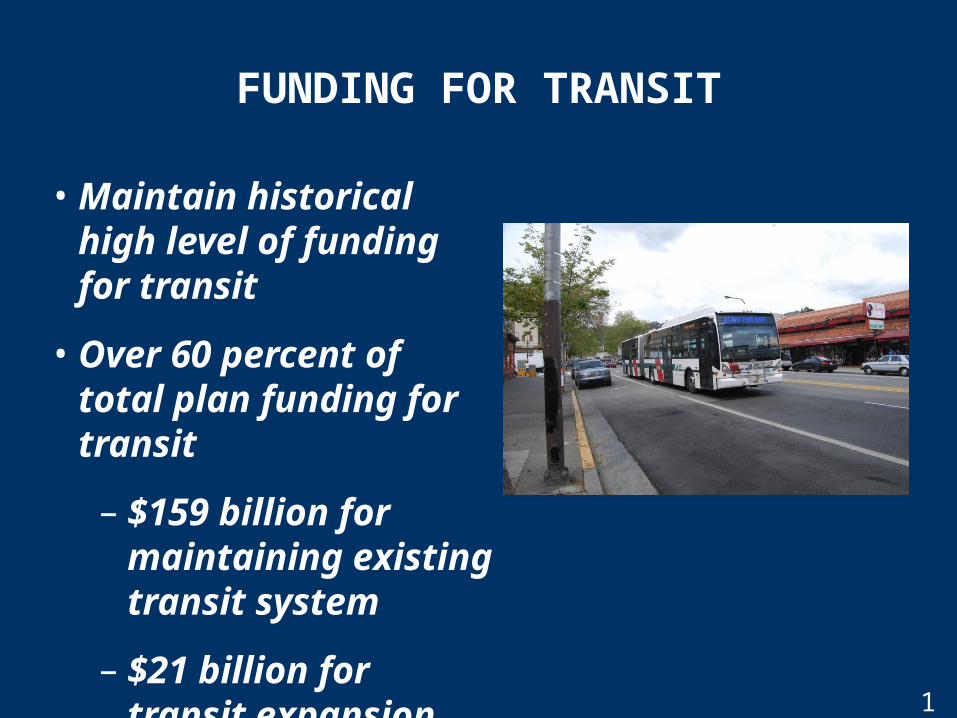
FUNDING FOR TRANSIT
• Maintain historical high level of funding for transit
• Over 60 percent of total plan funding for transit
– $159 billion for maintaining existing transit system
– $21 billion for transit expansion
15

16
EDUCATION &TECHNOLOGYINNOVATION

RTP/SCS CLIMATE INITIATIVES
17
• Supportive of ARB’s advanced technology goals– Regional EV Chargers– Vehicle Buy-Back and PEV
Incentives– Clean Vehicle Feebates
• Car Sharing• Smart Driving (Eco-driving)• Commuter Benefit Ordinance• Vanpooling

MEETING THE 2035 TARGET
18
• SCS projects 16 percent per capita GHG emissions reduction :
– Land use and transportation – 9.8%
– New climate initiatives – 6.2%
• Projection exceeds target by 1 %• ARB staff continues to consult
with MTC technical staff on quantification

• Designed to evaluate the accounting of greenhouse gas reductions from an SCS
• Staff reviewed modeling tools, inputs and assumptions
• Review tailored to regions
ARB STAFF TECHNICAL REVIEW
19

LAND USE AND TRANSPORTATION
PERFORMANCE INDICATORS
20

21
MULTI-FAMILY HOUSINGIncreasing share of multi-family units.
2010 2020 203534%
35%
36%
37%
38%
39%
40%
41%
42%
43%
44%
Perc
en
t of
Mu
lti-
Fam
ily U
nit
s

HOUSING IN PRIORITY AREASBy 2035, 35 percent of all housing units will be in PDAs.
222010 2020 2035
22%
24%
26%
28%
30%
32%
34%
36%
38%
40%
% o
f Tota
l H
ou
sin
g in
PD
As

PERCENT CHANGE IN MODE SHAREBy 2040, there are fewer drive-alone trips and more trips taken by biking, walking, and transit.
23Drive Alone Public Transit Bike/Walk-10%
0%
10%
20%
30%
40%
50%
% C
han
ge R
ela
tive t
o 2
00
5

PER CAPITA VEHICLE MILES TRAVELEDPer capita VMT decreases.
24
2005 2020 203516
17
18
19
20
21
22
23
24
Veh
icle
Mil
es/D
ay/C
ap
ita

COMMENTS FOR PLAN IMPROVEMENT
• Positive stakeholder comments
– Integrates transportation, land use, housing planning
– Maintains existing multi-modal transportation system
– Includes public health performance target
• Suggestions for improvement
– Include more affordable housing
– Add more transit for communities of concern
– Avoid displacement 25
NEXT STEPS
• ABAG/MTC consider Plan adoption July 18
• ARB staff reviews Final SCS to see if any changes in the GHG quantification
26