June 22nd, 2015 Sandusky, Ohio Presenter: Scott Strahley ...
71
June 22nd, 2015 Sandusky, Ohio Presenter: Scott Strahley, PE, CEA, Ohio RCAP Engineer
Transcript of June 22nd, 2015 Sandusky, Ohio Presenter: Scott Strahley ...

June 22nd, 2015
Sandusky, Ohio
Presenter: Scott Strahley, PE, CEA, Ohio RCAP Engineer

What has Ohio done on Energy Audits? Funding Sources
Outreach
Energy Savings/Saving Money in Operations
Energy Audit Benefits

TMF Technical
Managerial
Financial
Water Systems
Wastewater Systems
Other Village Resources?
Holistic Approach?
Certified Auditors
Knowledge of Water Systems Operations and Processes
vs.
Equipment and Lights
Alternative Energy

Short-Term
Long-Term
Water Quality?
Financial Goals?

Energy Conservation: Doing Work With Less Energy
Human Behaviors: Habit, Knowledge, Understanding
Negative Reputation- Jimmy Carter’s era of sitting in the dark with a sweater!
Energy Efficiency: Using Energy More Effectively
Use of Technological Advances, Equipment, Controls
Politically Correct - Being Green!
Energy Demand from Generation Plants Peak Demands
Environmental Concerns Greenhouse Gases
Depletion of Natural Resources
Advances in Technology Manufacturers, Regulatory Mandates
National Security/Self Reliance
Political Pressure
Others???


The impacts of inefficiency:
Generation: average 50% efficient
Transmission/distribution: average 93% efficient
Demand side: industrial assume 90% efficient
residential assume 20% efficient
Impact: industrial demand = 239%
residential demand = 1,075%

0
200
400
600
800
1000
1200
1 2 3 4 5 6 7 8 9 10 11 12 13 14 15 16 17 18 19 20 21 22 23 24
Time of day
KW
Base load Plants
Intermediate Plants
Peaking Plants & Power Purchases
Apower plants must come on-line to maintain a reliable electrical system

Federal Government Energy Star EPACT (Energy Policy Act 2005)
Motors T-12 Fluorescent Bulbs Incandescent Bulbs (above 60 watts)
Tax Incentives
State Government State Mandated Energy Programs
Energy Efficiency Demand Reduction Renewable Energy

Energy Efficiency: Simply the process of doing more, with less. The goal is to accomplish the same tasks and functions as before, while using less energy.
-California Center for Sustainable Energy
Through technology and practice
Without compromising quality, safety, or comfort
Lighting:All of Them!24 x 7 x 365!!!!

16 4-lamp fluorescent fixtures T-12: 0.163 kW per fixture
2.608 kW total
T-8: 0.102 kW per fixture 1.632 kW total (0.976 kW difference)
24 Hours vs. 8 Hours - @ $0.07 = $2,793 savings
Lighting:All of Them!24 x 7 x 365!!!!

Track and Evaluate Monthly Energy Usage Look for Trends and Unexplained Changes
Investigate Changes…
Examine Costs of Operating Methods Do you understand the energy costs associated
with your Standard Operating Procedures (SOP’s)?
Implement Asset Management Program Comprehensive Operation & Maintenance (O&M) program
Properly Maintained Equipment Operates Best!

Make Entire Team Aware of Energy Use Share billing information with operators
95% of Operators Typically DO NOT See The Energy Bill
99% That Do See The Bills DO NOT Understand It!
Communicate your energy savings goals
Understand your Operations and Processes
Replace older Equipment with: Premium High Efficiency Motors & Pumps
T-8, T-5 & LED lighting
High S.E.E.R HVAC


Estimates Are Indicating That: A large percentage of municipal energy use is associated
with water and wastewater treatment Approximately 30-60%of a municipal budget
“If drinking water and wastewater systems reduce energy use by just 10%...collectively they could save approximately $400 million and 5 billion kWh annually” US EPA – Ensuring a Sustainable Future: An Energy
Management Guidebook for Wastewater and Water Utilities
Know your Rate Structures!!! Each utility company has a published document
detailing the available rate classifications, tariffs, and structures applicable for various uses. If in doubt, ASK the utility company for HELP!
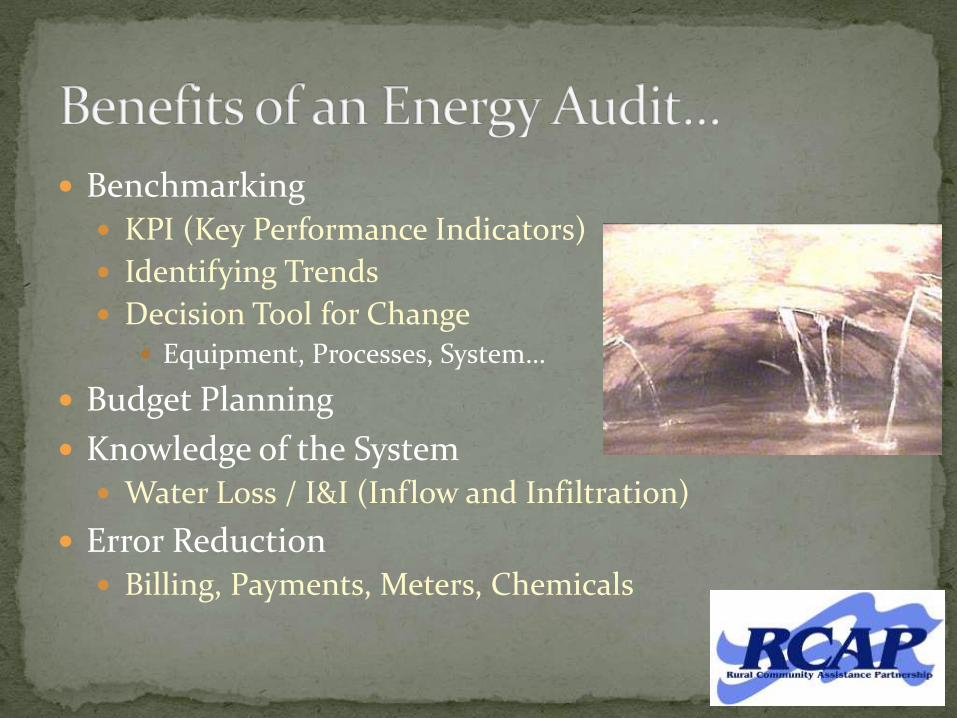
Benchmarking KPI (Key Performance Indicators)
Identifying Trends
Decision Tool for Change Equipment, Processes, System…
Budget Planning
Knowledge of the System Water Loss / I&I (Inflow and Infiltration)
Error Reduction Billing, Payments, Meters, Chemicals

Use as Guidance, Not Gospel! Inexact Science, At Best! – Scale of Magnitude!
Assumptions
Rate Fluctuations
Rates, Riders, Mid-year Changes
Sliding Scale Based On Usage
Operational Changes
Equipment Performance
Personnel Performance
Emergencies
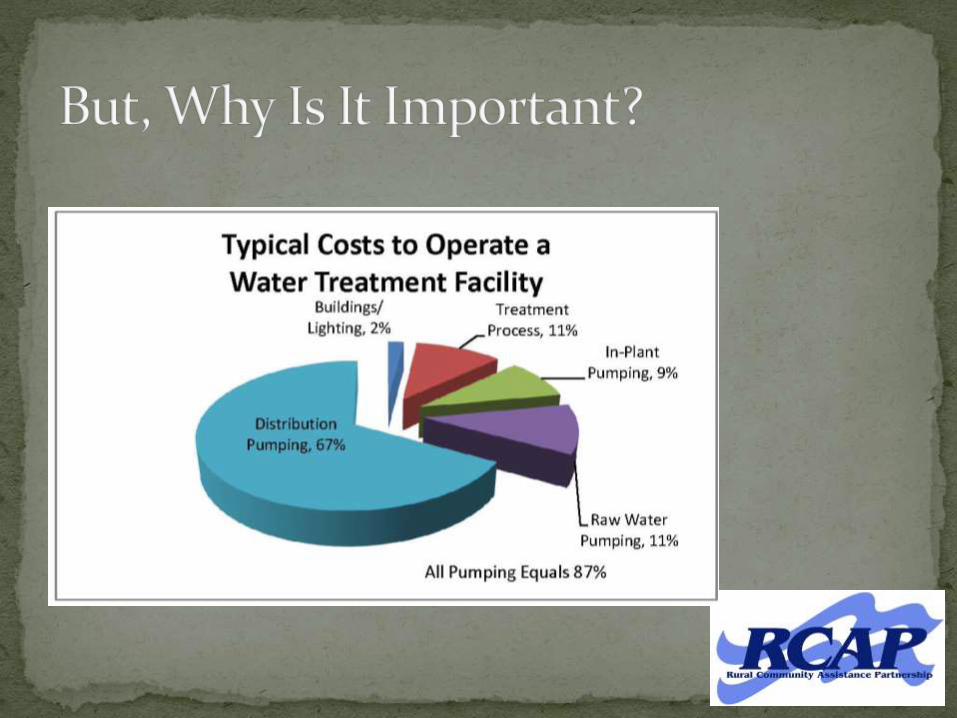
Water: Pumping
Pressure
Throttled Valves
Variable Speed Drives
Controls
Operations
Etc.

Wastewater: Aeration
Pumping
Variable Speed Drives
Automatic Controls
Solids Management
Operations
Processes
Etc.

Energy Audit, Level I Cursory Review and Analysis
Broad Generalizations – Low/No Cost
Intended To Be: Brief, Simple, Crude
To Determine if Additional Study is Warranted and/or Required

Energy Audit, Level II NOT a Definitive Analysis
Not Investment Grade or Capital Intensive
More In-Depth Than a Level I Thorough Review of Billing and Equipment
Analysis of Operations and Maintenance
A Broad Range of Savings Options
Detailed Calculations of Opportunities
Declarations of Assumptions and Constraints
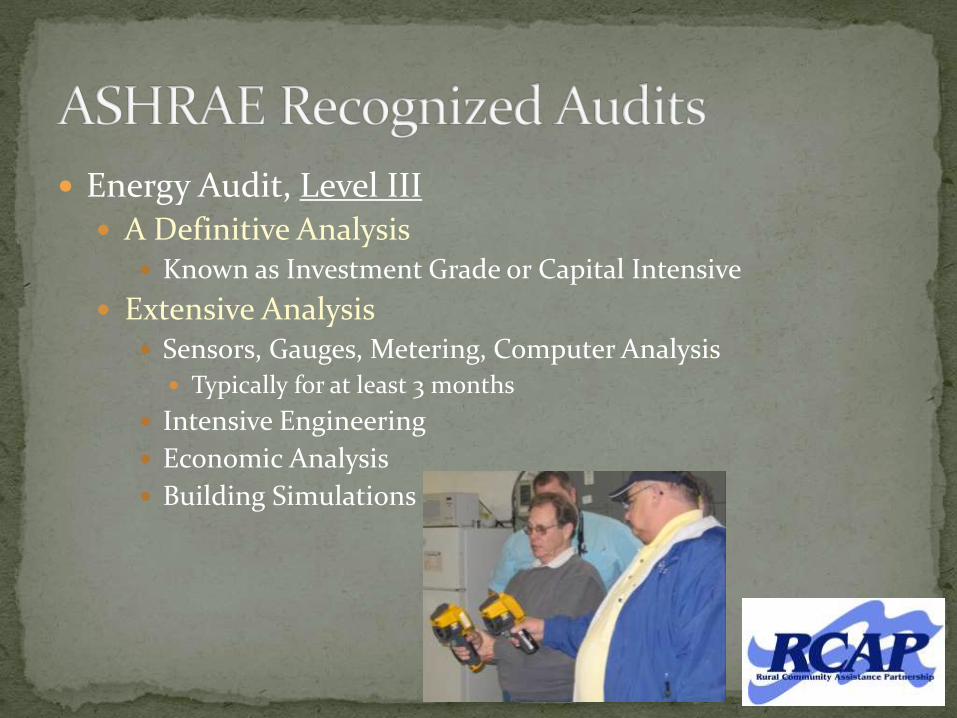
Energy Audit, Level III A Definitive Analysis
Known as Investment Grade or Capital Intensive
Extensive Analysis Sensors, Gauges, Metering, Computer Analysis
Typically for at least 3 months
Intensive Engineering
Economic Analysis
Building Simulations
Determine Cursory Benchmarks: Service Population
MG/Yr
Cost ($)/kWh
kWh/MG
Cost ($)/MG Compare to similar facilities
Compare to similar regions
USEPA’s Energy Star Portfolio Manager
USEPA’s Energy Audit Tool
US Dept. of Energy Equipment Evaluation Tools PSAT – Pump System Assessment Tool
MotorMaster +
Simple Excel Spreadsheet
Or Other Program

100 hp TEFC motor costs ~ $4,543 It costs $12,707 per year to operate
280% of purchase cost!
@ 2,920 hours/yr, 75% load, $.07/kWh
Premium Efficient Saves! 5%, $670/yr, $10,050/15-yrs
Efficiency Demand Use/Year Cost/Year 15-Yr Cost
90% 62 kW 181,536 kWh $12,707 $190,605
95% 58 kW 171,959 kWh $12,037 $180,555
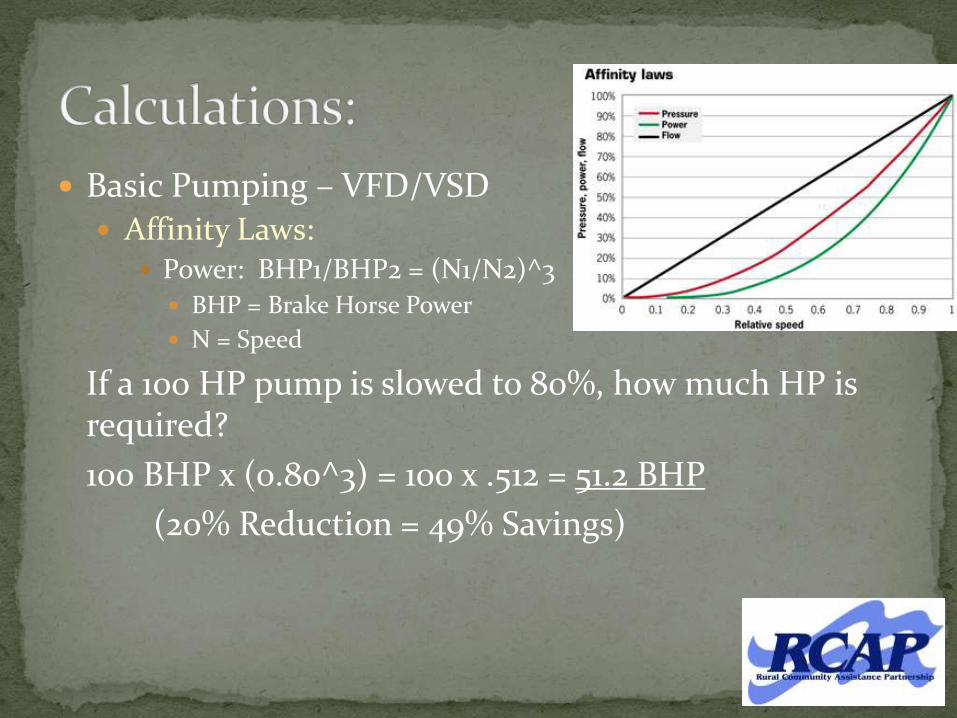
Basic Pumping – VFD/VSD Affinity Laws:
Power: BHP1/BHP2 = (N1/N2)^3
BHP = Brake Horse Power
N = Speed
If a 100 HP pump is slowed to 80%, how much HP is required?
100 BHP x (0.80^3) = 100 x .512 = 51.2 BHP
(20% Reduction = 49% Savings)
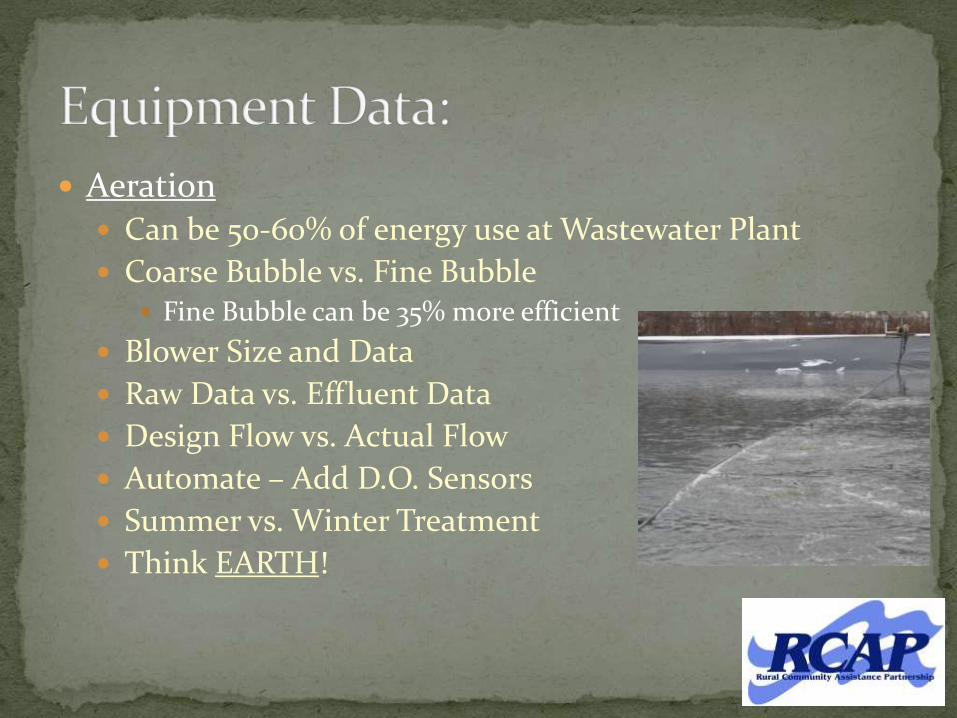
Aeration Can be 50-60% of energy use at Wastewater Plant
Coarse Bubble vs. Fine Bubble Fine Bubble can be 35% more efficient
Blower Size and Data
Raw Data vs. Effluent Data
Design Flow vs. Actual Flow
Automate – Add D.O. Sensors
Summer vs. Winter Treatment
Think EARTH!

What is Aeration Used For: Organic Treatment
Ammonia
Biological Oxygen Demand (BOD)
Mixing
How is it Controlled: Number of Diffusers, Size of Orifice
Air Flow Rate (relative to Blower Size)
Blower Controls (Sensors)

Energy Efficiency Can Make a Difference!

Examples Wastewater Treatment Plant
Over-Treating
Inflow and Infiltration
Energy Rates (Tariff)
Controls
Water Treatment Plant Water Loss
Production Levels
Pump System Analysis
Process Controls

Convoy WWTP

Analysis Village Population 1,110
Facility Constructed 1938 (upgrade 1987)
Production (MGD): 0.200 Design, 0.248 Actual
Annual Energy Use = 391,036 kWh / yr
Annual Energy Cost = $26,548 / yr
Average Energy Cost = $0.068 / kWh
Energy Use = 4,320 kWh / MG (295%)
Treatment Cost = $293.75 / MG (277%)

Initial Assessment: Small
Moderately Aged (over 25 yrs)
Low Energy Cost for Region
High Energy Use
High Production

Aeration Levels

Flow Analysis
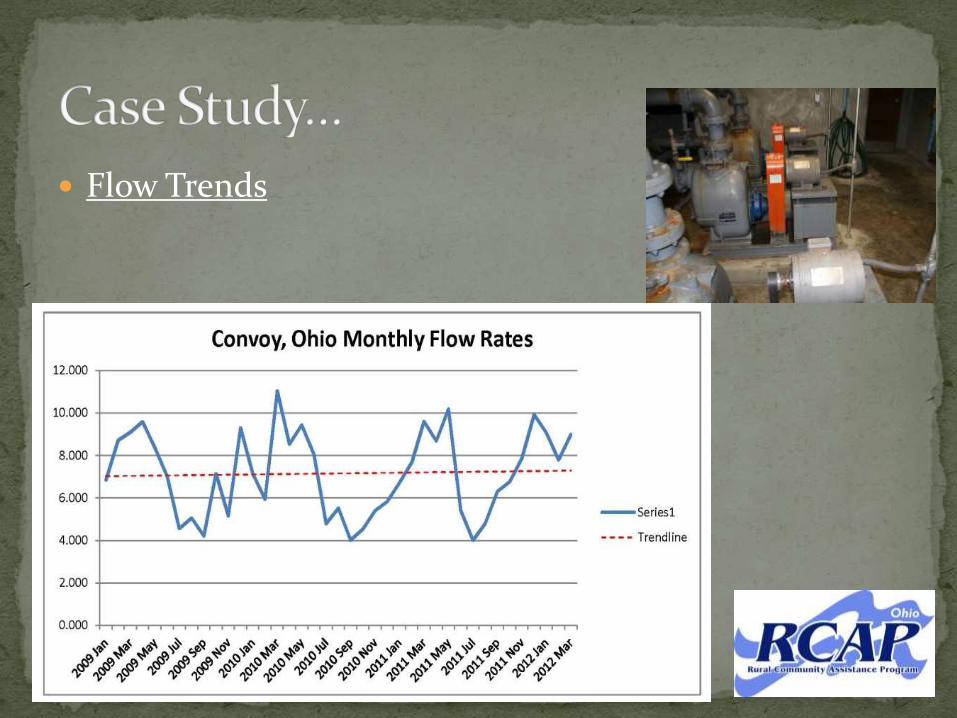
Flow Trends

Water Use? Water Production: 0.150 MGD
500 Connections
150 gpd per connection = 0.075 MGD
0.040-0.075 MGD Reduction Potential

Results: Focused Analysis –
Water Use and Disposal
Main Opportunity Water Meter Installation
Additional Opportunities Equipment
Controls
Aeration

Pending Capital Improvement Projects Additional Water Well
Additional Storage Tank
Water Main Replacement
Upgrade/Replacement of Wastewater Plant
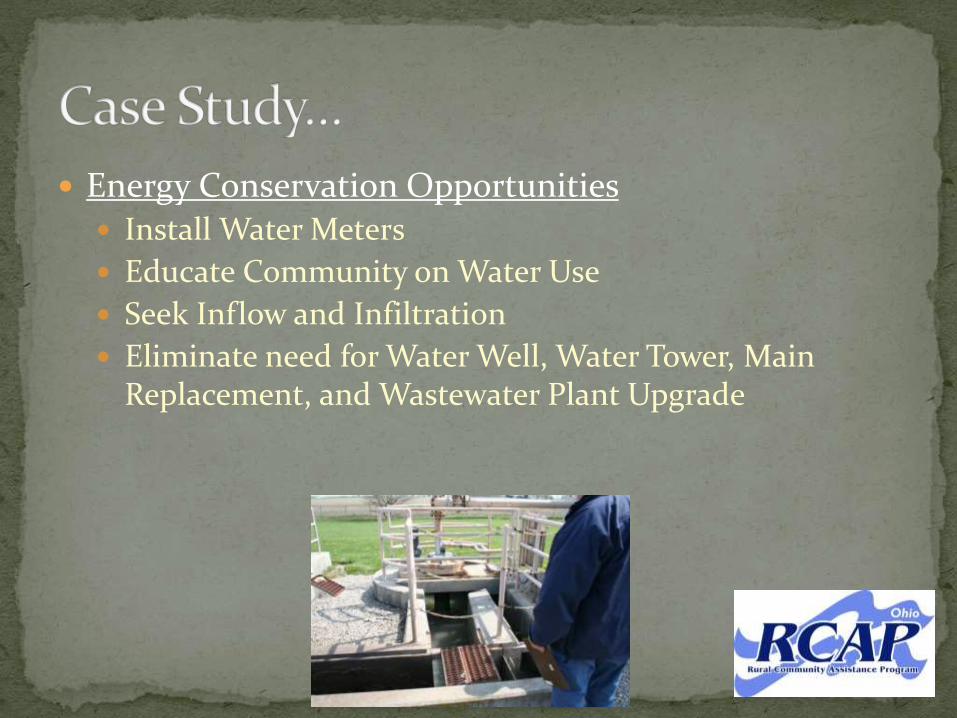
Energy Conservation Opportunities Install Water Meters
Educate Community on Water Use
Seek Inflow and Infiltration
Eliminate need for Water Well, Water Tower, Main Replacement, and Wastewater Plant Upgrade
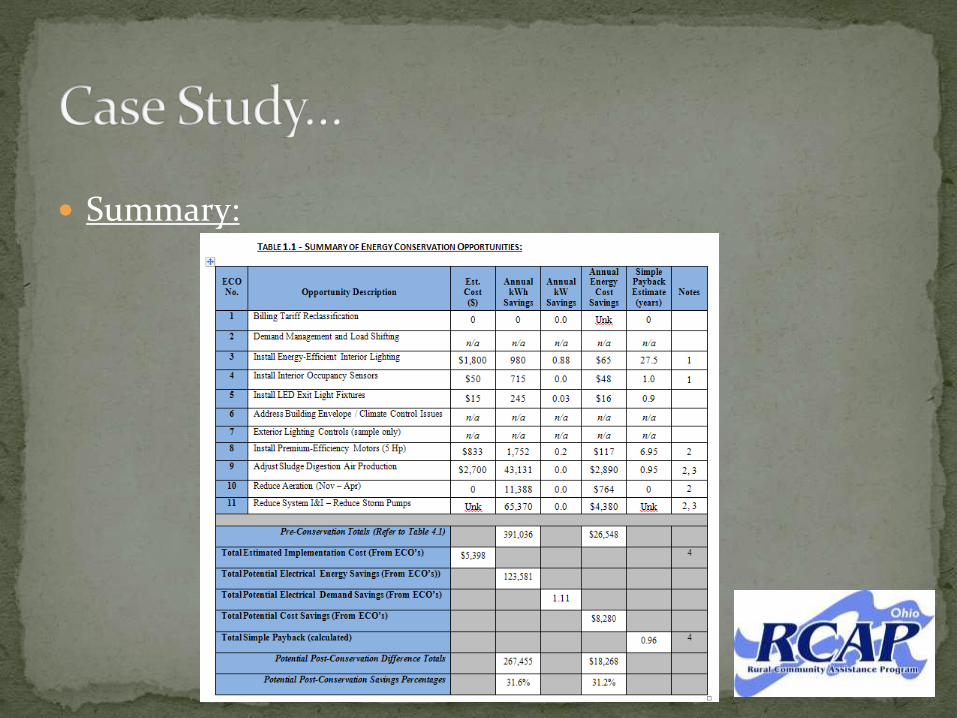
Summary:

Wasteville WWTP Village Population 1,397
Facility Constructed 1979
Flow (MGD): 0.25 Design, 0.081 Actual
Annual Energy Use = 416,800 kWh / yr
Annual Energy Cost = $ 23,745 / yr
Average Energy Cost = $ 0.057 / kWh
Energy Use = 14,098 kWh / MG
Treatment Cost = $ 803.15 / MG

Wasteville WWTP Initial Assessment:
Small Size
Relatively Aged (over 30 yrs)
Low Energy Cost ( $0.057/kWh ) for Region
High Energy Use ( 14,098 kWh / MG )
High Treatment Cost ( $803 / MG )

Wasteville WWTP Focused Analysis – Aeration System
50-hp Blower Motor, 24 hrs / 7 days
Deteriorated Diffuser System
Main Opportunity Repair/Replace Diffusion from Coarse to Fine
Over 35% increase in Oxygen Transfer
Decrease Blower Size
From 50-hp to 15-hp
Maintain Treatment Quality

Wasteville WWTP Energy Conservation Opportunities
Annual Energy Use = 162,223 kWh / yr
A 254,567 kWh Savings (61%)
Annual Energy Cost = $ 8,985 / yr
A $14,760 /yr Savings (62%)
Energy Use = 5,487 kWh / MG
Treatment Cost = $ 303 / MG
Cost of Opportunities = $29,970
2.03 year Simple Payback
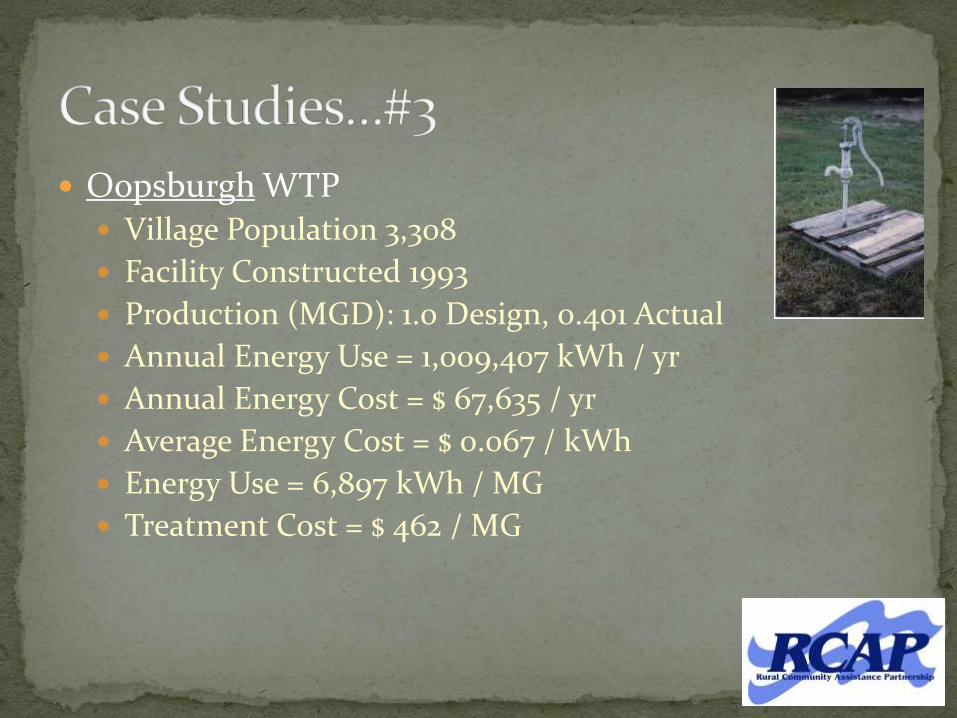
Oopsburgh WTP Village Population 3,308
Facility Constructed 1993
Production (MGD): 1.0 Design, 0.401 Actual
Annual Energy Use = 1,009,407 kWh / yr
Annual Energy Cost = $ 67,635 / yr
Average Energy Cost = $ 0.067 / kWh
Energy Use = 6,897 kWh / MG
Treatment Cost = $ 462 / MG
Oopsburgh WTP Initial Assessment:
Small Size
Moderately Aged (over 15 yrs)
Low Energy Cost ( $0.067/kWh ) for Region
Moderate Energy Use ( 6,897 kWh / MG )
High Production Cost ( $462 / MG )

Oopsburgh WTP Focused Analysis – Distribution
3 – High Service Pumps, 100-hp, 60-hp, 50-hp
100-hp Pump Used Daily, Throttled Back
Pump Curves Indicated Capacity Same as 60-hp
Main Opportunity Use 60-hp Pump at 100% (Optimum Efficiency)
A $ 9,275 No-Cost Savings
Maintain Production Volume

Oopsburgh WTP Energy Conservation Opportunities
Annual Energy Use = 813,801 kWh / yr
A 195,606 kWh Savings (19%)
Annual Energy Cost = $ 54,010 / yr
A $13,625 /yr Savings (20%)
Energy Use = 5,560 kWh / MG
Treatment Cost = $ 369 / MG
Cost of Opportunities = $10,300
0.76 year Simple Payback
Lift Valley WWTP System with Multiple Lift Stations
Duplex, Submersible
Tariff Classifications Tariff 211 – Small General Service
Usage Billing, No Demand
Tariff 215 – Medium General Service
Use and Demand Billing
Demand Over 10kW / 12-mo Time Period
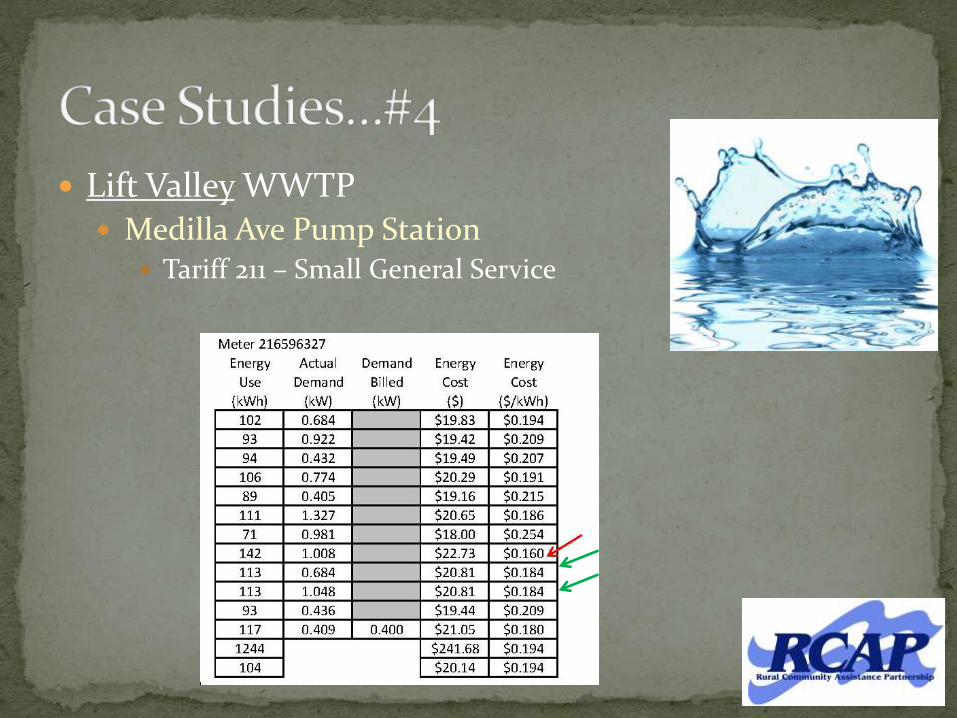
Lift Valley WWTP Medilla Ave Pump Station
Tariff 211 – Small General Service
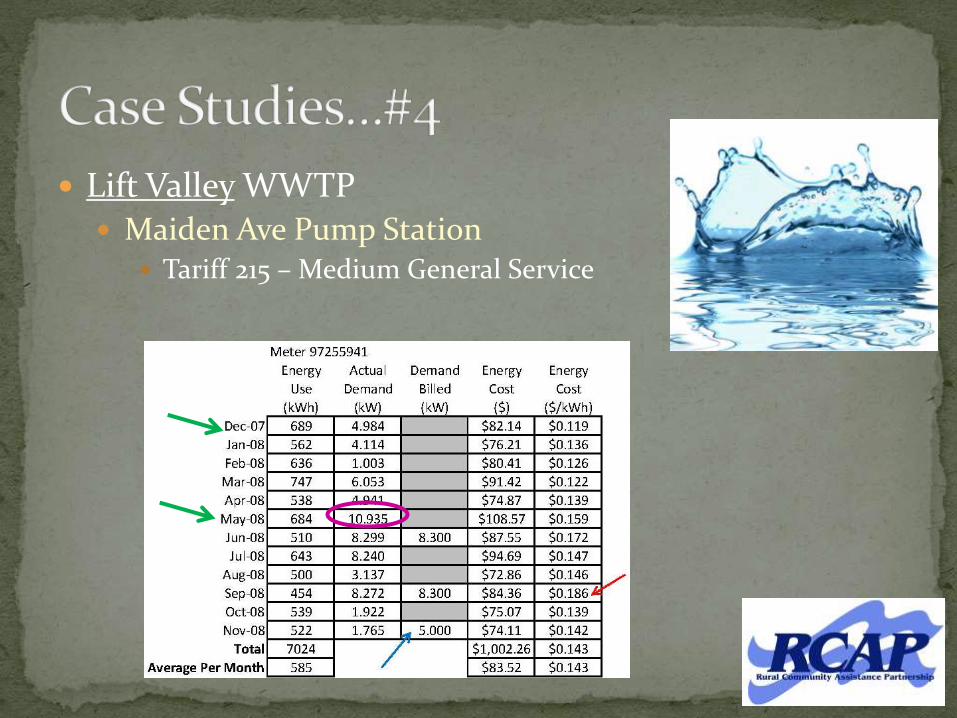
Lift Valley WWTP Maiden Ave Pump Station
Tariff 215 – Medium General Service

Lift Valley WWTP Side-By-Side Comparison
Tariff 215 – Tariff 211

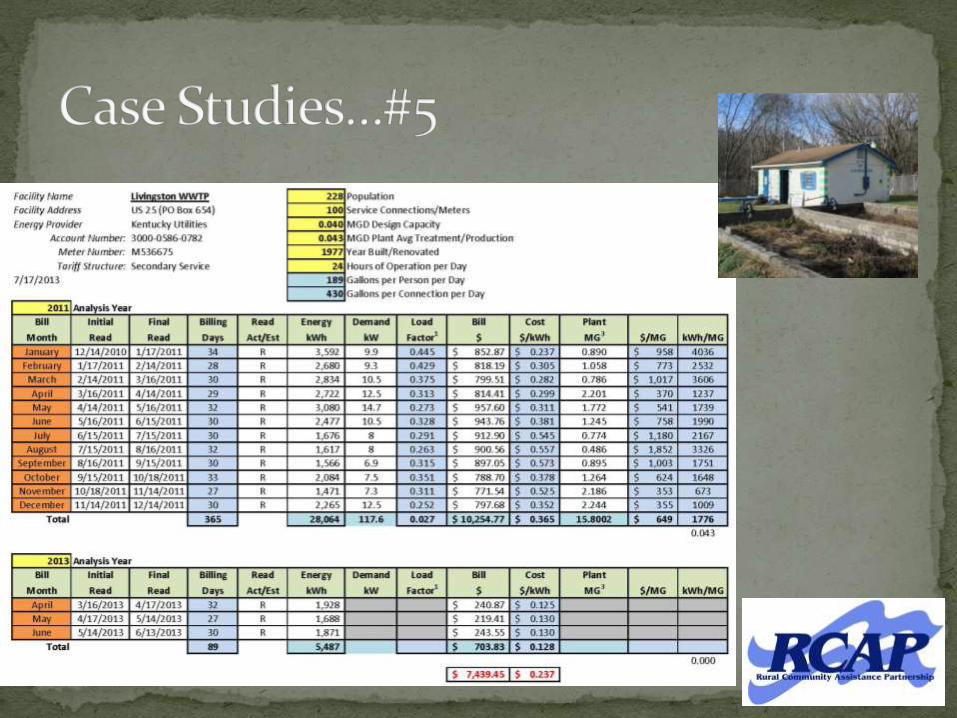
Askin’ WWTP Village Population 228
Facility Constructed 1977
Production (MGD): 0.40 Design, 0.39 Actual
Annual Energy Use = 28,064 kWh / yr
Annual Energy Cost = $ 10,255 / yr
Average Energy Cost = $ 0.37 / kWh
Energy Use = 1,776 kWh / MG
Treatment Cost = $ 649 / MG
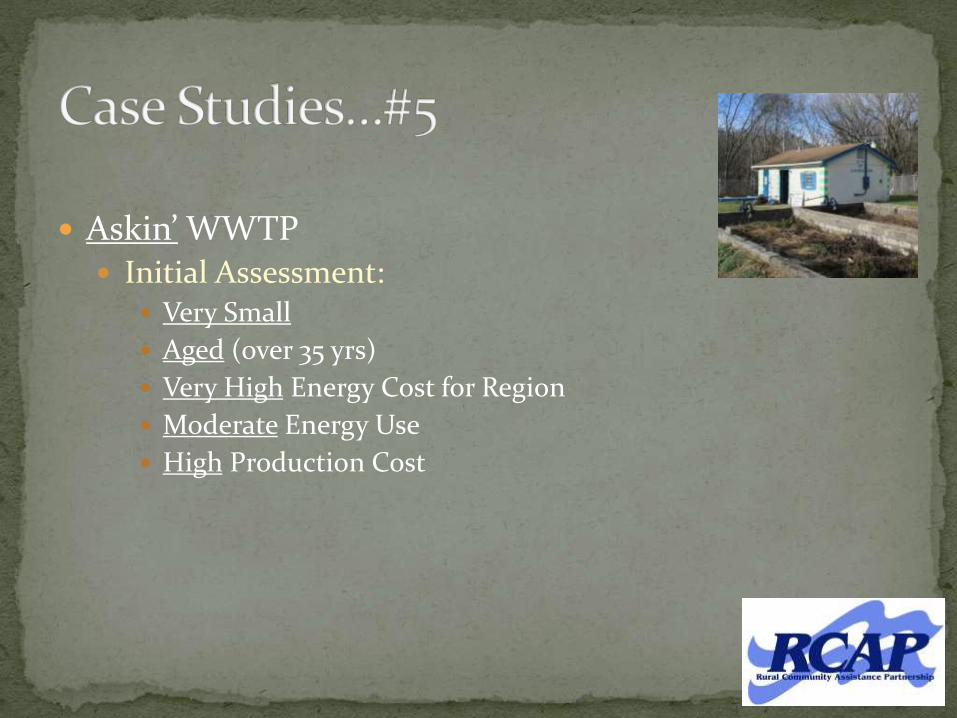
Askin’ WWTP Initial Assessment:
Very Small
Aged (over 35 yrs)
Very High Energy Cost for Region
Moderate Energy Use
High Production Cost

Askin’ WWTP Focused Analysis – Operations
Equipment Age
Throttled Aeration Valves
Effluent Discharge Limits
Main Opportunity Energy Rates

Askin’ WWTP Energy Conservation Opportunities
Annual Energy Use = 18,747 kWh / yr
A 13,219 kWh Savings (41%)
Annual Energy Cost = $ 6,257 / yr
A $4,756 /yr Savings (43%)
Energy Use = 1,194 kWh / MG
Treatment Cost = $ 398 / MG
Cost of Opportunities = $1,913
0.4 year Simple Payback

Askin’ WWTP Energy Conservation Opportunities
Call to Kentucky Utilities
Incorrect Billing Structure
60-70% Cost Savings Immediate!
Will Change Savings From Previous Slide…


Large Percentage of Operational Savings Versus Equipment Costs
Typically Low/No Cost with Operations
Build Comparable Database for Small Systems Initial Assessments
Recommendations for Opportunities
Create Continuity of Process
Improve Overall Utility Operations
Document Performance

Grant Efforts
Direct Contracting
Workshops
Trainings
Average 25% Savings Energy and Costs
Less than 1-Year Simple Payback

Thank you for your interest!RCAP National Initiative
Ohio RCAP Initiative
Contact:Scott Strahley, PE, CEA219 S. Front StreetPO Box 590Fremont, Ohio 43420Ph: [email protected]