
June 2014 Technical Market Outlook - The Technical … 2014 Technical Market Outlook Peter Lee –...
30
June 2014 Technical Market Outlook Peter Lee – Chief Technical Strategist CIO Wealth Management Research This report has been prepared by UBS Financial Services Inc. (“UBS FS”). All charts and data are sourced from Thomson Reuters, Bloomberg, Indexindicators.com and UBS CIO WMR as of 13 June 2014 16 June 2014
Transcript of June 2014 Technical Market Outlook - The Technical … 2014 Technical Market Outlook Peter Lee –...

June 2014 Technical Market Outlook
Peter Lee – Chief Technical Strategist CIO Wealth Management Research
This report has been prepared by UBS Financial Services Inc. (“UBS FS”). All charts and data are sourced from Thomson Reuters, Bloomberg, Indexindicators.com and UBS CIO WMR as of 13 June 2014
16 June 2014
1
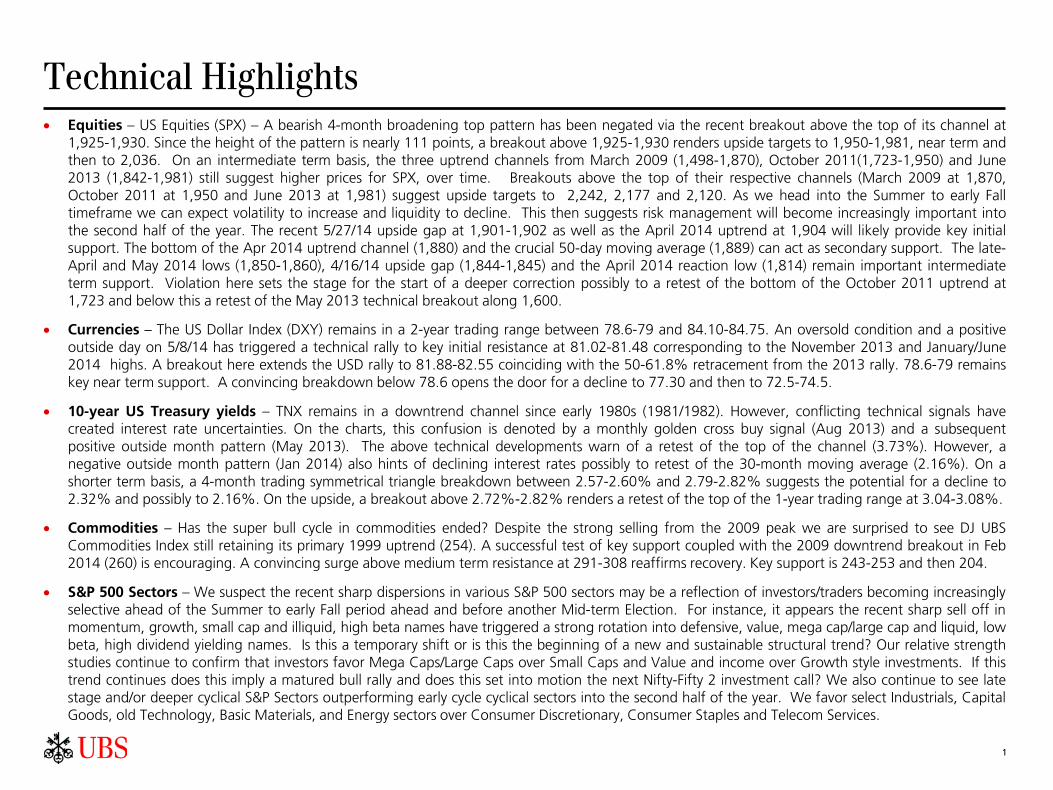
Technical Highlights • Equities – US Equities (SPX) – A bearish 4-month broadening top pattern has been negated via the recent breakout above the top of its channel at
1,925-1,930. Since the height of the pattern is nearly 111 points, a breakout above 1,925-1,930 renders upside targets to 1,950-1,981, near term and then to 2,036. On an intermediate term basis, the three uptrend channels from March 2009 (1,498-1,870), October 2011(1,723-1,950) and June 2013 (1,842-1,981) still suggest higher prices for SPX, over time. Breakouts above the top of their respective channels (March 2009 at 1,870, October 2011 at 1,950 and June 2013 at 1,981) suggest upside targets to 2,242, 2,177 and 2,120. As we head into the Summer to early Fall timeframe we can expect volatility to increase and liquidity to decline. This then suggests risk management will become increasingly important into the second half of the year. The recent 5/27/14 upside gap at 1,901-1,902 as well as the April 2014 uptrend at 1,904 will likely provide key initial support. The bottom of the Apr 2014 uptrend channel (1,880) and the crucial 50-day moving average (1,889) can act as secondary support. The late-April and May 2014 lows (1,850-1,860), 4/16/14 upside gap (1,844-1,845) and the April 2014 reaction low (1,814) remain important intermediate term support. Violation here sets the stage for the start of a deeper correction possibly to a retest of the bottom of the October 2011 uptrend at 1,723 and below this a retest of the May 2013 technical breakout along 1,600.
• Currencies – The US Dollar Index (DXY) remains in a 2-year trading range between 78.6-79 and 84.10-84.75. An oversold condition and a positive outside day on 5/8/14 has triggered a technical rally to key initial resistance at 81.02-81.48 corresponding to the November 2013 and January/June 2014 highs. A breakout here extends the USD rally to 81.88-82.55 coinciding with the 50-61.8% retracement from the 2013 rally. 78.6-79 remains key near term support. A convincing breakdown below 78.6 opens the door for a decline to 77.30 and then to 72.5-74.5.
• 10-year US Treasury yields – TNX remains in a downtrend channel since early 1980s (1981/1982). However, conflicting technical signals have created interest rate uncertainties. On the charts, this confusion is denoted by a monthly golden cross buy signal (Aug 2013) and a subsequent positive outside month pattern (May 2013). The above technical developments warn of a retest of the top of the channel (3.73%). However, a negative outside month pattern (Jan 2014) also hints of declining interest rates possibly to retest of the 30-month moving average (2.16%). On a shorter term basis, a 4-month trading symmetrical triangle breakdown between 2.57-2.60% and 2.79-2.82% suggests the potential for a decline to 2.32% and possibly to 2.16%. On the upside, a breakout above 2.72%-2.82% renders a retest of the top of the 1-year trading range at 3.04-3.08%.
• Commodities – Has the super bull cycle in commodities ended? Despite the strong selling from the 2009 peak we are surprised to see DJ UBS Commodities Index still retaining its primary 1999 uptrend (254). A successful test of key support coupled with the 2009 downtrend breakout in Feb 2014 (260) is encouraging. A convincing surge above medium term resistance at 291-308 reaffirms recovery. Key support is 243-253 and then 204.
• S&P 500 Sectors – We suspect the recent sharp dispersions in various S&P 500 sectors may be a reflection of investors/traders becoming increasingly selective ahead of the Summer to early Fall period ahead and before another Mid-term Election. For instance, it appears the recent sharp sell off in momentum, growth, small cap and illiquid, high beta names have triggered a strong rotation into defensive, value, mega cap/large cap and liquid, low beta, high dividend yielding names. Is this a temporary shift or is this the beginning of a new and sustainable structural trend? Our relative strength studies continue to confirm that investors favor Mega Caps/Large Caps over Small Caps and Value and income over Growth style investments. If this trend continues does this imply a matured bull rally and does this set into motion the next Nifty-Fifty 2 investment call? We also continue to see late stage and/or deeper cyclical S&P Sectors outperforming early cycle cyclical sectors into the second half of the year. We favor select Industrials, Capital Goods, old Technology, Basic Materials, and Energy sectors over Consumer Discretionary, Consumer Staples and Telecom Services.

2
S&P 500 Index (SPX) Technical Forecasts • Wall Street S&P 500 Index - 2014 Year-End Forecasts
13 Sell Side Equity Strategists made Year-End 2014 forecasts. The average SPX forecast was 1,956.
Barron's Round Table also made Year-End 2014 projections. The mean SPX projection was 1,977.
Since the Mar 2009 capitulation sell off overshot to the downside (666.79) will SPX now overshoot to the upside (2,000-plus)?
• Technical Targets for SPX 1,950-1,981/2,036 (near-term), 2,120-2,242 (intermediate) and 2,509 (long term)
Near term outlook – Over the past 3 months a bearish Broadening Top pattern has developed between 1,814 and 1,925-1,930 or 111 points. The ability to convincingly breakout above 1,925-1,930 negates a potential top and suggests SPX targets to 1,950-1,981 (short term) and then to 2,036 (projected target).
Medium term outlook – The prevailing trend remains the June 2013 uptrend channel. The bottom of channel is at 1,842 (key near term support) and the top of the channel is at 1,981 (key near term resistance). Since the height of this channel is 139 points a breakout above 1,981 renders an upside target to 2,120 (intermediate-term). The two other uptrend channels namely the March 2009 channel (1,498-1,870 or 372 points) and October 2011 (1,723-1,950 or 227 points) also renders upside targets to 2,242 and 2,177, respectively.
Longer term outlook – The Broadening Top/Head and the Head and Shoulders Bottom patterns from the late 1990s (1998) remain the structural trends. The May 2013 breakout above 1,600 may have confirm a new long term trend. If this prior breakout is confirmed via a successful pullback this suggests a technical base of nearly 909 points and upside projection to as high as 2,509, over time.
Key downside risks for SPX – Important near term support is visible near 1,900-1,930 or the recent 5/27/14 gap up and April 2014 uptrend. Secondary support is also evident along the 1,814-1,845 or the April 2014 bottom, the June 2013 uptrend and the 150-day moving average. Pivotal medium term support resides along 1,600-1,723 corresponding to the crucial May 2013 breakout and the October 2011 uptrend. Intermediate term support remains at 1,487-1,498 coinciding with the bottom of the March 2009 uptrend.
• March 2000 structural trend and the March 2009 cyclical bull trend will likely end in the next 6-months to 2-years
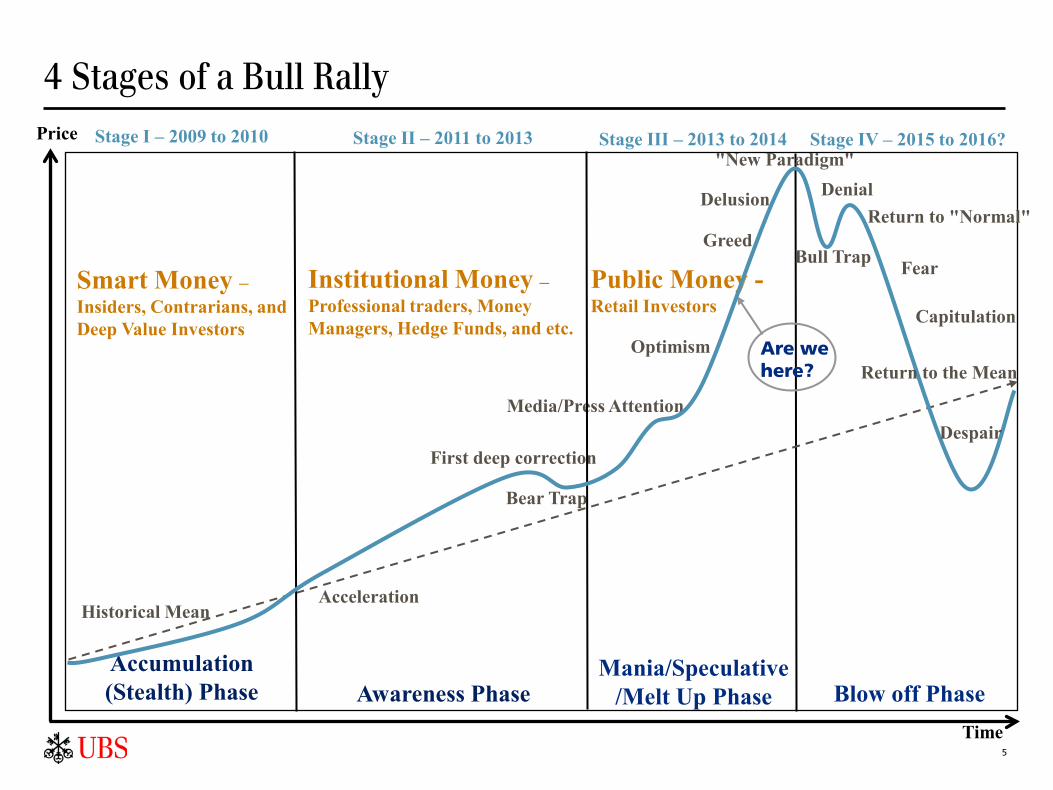
The March 2009 has entered into the third stage of a four-stage bull market rally or commonly referred as the Mania/Spec/Melt up phase. This is the emotional part of the bull rally where the investment public (retail investors) are often very active. We also believe the March 2000 structural trend is also entering into its late stage. Both trends will likely end within the next 6-months to 2-years. The May 2013 SPX break out at 1,600 is technically significant as it marks the start of the third phase of the March 2009 bull but more important can set the stage for the next structural bull trend. However, we await a subsequent pullback/correction to confirm that this indeed a major breakout and not a false breakout or bull trap. In the mean time we continue to see two possible scenarios for SPX over the next few years:
Scenario 1 (Bullish outlook) – The May 2013 break out above 1,600 hints of the next major structural bull trend. However, a pullback to or near this prior breakout is probably necessary to confirm this multi-year (14-plus year) technical base. A Mid-term Election Year correction (10%-20%) can set the stage for the next cyclical bull rally (1-3 years) that eventually transitions into the next structural bull trend (8-20 years).
Scenario 2 (Bearish outlook) – The May 2013 break out at 1,600 is a false breakout or a bull trap as SPX fails to maintain this pivotal breakout. Instead, this triggers a major sell-off (20% to 30%-plus) and in the process SPX violates its March 2009 uptrend (1,498). This action triggers a climatic sell off as SPX falls to 1,100-1,200 thereby washing out the market and resetting the market for the next structural bull trend.
3
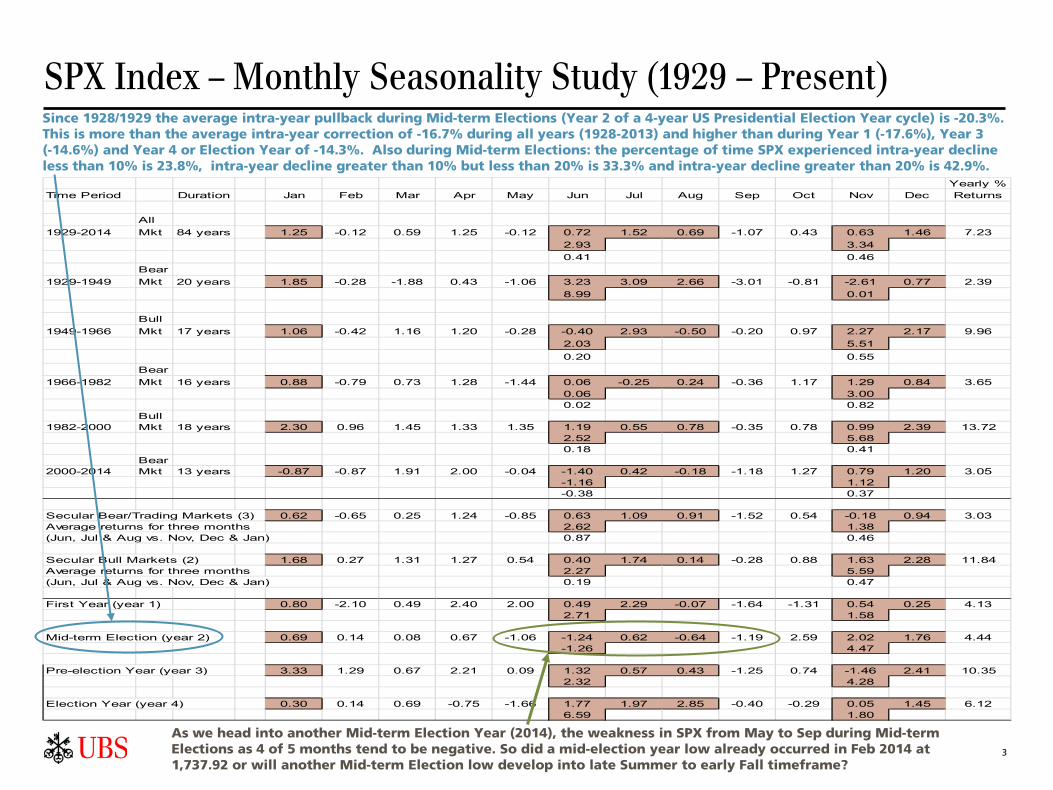
SPX Index – Monthly Seasonality Study (1929 – Present)
As we head into another Mid-term Election Year (2014), the weakness in SPX from May to Sep during Mid-term Elections as 4 of 5 months tend to be negative. So did a mid-election year low already occurred in Feb 2014 at 1,737.92 or will another Mid-term Election low develop into late Summer to early Fall timeframe?
Since 1928/1929 the average intra-year pullback during Mid-term Elections (Year 2 of a 4-year US Presidential Election Year cycle) is -20.3%. This is more than the average intra-year correction of -16.7% during all years (1928-2013) and higher than during Year 1 (-17.6%), Year 3 (-14.6%) and Year 4 or Election Year of -14.3%. Also during Mid-term Elections: the percentage of time SPX experienced intra-year decline less than 10% is 23.8%, intra-year decline greater than 10% but less than 20% is 33.3% and intra-year decline greater than 20% is 42.9%.
Yearly %Time Period Duration Jan Feb Mar Apr May Jun Jul Aug Sep Oct Nov Dec Returns
All1929-2014 Mkt 84 years 1.25 -0.12 0.59 1.25 -0.12 0.72 1.52 0.69 -1.07 0.43 0.63 1.46 7.23
2.93 3.340.41 0.46
Bear1929-1949 Mkt 20 years 1.85 -0.28 -1.88 0.43 -1.06 3.23 3.09 2.66 -3.01 -0.81 -2.61 0.77 2.39
8.99 0.01
Bull1949-1966 Mkt 17 years 1.06 -0.42 1.16 1.20 -0.28 -0.40 2.93 -0.50 -0.20 0.97 2.27 2.17 9.96
2.03 5.51 0.20 0.55
Bear1966-1982 Mkt 16 years 0.88 -0.79 0.73 1.28 -1.44 0.06 -0.25 0.24 -0.36 1.17 1.29 0.84 3.65
0.06 3.000.02 0.82
Bull1982-2000 Mkt 18 years 2.30 0.96 1.45 1.33 1.35 1.19 0.55 0.78 -0.35 0.78 0.99 2.39 13.72
2.52 5.680.18 0.41
Bear2000-2014 Mkt 13 years -0.87 -0.87 1.91 2.00 -0.04 -1.40 0.42 -0.18 -1.18 1.27 0.79 1.20 3.05
-1.16 1.12-0.38 0.37
Secular Bear/Trading Markets (3) 0.62 -0.65 0.25 1.24 -0.85 0.63 1.09 0.91 -1.52 0.54 -0.18 0.94 3.03Average returns for three months 2.62 1.38(Jun, Jul & Aug vs. Nov, Dec & Jan) 0.87 0.46
Secular Bull Markets (2) 1.68 0.27 1.31 1.27 0.54 0.40 1.74 0.14 -0.28 0.88 1.63 2.28 11.84Average returns for three months 2.27 5.59(Jun, Jul & Aug vs. Nov, Dec & Jan) 0.19 0.47
First Year (year 1) 0.80 -2.10 0.49 2.40 2.00 0.49 2.29 -0.07 -1.64 -1.31 0.54 0.25 4.132.71 1.58
Mid-term Election (year 2) 0.69 0.14 0.08 0.67 -1.06 -1.24 0.62 -0.64 -1.19 2.59 2.02 1.76 4.44-1.26 4.47
Pre-election Year (year 3) 3.33 1.29 0.67 2.21 0.09 1.32 0.57 0.43 -1.25 0.74 -1.46 2.41 10.352.32 4.28
Election Year (year 4) 0.30 0.14 0.69 -0.75 -1.66 1.77 1.97 2.85 -0.40 -0.29 0.05 1.45 6.126.59 1.80

4
Stock Market Psychology – Fear, Greed, and Hope
Optimism
Excitement
Thrill
Greed/Euphoria – 1st Half 2007
Anxiety
Denial
Fear – 1st Half 2008
Desperation
Panic
Capitulation
Despondency – 4th Qtr 2008
Depression – 1st Qtr 2009
Hope
Relief
Optimism – 1st Qtr 2012
Are we here?
Greed/Euphoria – 2014
Excitement
Thrill
2nd Half 2015
1st Half 2015
2016/early 2017
5
4 Stages of a Bull Rally
Accumulation (Stealth) Phase Awareness Phase
Mania/Speculative/Melt Up Phase
Smart Money – Insiders, Contrarians, and Deep Value Investors
Blow off Phase
Time
Stage I – 2009 to 2010
First deep correction
Price
Delusion
Bear Trap
Media/Press Attention
Are we here?
"New Paradigm"
Optimism
Greed
Stage II – 2011 to 2013
Institutional Money – Professional traders, Money Managers, Hedge Funds, and etc.
Public Money - Retail Investors
Return to "Normal"
Denial
Bull Trap Fear
Despair
Capitulation
Historical Mean
Return to the Mean
Acceleration
Stage III – 2013 to 2014 Stage IV – 2015 to 2016?
6
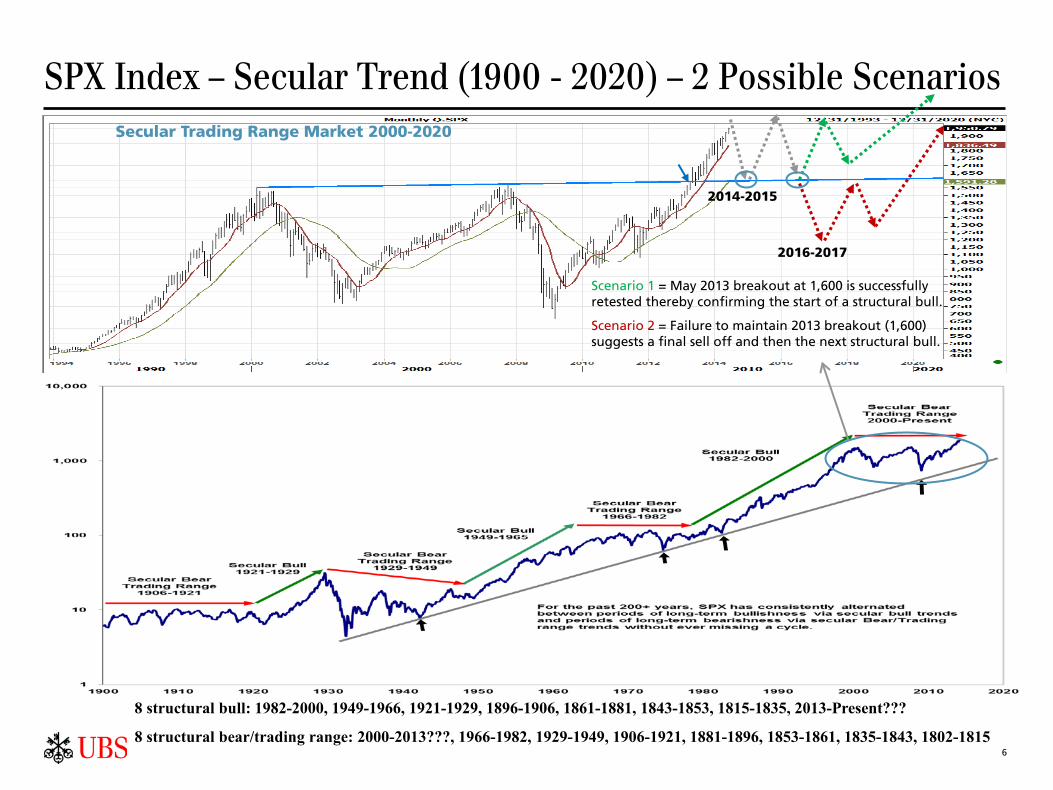
SPX Index – Secular Trend (1900 - 2020) – 2 Possible Scenarios
8 structural bull: 1982-2000, 1949-1966, 1921-1929, 1896-1906, 1861-1881, 1843-1853, 1815-1835, 2013-Present???
8 structural bear/trading range: 2000-2013???, 1966-1982, 1929-1949, 1906-1921, 1881-1896, 1853-1861, 1835-1843, 1802-1815
2014-2015
2016-2017
Secular Trading Range Market 2000-2020
Scenario 1 = May 2013 breakout at 1,600 is successfully retested thereby confirming the start of a structural bull.
Scenario 2 = Failure to maintain 2013 breakout (1,600) suggests a final sell off and then the next structural bull.
7
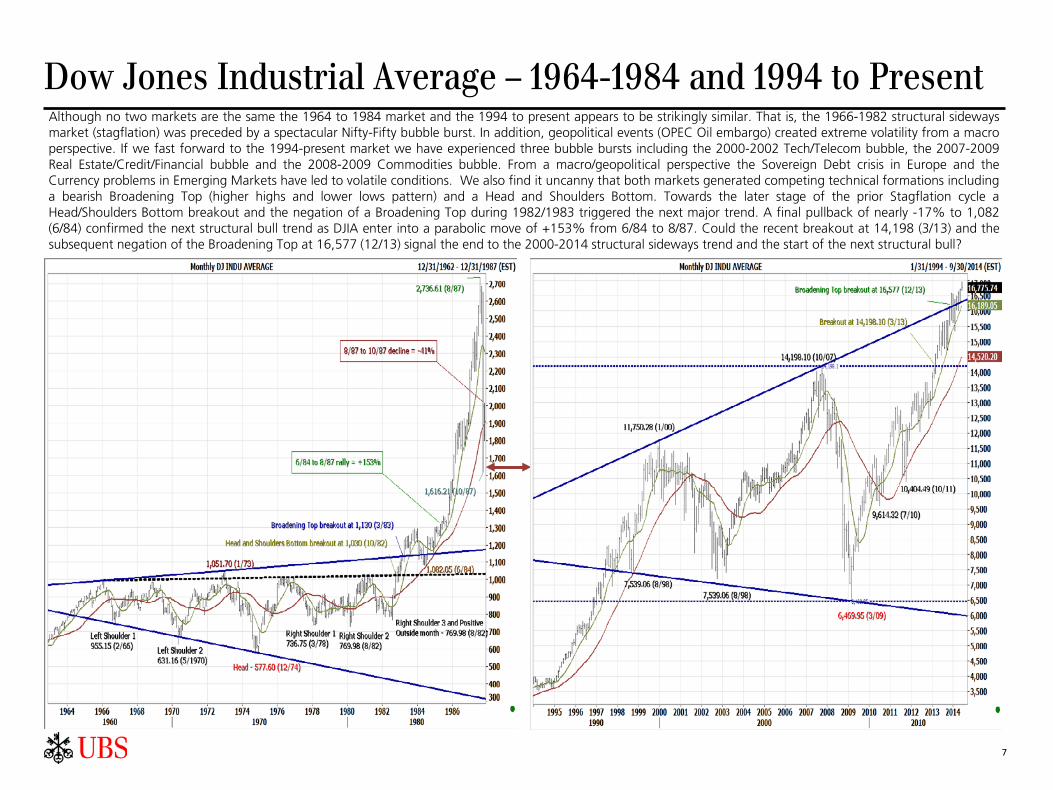
Dow Jones Industrial Average – 1964-1984 and 1994 to Present Although no two markets are the same the 1964 to 1984 market and the 1994 to present appears to be strikingly similar. That is, the 1966-1982 structural sideways market (stagflation) was preceded by a spectacular Nifty-Fifty bubble burst. In addition, geopolitical events (OPEC Oil embargo) created extreme volatility from a macro perspective. If we fast forward to the 1994-present market we have experienced three bubble bursts including the 2000-2002 Tech/Telecom bubble, the 2007-2009 Real Estate/Credit/Financial bubble and the 2008-2009 Commodities bubble. From a macro/geopolitical perspective the Sovereign Debt crisis in Europe and the Currency problems in Emerging Markets have led to volatile conditions. We also find it uncanny that both markets generated competing technical formations including a bearish Broadening Top (higher highs and lower lows pattern) and a Head and Shoulders Bottom. Towards the later stage of the prior Stagflation cycle a Head/Shoulders Bottom breakout and the negation of a Broadening Top during 1982/1983 triggered the next major trend. A final pullback of nearly -17% to 1,082 (6/84) confirmed the next structural bull trend as DJIA enter into a parabolic move of +153% from 6/84 to 8/87. Could the recent breakout at 14,198 (3/13) and the subsequent negation of the Broadening Top at 16,577 (12/13) signal the end to the 2000-2014 structural sideways trend and the start of the next structural bull?

8
S&P 500 Index – 1964-1984 and 1994 to Present Similar to the DJIA study in the previous page we find it intriguing that the current market conditions over the past decade or so closely parallels that of the 1964-1982 market, at least from a macro/geopolitical/tail risk as well as technical perspective. Although it may appear that the past 14-plus years have been much more volatile and unpredictable than the prior 1966-1982 secular trading range market the duration and magnitude of trading swings are comparable. That is, in the past market it required over 16-plus years to repair the damages incurred from the Nifty-Fifty blowup, Oil Embargo and Stagflation before a new structural bull market can begin in earnest in 1982. Today, the SPX is working through nearly 14-plus years of the unwinding of the speculative excesses from credit/financial/real estate bubbles as well as ongoing geopolitical/macro conditions in Europe and Emerging Markets. Notice that at the height of the prior Broadening Top pattern widespread speculation led to a an extreme high of 147 from an extreme low of 45 resulting in a 3.22/1 ratio. Last year as SPX traded to an extreme high of 1,600 from a low of 667 a ratio of 2.4/1 was recorded. This then suggests SPX can rally for a while longer before reaching extreme levels. Nonetheless, in the past cycle the major breakout off of a multi-year technical pattern had to retrace back to prior breakout to confirm bullish pattern. For example, in Jan 1983 SPX broke out at 146. This led to a nice rally towards 172.76 in Jun 1983 before a correction of -14.76% to its prior breakout at 147 in Jul 1984. A successful test confirmed the prior breakout setting into motion the next structural bull trend (1982-2000). Looking at today's market, will SPX also pullback to its May 2013 breakout near 1,600 before transitioning to the next structural bull?

9
SPX Index – Long-, Medium- and Short-term Trends
The primary trend remains the Mar 2009 uptrend channel between 1,498 and 1,870. The height of the channel is 372 points. A breakout above 1,870 suggests upside to 2,242. A second uptrend from Oct 2011 is between 1,723 and 1,950. Breakout above 1,950 projects upside to 2,177. Medium term support are: 10-wk and 30-wk ma at 1,889/1,849.
The Mar 2009 SPX rally is over 5 years old, with gains of 193.3%. The prior two bull rallies were: 1994-2000 (5 years & 11 months and 248%) and 2002-2007 (5 years and 105%). SPX rally can sustain as long as it retains the following key supports: 1,814-1,835 (10-mo ma & Feb low), 1,590-1,600 (30-mo ma/2013 breakout), and 1,487 (2009 uptrend).
A third uptrend channel has developed from the Jun 2013 low (1,842 and 1,981). A breakout above 1,981 suggests +139 points or an upside target to 2,120. Initial support is now evident near 1,930 and near 1,902-1,904. Violation here opens the door for a decline to the bottom of the 1-year uptrend channel at 1,842 and the 150-day ma at 1,845. Violation here warns of a deeper correction to 1,814 and below this 1,703-1,761.
A bearish 4-mo broadening top pattern has been negated via recent breakout above the top of its channel at 1,925-1,930. Since the height of the pattern is 111 points, a breakout above 1,925 renders an upside target to 2,036. 1,925-1,930 is trading support. The 5/27/14 upside gap at 1,901-1,902 and the Apr uptrend at 1,904 provide key initial support. The bottom of the Apr 2014 uptrend channel (1,880) and the 50-day ma (1,889) offer secondary support. Late-Apr/May lows (1,850-1,860), 4/16/14 upside gap (1,844-1,845) and specifically Apr low (1,814) are medium term support.
Breakdown below 1,498 1,126 Break down below 1,701 1,496
2 Uptrend Channels:
Mar 2009 uptrend channel = 1,498-1,870 Breakout above 1,855 +372 or 2,242 Oct 2011 uptrend channel = 1,723-1,950 Breakout above 1,950 +227 or 2,177
Jun 2013 uptrend channel = 1,842-1,981 (139 points)
Breakout above 1,981 2,120
Breakdown below 1,842 1,703
Mar 2014 broadening top = 1,814-1,925 (111 points)
Breakout above 1,925-1,930 2,036
Breakdown below 1,814 1,761-1,776

10
US Equities – SPX, Russell 3000, Russell 1000 and NDX 100
The Russell 3000 Index (RUA) broke out above 965 in May 2013. This can extend the rally to the top of its 2009 rising wedge (1,196). Since RUA is one of the broadest US major indexes it may be a good barometer and a leading indicator of the overall US markets. Key supports: 1,085-1,100, 1,024-1,043, 1,006, 965, 948, 904, and 858.
SPX Index has broken out above the extension of the 2000/2007 channel at 1,600 (May 2013) thereby negating a broadening top pattern. This major breakout suggests 909.30 points or upside to 2,509, longer term. Key supports: 1,814-1,835, 1,738, 1,600-1,650, 1,553-1,576, and 1,487-1,499.
The Russell 1000 Index, which is a proxy for the large-cap/mega-cap US stocks, has also broken out in May 2013 above key resistance at 887. This breakout suggests a test of 1,171, or the top of its 2009 rising wedge pattern. Key supports: 1,012-1,024, 971, 883-887, 859 and 827.
The NASDAQ 100 or the large cap OTC market has cleared above the top of its 2002 uptrend channel (2,922) as well as above its 50-61.8% retracement (2,806-3,280) from the 2000–2002 decline. A positive outside month (Feb 2014) suggest a retest of the 76.4% retracement at 3,867 (near term), a channel breakout projection to 4,240 (intermediate) and the Mar 2000 record high at 4,816 (long term). Key supports: 3,558, 3,419, 3,254-3,318, 3,218, and then 2,922-3,024.
11
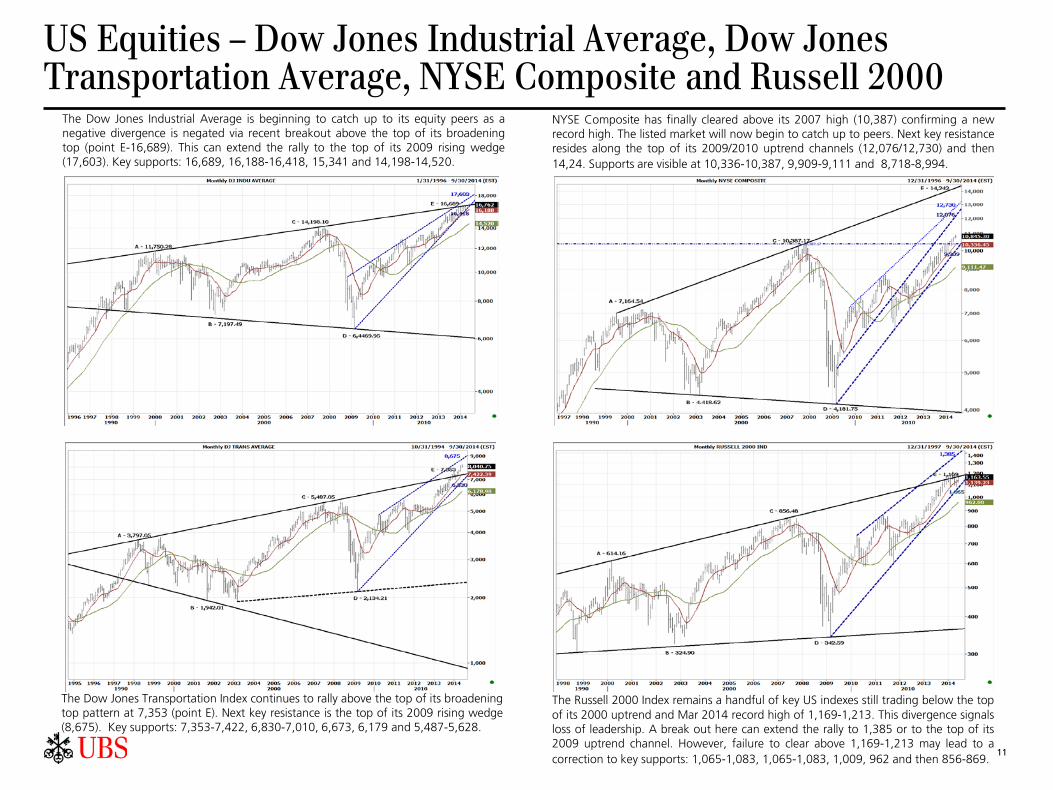
US Equities – Dow Jones Industrial Average, Dow Jones Transportation Average, NYSE Composite and Russell 2000
The Dow Jones Transportation Index continues to rally above the top of its broadening top pattern at 7,353 (point E). Next key resistance is the top of its 2009 rising wedge (8,675). Key supports: 7,353-7,422, 6,830-7,010, 6,673, 6,179 and 5,487-5,628.
The Dow Jones Industrial Average is beginning to catch up to its equity peers as a negative divergence is negated via recent breakout above the top of its broadening top (point E-16,689). This can extend the rally to the top of its 2009 rising wedge (17,603). Key supports: 16,689, 16,188-16,418, 15,341 and 14,198-14,520.
NYSE Composite has finally cleared above its 2007 high (10,387) confirming a new record high. The listed market will now begin to catch up to peers. Next key resistance resides along the top of its 2009/2010 uptrend channels (12,076/12,730) and then 14,24. Supports are visible at 10,336-10,387, 9,909-9,111 and 8,718-8,994.
The Russell 2000 Index remains a handful of key US indexes still trading below the top of its 2000 uptrend and Mar 2014 record high of 1,169-1,213. This divergence signals loss of leadership. A break out here can extend the rally to 1,385 or to the top of its 2009 uptrend channel. However, failure to clear above 1,169-1,213 may lead to a correction to key supports: 1,065-1,083, 1,065-1,083, 1,009, 962 and then 856-869.

12
International Equities–Nikkei 225, EAFE, EM & Shanghai SSE
The MSCI EAFE has confirmed a major breakout above key resistance at 1,826/1900 or its 2011 high, 61.8% retracement from 2007–2009 decline and the third downtrend. This solidifies a Fan pattern and negates a head-and-shoulders top. Key resistances: 2,045/2,399. Supports: 1,950/1,900/1,850-1,875/1,789-1,814/1,700/1,550-1,600.
Nikkei 225 Index traded slightly above its 1996 downtrend (15,734) and May 2013 high (15,943) during Dec 2013. However, an overbought condition prevented a follow through to a major breakout. A recent pullback to 13,885 (Apr 2014) sets the stage for a flag/pennant pattern. A breakout above 15,943-16,320 renders upside targets to 18,300 or 2007 high and then to 19,207 or the 38.2% retracement from 1989-2008 decline. Key supports are: 14,500-14,750/13,885-14,100/13,750/13,188/12,416.
After languishing for 5 years, MSCI Emerging Markets is improving as evident by the May 2014 breakout above its 2011 downtrend (1,018). This breakout suggests a retest of major resistance at 1,085-1,092 or the 2012/2013 highs and the pivotal 2007 downtrend. Surpassing this supply confirms a triangle breakout and signals the start of a sustainable rally to 1,212-1,25 (medium term) and then to the 2007 record high of 1,345 (long term). Key supports: 990-1,000, 900-930 and then 860-886.
The Shanghai Composite SSE Index remains in a 4-plus year downtrend channel between 1,538 and 2,355 and continues to lag equity peers. The declining 10-mo/30-mo moving averages at 2,089/2,165 provide key initial resistances. A breakout here helps to alleviate the selling pressure and allow for a test of the Feb 2013 high and top of channel at 2,355-2,445. Clearing this key medium term resistance confirms the start of a sustainable recovery to 2,717, 2,960 and then 3,368. Supports are:1,986-1,991/1,946/1,850/1,600-1,665/1,538-1,558.
A potential Flag/pennant formation is technically constructive. A breakout above 15,943-16,320 confirms the start of major trend reversal for Nikkei 225 Index.
A recent Fan pattern breakout at 1,900 suggests a retest of the all time 2007 highs at 2,399.
Breakout of the first of two major triangle patterns hints of a recovery for MSCI Emerging Markets.
Shanghai Composite remains in a well defined 4-plus year downtrend channel.
13
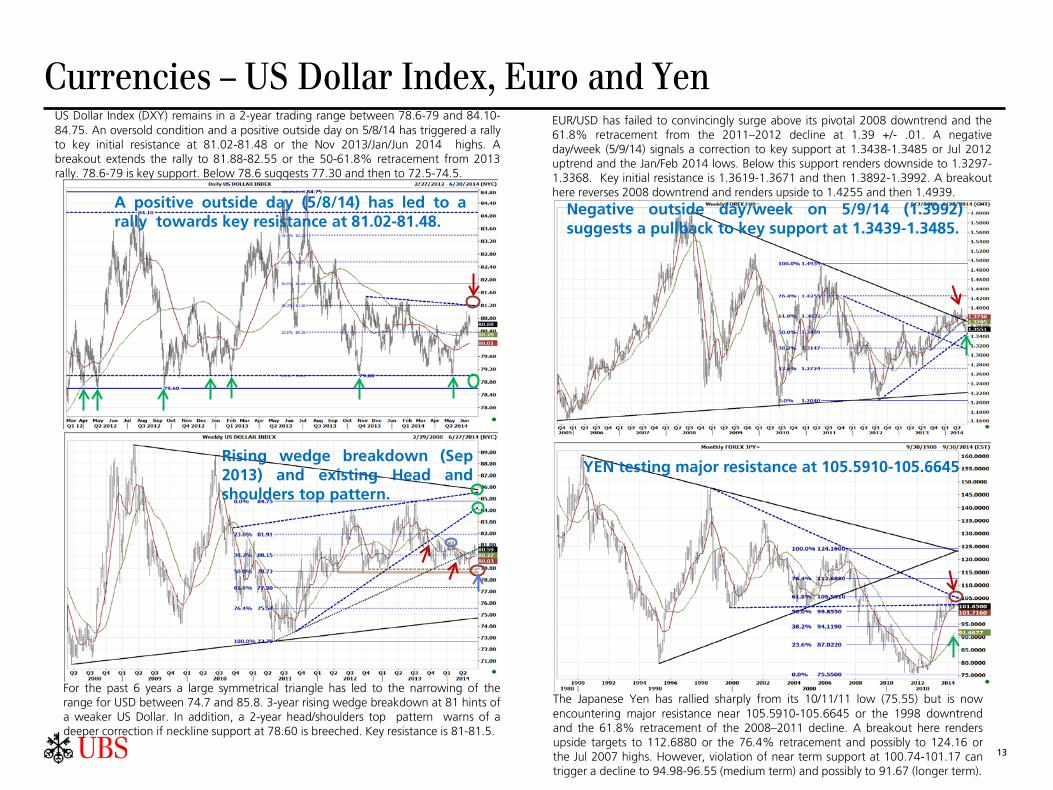
Currencies – US Dollar Index, Euro and Yen
For the past 6 years a large symmetrical triangle has led to the narrowing of the range for USD between 74.7 and 85.8. 3-year rising wedge breakdown at 81 hints of a weaker US Dollar. In addition, a 2-year head/shoulders top pattern warns of a deeper correction if neckline support at 78.60 is breeched. Key resistance is 81-81.5.
US Dollar Index (DXY) remains in a 2-year trading range between 78.6-79 and 84.10-84.75. An oversold condition and a positive outside day on 5/8/14 has triggered a rally to key initial resistance at 81.02-81.48 or the Nov 2013/Jan/Jun 2014 highs. A breakout extends the rally to 81.88-82.55 or the 50-61.8% retracement from 2013 rally. 78.6-79 is key support. Below 78.6 suggests 77.30 and then to 72.5-74.5.
EUR/USD has failed to convincingly surge above its pivotal 2008 downtrend and the 61.8% retracement from the 2011–2012 decline at 1.39 +/- .01. A negative day/week (5/9/14) signals a correction to key support at 1.3438-1.3485 or Jul 2012 uptrend and the Jan/Feb 2014 lows. Below this support renders downside to 1.3297-1.3368. Key initial resistance is 1.3619-1.3671 and then 1.3892-1.3992. A breakout here reverses 2008 downtrend and renders upside to 1.4255 and then 1.4939.
The Japanese Yen has rallied sharply from its 10/11/11 low (75.55) but is now encountering major resistance near 105.5910-105.6645 or the 1998 downtrend and the 61.8% retracement of the 2008–2011 decline. A breakout here renders upside targets to 112.6880 or the 76.4% retracement and possibly to 124.16 or the Jul 2007 highs. However, violation of near term support at 100.74-101.17 can trigger a decline to 94.98-96.55 (medium term) and possibly to 91.67 (longer term).
Negative outside day/week on 5/9/14 (1.3992) suggests a pullback to key support at 1.3439-1.3485.
YEN testing major resistance at 105.5910-105.6645 Rising wedge breakdown (Sep 2013) and existing Head and shoulders top pattern.
A positive outside day (5/8/14) has led to a rally towards key resistance at 81.02-81.48.
14
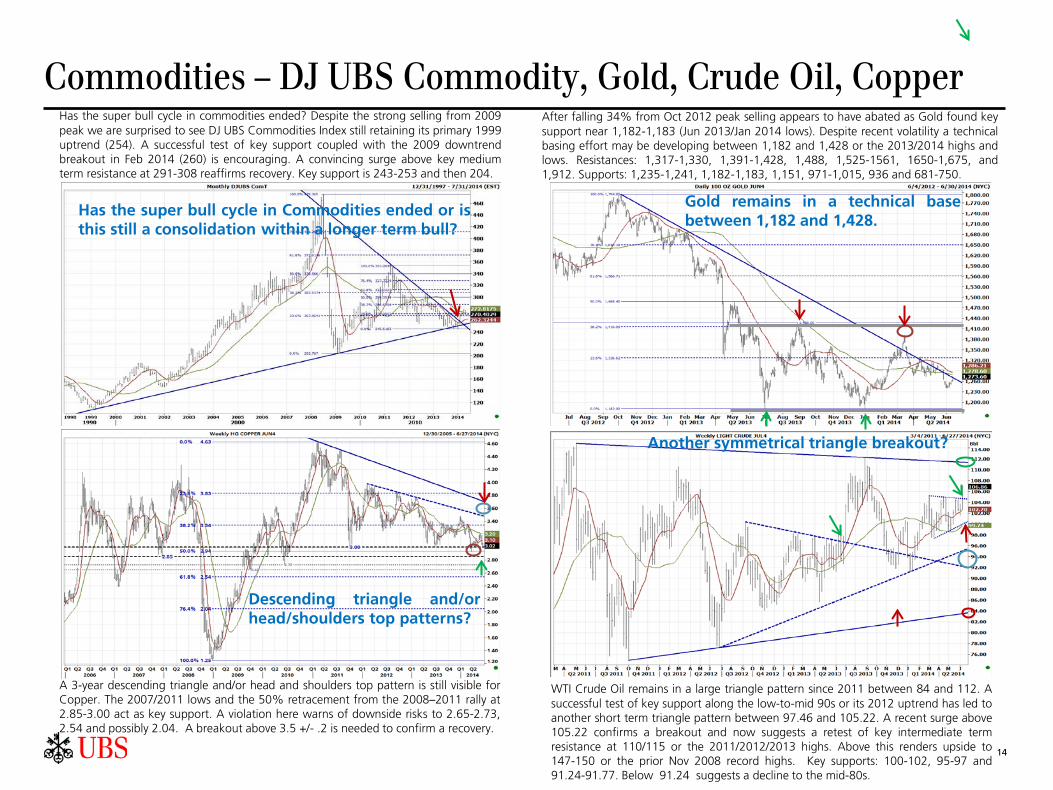
Commodities – DJ UBS Commodity, Gold, Crude Oil, Copper
A 3-year descending triangle and/or head and shoulders top pattern is still visible for Copper. The 2007/2011 lows and the 50% retracement from the 2008–2011 rally at 2.85-3.00 act as key support. A violation here warns of downside risks to 2.65-2.73, 2.54 and possibly 2.04. A breakout above 3.5 +/- .2 is needed to confirm a recovery.
Has the super bull cycle in commodities ended? Despite the strong selling from 2009 peak we are surprised to see DJ UBS Commodities Index still retaining its primary 1999 uptrend (254). A successful test of key support coupled with the 2009 downtrend breakout in Feb 2014 (260) is encouraging. A convincing surge above key medium term resistance at 291-308 reaffirms recovery. Key support is 243-253 and then 204.
After falling 34% from Oct 2012 peak selling appears to have abated as Gold found key support near 1,182-1,183 (Jun 2013/Jan 2014 lows). Despite recent volatility a technical basing effort may be developing between 1,182 and 1,428 or the 2013/2014 highs and lows. Resistances: 1,317-1,330, 1,391-1,428, 1,488, 1,525-1561, 1650-1,675, and 1,912. Supports: 1,235-1,241, 1,182-1,183, 1,151, 971-1,015, 936 and 681-750.
WTI Crude Oil remains in a large triangle pattern since 2011 between 84 and 112. A successful test of key support along the low-to-mid 90s or its 2012 uptrend has led to another short term triangle pattern between 97.46 and 105.22. A recent surge above 105.22 confirms a breakout and now suggests a retest of key intermediate term resistance at 110/115 or the 2011/2012/2013 highs. Above this renders upside to 147-150 or the prior Nov 2008 record highs. Key supports: 100-102, 95-97 and 91.24-91.77. Below 91.24 suggests a decline to the mid-80s.
Has the super bull cycle in Commodities ended or is this still a consolidation within a longer term bull?
Descending triangle and/or head/shoulders top patterns?
Gold remains in a technical base between 1,182 and 1,428.
Another symmetrical triangle breakout?

15
Fixed Income – US 10 and 30 Year Treasury Yields (TNX/TYX)
The top half of the chart is the SPX monthly chart and the bottom half is the monthly spreads of 10-year US Treasury yields minus the 2-year yields. In the past when 10-2 year spreads bottomed (May '00 and Nov '06) and began to expand sharply this has led to a major SPX peak nearly 3-11 months later (Aug '00/Jul '07). Spreads bottomed on Jul' 12 and has been expanding for the past 23 months. Did the QE programs extend the normal US business cycle (4-6 years) setting the stage for the next bubble? If so is 2.813 a major inflection point?
TNX remains in a downtrend channel since early 1980s (1981/1982). However, conflicting technical signals have created interest rate uncertainties. A monthly golden cross buy signal (Aug 2013) and a subsequent positive outside month (May 2013) warn of a retest of the top of the channel (3.73%). However, a negative outside month (Jan 2014) also hints of yields declining further to its 30-mo ma (2.16%).
TYX appears to have peaked in Dec 2013 (3.98%) near the top of its 1980s downtrend channel (3.89%). Pivotal support is 3.21%-3.27% or the 30-mo ma, 50%retracement from 2012-2013 rally and Jul 2012 uptrend. Key initial resistance is 3.63%-3.75% or the 30-wk ma, Mar 2014 high and the 50% retracement from Dec 2013-May 2014 low.
A 1-year trading range remains intact between 2.42-2.47% and 3.01-3.04%. A breakout above 3.01-3.04% renders upside to 3.62%. On the other hand, a convincing breakdown below 2.42-2.47% renders downside to 1.84%-1.87%. On a shorter term basis, a 4-month trading symmetrical triangle breakdown between 2.57-2.60% and 2.79-2.82% suggests the potential for another decline to 2.32% and possibly to 2.16%. On the upside, a breakout above 2.72%-2.82% renders a retest of the top of the 1-year range at 3.04-3.08%.
30-year Treasury Yields (TYX) peaked at 3.98% (Dec 2013). Currently bouncing off of key support at 3.21%-3.27%. Key initial resistance is 3.63-3.75% and then 3.89-3.98%.
Golden cross buy and May 2013 positive outside month warn of a retest of 3.73% but a negative outside month on Jan 2014 also hints of a decline to 2.16%.
Tech/Telecom Bubble
Financial Bubble QE Bubble ???
10-year minus 2-year Treasury yield spread
2.813
TNX remains in a 1-year trading range between 2.42-2.47% and 3.01-3.04%.
16
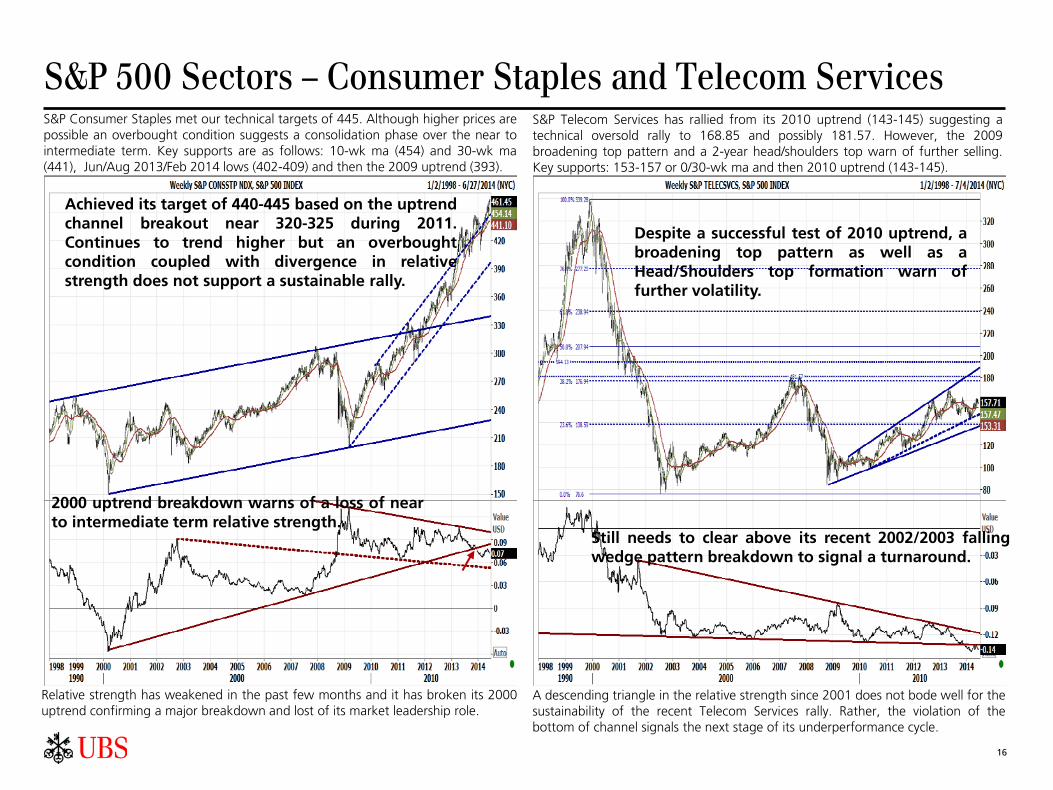
S&P 500 Sectors – Consumer Staples and Telecom Services S&P Consumer Staples met our technical targets of 445. Although higher prices are
possible an overbought condition suggests a consolidation phase over the near to intermediate term. Key supports are as follows: 10-wk ma (454) and 30-wk ma (441), Jun/Aug 2013/Feb 2014 lows (402-409) and then the 2009 uptrend (393).
Relative strength has weakened in the past few months and it has broken its 2000 uptrend confirming a major breakdown and lost of its market leadership role.
S&P Telecom Services has rallied from its 2010 uptrend (143-145) suggesting a technical oversold rally to 168.85 and possibly 181.57. However, the 2009 broadening top pattern and a 2-year head/shoulders top warn of further selling. Key supports: 153-157 or 0/30-wk ma and then 2010 uptrend (143-145).
A descending triangle in the relative strength since 2001 does not bode well for the sustainability of the recent Telecom Services rally. Rather, the violation of the bottom of channel signals the next stage of its underperformance cycle.
Despite a successful test of 2010 uptrend, a broadening top pattern as well as a Head/Shoulders top formation warn of further volatility.
Still needs to clear above its recent 2002/2003 falling wedge pattern breakdown to signal a turnaround.
Achieved its target of 440-445 based on the uptrend channel breakout near 320-325 during 2011. Continues to trend higher but an overbought condition coupled with divergence in relative strength does not support a sustainable rally.
2000 uptrend breakdown warns of a loss of near to intermediate term relative strength.
17
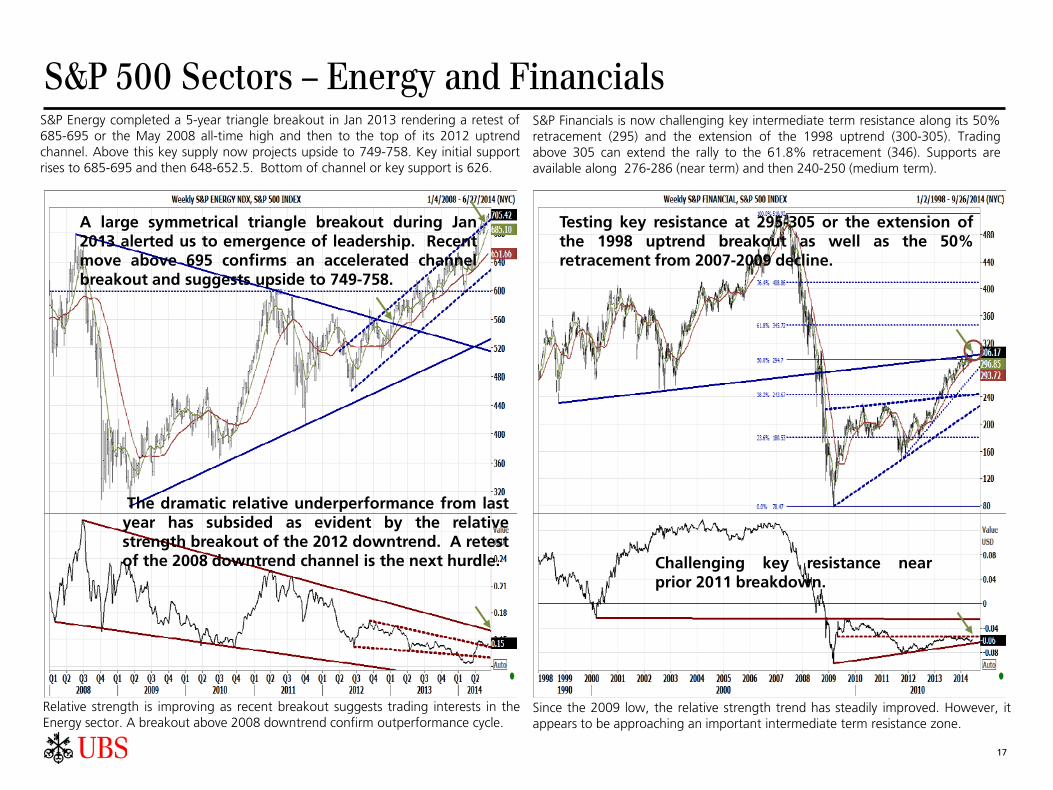
S&P 500 Sectors – Energy and Financials S&P Energy completed a 5-year triangle breakout in Jan 2013 rendering a retest of
685-695 or the May 2008 all-time high and then to the top of its 2012 uptrend channel. Above this key supply now projects upside to 749-758. Key initial support rises to 685-695 and then 648-652.5. Bottom of channel or key support is 626.
Relative strength is improving as recent breakout suggests trading interests in the Energy sector. A breakout above 2008 downtrend confirm outperformance cycle.
S&P Financials is now challenging key intermediate term resistance along its 50% retracement (295) and the extension of the 1998 uptrend (300-305). Trading above 305 can extend the rally to the 61.8% retracement (346). Supports are available along 276-286 (near term) and then 240-250 (medium term).
Since the 2009 low, the relative strength trend has steadily improved. However, it appears to be approaching an important intermediate term resistance zone.
Testing key resistance at 295-305 or the extension of the 1998 uptrend breakout as well as the 50% retracement from 2007-2009 decline.
Challenging key resistance near prior 2011 breakdown.
A large symmetrical triangle breakout during Jan 2013 alerted us to emergence of leadership. Recent move above 695 confirms an accelerated channel breakout and suggests upside to 749-758.
The dramatic relative underperformance from last year has subsided as evident by the relative strength breakout of the 2012 downtrend. A retest of the 2008 downtrend channel is the next hurdle.

18
S&P 500 Sectors – Utilities and Industrials S&P Utilities continues to recover after successfully testing key support near the
bottom of its 2009 uptrend channel (190 +/- 5). A recent breakout above the 2008 downtrend and 2013 highs around 205-210 signals a retest of 225 or 2008 highs. Key initial support moves up to 205 +/- 5 or 2009 uptrend and 30-week ma.
Two longer-term relative strength trend lines have been broken. However, it appears that there is a near term technical improvement now developing.
S&P Industrials has broken out of 2 prior resistances (381/337) last year rendering upside targets to next key resistance along the top of its 2009 channel (460) as well as the 2000 internal uptrend (455). The ability to breakout projects longer term target to as high as 631. Key supports are: 438-441, 418-427 and 350-381.
A 5-year symmetrical triangle relative strength breakout late last year reaffirms a rotation into this economically sector.
Despite couple of key breakouts over the past year the recent surge above 450-460 is technically significant as this confirms the emergence of a new leadership sector.
5-year triangle pattern breakout in relative strength chart reaffirms the emergence of new leadership.
A retest of the 2008 highs at 225 is possible.
Breakdown last year of key support suggests relative underperformance against SPX. Needs to clear above breakdown and 2008 downtrend to signal a recovery.

19
S&P 500 Sectors – Healthcare and Technology S&P Healthcare has surpassed its technical target (610) extending to a record high
of 698.66 in Feb 2014 before a correction occurred. The steepness of this rally suggest monitoring risks. A convincing decline below key initial support at 662/674 or the 10/30-week ma and 632/641 or Apr/Feb 2014 lows warn of a top.
Relative strength has recovered but continues to flirt with the 2001/2009 highs. Repeated failures to break out here hints of a loss of leadership, at least from a near to intermediate term perspective.
S&P Technology has cleared above its 38.2-50% retracement (483/580) from the 2000-2002 decline. This suggests a retest of the 61.8% retracement at 676, intermediate term. However, on a near term basis it is facing formidable intermediate term resistance along its 2004 trendline and the top of the 2009 uptrend channel at 602-625. Key initial support is at 590-601 and then 533.
Relative strength has stabilized after declining from its 2012 high. The recovery suggests investors continue to favor this economically sensitive sector over other cyclical sectors (i.e., Consumer Discretionary). Nonetheless, a flat trend indicates investors/traders remain selective within the Tech sector.
Although a rally to 676 is still possible, there is key intermediate term resistance residing at 602-625.
The strong recovery from the 2002 bottom may have slowing after violating the bottom of the 2009 uptrend channel. However, the recent recovery suggests a key test of the extension of the channel is imminent.
Despite strong recovery, the S&P Healthcare sector is trading at overbought levels. Violation of the 10/30-week moving averages warn of a top.
Challenging the top of a major 13-year ascending triangle.

S&P 500 Sectors – Materials and Consumer Discretionary A symmetrical triangle breakout at 238 is technically relevant as this renders a target
to 420 for the S&P Materials. In addition, recent successful test of key support along the 30-wk ma (293) and a subsequent breakout above a medium-term resistance at 289.01 (May 2008 high) signal a rotation into this economically sensitive sector.
The relative strength continues to improve as evident by the breakout of its 2012 downtrend. Next key challenge is a retest of the top of the 6 year downtrend.
S&P Consumer Discretionary achieved our technical target of 520-525. In fact, it overshot to 536.41 during Mar 20143 creating an overbought condition. Although the longer trend remains up a violation of its Nov 2012 uptrend channel (515) suggests a consolidation within a trading range between 485-490 and 530-536.
The relative strength trends from 2008 and from 2010 have reversed direction in recent months signaling the end to the outperformance cycle of this cyclical sector, at least from a near to intermediate term technical perspective.
20
Relative strength has weakened as evident by the violations of the two key uptrends including the 2008 uptrend and the 2010 uptrend.
Violation of its steep 1-plus year uptrend channel warns of a trading range between 484 and 536.
A 5-plus year Symmetrical Triangle breakout as well as 2 subsequent breakouts above prior highs are bullish.
2012 downtrend breakout reaffirms the start of recovery to the pivotal 2008 downtrend.
21
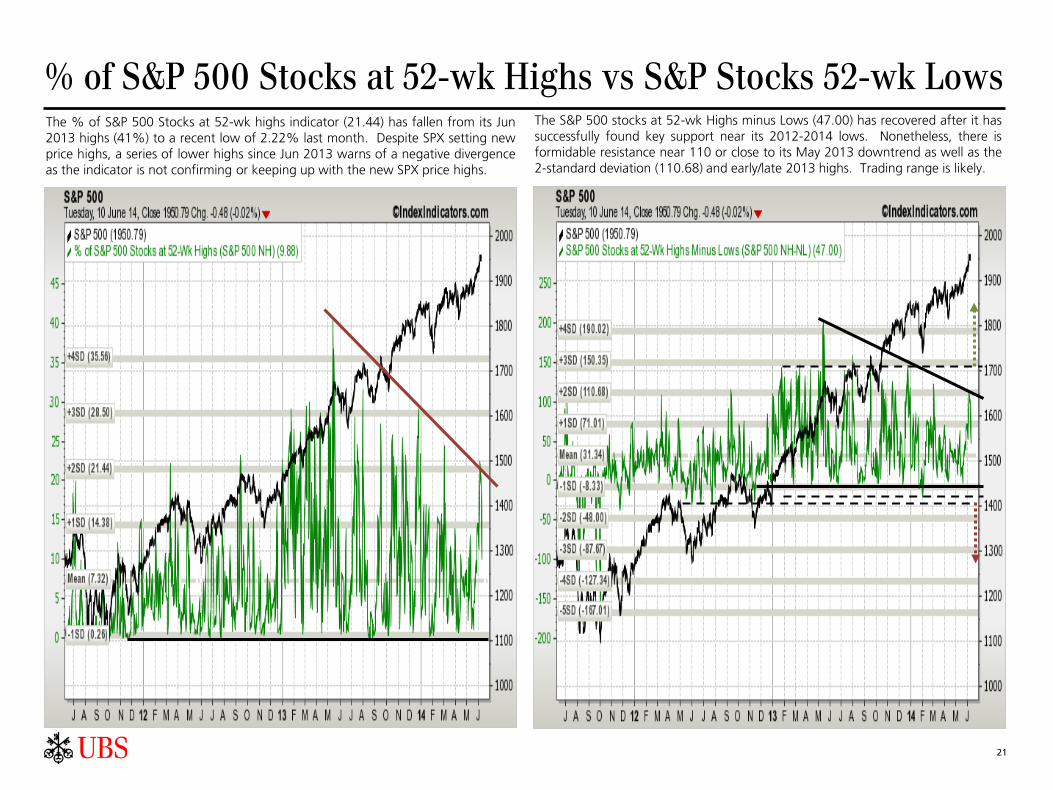
% of S&P 500 Stocks at 52-wk Highs vs S&P Stocks 52-wk Lows The % of S&P 500 Stocks at 52-wk highs indicator (21.44) has fallen from its Jun
2013 highs (41%) to a recent low of 2.22% last month. Despite SPX setting new price highs, a series of lower highs since Jun 2013 warns of a negative divergence as the indicator is not confirming or keeping up with the new SPX price highs.
The S&P 500 stocks at 52-wk Highs minus Lows (47.00) has recovered after it has successfully found key support near its 2012-2014 lows. Nonetheless, there is formidable resistance near 110 or close to its May 2013 downtrend as well as the 2-standard deviation (110.68) and early/late 2013 highs. Trading range is likely.

% of S&P 500 Stocks above 200-day Moving Avg. and SPX/VIX The % of S&P 500 Stocks trading above its 200-day moving average (78.13%) has
successfully tested its Jun 2013 uptrend has broken out above its May 2013 downtrend. This hints of investors favoring the safety/liquidity of the larger cap stocks probably at the expense of illiquid, high beta, and smaller cap names.
The tight 1 year trading range between 11.05-11.69 and 21.34-13.23 for SPX Volatility Index appears to favor a breakdown. Below 11.05-11.69 confirms a major breakdown and renders a retest of the historical lows of 9.88-10.06 and then 8.89-9.39. This will likely trigger a melt up environment for SPX Index.
22

% of NYSE Composite and DJIA stocks > 200-day Moving Avg. The US listed market as represented by % of NYSE Composite stocks above the
200-day ma (62.07) is approaching a critical juncture as evident by the 2012 symmetrical triangle and the proximity to mean (60.67). The outcome of this test via a breakout or breakdown can confirm a leadership or a lagging market.
DJIA is benefiting from its mega cap exposure as it has successfully held onto its 2011 uptrend. However, it is now challenging key resistance along the low 90s or the pivotal downtrend from its Feb 2012 and May 2013 reaction highs. A breakout here support further support the rotation into blue chip/mega cap stocks .
23

% of S&P 100 and NASDAQ 100 stocks > 200-day Moving Avg. Although % of S&P 100 Stocks trading above its 200-day ma (82.93%) has
corrected from its May 2013 highs a rising uptrend and a recent breakout above its May 2013 downtrend strongly suggest that the mega cap market is emerging as both a new market leader and the preferred market for many investors.
The NASDAQ 100 Index appears headed for an inflection point. The outcome of a key test of pivotal resistance near the extension of the Sep 2011 uptrend and the descending triangle breakdown during Mar/Apr 2014 may help to determine the next major directional trend for this important OTC market.
24

% of Mid-Cap and Small-Cap stocks > 200-day Moving Avg. Since the Mid-cap market has been a market leader over the past 10-plus years,
the violation of its 2011 uptrend last year warns either a leadership shift or a maturing US stock market rally? The strong selling since Mar 2014 has led to an oversold condition that may trigger a technical bounce to its Aug 2013 downtrend.
Small-cap market has broken its key 2011 uptrend late last year (Oct/Nov 2013). This warns of a loss of leadership and a broadening top pattern over the past 2 year further reaffirms selling pressure. However, an oversold condition coupled with the ability to find support near bottom of pattern can lead to a technical rally.
25
26
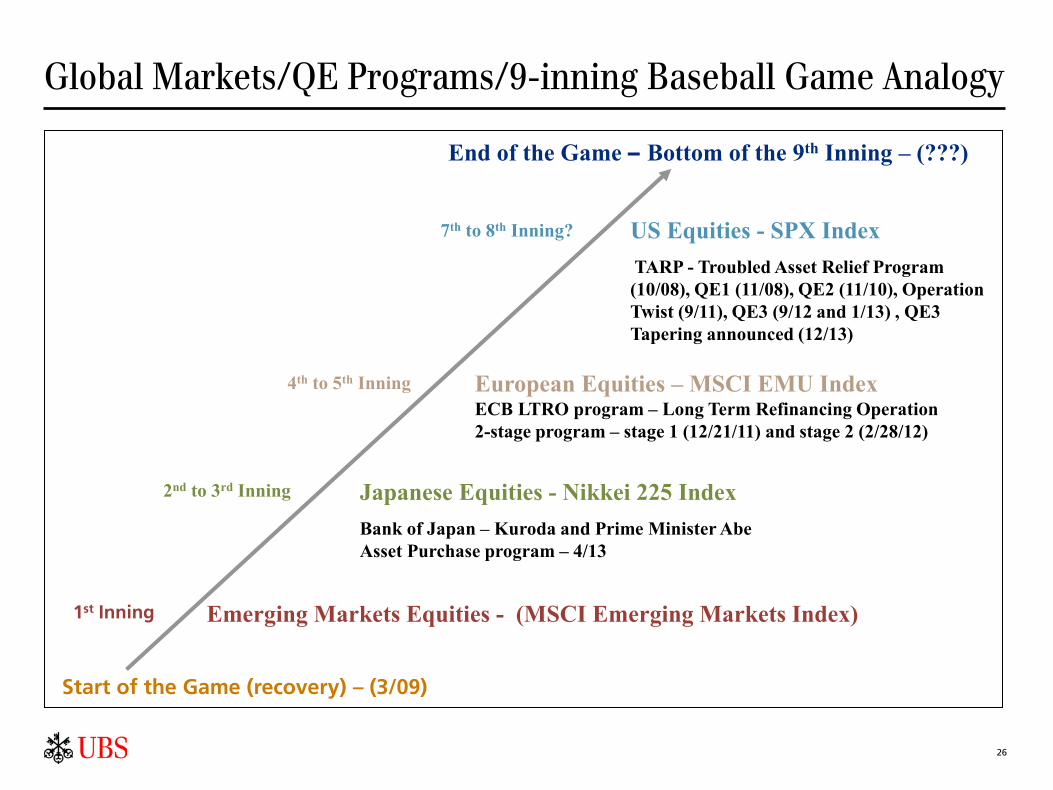
Global Markets/QE Programs/9-inning Baseball Game Analogy
2nd to 3rd Inning
4th to 5th Inning European Equities – MSCI EMU Index ECB LTRO program – Long Term Refinancing Operation 2-stage program – stage 1 (12/21/11) and stage 2 (2/28/12)
Start of the Game (recovery) – (3/09)
Emerging Markets Equities - (MSCI Emerging Markets Index)
Japanese Equities - Nikkei 225 Index
Bank of Japan – Kuroda and Prime Minister Abe Asset Purchase program – 4/13
US Equities - SPX Index
TARP - Troubled Asset Relief Program (10/08), QE1 (11/08), QE2 (11/10), Operation Twist (9/11), QE3 (9/12 and 1/13) , QE3 Tapering announced (12/13)
End of the Game – Bottom of the 9th Inning – (???)
7th to 8th Inning?
1st Inning

27
US Economic/Business Cycle, Sector Rotation & Duration
Early Expansion
Middle Expansion
Late Expansion
Early Contraction
Late Contraction
Transportation
Technology
Services
Capital Goods Industrials
Basic Materials
Energy
Consumer Staples
Utilities
Financials
Consumer Cyclicals
Early Expansion – 12 to 18 months
Inflation = Continues to fall
Interest Rates = Bottoming out
Middle Expansion –12 to 18 months
Inflation = Bottoming out
Interest Rates = Rising modestly
Late Expansion – 12 to 18 months
Inflation = Rising
Interest Rates = Rising rapidly
Early Contraction – 6 to 9 months
Inflation = Rising less strongly
Interest Rates = Peaking
Deep Contraction – 6 to 9 months
Inflation = Flat to Declining
Interest Rates = Falling
1 complete cycle – 48 to 72 months
or 4 to 6 years March 2009 2015-2016? 2014
Healthcare
28
Required Disclosures Chief Investment Office (CIO) Wealth Management (WM) Research is published by UBS Wealth Management and UBS Wealth Management Americas, Business Divisions of UBS AG (UBS) or an affiliate thereof. CIO WM Research reports published outside the US are branded as Chief Investment Office WM. In certain countries UBS AG is referred to as UBS SA. This publication is for your information only and is not intended as an offer, or a solicitation of an offer, to buy or sell any investment or other specific product. The analysis contained herein does not constitute a personal recommendation or take into account the particular investment objectives, investment strategies, financial situation and needs of any specific recipient. It is based on numerous assumptions. Different assumptions could result in materially different results. We recommend that you obtain financial and/or tax advice as to the implications (including tax) of investing in the manner described or in any of the products mentioned herein. Certain services and products are subject to legal restrictions and cannot be offered worldwide on an unrestricted basis and/or may not be eligible for sale to all investors. All information and opinions expressed in this document were obtained from sources believed to be reliable and in good faith, but no representation or warranty, express or implied, is made as to its accuracy or completeness (other than disclosures relating to UBS and its affiliates). All information and opinions as well as any prices indicated are current only as of the date of this report, and are subject to change without notice. Opinions expressed herein may differ or be contrary to those expressed by other business areas or divisions of UBS as a result of using different assumptions and/or criteria. At any time, investment decisions (including whether to buy, sell or hold securities) made by UBS AG, its affiliates, subsidiaries and employees may differ from or be contrary to the opinions expressed in UBS research publications. Some investments may not be readily realizable since the market in the securities is illiquid and therefore valuing the investment and identifying the risk to which you are exposed may be difficult to quantify. UBS relies on information barriers to control the flow of information contained in one or more areas within UBS, into other areas, units, divisions or affiliates of UBS. Futures and options trading is considered risky. Past performance of an investment is no guarantee for its future performance. Some investments may be subject to sudden and large falls in value and on realization you may receive back less than you invested or may be required to pay more. Changes in FX rates may have an adverse effect on the price, value or income of an investment. This report is for distribution only under such circumstances as may be permitted by applicable law. Distributed to US persons by UBS Financial Services Inc., a subsidiary of UBS AG. UBS Securities LLC is a subsidiary of UBS AG and an affiliate of UBS Financial Services Inc. UBS Financial Services Inc. accepts responsibility for the content of a report prepared by a non-US affiliate when it distributes reports to US persons. All transactions by a US person in the securities mentioned in this report should be effected through a US-registered broker dealer affiliated with UBS, and not through a non-US affiliate. The contents of this report have not been and will not be approved by any securities or investment authority in the United States or elsewhere. UBS specifically prohibits the redistribution or reproduction of this material in whole or in part without the prior written permission of UBS and UBS accepts no liability whatsoever for the actions of third parties in this respect. Version as per May 2014. © UBS 2014. The key symbol and UBS are among the registered and unregistered trademarks of UBS. All rights reserved.

29
Contact Information
UBS Financial Services Wealth Management Research NY, NY 10019 www.ubs.com
Peter Lee UBS Financial Services Inc. [email protected] 212-713-8888 Ext 01