Jumbo 1Q11 review V4 fileJumbo Greece/ General Retailers Company update Produced by: All ESN...
12
Jumbo Greece/ General Retailers Company update Produced by: All ESN research is available on Bloomberg: “ESNR” <go> Distributed by the Members of ESN (see last page of this report) Investment Research 26 January 2011 Accumulate 5.25 closing price as of 25/01/2011 6.20 Target Price unchanged Recommendation unchanged Target price: EUR Share price: EUR Reuters/Bloomberg BABr.AT/BELA GA Daily avg. no. trad. sh. 12 mth 195,092 Daily avg. trad. vol. 12 mth (m) 1.13 Price high 12 mth (EUR) 7.93 Price low 12 mth (EUR) 4.50 Abs. perf. 1 mth 7.1% Abs. perf. 3 mth -7.1% Abs. perf. 12 mth -29.1% Market capitalisation (EURm) 682 Current N° of shares (m) 130 Free float 47% Key financials (EUR) 06/10 06/11e 06/12e Sales (m) 487 482 504 EBITDA (m) 145 114 121 EBITDA margin 29.7% 23.6% 24.1% EBIT (m) 132 100 105 EBIT margin 27.0% 20.7% 20.9% Net Profit (adj.)(m) 100 73 77 ROCE 15.4% 11.6% 11.5% Net debt/(cash) (m) 16 24 33 Net Debt Equity 0.0 0.0 0.1 Net Debt/EBITDA 0.1 0.2 0.3 Int. cover(EBITDA/Fin.int) 70.5 27.2 24.3 EV/Sales 1.4 1.5 1.4 EV/EBITDA 4.6 6.2 5.9 EV/EBITDA (adj.) 4.6 6.2 5.9 EV/EBIT 5.0 7.1 6.8 P/E (adj.) 6.4 9.3 8.8 P/BV 1.4 1.4 1.3 OpFCF yield 15.4% 9.7% 9.6% Dividend yield 3.6% 2.8% 3.0% EPS (adj.) 0.78 0.56 0.59 BVPS 3.48 3.78 4.16 DPS 0.19 0.15 0.16 vvdsvdvsdy 4.0 5.0 6.0 7.0 8.0 9.0 10.0 Jan 10 Feb 10 Mar 10 Apr 10 May 10 Jun 10 Jul 10 Aug 10 Sep 10 Oct 10 Nov 10 Dec 10 Jan 11 JUMBO Stoxx General Retailers (Rebased) Source: Fact set Shareholders: Vakakis Apostolos-Evangelos 27%; Capital Research & Management Co 16%; Franklin Templeton Institutional LLC 5%; For company description please see summary table footnote New stores to offset weak macroeconomic environment – ‘Accumulate’ rating remains We retain a conservative stance on Jumbo, expecting that the stocks directly affected by the economic activity downturn in Greece will remain under pressure throughout 2011. Nevertheless, we believe that the long term growth prospects of Jumbo remain promising, given the resilient business model. We maintain our target price at EUR6.20/share and our Accumulate rating on the stock. The challenging macroeconomic conditions can be considered the main near-term catalyst in the local market. Macroeconomic figures remain weak, with GDP shrinking, unemployment peaking and consumer confidence at historical low levels. On January 21, the management revised its guidance for FY10/11. Sales growth is now seen between 0%-2% (vs. +2% before), while the deterioration in the gross margin will be smaller than initially expected (previous guidance for a 6% drop to 48%), resulting to an upgrade in net profits forecasts to EUR60-65m from EUR65m previously. In its statement, the management underlined the unfavourable economic conditions in Greece, revealing that its sales during the first half of the current fiscal year were slightly below last year’s figure despite the fact that 6 new stores were opened in 1H10/11. Our FY10/11 estimates now call for 1% sales decline compared to our previous forecast for a 2.6% growth, indicating a double digit negative like-for-like sales growth in Greece, given the weak macroeconomic outlook in Greece and a rather weak Christmas period for retail. For FY11/12 we reduce our estimates by 3.3% as the recessionary environment in Greece will still be evident in the second half of 2011. The management is planning the opening of six new stores in FY11/12 which will support the top line during the next fiscal year. We now see Jumbo sales at EUR482m in FY10/11 and EUR504m (+4.6% yoy) in FY11/12. On the Ebitda front, the acceleration of the store roll-out plans will incur pre- opening expenses, thus affecting group’s cost side. In contrast, the company announced that the gross margin will exceed its previous forecast of 48% during FY10/11. For this reason, we increase our EBITDA estimates by 1.2% to EUR113.6m in FY10/11 and keep it at EUR121.4m for FY11/12 (flat against our old forecast). Going forward, we raised our net profits estimates by 5.9% to EUR64.2m for FY10/11 and by 8.4% to EUR70.8m for FY11/12 following the amendment of the dividend tax announced yesterday by the Greek government (i.e. the tax on dividend is going to be charged on the recipient of the dividend and not on the company level, which was the case until now, resulting to a lower effective tax rate). If we exclude the special tax contribution of EUR10m for this fiscal year, net profits will reach EUR74.2m in FY10/11. Following our changes in our P&L estimates and the revision in our DCF assumptions, our valuation returns a target price of EUR 6.20 per share, unchanged compared to our last update. Our target price implies 18% upside potential from current price levels, so we stick to our ‘Accumulate’ recommendation on the stock. Jumbo released a satisfactory set of results for 1Q10/11, well above our and consensus forecasts on the profitability front. Specifically, sales were flat at EUR116.5m (as already announced), EBITDA stood at EUR 24.3m, down by 9.9% yoy, but well above our and consensus forecasts (+9.2% and +12.3% respectively), while net earnings reached EUR16.6m in 1Q10/11, down by 5.1% yoy, beating our and consensus estimates by more than 20%. Head of Research Konstantinos Manolopoulos +30 210 817 3388 [email protected] Analyst(s): Dimitris Birbos +30 210 817 3392 [email protected]
Transcript of Jumbo 1Q11 review V4 fileJumbo Greece/ General Retailers Company update Produced by: All ESN...

Jumbo Greece/ General Retailers Company update
Produced by: All ESN research is availab le on Bloomberg: “ESNR” <go>
Distributed by the Members of ESN (see last page of this report)
Investment Research 26 January 2011
Accumulate
5.25
closing price as o f 25/01/2011
6.20
Target Price unchanged
Recommendation unchanged
Target price: EUR
Share price: EUR
Reuters/Bloomberg BABr.AT/BELA GA
Daily avg. no. trad. sh. 12 mth 195,092
Daily avg. trad. vol. 12 mth (m) 1.13
Price high 12 mth (EUR) 7.93
Price low 12 mth (EUR) 4.50
Abs. perf. 1 mth 7.1%
Abs. perf. 3 mth -7.1%
Abs. perf. 12 mth -29.1%
Market capitalisation (EURm) 682
Current N° of shares (m) 130
Free float 47%
Key financials (EUR) 06/10 06/11e 06/12e
Sales (m) 487 482 504
EBITDA (m) 145 114 121
EBITDA margin 29.7% 23.6% 24.1%
EBIT (m) 132 100 105
EBIT margin 27.0% 20.7% 20.9%
Net Profit (adj.)(m) 100 73 77
ROCE 15.4% 11.6% 11.5%
Net debt/(cash) (m) 16 24 33
Net Debt Equity 0.0 0.0 0.1
Net Debt/EBITDA 0.1 0.2 0.3
Int. cover(EBITDA/Fin.int) 70.5 27.2 24.3
EV/Sales 1.4 1.5 1.4
EV/EBITDA 4.6 6.2 5.9
EV/EBITDA (adj.) 4.6 6.2 5.9
EV/EBIT 5.0 7.1 6.8
P/E (adj.) 6.4 9.3 8.8
P/BV 1.4 1.4 1.3
OpFCF yield 15.4% 9.7% 9.6%
Dividend yield 3.6% 2.8% 3.0%
EPS (adj.) 0.78 0.56 0.59
BVPS 3.48 3.78 4.16
DPS 0.19 0.15 0.16
vvdsvdvsdy
4.0
5.0
6.0
7.0
8.0
9.0
10.0
Jan 10 Feb 10 Mar 10 Apr 10 May 10 Jun 10 Jul 10 Aug 10 Sep 10 Oct 10 Nov 10 Dec 10 Jan 11
JUM BO Stoxx General Retailers (Rebased)
Source: Factset Shareholders: Vakakis Apostolos-Evangelos 27%;
Capital Research & Management Co
16%; Franklin Templeton Institutional
LLC 5%;
For company descript ion please see summary table footnote
New stores to offset weak macroeconomic environment – ‘Accumulate’ rating remains
We retain a conservative stance on Jumbo, expecting that the stocks directly affected by the economic activity downturn in Greec e will remain under pressure throughout 2011. Nevertheless, we believe that the long term growth prospects of Jumbo remain promising, given the resilient busines s model. We maintain our target price at EUR6.20/share and our Accumulate rat ing on the stock.
� The challenging macroeconomic conditions can be considered the main near-term catalyst in the local market. Macroeconomic figures remain weak, with GDP shrinking, unemployment peaking and consumer confidence at historical low levels.
� On January 21, the management revised its guidance for FY10/11. Sales growth is now seen between 0%-2% (vs. +2% before), while the deterioration in the gross margin will be smaller than initially expected (previous guidance for a 6% drop to 48%), resulting to an upgrade in net profits forecasts to EUR60-65m from EUR65m previously. In its statement, the management underlined the unfavourable economic conditions in Greece, revealing that its sales during the first half of the current fiscal year were slightly below last year’s figure despite the fact that 6 new stores were opened in 1H10/11.
� Our FY10/11 estimates now call for 1% sales decline compared to our previous forecast for a 2.6% growth, indicating a double digit negative like-for-like sales growth in Greece, given the weak macroeconomic outlook in Greece and a rather weak Christmas period for retail. For FY11/12 we reduce our estimates by 3.3% as the recessionary environment in Greece will still be evident in the second half of 2011. The management is planning the opening of six new stores in FY11/12 which will support the top line during the next fiscal year. We now see Jumbo sales at EUR482m in FY10/11 and EUR504m (+4.6% yoy) in FY11/12.
� On the Ebitda front, the acceleration of the store roll-out plans will incur pre-opening expenses, thus affecting group’s cost side. In contrast, the company announced that the gross margin will exceed its previous forecast of 48% during FY10/11. For this reason, we increase our EBITDA estimates by 1.2% to EUR113.6m in FY10/11 and keep it at EUR121.4m for FY11/12 (flat against our old forecast).
� Going forward, we raised our net profits estimates by 5.9% to EUR64.2m for FY10/11 and by 8.4% to EUR70.8m for FY11/12 following the amendment of the dividend tax announced yesterday by the Greek government (i.e. the tax on dividend is going to be charged on the recipient of the dividend and not on the company level, which was the case until now, resulting to a lower effective tax rate). If we exclude the special tax contribution of EUR10m for this fiscal year, net profits will reach EUR74.2m in FY10/11.
� Following our changes in our P&L estimates and the revision in our DCF assumptions, our valuation returns a target price of EUR 6.20 per share , unchanged compared to our last update. Our target price implies 18% upside potential from current price levels, so we stick to our ‘Accumulate’ recommendation on the stock.
� Jumbo released a satisfactory set of results for 1Q10/11, well above our and consensus forecasts on the profitability front. Specifically, sales were flat at EUR116.5m (as already announced), EBITDA stood at EUR 24.3m, down by 9.9% yoy, but well above our and consensus forecasts (+9.2% and +12.3% respectively), while net earnings reached EUR16.6m in 1Q10/11, down by 5.1% yoy, beating our and consensus estimates by more than 20%.
Head of Research Konstantinos Manolopoulos +30 210 817 3388 [email protected] Analyst(s): Dimitris Birbos +30 210 817 3392 dbirbo [email protected]
Jumbo
Page 2
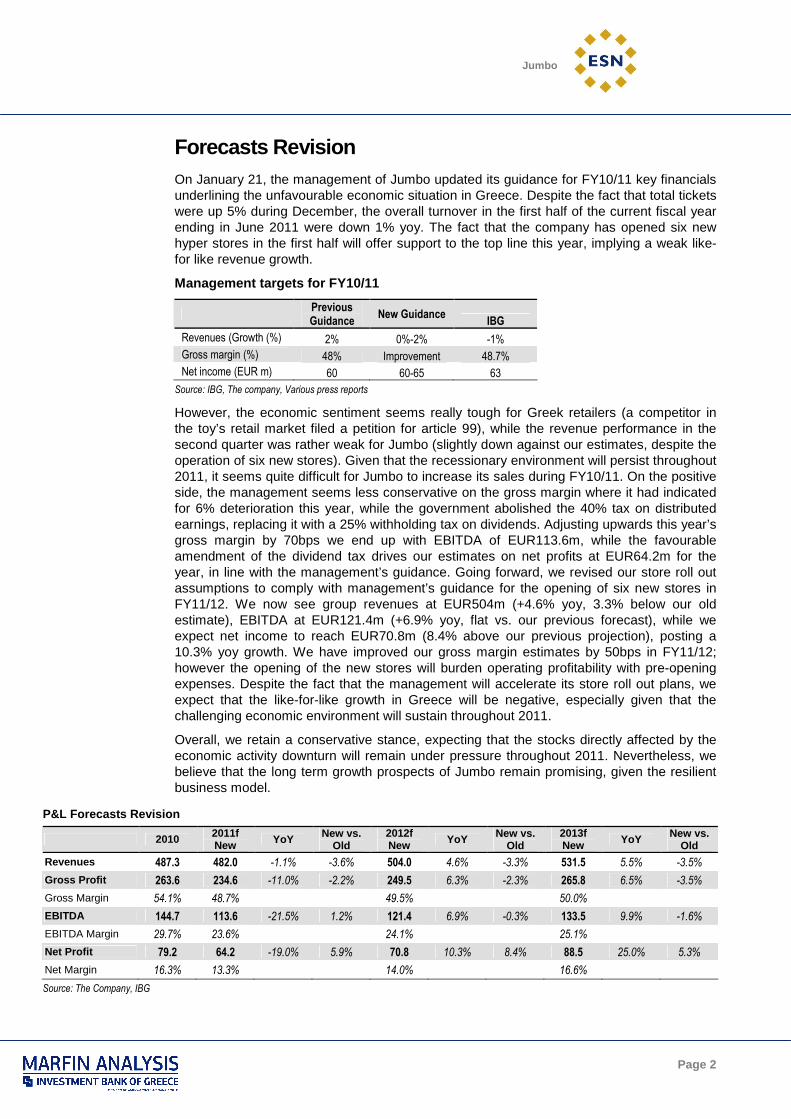
Forecasts Revision On January 21, the management of Jumbo updated its guidance for FY10/11 key financials underlining the unfavourable economic situation in Greece. Despite the fact that total tickets were up 5% during December, the overall turnover in the first half of the current fiscal year ending in June 2011 were down 1% yoy. The fact that the company has opened six new hyper stores in the first half will offer support to the top line this year, implying a weak like-for like revenue growth.
Management targets for FY10/11
Previous Guidance
New Guidance IBG
Revenues (Growth (%) 2% 0%-2% -1%
Gross margin (%) 48% Improvement 48.7%
Net income (EUR m) 60 60-65 63
Source: IBG, The company, Various press reports
However, the economic sentiment seems really tough for Greek retailers (a competitor in the toy’s retail market filed a petition for article 99), while the revenue performance in the second quarter was rather weak for Jumbo (slightly down against our estimates, despite the operation of six new stores). Given that the recessionary environment will persist throughout 2011, it seems quite difficult for Jumbo to increase its sales during FY10/11. On the positive side, the management seems less conservative on the gross margin where it had indicated for 6% deterioration this year, while the government abolished the 40% tax on distributed earnings, replacing it with a 25% withholding tax on dividends. Adjusting upwards this year’s gross margin by 70bps we end up with EBITDA of EUR113.6m, while the favourable amendment of the dividend tax drives our estimates on net profits at EUR64.2m for the year, in line with the management’s guidance. Going forward, we revised our store roll out assumptions to comply with management’s guidance for the opening of six new stores in FY11/12. We now see group revenues at EUR504m (+4.6% yoy, 3.3% below our old estimate), EBITDA at EUR121.4m (+6.9% yoy, flat vs. our previous forecast), while we expect net income to reach EUR70.8m (8.4% above our previous projection), posting a 10.3% yoy growth. We have improved our gross margin estimates by 50bps in FY11/12; however the opening of the new stores will burden operating profitability with pre-opening expenses. Despite the fact that the management will accelerate its store roll out plans, we expect that the like-for-like growth in Greece will be negative, especially given that the challenging economic environment will sustain throughout 2011.
Overall, we retain a conservative stance, expecting that the stocks directly affected by the economic activity downturn will remain under pressure throughout 2011. Nevertheless, we believe that the long term growth prospects of Jumbo remain promising, given the resilient business model.
P&L Forecasts Revision
2010 2011f New YoY New vs.
Old 2012f New YoY New vs.
Old 2013f New YoY New vs.
Old
Revenues 487.3 482.0 -1.1% -3.6% 504.0 4.6% -3.3% 531.5 5.5% -3.5%
Gross Profit 263.6 234.6 -11.0% -2.2% 249.5 6.3% -2.3% 265.8 6.5% -3.5%
Gross Margin 54.1% 48.7% 49.5% 50.0%
EBITDA 144.7 113.6 -21.5% 1.2% 121.4 6.9% -0.3% 133.5 9.9% -1.6%
EBITDA Margin 29.7% 23.6% 24.1% 25.1%
Net Profit 79.2 64.2 -19.0% 5.9% 70.8 10.3% 8.4% 88.5 25.0% 5.3%
Net Margin 16.3% 13.3% 14.0% 16.6%
Source: The Company, IBG

Jumbo
Page 3
Valuation & Rating
No change in the target price of EUR 6.20/share
We have fine-tuned our 10-year DCF valuation model to reflect the acceleration of the business plan (six stores will open in FY11/12 instead of three) as well as a better than expected gross margin for the current year. We assume a risk free rate of 4.5% and a beta coefficient of 1.2. Our risk premium is set at 6% in the first stage, falling to 5% in the second stage, as some of the uncertainty surrounding the long-term macroeconomic environment should gradually retreat. We have raised our cost of debt assumption to 6.0% for the first stage as the cost of the new loans will be higher in general, while we stick to our assumption for 5% cost of debt for the years 2016-2021. We have assigned a perpetuity growth of 0.5%, and assumed optimal gearing at 20%. Our WACC now stands at 10.6% (vs. 10.8% before) in the first stage, falling to 9.4% in the second stage (vs. 9.8% previously). Finally, we fine-tuned projected taxes to take into account the change in the taxation of dividends.
Our DCF model returns a target price of EUR 6.20 per share (unchanged against our previous target price). We maintain our rating to Accumulate , as the upside potential from current price levels is c. 18% against our current valuation. Nevertheless we retain a cautious stance, as we believe that the local environment will remain challenging throughout 2011, on sustained uncertainty and weak consumption environment.
Key financial assumptions of our 10-year period DCF model
2011f 2012f 2013f 2014f 2015f 2016f 2017f 2018f 2019f 2020f 2021f
Sales 482.0 504.0 531.5 563.7 577.4 588.9 600.7 612.7 624.9 637.4 650.1
EBITDA 113.6 121.4 133.5 141.2 145.3 148.6 151.9 155.2 158.6 162.1 165.6
EBITDA margin 23.6% 24.1% 25.1% 25.0% 25.2% 25.2% 25.3% 25.3% 25.4% 25.4% 25.5%
(-) taxes -31.2 -29.6 -22.8 -24.2 -24.8 -25.3 -25.9 -26.4 -26.9 -27.5 -28.0
(-) Capital Expenditure -49.2 -55.0 -50.0 -40.0 -40.0 -40.0 -40.0 -40.0 -40.0 -40.0 -40.0
(-) Working Capital Needs -11.2 -18.6 -16.0 -18.0 -12.1 -11.5 -11.8 -10.5 -10.0 -9.4 -9.6
Free Cash Flow to the Firm (FCFF) 21.9 18.2 44.6 59.0 68.3 71.8 74.2 78.3 81.7 85.2 87.9
1st stage 2nd stage
Long Term Free Risk Rate 4.5% 4.5%
Estimated Beta 1.2 1.2
Equity Risk Premium 6.0% 5.0%
Cost of Equity 11.7% 10.5%
Target Capital Gearing 20% 20%
Μέσο Σταθµισµένο Κόστος Κεφαλαίου (WACC) 10.6% 9.4%
Ρυθµός αύξησης στο διηνεκές 0.5%
Sum of FCF’s (11e-15f) 164.2
Sum of FCF’s 2nd stage (16f-21f) 244.5
FCF to perpetuity 404.4
Total FCF 813.1
(+) cash & market value of investments (-) minorities: 143.9
(-) current borrowings -157.5
Value to Firm (EUR m) 799.4
Value Per Share (EUR) 6.20
Source: IBG
In the long-term, we remain confident on management and the business model of the group, which remains the leader discount retailer in the local market, while we recognize significant prospects from the development of Jumbo operations in the Balkans.

Jumbo
Page 4
Jumbo trades 10.6x its FY10/11 expected reported earnings, while at our target price trades 12.5x its 2011f net profits. The stock trades at 24.3% discount against the EuroStoxx Retail Index in terms of P/E(11e), which mainly reflects country-specific risks in our view.
Peer Group Valuation
Country Mkt Cap P/E 11 P/E 12 EV/EBITDA
11 EV/EBITDA
12
Value Retailers
Big Lots Inc. USA 1,784 10.6 9.7 5.8 5.5
Family Dollar Stores Inc. USA 3,963 13.7 11.9 7.2 6.6
Dollar Tree Inc. USA 4,774 14.3 12.1 6.6 5.8
Game Retailers
Mattel Inc. USA 6,230 12.2 11.0 7.2 6.9
Hasbro Inc. USA 4,426 14.3 11.8 7.9 7.3
Total Weighted Average 13.3 11.5 7.1 6.6
Euro Stoxx / Retail EU 14.0 12.4
Jumbo (IBG) Greece 682 10.6 9.6 6.1 5.7
Premium/(Discount) to weighted avg. (19.8%) (16.2%) (13.7%) (12.7%)
Premium/(Discount) to benchmark index (24.3%) (22.0%)
Source: Factset, Bloomberg, IBG

Jumbo
Page 5
1Q:10/11 Results Review Jumbo released a satisfactory set of results for 1Q10/11, well above our and consensus forecasts on the profitability front. Specifically, sales were flat at EUR116.5m (as already announced), EBITDA stood at EUR 24.3m, down by 9.9% yoy, but well above our and consensus forecasts (+9.2% and +12.3% respectively), while net earnings reached EUR 16.6m in 1Q10/11, down by 5.1% yoy, beating our and consensus estimates by more than 20%.
Sales performance was maintained at satisfactory levels in Greece (-2.8% YoY) given the irregularities caused by the truck drives strike in September, while sales in Cyprus and Bulgaria were strong (+17.2% y-o-y and +47.0% y-o-y respectively). Recall that the Bulgarian unit has benefited from the operation of the new stores in Plovdiv (November 2009) and Sofia (August 2010). The positive surprise in the EBITDA front reflects a better than we had expected gross margin of 46.7% (vs. our estimate for 45%). The respective figure last year was 48.6% (a 200bps drop) which is mainly attributed to the absorption of the second VAT increase by 2% in July 10 (first VAT increase was implemented in May 10). Finally, net earnings beat our estimates due to net finance income of EUR0.3m (vs. our estimate for net financial expenses of EUR1.1m) and a lower tax rate of 21.2%. It is worth noting that the company had a net cash position of EUR 4.0m in 1Q10/11 vs. net debt of EUR16.5m in the previous quarter, as a result of improved working capital needs. Note also that due to the better working capital and despite the EUR23.6m capex, free cash flow generation was strong coming in at c. EUR24m in the quarter. On current trends, the management mentioned that the group will open three new stores in 2Q10/11: 1 in Greece (Western Greece), 1 in Cyprus (Larnaca) and 1 in Bulgaria (Sofia), in line with its previous guidance and reiterated its sales growth target of 2% for the current year (FY10/11) due to the opening of 6 new stores this year.
On the whole, we were more pessimistic on the gross margin due to the combined effect of the absorption of VAT rise, the weakness of euro against the dollar and the strike of the truck drivers in September, which explains the positive surprise on the profitability front.
Jumbo 1Q10/11 P&L Statement
EUR (m) 1Q10/11 1Q09/10 y-o-y
Revenues 116.5 116.5 -0.1%
COGS 62.1 59.9 3.7%
Gross Profit 54.3 56.6 -4.0%
Gross Margin 46.7% 48.6%
Other Income 0.5 0.5 4.3%
Distribution Costs 28.2 27.8 1.4%
Administrative Expenses 5.1 4.6 11.1%
Other Expenses 0.7 0.8 -7.1%
EBIT 20.8 23.9 -13.0%
EBIT Margin 17.8% 20.5%
Depreciation 3.5 3.0 16.0%
EBITDA 24.3 26.9 -9.8%
EBITDA Margin 20.8% 23.1%
Net Financial Results 0.3 -1.3 na
EBT 21.1 22.6 -6.6%
Income Tax 4.5 5.0 -11.5%
% tax rate 21.2% 22.4%
Net Profit 16.6 17.5 -5.1%
Net margin 14.3% 15.0%
Source: The Company, IBG

Jumbo
Page 6
Jumbo also reported sales per product category where we notice that the sales contribution of toy and baby products to the total, declined compared to a year ago, with the seasonal, home products and stationary categories capturing the share. Sales in stationary products rose by 5.3% yoy in 1Q10/11 and raised their share to 15.0% (from 14.2% a year ago). Seasonal product sales followed with 4.9% yoy growth, while revenues from home products were up 2.7% yoy. On the other hand, baby apparel and toys sales dropped by 8.2% and 4.6% respectively yoy. These findings verify the view that stationary and seasonal product will be the growth drivers in the comings years as a reduction in birth rates has been negatively affected Jumbo’s traditional activities (toys and baby apparel).
Jumbo 1Q:10/11 sales per product category
(EUR m) 1Q10/11 1Q09/10 y-o-y
Toys 28.7 30.1 -4.6%
% of total 24.7% 25.9%
Baby apparel 16.7 18.2 -8.2%
% of total 14.4% 15.6%
Stationary 17.5 16.6 5.3%
% of total 15.0% 14.2%
Seasonal / Other 27.2 25.9 4.9%
% of total 23.3% 22.2%
Home products 26.4 25.7 2.7%
% of total 22.6% 22.0%
Total Sales 116.5 116.5 -0.1%
Source: The Company, IBG
Greece remains the key market for Jumbo accounting for 87.2% of total sales in 1Q10/11, however its share has shrunk from 89.7% a year earlier. Sales from Greek operation retreated by 2.8% yoy in 1Q, reflecting the deterioration in consumer confidence in Greece. In contract, revenues in Cyprus grew by 17% yoy, notably without the addition of new stores in the last 12 months, while Bulgaria posted significant increase in its turnover (+47% yoy) thanks to the operation of two new hypermarket stores in November 2009 and August 2010.
Jumbo 1Q:10/11 sales per country
(EUR m) 1Q10/11 1Q09/10 y-o-y
Greece 101.6 104.5 -2.8%
% of total 87.2% 89.7%
Cyprus 11.1 9.4 17.2%
% of total 9.5% 8.1%
Bulgaria 3.8 2.6 47.0%
% of total 3.3% 2.2%
Total Sales 116.5 116.5 -0.1%
Source: The Company, IBG

Jumbo
Page 7
Jumbo: Summary tables PROFIT & LOSS (EURm) 06/2007 06/2008 06/2009 06/2010 06/2011e 06/2012eSales 343 404 468 487 482 504Cost of Sales & Operating Costs -237 -278 -328 -343 -368 -383Non Recurrent Expenses/Income 0.0 0.0 0.0 0.0 0.0 0.0EBITDA 106 126 140 145 114 121EBITDA (adj.)* 106 126 140 145 114 121Depreciation -8.8 -9.5 -11.5 -12.9 -14.0 -16.1EBITA 96.7 116 128 132 99.6 105EBITA (adj)* 96.7 116 128 132 99.6 105Amortisations and Write Dow ns 0.0 0.0 0.0 0.0 0.0 0.0EBIT 96.7 116 128 132 99.6 105EBIT (adj.)* 96.7 116 128 132 99.6 105Net Financial Interest -4.9 -5.4 -4.9 -2.1 -4.2 -5.0Other Financials 0.0 0.0 0.0 0.0 0.0 0.0Associates 0.0 0.0 0.0 0.0 0.0 0.0Other Non Recurrent Items 0.0 0.0 0.0 0.0 0.0 0.0Earnings Before Tax (EBT) 91.8 111 123 130 95.4 100Tax -23.9 -28.2 -27.5 -50.5 -32.3 -32.1Tax rate 26.0% 25.5% 22.3% 38.9% 33.8% 32.0%Discontinued Operations 0.0 0.0 0.0 0.0 0.0 0.0Minorities 0.0 0.0 0.0 0.0 0.0 0.0Net Profit (reported) 68 83 96 79 63 68Net Profit (adj.) 68 83 96 100 73 77
CASH FLOW (EURm) 06/2007 06/2008 06/2009 06/2010 06/2011e 06/2012eCash Flow from Operations before change in NWC 76.7 92.0 107 92.2 77.1 84.3Change in Net Working Capital -16.8 -42.3 -22.8 8.1 -11.2 -18.6Cash Flow from Operations 60.0 49.8 84.4 100 65.9 65.7Capex -45.5 -51.8 -53.9 -70.6 -49.2 -55.0Net Financial Investments 0.1 -0.2 -0.1 0.1 0.0 0.0Free Cash Flow 14.6 -2.2 30.4 29.8 16.7 10.7Dividends -13.9 -19.4 -24.2 -27.9 -24.5 -18.9Other (incl. Capital Increase & share buy backs) 3.2 -0.4 7.8 55.9 0.0 0.0Change in Net Debt 4 -22 14 58 -8 -8NOPLAT 72 87 100 80 66 72
BALANCE SHEET & OTHER ITEMS (EURm) 06/2007 06/2008 06/2009 06/2010 06/2011e 06/2012eNet Tangible Assets 195 237 280 338 374 413Net Intangible Assets (incl.Goodw ill) 9.1 8.8 8.4 8.0 7.6 7.2Net Financial Assets & Other 2.7 2.9 3.0 2.9 2.9 2.9Total Fixed Assets 207 249 292 349 384 423Net Working Capital 115 158 180 175 186 205Net Capital Invested 322 407 472 524 571 628Group Shareholders Equity 222 285 356 452 491 540o/w own Shareholders Equity 222 285 356 452 491 540Net Debt 66.3 88.2 74.3 16.5 24.3 32.6Provisions 0 0 0 0 0 0Other Net Liabilities or Assets 33 35 42 55 55 55Net Capital Employed 322 407 472 524 571 628
GROWTH & MARGINS 06/2007 06/2008 06/2009 06/2010 06/2011e 06/2012eSales growth 21.8% 17.9% 15.8% 4.2% -1.1% 4.6%EBITDA (adj.)* growth 27.4% 19.0% 11.1% 3.7% -21.5% 6.9%EBITA (adj.)* growth 30.1% 20.0% 10.4% 2.8% -24.4% 5.8%EBIT (adj)*growth 30.1% 20.0% 10.4% 2.8% -24.4% 5.8%Net Profit growth 37.4% 21.5% 16.0% 4.4% -26.9% 5.6%EPS adj. growth 25.5% 21.5% 16.0% -1.2% -27.8% 5.6%DPS adj. growth 39.1% 25.0% 15.0% -17.8% -22.9% 8.1%EBITDA margin 30.8% 31.1% 29.8% 29.7% 23.6% 24.1%EBITDA (adj)* margin 30.8% 31.1% 29.8% 29.7% 23.6% 24.1%EBITA margin 28.2% 28.7% 27.4% 27.0% 20.7% 20.9%EBITA (adj)* margin 28.2% 28.7% 27.4% 27.0% 20.7% 20.9%EBIT margin 28.2% 28.7% 27.4% 27.0% 20.7% 20.9%EBIT (adj)* margin 28.2% 28.7% 27.4% 27.0% 20.7% 20.9%

Jumbo
Page 8
Jumbo: Summary tables RATIOS 06/2007 06/2008 06/2009 06/2010 06/2011e 06/2012eNet Debt/Equity 0.3 0.3 0.2 0.0 0.0 0.1
Net Debt/EBITDA 0.6 0.7 0.5 0.1 0.2 0.3
Interest cover (EBITDA/Fin.interest) 21.5 23.4 28.5 70.5 27.2 24.3
Capex/D&A 515.6% 543.6% 470.3% 545.3% 351.5% 342.4%
Capex/Sales 13.3% 12.8% 11.5% 14.5% 10.2% 10.9%
NWC/Sales 33.5% 39.2% 38.6% 35.9% 38.7% 40.7%
ROE (average) 34.8% 32.6% 29.9% 24.7% 15.5% 15.0%
ROCE (adj.) 22.4% 21.4% 21.2% 15.4% 11.6% 11.5%
WACC 11.0% 11.0% 11.0% 11.0% 11.0% 11.0%
ROCE (adj.)/WACC 2.0 2.0 1.9 1.4 1.1 1.0
PER SHARE DATA (EUR)*** 06/2007 06/2008 06/2009 06/2010 06/2011e 06/2012eAverage diluted number of shares 121.2 121.2 121.2 128.2 129.9 129.9
EPS (reported) 0.56 0.68 0.79 0.62 0.49 0.53
EPS (adj.) 0.56 0.68 0.79 0.78 0.56 0.59
BVPS 1.83 2.35 2.93 3.48 3.78 4.16
DPS 0.16 0.20 0.23 0.19 0.15 0.16
VALUATION 06/2007 06/2008 06/2009 06/2010 06/2011e 06/2012eEV/Sales 4.7 2.9 2.0 1.4 1.5 1.4
EV/EBITDA 15.3 9.3 6.6 4.6 6.2 5.9
EV/EBITDA (adj.)* 15.3 9.3 6.6 4.6 6.2 5.9EV/EBITA 16.7 10.0 7.2 5.0 7.1 6.8
EV/EBITA (adj.)* 16.7 10.0 7.2 5.0 7.1 6.8EV/EBIT 16.7 10.0 7.2 5.0 7.1 6.8
EV/EBIT (adj.)* 16.7 10.0 7.2 5.0 7.1 6.8P/E (adj.) 22.9 13.1 8.8 6.4 9.3 8.8P/BV 7.0 3.8 2.4 1.4 1.4 1.3
Total Yield Ratio 1.2% 2.2% 3.3% 3.6% 2.8% 3.0%
EV/CE 5.1 2.9 2.0 1.3 1.2 1.1
OpFCF yield 3.9% 4.6% 10.0% 15.4% 9.7% 9.6%
OpFCF/EV 3.7% 4.3% 9.2% 15.1% 9.4% 9.2%
Payout ratio 28.6% 29.4% 29.1% 30.6% 30.0% 30.0%
Dividend yield (gross) 1.2% 2.2% 3.3% 3.6% 2.8% 3.0%
EV AND MKT CAP (EURm) 06/2007 06/2008 06/2009 06/2010 06/2011e 06/2012ePrice** (EUR) 12.8 8.9 7.0 5.0 5.3 5.3
Outstanding number of shares for main stock 121 121 121 130 130 130
Total Market Cap 1,555 1,081 846 649 682 682Net Debt 66.3 88.2 74.3 16.5 24.3 32.6o/w Cash & Marketable Securities (-) -52.1 -30.5 -110 -141 -126 -113
o/w Gross Debt (+) 118 119 184 158 151 146
Other EV components -3 -3 -3 -3 -3 -3Enterprise Value (EV adj.) 1,619 1,167 917 663 704 712Source: Company, Marfin Analysis estimates.
Notes* Where EBITDA (adj.) or EBITA (adj) or EBIT (adj.)= EBITDA (or EBITA or EBIT) +/- Non Recurrent Expenses/Income**Price (in local currency): Fiscal year end price for Historical Years and Current Price for current and forecasted years
***EPS (adj.) diluted= Net Profit (adj.)/Avg DIL. Ord. (+ Ord. equivalent) Shs. EPS (reported) = Net Profit reported/Avg DIL. Ord. (+ Ord. equivalent) Shs. Sector: General Retailers/Broadline Retailers
Company Description: Jumbo is the largest toys/babies apparel/bookstore/seasonal products retailer in the Greek market. The companygenerates strong grow th rates, above sector averages, based on its geographical sales netw ork expansion strategy, w ideassortment of products and competitive pricing policy, w ithin pleasing shopping environments. Jumbo continuously enriches its product range, capitalising on its experience and excellent market positioning in order to smooth out seasonality, as w ell as coping w ith thestability in the toy market and increasing clientele. The management has communicated expansion in its netw ork targeting 63-65 storesin Greece, Cyprus and Bulgaria in the medium term.
Jumbo
Page 9
ESN Recommendation System The ESN Recommendation System is Absolute . It means that each stock is rated on the basis of a total return , measured by the upside potential (including dividends and capital reimbursement) over a 12 month time horizon .
The ESN spectrum of recommendations (or ratings) for each stock comprises 5 categories: Buy, Accumulate (or Add), Hold, Reduce and Sell (in short: B, A, H, R, S) .
Furthermore, in specific cases and for a limited period of time, the analysts are allowed to rate the stocks as Rating Suspended (RS) or Not Rated (NR) , as explained below.
Meaning of each recommendation or rating:
• Buy : the stock is expected to generate total return of over 20% during the next 12 months time horizon
• Accumulate: the stock is expected to generate total return of 10% to 20% during the next 12 months time horizon
• Hold : the stock is expected to generate total return of 0% to 10% during the next 12 months time horizon.
• Reduce : the stock is expected to generate total return of 0% to -10% during the next 12 months time horizon
• Sell : the stock is expected to generate total return under -10% during the next 12 months time horizon
• Rating Suspended : the rating is suspended due to a capital operation (take-over bid, SPO, …) where the issuer of the document (a partner of ESN) or a related party of the issuer is or could be involved or to a change of analyst covering the stock
• Not Rated : there is no rating for a company being floated (IPO) by the issuer of the document (a partner of ESN) or a related party of the issuer
History of ESN Recommendation System
Since 18 October 2004 , the Members of ESN are using an Absolute Recommendation System (before was a Relative Rec. System) to rate any single stock under coverage.
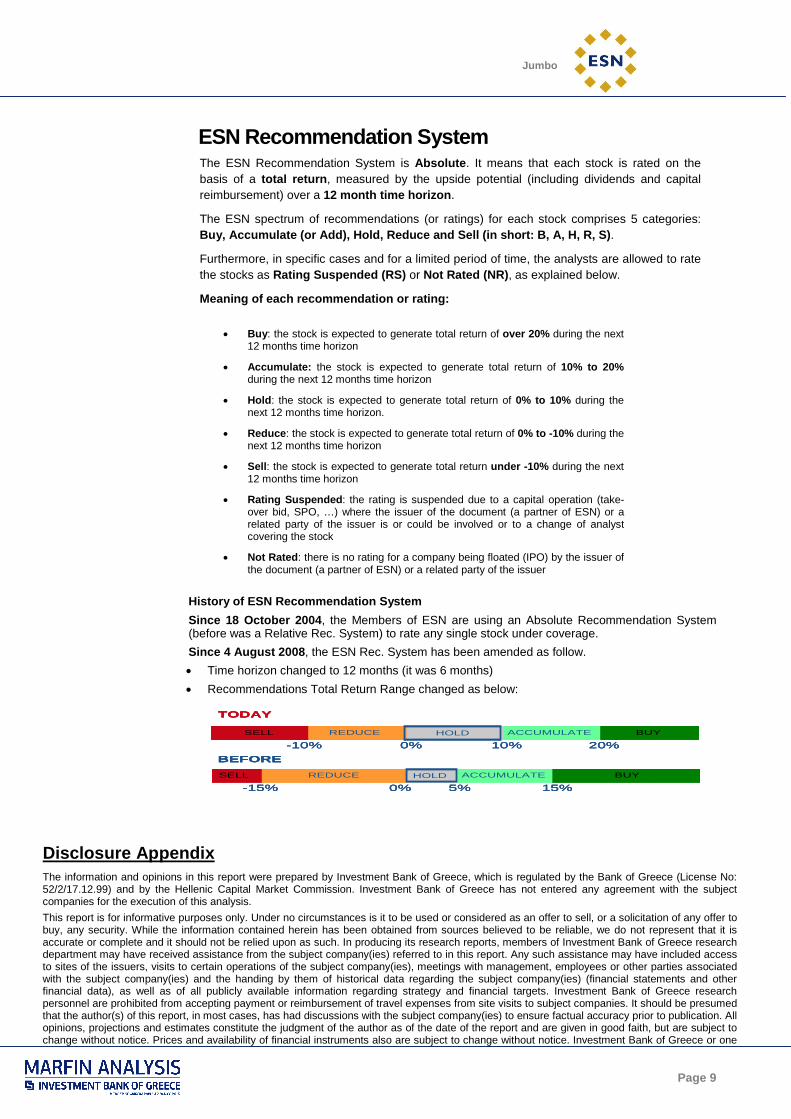
Since 4 August 2008 , the ESN Rec. System has been amended as follow.
• Time horizon changed to 12 months (it was 6 months)
• Recommendations Total Return Range changed as below:
Disclosure Appendix The information and opinions in this report were prepared by Investment Bank of Greece, which is regulated by the Bank of Greece (License No: 52/2/17.12.99) and by the Hellenic Capital Market Commission. Investment Bank of Greece has not entered any agreement with the subject companies for the execution of this analysis.
This report is for informative purposes only. Under no circumstances is it to be used or considered as an offer to sell, or a solicitation of any offer to buy, any security. While the information contained herein has been obtained from sources believed to be reliable, we do not represent that it is accurate or complete and it should not be relied upon as such. In producing its research reports, members of Investment Bank of Greece research department may have received assistance from the subject company(ies) referred to in this report. Any such assistance may have included access to sites of the issuers, visits to certain operations of the subject company(ies), meetings with management, employees or other parties associated with the subject company(ies) and the handing by them of historical data regarding the subject company(ies) (financial statements and other financial data), as well as of all publicly available information regarding strategy and financial targets. Investment Bank of Greece research personnel are prohibited from accepting payment or reimbursement of travel expenses from site visits to subject companies. It should be presumed that the author(s) of this report, in most cases, has had discussions with the subject company(ies) to ensure factual accuracy prior to publication. All opinions, projections and estimates constitute the judgment of the author as of the date of the report and are given in good faith, but are subject to change without notice. Prices and availability of financial instruments also are subject to change without notice. Investment Bank of Greece or one
BEFORE
-15% 0% 5% 15%
SELL REDUCE HOLD ACCUMULATE BUY
TODAY
-10% 0% 10% 20%
SELL REDUCE HOLD ACCUMULATE BUY
BEFORE
-15% 0% 5% 15%
SELL REDUCE HOLD ACCUMULATE BUY
BEFORE
-15% 0% 5% 15%
SELL REDUCE HOLD ACCUMULATE BUY
TODAY
-10% 0% 10% 20%
SELL REDUCE HOLD ACCUMULATE BUY
TODAY
-10% 0% 10% 20%
SELL REDUCE HOLD ACCUMULATE BUY

Jumbo
Page 10
of its affiliates or persons connected with it may from time to time buy and sell securities referred herein. Although Investment Bank of Greece does not set a predetermined frequency for publication, if this is a fundamental research report, it is the intention of Investment Bank of Greece to provide research coverage of the subject company(ies), including in response to news affecting this issuer, subject to applicable quiet periods and capacity constraints. Investment Bank of Greece may from time to time perform investment banking or other services for, or solicit investment banking or other business from, any company mentioned in this report. Investment Bank of Greece does and seeks to do business with companies covered in their research reports. Thus, investors should be aware that the firms may have a conflict of interest that could affect the objectivity of this report. Investors should consider this report as only a single factor in making their investment decision. Securities referred to in this research report are subject to investment risks, including the possible loss of the principal amount invested. This report is intended for professional investors only and it is not to be reproduced or copied or reprinted or transmitted for any purpose without permission. We certify that this report has been published in accordance with our conflict management policy and guidelines. According to Investment Bank of Greece policies, the Analysis Department of Investment Bank of Greece is bound by confidentiality, with the exception of data allowed to be published in accordance with the applicable laws. Investment Bank of Greece relies on information barriers to control the flow of information in one or more areas within Investment Bank of Greece organization. The communication between the Analysis Department of Investment Bank of Greece and the other departments of the aforementioned company is restricted by Chinese Walls set between the different departments, so that Investment Bank of Greece can abide by the provisions regarding confidential information and market abuse.
Analyst Certification The following analysts: Konstantinos Manolopoulos, Dimitris Birbos hereby certify that the views about the companies and securities contained in this report accurately reflect their personal views and that no part of their compensation was or will be directly or indirectly related to the specific recommendations or views in this report. The analysts mentioned above who prepared this report have the below mentioned financial interests in the companies covered in this report……none……
Important Regulatory Disclosures on Subject Company The information and opinions in this report were prepared by INVESTMENT BANK of GREECE, which is member of the Athens Exchange S.A. and regulated by the Bank of Greece (License No: 52/2/17.12.99) and by the Hellenic Capital Market Commission. The compensation of the research analysts, strategists, or research associates principally responsible for the preparation of this research report may depend on various factors such as quality of work, stock picking, client feedback and overall firm profitability.
Stock Ratings You should carefully read the definitions of all ratings used in the research report. Moreover, you should carefully read the entire research report to obtain a clear view of the analyst’s opinions and not infer its contents from the rating alone.
Marfin Analysis Research Rating Distribution Data current as of 21/01/2011
Buy Accumulate Hold Reduce Sell Marfin Analysis Total Coverage 56% 7% 33% 0% 4% % of companies in each rating category that are investment banking clients 7% 0% 4% 0% 0%
Retail 33% 33% 33% 0% 0% % of companies in each rating category that are investment banking clients 0% 0% 0% 0% 0%
Regulatory Disclosures on Subject Companies 1. As of the date mentioned on the first page of this report, Investment Bank of Greece (or any of its affiliated companies) owns 5% or more of a class of common equity securities in the following companies mentioned in this report: Vivartia, Attica Group, Blue Star Ferries, Hygeia G roup, SingularLogic
2. As of the date mentioned on the first page of this report, the following subject companies mentioned in this report own 5% or more of a class of common equity securities of Investment Bank of Greece (or any of its affiliated companies): Marfin Popular Bank
3. Investment Bank of Greece acts as a market maker for the following securities of the subject companies mentioned in this report: Alpha Bank, CCH, EFG Eurobank, National Bank, OPAP, OTE, Piraeu s Bank, PPC, Hellenic Exchanges, Intralot, Mytiline os, Ellaktor, GEK TERNA, Bank of Cyprus
4. Within the last 12 months, Investment Bank of Greece has provided advisory services to the following companies mention in this report: Hellenic Postbank
5. Within the last 12 months, Investment Bank of Greece had a contractual relationship or have received compensation for financial advisory services from the following subject companies mentioned in this report: Vivartia, GEK TERNA, Hellenic Postbank, Motor Oil, Euroline, Interinvest, Vivere, Hygeia Group

Jumbo
Page 11
Rating History
1. 16/11/2010 Accumulate, Target Price EUR 6.20 2. 12/10/2010 Accumulate, Target Price EUR 6.20 3. 30/09/2010 Hold, Target Price EUR 5.90 4. 16/09/2010 Hold, Target Price EUR 5.90 5. 25/05/2010 Hold, Target Price EUR 5.90 6. 14/05/2010 Hold, Target Price EUR 7.00 7. 08/04/2010 Hold, Target Price EUR 7.00 8. 03/03/2010 Hold, Target Price EUR 7.90 9. 24/02/2010 Accumulate, Target Price EUR 10.80 10. 17/11/2009 Accumulate, Target Price EUR 10.80 11. 12/11/2009 Accumulate, Target Price EUR 10.80
3.0
4.0
5.0
6.0
7.0
8.0
9.0
10.0
11.0
Jan 10 Feb 10 Mar 10 Apr 10 May 10 Jun 10 Jul 10 Aug 10 Sep 10 Oct 10 Nov 10 Dec 10 Jan 11
Buy Accumul at Hol d Reduce Sel l Not r a t ed
P r i ce hi s t or y T ar get pr i ce hi s t or y
Source: Factset & ESN, price data adjusted for stock splits. This chart shows Marfin Analysis continuing coverage of this stock; the current analyst may or may not have covered it over the entire period.
Risks to our forecasts and valuation • FX risks due to high dependence on purchases from Asia. Recall that the company will seek to adjust the product mix in order to offset any
possible negative impact in profitability in case of adverse FX movements.
• Delays in the new hyper-stores operation.
• Potential unfavourable macroeconomic trends that may have a negative impact in the company’s financial performance, since as a retail company Jumbo is affected by factors that influence consumer behaviour.
• Difficult business conditions and a stricter competitive environment that could negatively affect the cash flow discipline of previous years.
• Possible delays in shipments of toys in China on the back of stricter safety controls.
• The high dependence of the company’s structure from the Chairman & CEO and major shareholder of the group.
• Risks faced when entering a new unknown market from possible unexpected complications.
• Oil price fluctuations that in turn affect the cost of toys manufacturing and freight costs, increasing input prices for the company.
• Stock overhang concerns: Jumbo’s major shareholder, Mr. Vakakis, has proceeded in various placements in the past. However, all stock sales have taken place at substantially lower stock prices and do not seem to have an overhang impact over time. We would not exclude further placements in the future.
Additional disclosures
1. Additional note to our U.S. readers: This document may be distributed in the United States solely to “major US institutional investors” as defined in Rule 15a-6 under the US Securities Exchange Act of 1934. Each person that receives a copy, by acceptance thereof, represents and agrees that he/she will not distribute or otherwise make available this document to any other person.
2. All prices and valuation multiples are based on the closing of ATHEX’s last session prior to the issue of this report, unless otherwise indicated.
3. Our research reports are available upon request at www.ibg.gr, on Bloomberg’s IBGR and ESNR functions and on Thomson Reuters website.
4. Additional information is available upon request.

Disclaimer : These reports have been prepared and issued by the Members of European Securities Network LLP (‘ESN’). ESN, its Members and their affiliates (and any director, officer or employee thereof), are neither liable for the proper and complete transmission of these reports nor for any delay in their receipt. Any unauthorised use, disclosure, copying, distribution, or taking of any action in reliance on these reports is strictly prohibited. The views and expressions in the reports are expressions of opinion and are given in good faith, but are subject to change without notice. These reports may not be reproduced in whole or in part or passed to third parties without permission. The information herein was obtained from various sources. ESN, its Members and their affiliates (and any director, officer or employee thereof) do not guarantee their accuracy or completeness, and neither ESN, nor its Members, nor its Members’ affiliates (nor any director, officer or employee thereof) shall be liable in respect of any errors or omissions or for any losses or consequential losses arising from such errors or omissions. Neither the information contained in these reports nor any opinion expressed constitutes an offer, or an invitation to make an offer, to buy or sell any securities or any options, futures or other derivatives related to such securities (‘related investments’). These reports are prepared for the clients of the Members of ESN only. They do not have regard to the specific investment objectives, financial situation and the particular needs of any specific person who may receive any of these reports. Investors should seek financial advice regarding the appropriateness of investing in any securities or investment strategies discussed or recommended in these reports and should understand that statements regarding future prospects may not be realised. Investors should note that income from such securities, if any, may fluctuate and that each security’s price or value may rise or fall. Accordingly, investors may receive back less than originally invested. Past performance is not necessarily a guide to future performance. Foreign currency rates of exchange may adversely affect the value, price or income of any security or related investment mentioned in these reports. In addition, investors in securities such as ADRs, whose value are influenced by the currency of the underlying security, effectively assume currency risk. ESN, its Members and their affiliates may submit a pre-publication draft (without mentioning neither the recommendation nor the target price/fair value) of its reports for review to the Investor Relations Department of the issuer forming the subject of the report, solely for the purpose of correcting any inadvertent material inaccuracies. Like all members employees, analysts receive compensation that is impacted by overall firm profitability For further details about the specific risks of the company and about the valuation methods used to determine the price targets included in this report/note, please refer to the latest relevant published research on single stock. Research is available through your sales representative. ESN will provide periodic updates on companies or sectors based on company-specific developments or announcements, market conditions or any other publicly available information. Unless agreed in writing with an ESN Member, this research is intended solely for internal use by the recipient. Neither this document nor any copy of it may be taken or transmitted into Australia, Canada or Japan or distributed, directly or indirectly, in Australia, Canada or Japan or to any resident thereof. This document is for distribution in the U.K. Only to persons who have professional experience in matters relating to investments and fall within article 19(5) of the financial services and markets act 2000 (financial promotion) order 2005 (the “order”) or (ii) are persons falling within article 49(2)(a) to (d) of the order, namely high net worth companies, unincorporated associations etc (all such persons together being referred to as “relevant persons”). This document must not be acted on or relied upon by persons who are not relevant persons. Any investment or investment activity to which this document relates is available only to relevant persons and will be engaged in only with relevant persons. The distribution of this document in other jurisdictions or to residents of other jurisdictions may also be restricted by law, and persons into whose possession this document comes should inform themselves about, and observe, any such restrictions. By accepting this report you agree to be bound by the foregoing instructions. You shall indemnify ESN, its Members and their affiliates (and any director, officer or employee thereof) against any damages, claims, losses, and detriments resulting from or in connection with the unauthorized use of this document. For disclosure upon “conflicts of interest” on the companies under coverage by all the ESN Members and on each “company recommendation history”, please visit the ESN website (www.esnpartnership.eu) For additional information and individual disclaimer please refer to www.esnpartnership.eu and to each ESN Member websites :www.bancaakros.it www.caixabi.pt www.cajamadridbolsa.es www.cmcics.com www.degroof.be www.equinet-ag.de www.ibg.gr www.ncb.ie www.snssecurities.nl
Jumbo Greece
General Retailers
European Securities Network LLP Registered office c/o Withers LLP
16 Old Bailey - London EC4M 7EG
Members of ESN (European Securities Network LLP)
Banca Akros S.p.A. Viale Eginardo, 29 20149 Milano Italy Phone: +39 02 43 444 389 Fax: +39 02 43 444 302
Caixa-Banco de Investimento Rua Barata Salgueiro, 33-5 1269-050 Lisboa Portugal Phone: +351 21 389 68 00 Fax: +351 21 389 68 98
Caja Madrid Bolsa S.V.B. Serrano, 39 28001 Madrid Spain Phone: +34 91 436 7813 Fax: +34 91 577 3770
CM - CIC Securities 6, avenue de Provence 75441 Paris Cedex 09 France Phone: +33 1 4016 2692 Fax: +33 1 4596 7788
SNS Securities N.V. Nieuwezijds Voorburgwal 162 P.O.Box 235 1000 AE Amsterdam The Netherlands Phone: +31 20 550 8500 Fax: +31 20 626 8064
NCB Stockbrokers Ltd. 3 George Dock, Dublin 1 Ireland Phone: +353 1 611 5611 Fax: +353 1 611 5781
Investment Bank of Greece 24B, Kifisias Avenue 151 25 Marousi Greece Phone: +30 210 81 73 000 Fax: +30 210 68 96 325
Bank Degroof Rue de I’Industrie 44 1040 Brussels Belgium Phone: +32 2 287 91 16 Fax: +32 2 231 09 04
Equinet Bank AG Gräfstraße 97 60487 Frankfurt am Main Germany Phone:+49 69 – 58997 – 410 Fax:+49 69 – 58997 – 299