July 6 th 2012 – The Belfry. Sustaining Competitiveness.
27
July 6 th 2012 – The Belfry. Sustaining Competitiveness
-
Upload
meagan-small -
Category
Documents
-
view
216 -
download
1
Transcript of July 6 th 2012 – The Belfry. Sustaining Competitiveness.

July 6th 2012 – The Belfry.Sustaining Competitiveness

Key Challenges affecting the Future of the West Midlands Economy
David Bailey & Nigel Berkeley

The Challenge
“To boost the scale and pace of economic recovery in the region, create more new jobs and stimulate more demand for higher level skills, there is a need to up-skill the workforce in existing businesses, to improve their productivity and help them to exploit new market opportunities. In parallel it will be important to attract more businesses and jobs in higher skilled and value added clusters” The West Midlands Economy Post Recession: Key Issues and Challenges, West Midlands Regional Observatory, 2010; p.20
“The weak performance of the UK economy… the ongoing financial uncertainties in the Eurozone and the global economy, declining wages and cuts in the public sector mean supporting private sector growth and jobs in our cities is more critical than ever”.Cities Outlook, Centre for Cities, 2012; p.6

Set against a long-term poor track record
• Long-term underinvestment in infrastructure
• Ongoing process of deindustrialisation and a wider economic structure reliant on low growth sectors; lower proportion of high growth firms and lower rates of enterprise
• A relatively poor business and employment performance in the private sector • 2% employment growth 1998-2008 compared to 19% nationally
• Birmingham -7.7%; Stoke -16.4% (Newcastle +10.2%)
• Low rates of productivity a feature of several of the region’s key sectors (e.g. wholesale and retail; hotels and catering; and the public sector)

Set against a long-term poor track record
• A relatively poor education and skills record; dependence on lower value added sectors and clusters leads to relatively low skill levels and skills shortages
• Relatively poor performance in developing ‘knowledge economy’ sectors and in R&D spend
• Pockets of high levels of unemployment and worklessness; issues of high youth unemployment and long-term unemployment especially in Birmingham
• “There are over 32,000 young people claiming JSA in Birmingham - enough to fill Birmingham City FC’s St Andrews Stadium” (Centre for Cities, 2012); youth claimant rate 4th worst of UK cities
• Long-term unemployed accounted for 24% of Birmingham claimants by end of 2011; whilst long-term claimant rate second worst of UK cities

Poor track record in developing knowledge intensive jobs
Source: The Work Foundation, 2009

60
70
80
90
100
110
120
130
140
150
160
1971
1973
1975
1977
1979
1981
1983
1985
1987
1989
1991
1993
1995
1997
1999
2001
2003
2005
2007
Em
plo
ym
en
t In
dex 1
97
1=
10
0 South East
North East
East Midlands
West Midlands
Eastern
Yorks-Humber
North West
Long-term employment growth

8
Contrasts in performance of region in recession; since late1990s relative deterioration in West Midlands
Source: ONS, Regional Claimant Count Rates
1971 Q1 1973 Q3 1976 Q1 1978 Q3 1981 Q1 1983 Q3 1986 Q1 1988 Q3 1991 Q1 1993 Q3 1996 Q1 1998 Q3 2001 Q1 2003 Q3 2006 Q1 2008 Q30
2
4
6
8
10
12
14
16
18
UK
West Midlands
East Midlands
North East
South East
Reg
iona
l Cla
iman
t C
ount
Rat
e (%
)
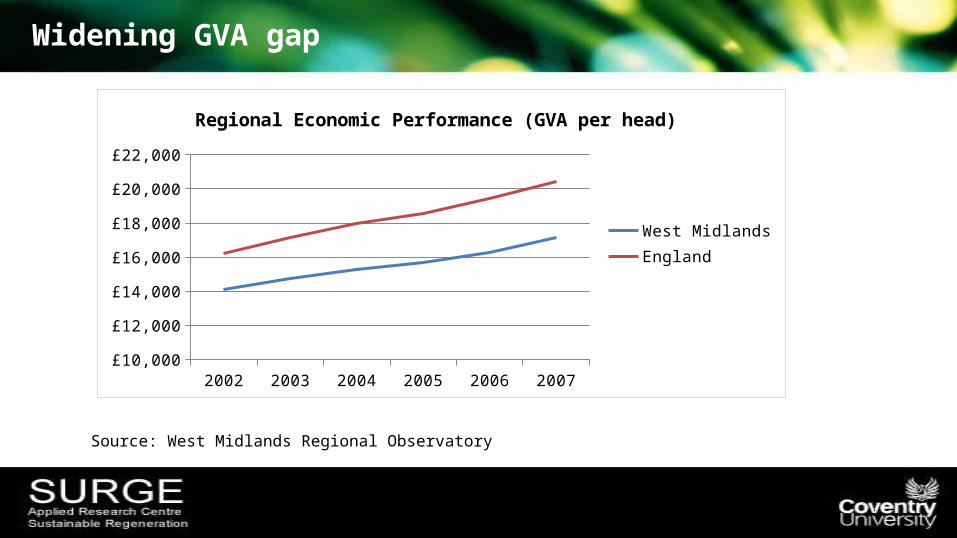
Widening GVA gap
2002 2003 2004 2005 2006 2007£10,000
£12,000
£14,000
£16,000
£18,000
£20,000
£22,000
Regional Economic Performance (GVA per head)
West MidlandsEngland
Source: West Midlands Regional Observatory

Weak Industrial Structure
Sector/Cluster Industry / service
Emerging high value added private sector activities
Environmental technologies (£3bn GVA, 74,000 jobs)Medical technologies (£250m GVA, 7,000 jobs)Specialist business services (£5bn GVA) Digital media (£150m GVA, 9,500 jobs) Electricity, gas and water (£2bn GVA, 14,000 jobs)
Traditional private sector activities Transport technologies (£4bn GVA, 92,000 jobs)Building technologies (£11bn GVA, 220,000 jobs) Food and drink (£3bn GVA, 58,000 jobs)
Lower value added private sector activities Business services (£23bn GVA, 440,000 jobs) Wholesale and retail (£12bn GVA, 360,000 jobs)
Public Sector activities Education (£6bn GVA, 240,000 jobs)Health and social care (£7bn GVA, 277,000 jobs)
In GVA and employment terms high value added activities make relatively modest contributions to the regional economy
Source: West Midlands Regional Observatory, 2010

West Midlands – Manufacturing GVA 1997-2009
Fell by 23%: worse than any other UK region
Over-valuation of sterling badly affected our auto and transport clusters
plus it wasn't until Mandelson arrived that Labour actually took industrial policy seriously.

West Midlands: The Recession and Beyond
• Output drop and unemployment rise in West Midlands worse than other regions during early part of the recession (not a surprise)
• BUT bounce back more rapid – rebalancing effect: certain parts of manufacturing, exports (?), modest ‘onshoring’
• Rapid jobs growth – out performing other regions.• Region reasonably placed (Deloitte, 2011): public sector job cuts; tax rises and
benefit cuts; ‘revival’ in manufacturing; weakness in fin services; house price falls.• PMI: 55.3 (53.1 UK) last 12 months; 58.5 (53.9 UK) last 3 months; 56.3 (53.0) last
month
• Challenges around youth unemployment esp. in cities • Private sector job growth insufficient to offset public sector cuts

West Mids Economic Performance

Not surprising given structure of West Mids economy
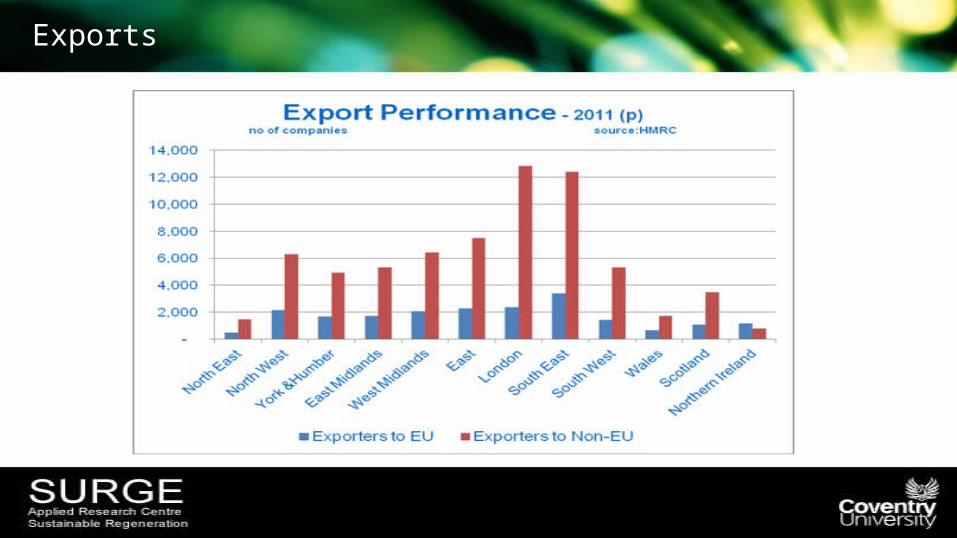
Exports

… where to?


Upgrading the ‘middle’?
Some recent shifts:• ‘Personalised manufacturing’... Car industry?• ‘Functional’ to ‘hybrid’ goods: hybridity. Creative/design and service
element• Brands, market repositioning• Links ‘creative’ non ‘creative’ sectors – ‘platforms’ – see report by Lisa
De Propris and others for NESTA on mapping creative industries• Diversity / ‘serendipitous spillovers’ / related variety: ‘smart
specialisation’• Clusters and a regional approach

And if we really want to ‘rebalance’ the economy...
Industrial Policy targeted at manufacturing• Capital allowances• Focus corporation tax cuts for manufacturing firms that increase
output• National insurance holidays for firms that take on workers• Better R&D tax credits• Better support for exporters• Manufacturing loan fund? (Automotive – Relocalisation /
Repatriation of supply chain)• Green Investment Bank? SME Bank?

Plus...
• Lessons from Germany: Part-time wage subsidies
• Takeover Law• Rebuilding fractured supply chains• Regional examples Smart specialisation• Other instruments: procurement policy
Policy: (How) can LEPs be effective RDAs?
‘Old’ system of RDAs not perfect BUT...
• Still not clear what regional growth drivers / levers LEPs will be able to influence
• What’s the Offer? Localism Act, RGF, Enterprise Zones, possibility for faster planning, Growing Places Fund, City Deals? ...

Recentralisation / Decentralisation
Recentralisation of policy to Whitehall Centralised industrial policy not likely to work LEPs: transport, housing, planning, enterprise (?) Skills? Business engagement? RGF big cut in funding – need scope for LEPs to
raise own finance (TIFs / Business Rates / bonds?) RDAs assets back to Whitehall / HCA. But, ‘City Deals’ a good first step?

Cont’d...
Risk of excessive fragmentation – functional economic geography? B’ham / Black Country?
Capability/capacity to make strategically informed decisions on economic development?
Need to retain key knowledge base built up by RDAs – RDA ‘Brain Drain’
• Need for ‘intermediate level’: Intelligence, monitoring, accessing EU funding, regional planning, clusters and innovation

Summary
• LEPs need genuine powers and the ability to raise funding: for some cities, govt listening?
• Right scale? Intermediate ‘join up’ of work of LEPs between local and national level critical to use public monies effectively – minimum: intelligence and info gathering base, pursuing effective cluster and innovation strategies and accessing EU funding

July 6th 2012 – The Belfry.Sustaining Competitiveness
July 6th 2012 – The Belfry.Sustaining Competitiveness