JULY 2020 - cdn.pficdn.com
17
The Global Fixed Income Business of Prudential Financial, Inc. Prudential Financial, Inc. of the U.S. is not affiliated with Prudential plc, headquartered in the United Kingdom or with Prudential Assurance Company, a subsidiary of M&G plc, incorporated in the United Kingdom.. For professional and institutional investor use only—not for use with the public. All investments involve risk, including the possible loss of capital. The Gilt Edge of the Virus Cloud Thoughts from our Chief Investment Strategist A Light at the End of the Tunnel Thoughts from our Chief Economist JULY 2020 QUARTERLY OUTLOOK
Transcript of JULY 2020 - cdn.pficdn.com

The Global Fixed Income Business of Prudential Financial, Inc. Prudential Financial, Inc. of the U.S. is not affiliated with Prudential plc, headquartered in
the United Kingdom or with Prudential Assurance Company, a subsidiary of M&G plc, incorporated in the United Kingdom.. For professional and
institutional investor use only—not for use with the public. All investments involve risk, including the possible loss of capital.
The Gilt Edge of the Virus Cloud
Thoughts from our Chief Investment Strategist
A Light at the End of the Tunnel
Thoughts from our Chief Economist
JULY 2020
QUARTERLY OUTLOOK
Fixed Income Overview
PGIM Fixed Income Third Quarter 2020 Outlook Page | 2
S
EC
TO
R V
IEW
S
Developed Market Rates 9
Constructive on U.S. duration amid a steep term premium and
expectations that a gradual economic recovery will prompt the
Fed to maintain a highly accommodative policy stance for the
foreseeable future. Consistent demand continues to anchor
core European rates.
Agency MBS 9
Attractive relative to intermediate Treasuries. Likely to
underperform other spread sectors as investors continue to
search for yield with an ongoing, gradual economic recovery.
Lower coupon 30-year TBA issues offer attractive carry vs.
rates amid favorable valuations. We maintain a focus on
specified pool in bonds away from Fed purchases.
Securitized Credit 10
Constructive. High-quality spreads may revisit their post-crisis
tights, yet mezzanine risk faces challenging fundamentals,
particularly for CLOs and CMBS with high retail and hospitality
exposures. Marginally more constructive on consumer and
commercial ABS and high-quality RMBS. As the U.S. election
approaches, securitized assets may outperform given the
reduced vulnerability to corporate tax and regulatory policy.
Investment Grade Corporate Bonds 11
Positive in light of central bank support and the prospects of
an economic recovery. Favor U.S. money center banks as well
as select BBB-rated issues, cyclical credits, and fallen angels.
Global Leveraged Finance 12
Spreads appear attractive vs. historic averages and will drive
strong returns for investors with longer-term time horizons.
Over the near term, the market may remain volatile (but
relatively range-bound) amid virus concerns. Active credit
selection will be a differentiating factor between managers in
volatile markets.
Emerging Market Debt 13
Positive. We continue to find value in EM spreads. Many
issuers pre-funded anticipated deterioration in economic
conditions and fiscal slippage. Spreads for certain EM
sovereign and corporate issuers across the credit spectrum
are likely to tighten. Further alpha in local rates may emerge
from curve positioning as well as in markets with positive real
rates and expectations for policy rate cuts. We are more
cautious on EMFX and recognize attractive relative-value
opportunities between variously affected currencies.
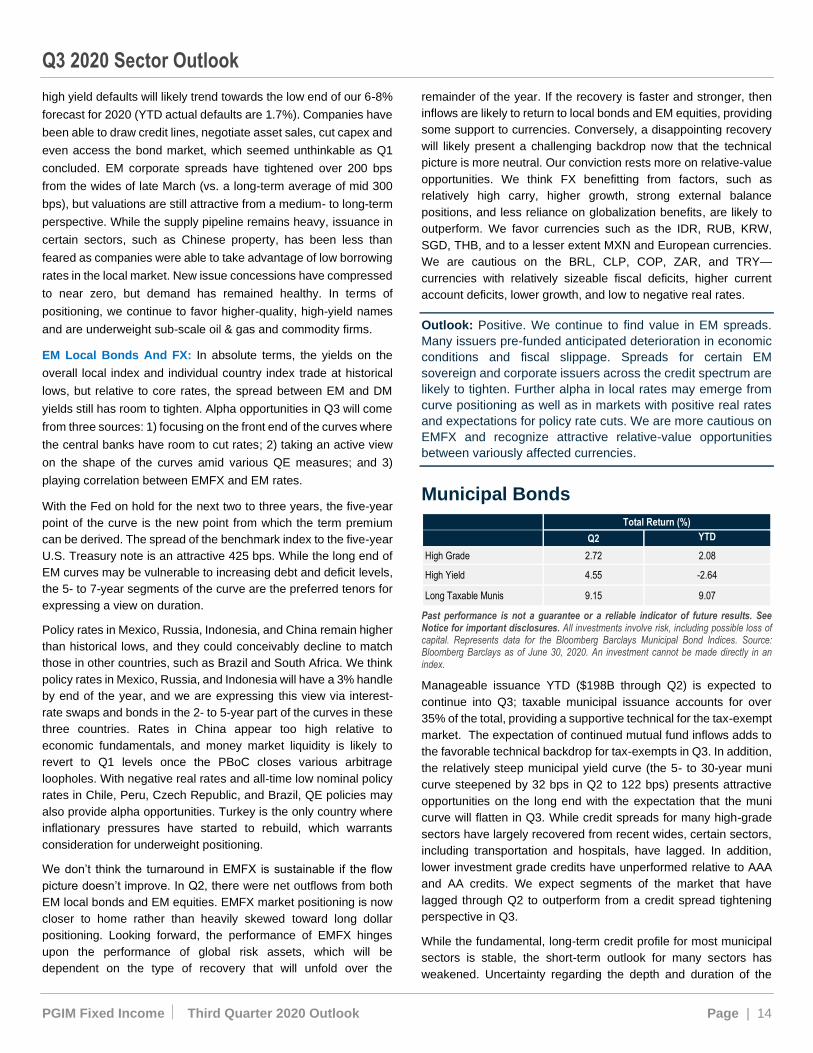
Municipal Bonds 14
A constructive backdrop amid attractive valuations for many
market segments and supportive technical conditions. Yet, a
near-term cautious view is warranted given the recent spike in
U.S. COVID cases. Without additional near-term federal
support for states and localities, the sector could experience
an increase in volatility.
Since the coronavirus swept across the globe and prompted
economic shutdowns of varying degrees, “uncertainty” has become
one of the operative terms for investment outlooks. Yet, as the first
half of 2020 demonstrated, uncertainty can cut two ways: the first
quarter ended with a market rout of historic proportions only for
performance to snap back in the second quarter with a boost from
global fiscal and monetary stimulus.
• What might be next for developed market interest rates, credit
spreads, and currencies? In “The Gilt Edge of the Virus Cloud,”
Robert Tipp, CFA, Chief Investment Strategist and Head of
Global Bonds, looks at the prevailing factors that may determine
sector performance as the shadow of COVID-19 lingers over the
markets.
• In “A Light at the End of the Tunnel, Nathan Sheets, PhD, Chief
Economist and Head of Global Macroeconomic Research,
addresses the prospects for inflation and growth amid the
barrage of stimulus efforts as well as how the global economy
may evolve once the virus clears.
Recent Thought Leadership on
PGIMFixedIncome.com:
The Prospects for the Emerging Markets—Looking Beyond
the Storm
All The Credit, Episode 5: Pandemic Response—Preparation,
Planning, and the Path Forward
Five Big Themes that Will Frame the Post-Virus Economy
FOMC Brings Back the Projections; The Long Trek Back
Boosts Treasuries
On the Front Lines of Climate Change—The Opportunity in
P&C Insurers
All the Credit, Episode 4: The Emerging Path for Investors
Globalization 2.0—A New Synthesis
Current EU Crisis to Boost Solidarity, Not Fragmentation
The ECB Takes Further Steps to Support the Banking
System; Stands By "To Do More"
Mounting U.S. Public Debt: How Worried Should We Be?
When Credit Analysis Becomes Paramount

Bond Market Outlook
PGIM Fixed Income Third Quarter 2020 Outlook Page | 3
The Gilt Edge of the Virus Cloud
A whirlwind first half of the year saw a near total collapse in activity
and markets followed by a quick return to modest growth—but a
seemingly outsized market recovery. Now, we are once again at a
crossroads where the tide of resurgent virus cases is on a collision
course with improving market sentiment. Which will prevail, the
markets or the virus? Or will geopolitics have a say?
In our estimation, the short answer is that bonds appear set to
perform reasonably well over the intermediate to long term,
although the pace of the rally may slow along an increasingly
bumpy road.
Perhaps even more than in the first half of the year, the theme of
credit selection will be a key determinant of performance in the
months ahead as the fundamental impact of the virus and the drop
in oil prices takes its cumulative toll on credit quality. So, while the
result of the markets’ long journey should be strong returns driven
by further spread tightening, those average returns over the long
run will not only abstract from the interim volatility, but they will also
gloss over the minefield of downgrades and defaults that will need
to be dodged to reap the benefits.
For Starters: Where Are We?
Let’s back up and recap the first half in one sentence: despite the
ongoing, risk-filled political horizon and virus progression, the
crater that the markets left in Q1 was more than halfway backfilled
by the unprecedented bulldozer of fiscal and monetary stimulus in
Q2 (Figure 1).
In our last Quarterly Outlook—right after the meteor struck—our
hypothesis was that the oncoming tsunami of fiscal and monetary
stimulus would probably fuel a market recovery, featuring strong
spread market performance, relatively stable long-term
government yields, and maybe a weaker dollar. And we did not
expect the markets to wait to see the whites of the recovery’s eyes,
but anticipated that the market recovery, as is typical, would start
well ahead of the turn in the economy. Since then, spreads have
recovered the lion’s share of the damage from Q1, and rates have
begun to carve out what looks to be a durable, low post-Corona
range of 50-100 bps for the 10-year Treasury yield for the
foreseeable future.
As of now, it appears that the markets’ leap of faith that global
growth would turn positive—notwithstanding the virus’ varied
course—has come to pass as economies have begun to grow
again. But while COVID cases and deaths have fallen in many
regions, new risks have come to the fore from the virus as well as
from the political and policy fronts.
Figure 1: Leveraged Finance, EM, and Long IG Corporates Led
the Q2 Rally
Individual FI Sectors Q2 2020 YTD 2020 2019 2018 2017
European Leveraged Loans 12.95 -3.36 6.87 2.93 -0.48
EM Debt Hard Currency 12.26 -2.76 15.04 -4.26 10.26
U.S. Long IG Corporates 12.11 6.72 23.9 -7.24 12.09
European High Yield Bonds 11.16 -4.95 11.29 -3.63 6.74
U.S. Leveraged Loans 9.71 -4.76 8.17 1.14 4.09
U.S. High Yield Bonds 9.61 -4.78 14.41 -2.26 7.48
U.S. IG Corporate Bonds 9.36 5.18 14.50 -2.51 6.42
European IG Corporates 5.28 -1.19 6.24 -1.25 2.41
EM Local (Hedged) 5.01 3.51 9.14 0.75 3.68
CMBS 3.95 5.19 8.29 0.78 3.35
EM Currencies 3.42 -5.34 5.20 -3.33 11.54
Municipal Bonds 2.72 2.08 7.54 1.28 5.45
Agency MBS 0.94 3.50 6.35 0.99 2.47
U.S. Treasuries 0.48 8.71 6.86 0.86 2.31
Long U.S. Treasuries 0.25 21.2 14.80 -1.84 8.53
Multi-Sector 2019 2018 2017
Global Agg. (Unhedged) 3.32 2.98 6.84 -1.2 7.39
U.S. Aggregate 2.90 6.14 8.72 0.01 3.54
Global Agg. Hedged 2.42 3.90 8.22 1.76 3.04
Euro Aggregate 2.39 1.24 5.98 0.41 0.68
Yen Aggregate -0.56 -0.90 1.64 0.93 0.18
Other Sectors 2019 2018 2017
S&P 500 Index 20.54 -3.08 32.6 -4.4 21.26
3-month LIBOR 0.19 0.62 2.4 2.23 1.22
U.S. Dollar -1.67 1.04 1.35 4.9 -7.85
Past performance is not a guarantee or a reliable indicator of future results. See Notice for important disclosures and full index names. All investments involve risk, including possible loss of capital. Sources: Bloomberg Barclays except EMD (J.P. Morgan), HY (ICE BofAML), Bank Loans (Credit Suisse). European returns are unhedged in euros unless otherwise indicated. Performance is for representative indices as of June 30, 2020. An investment cannot be made directly in an index.
The Virus: Outcome vs. Expectations
To some extent, the path of the virus has gone as expected, at least
in some prominent locations: there have been soaring cases,
deaths, and lockdowns. All of these are at some stage of receding.
Despite the unlocking, locations in Asia, the Northeastern U.S., and
across Europe have so far avoided any major resurgence of the
virus.
One lingering question—which areas have yet to experience a
significant first wave of the virus—has been answered with a
vengeance as cases have surged in emerging market countries
(e.g., India and across Latin America), as well as across the U.S.
“Sun Belt,” which encompasses a substantial swath of the land
mass and population. Will mortality be the same or lower? Will the

Bond Market Outlook
PGIM Fixed Income Third Quarter 2020 Outlook Page | 4
surge be similarly short lived as seen elsewhere, or will these late
breaking/arrival cycles take longer to play out?
While these may seem like key questions, the fact is that the
widespread resumption of economic activity has not been entirely
tied to the timing of the “unlocking,” or lifting of restrictions, on
human activity. Therefore, over a broad range of virus outcomes, it
seems plausible to us that the combination of stimulus and adaptive
social behavior will result, on net, in a general trend of expanding
economic activity. And for markets, that combination has probably
been the key to the current market buoyancy.
The Old, and Possibly New, of Policy/Geopolitics
As if the virus and its toll weren’t enough to deal with, the political
and geopolitical risk horizons are likely to continue playing a
prominent market role. As the U.S. elections approach, the ongoing
trade war appears set to intensify, at least in terms of headline
noise to rack up political points, but with presumably less of an
intended economic bite considering that could overturn the
economy and the markets.
Perhaps just as important, with presumptive Democratic nominee
Joe Biden extending his lead in the U.S. polls and talking up plans
for corporate tax hikes, investors may encounter concerns—
whether justified or not—about a less business-friendly
administration. However, we see the potential of higher corporate
taxes in the event of a Biden victory or democratic sweep as
perhaps more relevant to the equity markets as earnings and
valuations may be more affected by a possible increase in
corporate tax rates and/or a change in the regulatory environment.
The Bottom Line in Three Parts
Given the troubled event horizon that we face, what’s the bottom
line for the markets? Let’s take that in three parts: interest rates,
credit spreads, and currencies.
Outlook Part I: Where to for Rates? Even
Lower for Even Longer
Figure 1: Rates—Prior to the Crisis, Inflation and Interest
Rates Were Already Well Below 2%
Figure 2: Rates—Lousy Growth Was Another Sign that Rates
May Have Been Too High Prior to the Crisis
Figure 3: Among the G3, Bund and JGB Yields Did Not Decline
Further as a Result of the Virus; Why?
Source for Figures 1-3: Bloomberg as of July 2020
If the bottom line is that growth has resumed, then shouldn’t interest
rates begin to normalize? To answer that question, let’s get
oriented: rates in Japan and Europe remain where they were pre-
crisis, when inflation was below target, and growth was already in
a torpor (see preceding Figures). Even if COVID is milder than
expected, it’s not clear that rates in Japan or Europe should be any
higher.
As for the U.S., there is a greater risk that rates could flash higher
on fears of stronger-than-expected growth. Yet, prior to COVID,
with a 10-year Treasury yield of mid-1%, growth was moderate,
inflation was below target, and the dollar was steadily rising. Even
with a clean bill of health, it’s not clear that the 10-year should top
1% and head for the “high” mid-1% levels of the “days of old.” With
the additional long-term headwinds courtesy of the virus, the 10-
year Treasury yield seems more likely to remain in the bottom half
of the recent 50-100 bps range for at least the balance of this year
if not beyond.
-0.5
0
0.5
1
1.5
2
2.5
%
U.S. Core PCE (YoY)Eurozone Core Consumer Prices (YoY)Japan Core CPI (YoY)
-30
-20
-10
0
10
%
Eurozone Industrial Production
U.S. Industrial Production
Japan Industrial Production
-1
-0.5
0
0.5
1
1.5
2
%
U.S. 10-year Yield
German 10-year Yield
Japanese 10-year Yield

Bond Market Outlook
PGIM Fixed Income Third Quarter 2020 Outlook Page | 5
While that may sound ludicrous to some, in light of the building
secular forces pushing rates lower—high indebtedness, aging
populations, shrinking workforces, and the resultant below target
inflation and modest growth—these rates strike us as the expected
natural consequence. The fact that global forward-rate curves
generally remain positively sloped provides an opportunity to boost
returns and hedge downside economic risk by maintaining a
generally long-duration posture while picking up yield and capital
appreciation by rolling down steep curves.
Outlook Part II—Credit Spreads: The Gilt
Edge of the Virus Cloud
While an improving economic picture should create a tail wind for
spread product, the fact is that spread markets have already priced
in a substantial recovery.
As a result, at this point there is clearly the risk, if not the likelihood,
that the market will periodically be unnerved by the realities of a
veritable grab bag of risks—uneven lockdowns, low summer
liquidity, fears of a new U.S. administration, trade war flare ups, and
deteriorating credit quality and rising defaults.
While all of these risks deserve respect—and can undoubtedly
contribute to credit risk and market volatility—one mitigating
positive is that at least corporate debt holders may benefit from
improved alignment with the interests of corporate management. In
buoyant times, management may look to boost stock prices at the
expense of bondholders, but in the current environment,
management teams are focused on retaining their credit ratings
and market access in their bids to survive.
In the end, investors who can avoid the credit hotspots and blow
ups should experience strong returns from tighter credit spreads
12-24 months down the road. The uneven road to economic
recovery will be strewn with potholes, but these are likely to be
offset by fiscal and monetary policy support and investors’ search
for yield as they float debtors until economies recover and
underlying credit risk stabilizes.
Outlook Part III: What’s Next for Currencies?
Bounce Realized; Back to Caution
At the end of Q1 2020, the appreciation of the dollar seemed at
odds with the Fed’s reductions in U.S. short term interest rates and
massive monetary expansion. The U.S. had lost its carry
advantage and the dollar was precariously perched at a high level.
Shouldn’t currencies recover—or at least get a reprieve—and the
dollar decline? The answer in Q2 was “yes.” But that was then, and
now things look less clear. Uncertainties from geopolitics and the
virus look elevated, and currency under valuations versus the dollar
look less extended. So, as we pass through the potentially less risk-
tolerant, low-liquidity environment of the Northern Hemisphere’s
summer, the dollar’s downward course appears less assured, and
it may even get a periodic boost from bouts of uncertainty and
flights to quality.
The Bottom Line: Following the Q2 recovery, the market has
less upside, and there could be a rise in volatility thanks to
myriad risk factors and reduced summer liquidity. But the strong
likelihood of ongoing fiscal and monetary tailwinds and
economic recovery suggest a continuation of the Q2 trends: low
rates fuel a search for yield in the face of ongoing credit
challenges, long-term government rates remain in check, and
spreads tighten ahead of, or seemingly at odds with,
fundamentals. Meanwhile, the uncertainties and mixed liquidity
conditions may create bouts of market volatility and above-
average opportunities to add value through sector allocation,
credit selection, and positioning in currencies and interest rates.

Global Economic Outlook
PGIM Fixed Income Third Quarter 2020 Outlook Page | 6
A Light at the End of the Tunnel The global economy has absorbed the most severe hit in decades,
with an estimated 14% annualized contraction during the first half,
roughly three times the drop during the worst of the global financial
crisis (Figure 1). The coronavirus and the associated lockdowns
have taken an unimaginably heavy toll on economic performance.
Figure 1: Global Real GDP Growth
Source: Haver Analytics
Looking ahead, we see the trajectory of global growth as depending
on three key factors—the evolution of the virus, the psychology of
consumers, and the extent of long-term scarring. The following is
our take on each of these issues:
• How will the virus evolve from here? While we were expecting
further episodic flare-ups in the virus, it remains to be seen
whether the intensified outbreak in some parts of the U.S. is
consistent with this expectation, or if it represents something
more severe. In any event, political leaders and the public seem
to be gradually learning how to better control the virus. Our
baseline is that these measures, coupled with ongoing advances
in testing and treatment, will be sufficient to prevent another
round of broad (and simultaneous) lockdowns of major
economies. The virus will temper the recovery, but it won’t again
bring activity to a halt.
• When will consumers feel safe again? The behavior of
consumers is an important hinge point for the recovery. For the
economy to bounce back, consumers must feel sufficiently safe
from infection that they are willing to start spending again,
including on services. As a related matter, they must also feel
sufficiently secure economically to start spending down
precautionary saving and, at least to some extent, taking on debt.
To date, the data have been broadly encouraging on this score.
• How much permanent economic scarring will there be? Scarring
could occur in several ways—otherwise efficient firms could go
out of business, workers may remain unemployed (and see their
skills depreciate), and rising debt levels in the public and private
sectors could create headwinds for the economy. While it’s too
early to assess the extent of these effects, we judge the
likelihood of such scars to be high. The question is how severe
will they be? In this respect, the sharp decline in the U.S.
unemployment rate over the past two months should help reduce
the risks of long-term damage to the labor market.
With these considerations in mind, we see a gradual recovery for
the global economy as the most likely outcome, with the level of
GDP picking up in the second half of the year. However, given the
headwinds, activity is unlikely to reach its Q4 2019 level until late
2021 or somewhat thereafter. We view this path as a useful
baseline, but we also emphasize the first-order upside and
downside risks. The economy could be stronger than this—for
example, if the virus recedes more quickly or consumer psychology
proves more resilient. Conversely, the public health community has
warned about the possibility of a concentrated second wave of the
virus, most likely in the fall, which could require further lockdowns
and throw the economy back into recession.
The remainder of this essay examines the rudiments of our outlook
in greater detail. We look first at the contraction that occurred in the
first half of the year, as well as some early signs of improvement in
the high-frequency data. Next, we consider the massive monetary
and fiscal response that national authorities have implemented,
which should help support a recovery in coming quarters. We
conclude with a few thoughts regarding the uncertainties that cloud
the outlook.
The Unprecedented Downturn—And Some
Glimmers of Hope
The previous section highlighted the extraordinary drop in global
real GDP growth. The world economy has simultaneously
sustained unprecedented shocks to supply and demand. No major
economy has been exempt from the virus’ blows.
• China was the first to deal with the disruptions from the virus,
with its GDP dropping sharply in Q1. Subsequently, the Chinese
economy has recorded a gradual, but somewhat uneven,
recovery. The bounce back in industrial production has
outstripped that in retail sales. Notably, policy stimulus appears
to increasingly be taking hold and should provide additional
support.
• The U.S. economy is now in recession, with Q2 GDP plunging at
an estimated 30-35% annual pace. That said, the experience
with the virus has varied notably across regions. During the
spring, the Northeast was pummeled while many southern and
western states were comparatively unscathed. More recently,
the tables have turned. Some states that largely dodged the first
wave—such as Texas, Florida, and Arizona—are now seeing
rising case counts. In contrast, the Northeast is gradually
emerging from lockdowns and seems poised for recovery.
-20
-15
-10
-5
0
5
10
-4 -2 0 2 4 6
%, S
AA
R
Quarters
Global Financial Crisis (t0: 2008Q3)
Coronavirus Pandemic (t0: 2020Q1)
Est.
(t0 :2008Q3)
(t0 :2020Q1)
Global Economic Outlook
PGIM Fixed Income Third Quarter 2020 Outlook Page | 7
• The virus hit activity in Europe even harder than it struck U.S.
activity. This reflects that the major European countries were
struck roughly in parallel. The good news is that they now look to
be on the other side of the outbreak. Further, the structure of their
labor markets, along with wage subsidies programs, have
allowed them to avoid the sharp run-up in unemployment
experienced in the U.S. Despite these positive factors, it’s difficult
to see Europe outpacing the global recovery in any sustained
way, given its dependence on external demand.
• Finally, the emerging markets have been hit by severe capital
outflows, the decline in global demand, and, more recently, some
of these countries have faced rising infections and fatalities.
Further, a large subset are commodity exporters. While financial
conditions in these countries have now healed some, with the
recovery in global markets and the IMF ramping up financial
assistance, the level of stresses remains high.1
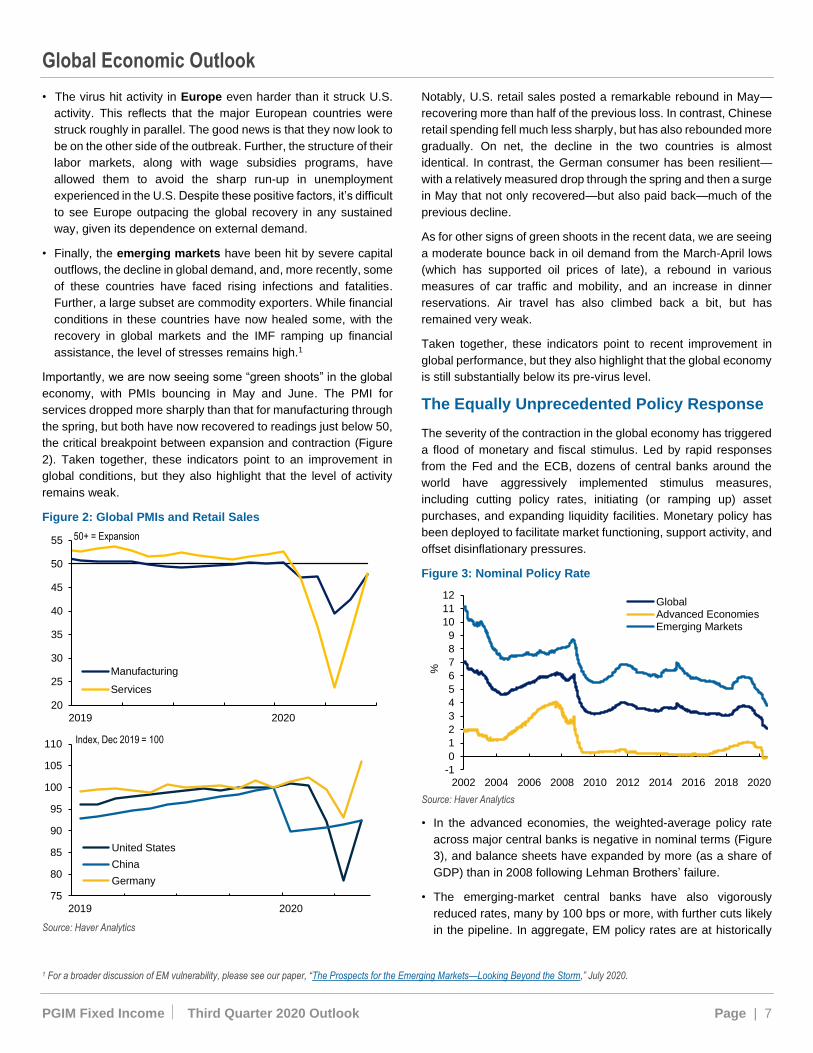
Importantly, we are now seeing some “green shoots” in the global
economy, with PMIs bouncing in May and June. The PMI for
services dropped more sharply than that for manufacturing through
the spring, but both have now recovered to readings just below 50,
the critical breakpoint between expansion and contraction (Figure
2). Taken together, these indicators point to an improvement in
global conditions, but they also highlight that the level of activity
remains weak.
Figure 2: Global PMIs and Retail Sales
Source: Haver Analytics
1 For a broader discussion of EM vulnerability, please see our paper, “The Prospects for the Emerging Markets—Looking Beyond the Storm,” July 2020.
Notably, U.S. retail sales posted a remarkable rebound in May—
recovering more than half of the previous loss. In contrast, Chinese
retail spending fell much less sharply, but has also rebounded more
gradually. On net, the decline in the two countries is almost
identical. In contrast, the German consumer has been resilient—
with a relatively measured drop through the spring and then a surge
in May that not only recovered—but also paid back—much of the
previous decline.
As for other signs of green shoots in the recent data, we are seeing
a moderate bounce back in oil demand from the March-April lows
(which has supported oil prices of late), a rebound in various
measures of car traffic and mobility, and an increase in dinner
reservations. Air travel has also climbed back a bit, but has
remained very weak.
Taken together, these indicators point to recent improvement in
global performance, but they also highlight that the global economy
is still substantially below its pre-virus level.
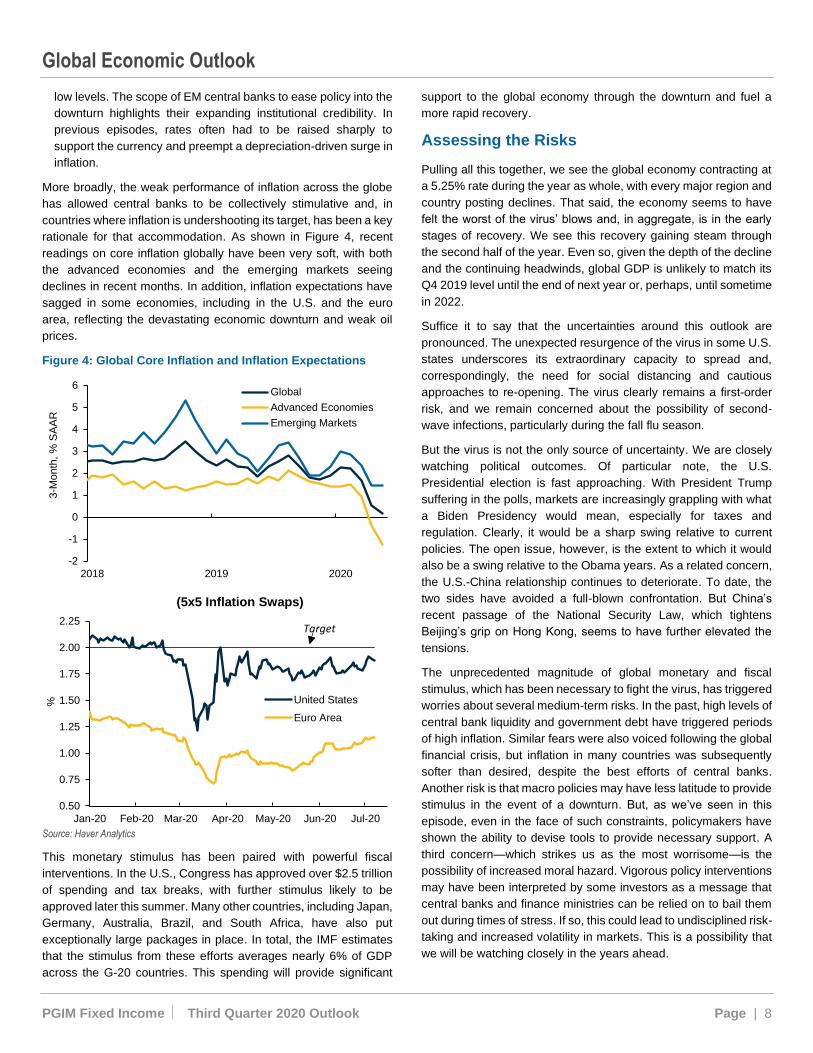
The Equally Unprecedented Policy Response
The severity of the contraction in the global economy has triggered
a flood of monetary and fiscal stimulus. Led by rapid responses
from the Fed and the ECB, dozens of central banks around the
world have aggressively implemented stimulus measures,
including cutting policy rates, initiating (or ramping up) asset
purchases, and expanding liquidity facilities. Monetary policy has
been deployed to facilitate market functioning, support activity, and
offset disinflationary pressures.
Figure 3: Nominal Policy Rate
Source: Haver Analytics
• In the advanced economies, the weighted-average policy rate
across major central banks is negative in nominal terms (Figure
3), and balance sheets have expanded by more (as a share of
GDP) than in 2008 following Lehman Brothers’ failure.
• The emerging-market central banks have also vigorously
reduced rates, many by 100 bps or more, with further cuts likely
in the pipeline. In aggregate, EM policy rates are at historically
20
25
30
35
40
45
50
55
2019 2020
Manufacturing
Services
50+ = Expansion
75
80
85
90
95
100
105
110
2019 2020
United States
China
Germany
Index, Dec 2019 = 100
-1
0
1
2
3
4
5
6
7
8
9
10
11
12
2002 2004 2006 2008 2010 2012 2014 2016 2018 2020
%
GlobalAdvanced EconomiesEmerging Markets
Global Economic Outlook
PGIM Fixed Income Third Quarter 2020 Outlook Page | 8
low levels. The scope of EM central banks to ease policy into the
downturn highlights their expanding institutional credibility. In
previous episodes, rates often had to be raised sharply to
support the currency and preempt a depreciation-driven surge in
inflation.
More broadly, the weak performance of inflation across the globe
has allowed central banks to be collectively stimulative and, in
countries where inflation is undershooting its target, has been a key
rationale for that accommodation. As shown in Figure 4, recent
readings on core inflation globally have been very soft, with both
the advanced economies and the emerging markets seeing
declines in recent months. In addition, inflation expectations have
sagged in some economies, including in the U.S. and the euro
area, reflecting the devastating economic downturn and weak oil
prices.
Figure 4: Global Core Inflation and Inflation Expectations
Source: Haver Analytics
This monetary stimulus has been paired with powerful fiscal
interventions. In the U.S., Congress has approved over $2.5 trillion
of spending and tax breaks, with further stimulus likely to be
approved later this summer. Many other countries, including Japan,
Germany, Australia, Brazil, and South Africa, have also put
exceptionally large packages in place. In total, the IMF estimates
that the stimulus from these efforts averages nearly 6% of GDP
across the G-20 countries. This spending will provide significant
support to the global economy through the downturn and fuel a
more rapid recovery.
Assessing the Risks
Pulling all this together, we see the global economy contracting at
a 5.25% rate during the year as whole, with every major region and
country posting declines. That said, the economy seems to have
felt the worst of the virus’ blows and, in aggregate, is in the early
stages of recovery. We see this recovery gaining steam through
the second half of the year. Even so, given the depth of the decline
and the continuing headwinds, global GDP is unlikely to match its
Q4 2019 level until the end of next year or, perhaps, until sometime
in 2022.
Suffice it to say that the uncertainties around this outlook are
pronounced. The unexpected resurgence of the virus in some U.S.
states underscores its extraordinary capacity to spread and,
correspondingly, the need for social distancing and cautious
approaches to re-opening. The virus clearly remains a first-order
risk, and we remain concerned about the possibility of second-
wave infections, particularly during the fall flu season.
But the virus is not the only source of uncertainty. We are closely
watching political outcomes. Of particular note, the U.S.
Presidential election is fast approaching. With President Trump
suffering in the polls, markets are increasingly grappling with what
a Biden Presidency would mean, especially for taxes and
regulation. Clearly, it would be a sharp swing relative to current
policies. The open issue, however, is the extent to which it would
also be a swing relative to the Obama years. As a related concern,
the U.S.-China relationship continues to deteriorate. To date, the
two sides have avoided a full-blown confrontation. But China’s
recent passage of the National Security Law, which tightens
Beijing’s grip on Hong Kong, seems to have further elevated the
tensions.
The unprecedented magnitude of global monetary and fiscal
stimulus, which has been necessary to fight the virus, has triggered
worries about several medium-term risks. In the past, high levels of
central bank liquidity and government debt have triggered periods
of high inflation. Similar fears were also voiced following the global
financial crisis, but inflation in many countries was subsequently
softer than desired, despite the best efforts of central banks.
Another risk is that macro policies may have less latitude to provide
stimulus in the event of a downturn. But, as we’ve seen in this
episode, even in the face of such constraints, policymakers have
shown the ability to devise tools to provide necessary support. A
third concern—which strikes us as the most worrisome—is the
possibility of increased moral hazard. Vigorous policy interventions
may have been interpreted by some investors as a message that
central banks and finance ministries can be relied on to bail them
out during times of stress. If so, this could lead to undisciplined risk-
taking and increased volatility in markets. This is a possibility that
we will be watching closely in the years ahead.
-2
-1
0
1
2
3
4
5
6
2018 2019 2020
3-M
onth
, %
SA
AR
Global
Advanced Economies
Emerging Markets
0.50
0.75
1.00
1.25
1.50
1.75
2.00
2.25
Jan-20 Feb-20 Mar-20 Apr-20 May-20 Jun-20 Jul-20
%
(5x5 Inflation Swaps)
United States
Euro Area
Target
Q3 2020 Sector Outlook
PGIM Fixed Income Third Quarter 2020 Outlook Page | 9
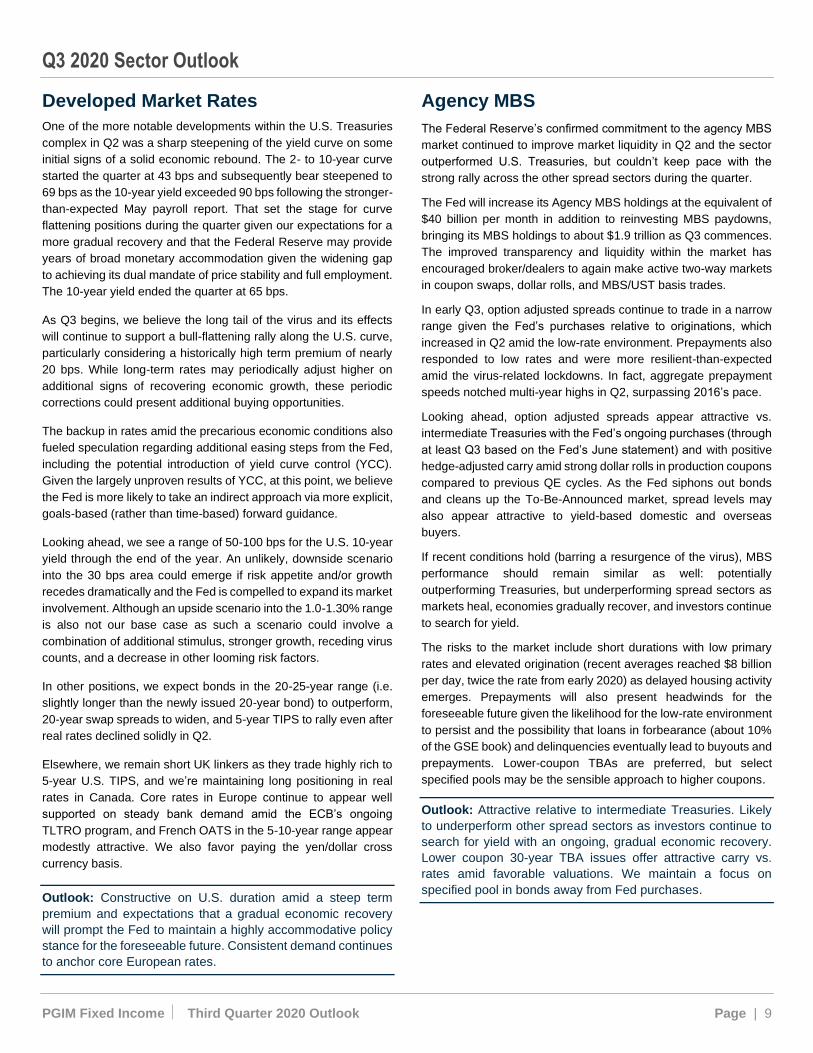
Developed Market Rates
One of the more notable developments within the U.S. Treasuries
complex in Q2 was a sharp steepening of the yield curve on some
initial signs of a solid economic rebound. The 2- to 10-year curve
started the quarter at 43 bps and subsequently bear steepened to
69 bps as the 10-year yield exceeded 90 bps following the stronger-
than-expected May payroll report. That set the stage for curve
flattening positions during the quarter given our expectations for a
more gradual recovery and that the Federal Reserve may provide
years of broad monetary accommodation given the widening gap
to achieving its dual mandate of price stability and full employment.
The 10-year yield ended the quarter at 65 bps.
As Q3 begins, we believe the long tail of the virus and its effects
will continue to support a bull-flattening rally along the U.S. curve,
particularly considering a historically high term premium of nearly
20 bps. While long-term rates may periodically adjust higher on
additional signs of recovering economic growth, these periodic
corrections could present additional buying opportunities.
The backup in rates amid the precarious economic conditions also
fueled speculation regarding additional easing steps from the Fed,
including the potential introduction of yield curve control (YCC).
Given the largely unproven results of YCC, at this point, we believe
the Fed is more likely to take an indirect approach via more explicit,
goals-based (rather than time-based) forward guidance.
Looking ahead, we see a range of 50-100 bps for the U.S. 10-year
yield through the end of the year. An unlikely, downside scenario
into the 30 bps area could emerge if risk appetite and/or growth
recedes dramatically and the Fed is compelled to expand its market
involvement. Although an upside scenario into the 1.0-1.30% range
is also not our base case as such a scenario could involve a
combination of additional stimulus, stronger growth, receding virus
counts, and a decrease in other looming risk factors.
In other positions, we expect bonds in the 20-25-year range (i.e.
slightly longer than the newly issued 20-year bond) to outperform,
20-year swap spreads to widen, and 5-year TIPS to rally even after
real rates declined solidly in Q2.
Elsewhere, we remain short UK linkers as they trade highly rich to
5-year U.S. TIPS, and we’re maintaining long positioning in real
rates in Canada. Core rates in Europe continue to appear well
supported on steady bank demand amid the ECB’s ongoing
TLTRO program, and French OATS in the 5-10-year range appear
modestly attractive. We also favor paying the yen/dollar cross
currency basis.
Outlook: Constructive on U.S. duration amid a steep term
premium and expectations that a gradual economic recovery
will prompt the Fed to maintain a highly accommodative policy
stance for the foreseeable future. Consistent demand continues
to anchor core European rates.
Agency MBS
The Federal Reserve’s confirmed commitment to the agency MBS
market continued to improve market liquidity in Q2 and the sector
outperformed U.S. Treasuries, but couldn’t keep pace with the
strong rally across the other spread sectors during the quarter.
The Fed will increase its Agency MBS holdings at the equivalent of
$40 billion per month in addition to reinvesting MBS paydowns,
bringing its MBS holdings to about $1.9 trillion as Q3 commences.
The improved transparency and liquidity within the market has
encouraged broker/dealers to again make active two-way markets
in coupon swaps, dollar rolls, and MBS/UST basis trades.
In early Q3, option adjusted spreads continue to trade in a narrow
range given the Fed’s purchases relative to originations, which
increased in Q2 amid the low-rate environment. Prepayments also
responded to low rates and were more resilient-than-expected
amid the virus-related lockdowns. In fact, aggregate prepayment
speeds notched multi-year highs in Q2, surpassing 2016’s pace.
Looking ahead, option adjusted spreads appear attractive vs.
intermediate Treasuries with the Fed’s ongoing purchases (through
at least Q3 based on the Fed’s June statement) and with positive
hedge-adjusted carry amid strong dollar rolls in production coupons
compared to previous QE cycles. As the Fed siphons out bonds
and cleans up the To-Be-Announced market, spread levels may
also appear attractive to yield-based domestic and overseas
buyers.
If recent conditions hold (barring a resurgence of the virus), MBS
performance should remain similar as well: potentially
outperforming Treasuries, but underperforming spread sectors as
markets heal, economies gradually recover, and investors continue
to search for yield.
The risks to the market include short durations with low primary
rates and elevated origination (recent averages reached $8 billion
per day, twice the rate from early 2020) as delayed housing activity
emerges. Prepayments will also present headwinds for the
foreseeable future given the likelihood for the low-rate environment
to persist and the possibility that loans in forbearance (about 10%
of the GSE book) and delinquencies eventually lead to buyouts and
prepayments. Lower-coupon TBAs are preferred, but select
specified pools may be the sensible approach to higher coupons.
Outlook: Attractive relative to intermediate Treasuries. Likely
to underperform other spread sectors as investors continue to
search for yield with an ongoing, gradual economic recovery.
Lower coupon 30-year TBA issues offer attractive carry vs.
rates amid favorable valuations. We maintain a focus on
specified pool in bonds away from Fed purchases.
Q3 2020 Sector Outlook
PGIM Fixed Income Third Quarter 2020 Outlook Page | 10
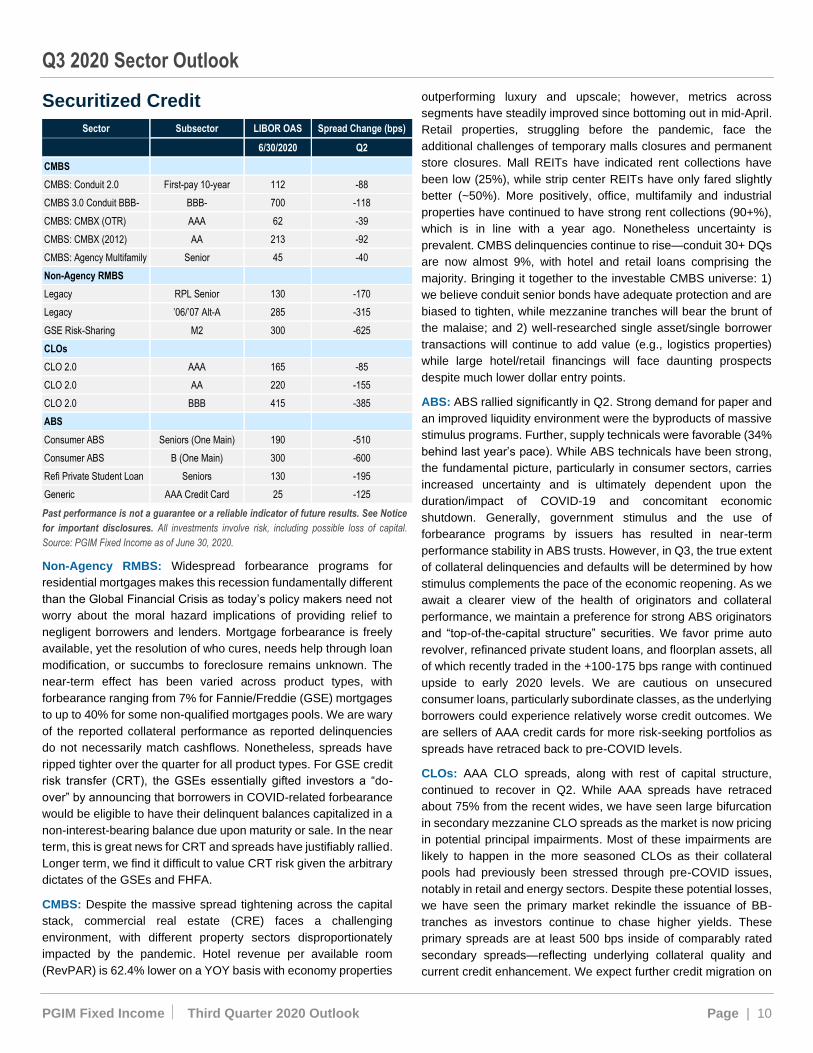
Securitized Credit
Sector Subsector LIBOR OAS Spread Change (bps)
6/30/2020 Q2
CMBS
CMBS: Conduit 2.0 First-pay 10-year 112 -88
CMBS 3.0 Conduit BBB- BBB- 700 -118
CMBS: CMBX (OTR) AAA 62 -39
CMBS: CMBX (2012) AA 213 -92
CMBS: Agency Multifamily Senior 45 -40
Non-Agency RMBS
Legacy RPL Senior 130 -170
Legacy ’06/’07 Alt-A 285 -315
GSE Risk-Sharing M2 300 -625
CLOs
CLO 2.0 AAA 165 -85
CLO 2.0 AA 220 -155
CLO 2.0 BBB 415 -385
ABS
Consumer ABS Seniors (One Main) 190 -510
Consumer ABS B (One Main) 300 -600
Refi Private Student Loan Seniors 130 -195
Generic AAA Credit Card 25 -125
Past performance is not a guarantee or a reliable indicator of future results. See Notice
for important disclosures. All investments involve risk, including possible loss of capital.
Source: PGIM Fixed Income as of June 30, 2020.
Non-Agency RMBS: Widespread forbearance programs for
residential mortgages makes this recession fundamentally different
than the Global Financial Crisis as today’s policy makers need not
worry about the moral hazard implications of providing relief to
negligent borrowers and lenders. Mortgage forbearance is freely
available, yet the resolution of who cures, needs help through loan
modification, or succumbs to foreclosure remains unknown. The
near-term effect has been varied across product types, with
forbearance ranging from 7% for Fannie/Freddie (GSE) mortgages
to up to 40% for some non-qualified mortgages pools. We are wary
of the reported collateral performance as reported delinquencies
do not necessarily match cashflows. Nonetheless, spreads have
ripped tighter over the quarter for all product types. For GSE credit
risk transfer (CRT), the GSEs essentially gifted investors a “do-
over” by announcing that borrowers in COVID-related forbearance
would be eligible to have their delinquent balances capitalized in a
non-interest-bearing balance due upon maturity or sale. In the near
term, this is great news for CRT and spreads have justifiably rallied.
Longer term, we find it difficult to value CRT risk given the arbitrary
dictates of the GSEs and FHFA.
CMBS: Despite the massive spread tightening across the capital
stack, commercial real estate (CRE) faces a challenging
environment, with different property sectors disproportionately
impacted by the pandemic. Hotel revenue per available room
(RevPAR) is 62.4% lower on a YOY basis with economy properties
outperforming luxury and upscale; however, metrics across
segments have steadily improved since bottoming out in mid-April.
Retail properties, struggling before the pandemic, face the
additional challenges of temporary malls closures and permanent
store closures. Mall REITs have indicated rent collections have
been low (25%), while strip center REITs have only fared slightly
better (~50%). More positively, office, multifamily and industrial
properties have continued to have strong rent collections (90+%),
which is in line with a year ago. Nonetheless uncertainty is
prevalent. CMBS delinquencies continue to rise—conduit 30+ DQs
are now almost 9%, with hotel and retail loans comprising the
majority. Bringing it together to the investable CMBS universe: 1)
we believe conduit senior bonds have adequate protection and are
biased to tighten, while mezzanine tranches will bear the brunt of
the malaise; and 2) well-researched single asset/single borrower
transactions will continue to add value (e.g., logistics properties)
while large hotel/retail financings will face daunting prospects
despite much lower dollar entry points.
ABS: ABS rallied significantly in Q2. Strong demand for paper and
an improved liquidity environment were the byproducts of massive
stimulus programs. Further, supply technicals were favorable (34%
behind last year’s pace). While ABS technicals have been strong,
the fundamental picture, particularly in consumer sectors, carries
increased uncertainty and is ultimately dependent upon the
duration/impact of COVID-19 and concomitant economic
shutdown. Generally, government stimulus and the use of
forbearance programs by issuers has resulted in near-term
performance stability in ABS trusts. However, in Q3, the true extent
of collateral delinquencies and defaults will be determined by how
stimulus complements the pace of the economic reopening. As we
await a clearer view of the health of originators and collateral
performance, we maintain a preference for strong ABS originators
and “top-of-the-capital structure” securities. We favor prime auto
revolver, refinanced private student loans, and floorplan assets, all
of which recently traded in the +100-175 bps range with continued
upside to early 2020 levels. We are cautious on unsecured
consumer loans, particularly subordinate classes, as the underlying
borrowers could experience relatively worse credit outcomes. We
are sellers of AAA credit cards for more risk-seeking portfolios as
spreads have retraced back to pre-COVID levels.
CLOs: AAA CLO spreads, along with rest of capital structure,
continued to recover in Q2. While AAA spreads have retraced
about 75% from the recent wides, we have seen large bifurcation
in secondary mezzanine CLO spreads as the market is now pricing
in potential principal impairments. Most of these impairments are
likely to happen in the more seasoned CLOs as their collateral
pools had previously been stressed through pre-COVID issues,
notably in retail and energy sectors. Despite these potential losses,
we have seen the primary market rekindle the issuance of BB-
tranches as investors continue to chase higher yields. These
primary spreads are at least 500 bps inside of comparably rated
secondary spreads—reflecting underlying collateral quality and
current credit enhancement. We expect further credit migration on
Q3 2020 Sector Outlook
PGIM Fixed Income Third Quarter 2020 Outlook Page | 11
mezzanine tranches due to underlying loan issues. We expect an
acceleration of companies to either go to CCC or default, which will
continue to stress CLOs’ overcollateralization tests (a positive for
AAAs as they will de-lever). We expect senior CLO tranches to
remain protected from credit losses, but the lower mezzanine
tranches may be impaired or written off entirely. We are keeping a
close watch on CLO managers as some may face stress from
either underwater warehouses or from less subordinate asset
management fees if cash flows begin to get diverted. Over the next
year, we remain highly constructive on senior spreads and believe
they are likely to be tighter than pre-COVID levels. However, we
also anticipate higher volatility as markets digest the economic
impacts of the virus, and we expect pockets of opportunities to
result from changes in risk sentiment over the next few months.
Outlook: Constructive. High-quality spreads may revisit their post-
crisis tights, yet mezzanine risk faces challenging fundamentals,
particularly for CLOs and CMBS with high retail and hospitality
exposures. Marginally more constructive on consumer and
commercial ABS and high-quality RMBS. As the U.S. election
approaches, securitized assets may outperform given the reduced
vulnerability to corporate tax and regulatory policy.
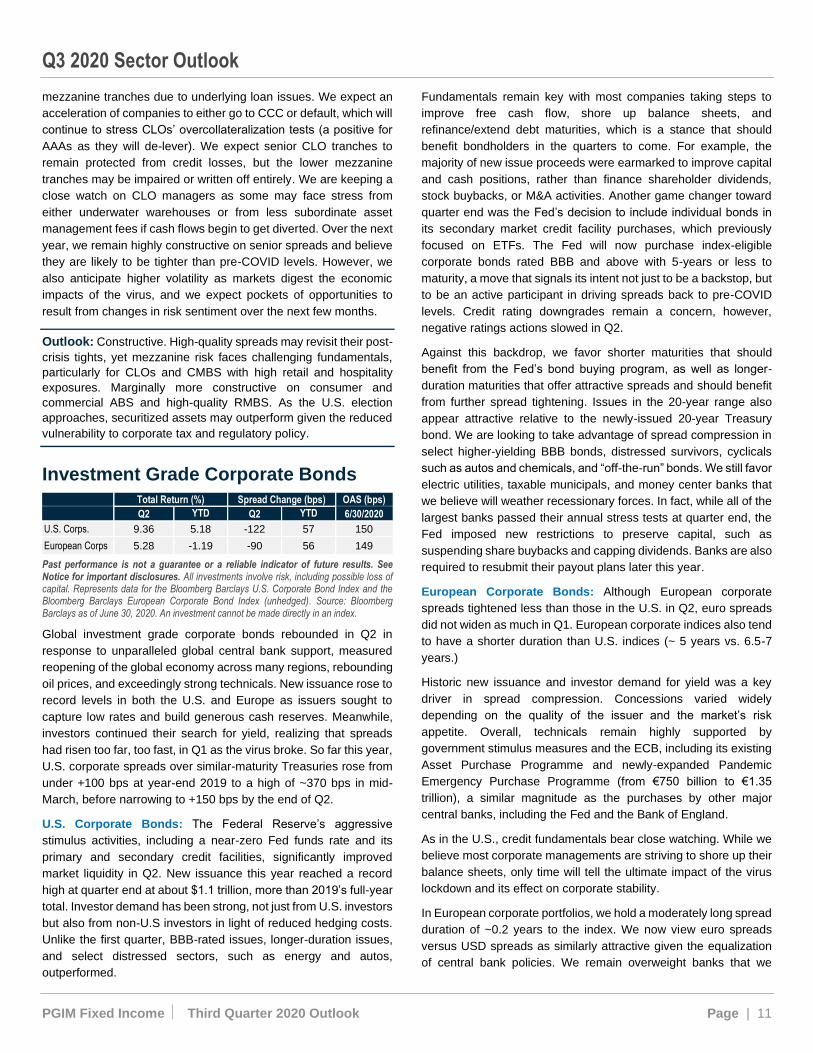
Investment Grade Corporate Bonds
Total Return (%) Spread Change (bps) OAS (bps)
Q2 YTD Q2 YTD 6/30/2020
U.S. Corps. 9.36 5.18 -122 57 150
European Corps 5.28 -1.19 -90 56 149
Past performance is not a guarantee or a reliable indicator of future results. See Notice for important disclosures. All investments involve risk, including possible loss of capital. Represents data for the Bloomberg Barclays U.S. Corporate Bond Index and the Bloomberg Barclays European Corporate Bond Index (unhedged). Source: Bloomberg Barclays as of June 30, 2020. An investment cannot be made directly in an index.
Global investment grade corporate bonds rebounded in Q2 in
response to unparalleled global central bank support, measured
reopening of the global economy across many regions, rebounding
oil prices, and exceedingly strong technicals. New issuance rose to
record levels in both the U.S. and Europe as issuers sought to
capture low rates and build generous cash reserves. Meanwhile,
investors continued their search for yield, realizing that spreads
had risen too far, too fast, in Q1 as the virus broke. So far this year,
U.S. corporate spreads over similar-maturity Treasuries rose from
under +100 bps at year-end 2019 to a high of ~370 bps in mid-
March, before narrowing to +150 bps by the end of Q2.
U.S. Corporate Bonds: The Federal Reserve’s aggressive
stimulus activities, including a near-zero Fed funds rate and its
primary and secondary credit facilities, significantly improved
market liquidity in Q2. New issuance this year reached a record
high at quarter end at about $1.1 trillion, more than 2019’s full-year
total. Investor demand has been strong, not just from U.S. investors
but also from non-U.S investors in light of reduced hedging costs.
Unlike the first quarter, BBB-rated issues, longer-duration issues,
and select distressed sectors, such as energy and autos,
outperformed.
Fundamentals remain key with most companies taking steps to
improve free cash flow, shore up balance sheets, and
refinance/extend debt maturities, which is a stance that should
benefit bondholders in the quarters to come. For example, the
majority of new issue proceeds were earmarked to improve capital
and cash positions, rather than finance shareholder dividends,
stock buybacks, or M&A activities. Another game changer toward
quarter end was the Fed’s decision to include individual bonds in
its secondary market credit facility purchases, which previously
focused on ETFs. The Fed will now purchase index-eligible
corporate bonds rated BBB and above with 5-years or less to
maturity, a move that signals its intent not just to be a backstop, but
to be an active participant in driving spreads back to pre-COVID
levels. Credit rating downgrades remain a concern, however,
negative ratings actions slowed in Q2.
Against this backdrop, we favor shorter maturities that should
benefit from the Fed’s bond buying program, as well as longer-
duration maturities that offer attractive spreads and should benefit
from further spread tightening. Issues in the 20-year range also
appear attractive relative to the newly-issued 20-year Treasury
bond. We are looking to take advantage of spread compression in
select higher-yielding BBB bonds, distressed survivors, cyclicals
such as autos and chemicals, and “off-the-run” bonds. We still favor
electric utilities, taxable municipals, and money center banks that
we believe will weather recessionary forces. In fact, while all of the
largest banks passed their annual stress tests at quarter end, the
Fed imposed new restrictions to preserve capital, such as
suspending share buybacks and capping dividends. Banks are also
required to resubmit their payout plans later this year.
European Corporate Bonds: Although European corporate
spreads tightened less than those in the U.S. in Q2, euro spreads
did not widen as much in Q1. European corporate indices also tend
to have a shorter duration than U.S. indices (~ 5 years vs. 6.5-7
years.)
Historic new issuance and investor demand for yield was a key
driver in spread compression. Concessions varied widely
depending on the quality of the issuer and the market’s risk
appetite. Overall, technicals remain highly supported by
government stimulus measures and the ECB, including its existing
Asset Purchase Programme and newly-expanded Pandemic
Emergency Purchase Programme (from €750 billion to €1.35
trillion), a similar magnitude as the purchases by other major
central banks, including the Fed and the Bank of England.
As in the U.S., credit fundamentals bear close watching. While we
believe most corporate managements are striving to shore up their
balance sheets, only time will tell the ultimate impact of the virus
lockdown and its effect on corporate stability.
In European corporate portfolios, we hold a moderately long spread
duration of ~0.2 years to the index. We now view euro spreads
versus USD spreads as similarly attractive given the equalization
of central bank policies. We remain overweight banks that we
Q3 2020 Sector Outlook
PGIM Fixed Income Third Quarter 2020 Outlook Page | 12
believe will benefit from full government support. We are also
overweight “reverse-yankee” euro-denominated U.S. corporates.
Many of these issues came to market with better pricing than USD
holdings and EUR issuers of similar quality.
Global Corporate Bonds: We are similarly positioned in global
corporate portfolios with balanced risk exposure to euro vs. USD
spreads and a slight overweight in spread duration (long exposure
to the euro and USD and short exposure to the yen, Swiss franc,
etc.). We remain flat to underweight sterling denominated credit
spreads. We still prefer U.S. money center banks and electric
utilities denominated in dollars, as well as banks and select
corporates denominated in euros (but not necessarily European
companies). We continue to take advantage of price and yield
dislocations between EUR and USD bonds of the same and/or
similar issuers.
Going forward, the corporate market is susceptible to negative
headline risk in the short term due to ongoing uncertainty about the
path of the virus, a potential slowdown in economic re-openings,
and escalating trade tensions worldwide. We expect new issuance
to decline notably in Q3 relative to Q2’s historic levels. We believe
U.S. and European spreads remain attractive and are actively
searching for opportunities to add value as the economy recovers.
We believe global central banks and governments will continue to
support an economic recovery and will step in to increase stimulus
measures as needed.
Outlook: Positive in light of central bank support and the
prospects of an economic recovery. Favor U.S. money center
banks as well as select BBB-rated issues, cyclical credits, and
fallen angels.
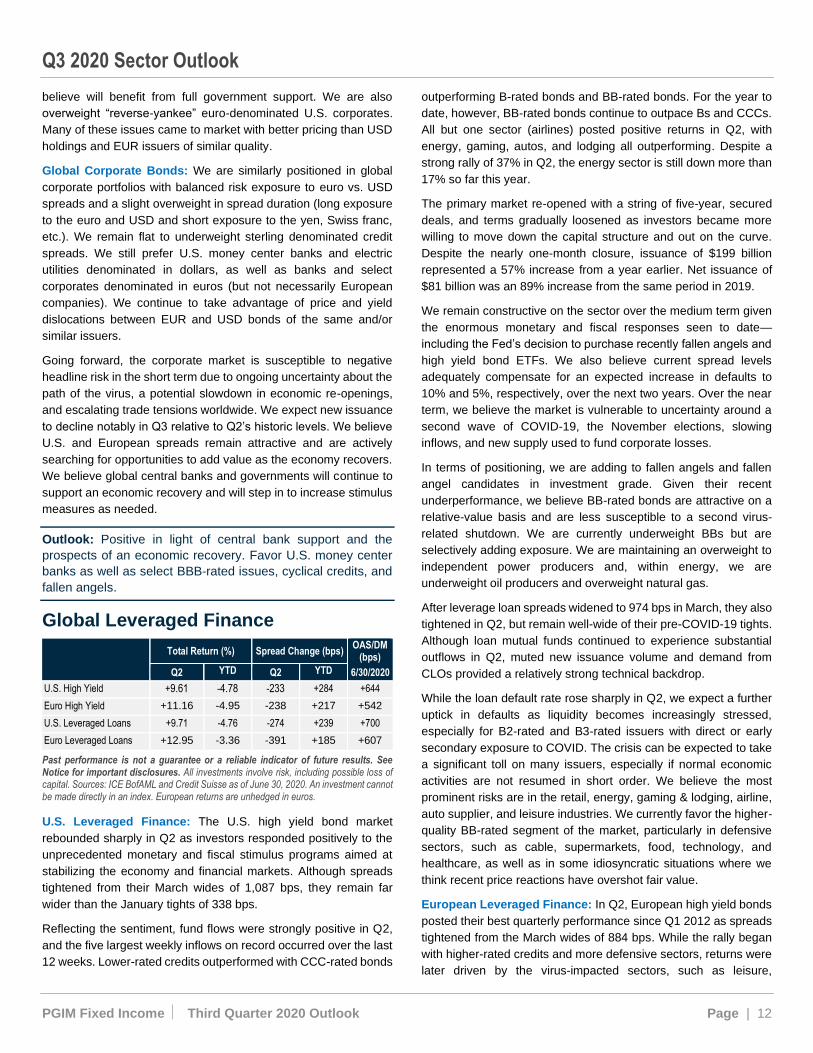
Global Leveraged Finance
Total Return (%) Spread Change (bps) OAS/DM
(bps)
Q2 YTD Q2 YTD 6/30/2020
U.S. High Yield +9.61 -4.78 -233 +284 +644
Euro High Yield +11.16 -4.95 -238 +217 +542
U.S. Leveraged Loans +9.71 -4.76 -274 +239 +700
Euro Leveraged Loans +12.95 -3.36 -391 +185 +607
Past performance is not a guarantee or a reliable indicator of future results. See Notice for important disclosures. All investments involve risk, including possible loss of capital. Sources: ICE BofAML and Credit Suisse as of June 30, 2020. An investment cannot be made directly in an index. European returns are unhedged in euros.
U.S. Leveraged Finance: The U.S. high yield bond market
rebounded sharply in Q2 as investors responded positively to the
unprecedented monetary and fiscal stimulus programs aimed at
stabilizing the economy and financial markets. Although spreads
tightened from their March wides of 1,087 bps, they remain far
wider than the January tights of 338 bps.
Reflecting the sentiment, fund flows were strongly positive in Q2,
and the five largest weekly inflows on record occurred over the last
12 weeks. Lower-rated credits outperformed with CCC-rated bonds
outperforming B-rated bonds and BB-rated bonds. For the year to
date, however, BB-rated bonds continue to outpace Bs and CCCs.
All but one sector (airlines) posted positive returns in Q2, with
energy, gaming, autos, and lodging all outperforming. Despite a
strong rally of 37% in Q2, the energy sector is still down more than
17% so far this year.
The primary market re-opened with a string of five-year, secured
deals, and terms gradually loosened as investors became more
willing to move down the capital structure and out on the curve.
Despite the nearly one-month closure, issuance of $199 billion
represented a 57% increase from a year earlier. Net issuance of
$81 billion was an 89% increase from the same period in 2019.
We remain constructive on the sector over the medium term given
the enormous monetary and fiscal responses seen to date—
including the Fed’s decision to purchase recently fallen angels and
high yield bond ETFs. We also believe current spread levels
adequately compensate for an expected increase in defaults to
10% and 5%, respectively, over the next two years. Over the near
term, we believe the market is vulnerable to uncertainty around a
second wave of COVID-19, the November elections, slowing
inflows, and new supply used to fund corporate losses.
In terms of positioning, we are adding to fallen angels and fallen
angel candidates in investment grade. Given their recent
underperformance, we believe BB-rated bonds are attractive on a
relative-value basis and are less susceptible to a second virus-
related shutdown. We are currently underweight BBs but are
selectively adding exposure. We are maintaining an overweight to
independent power producers and, within energy, we are
underweight oil producers and overweight natural gas.
After leverage loan spreads widened to 974 bps in March, they also
tightened in Q2, but remain well-wide of their pre-COVID-19 tights.
Although loan mutual funds continued to experience substantial
outflows in Q2, muted new issuance volume and demand from
CLOs provided a relatively strong technical backdrop.
While the loan default rate rose sharply in Q2, we expect a further
uptick in defaults as liquidity becomes increasingly stressed,
especially for B2-rated and B3-rated issuers with direct or early
secondary exposure to COVID. The crisis can be expected to take
a significant toll on many issuers, especially if normal economic
activities are not resumed in short order. We believe the most
prominent risks are in the retail, energy, gaming & lodging, airline,
auto supplier, and leisure industries. We currently favor the higher-
quality BB-rated segment of the market, particularly in defensive
sectors, such as cable, supermarkets, food, technology, and
healthcare, as well as in some idiosyncratic situations where we
think recent price reactions have overshot fair value.
European Leveraged Finance: In Q2, European high yield bonds
posted their best quarterly performance since Q1 2012 as spreads
tightened from the March wides of 884 bps. While the rally began
with higher-rated credits and more defensive sectors, returns were
later driven by the virus-impacted sectors, such as leisure,
Q3 2020 Sector Outlook
PGIM Fixed Income Third Quarter 2020 Outlook Page | 13
transportation, gaming, and autos as the market began to price in
a more optimistic recovery. By quality, CCC-rated bonds
outperformed. Despite their rebound in Q2, spreads remain at
attractive levels versus historic averages and will, in our view, drive
strong returns for investors with longer-term time horizons.
While defaults may rise in the coming quarters, the bulk of expected
ratings actions have already taken place. Despite the economic
stress, we think European high yield default rates will remain below
3% and well below the rate in the U.S. high yield market in 2020—
our base case is a 1.3% default rate in 2020 and a 2.0% default
rate in 2021. Most of the short-term stress has been addressed
through a combination of prudent corporate cost and cash
management and investor/state support.
While the recovery from the crisis will almost certainly hit
speedbumps (making short-term market moves difficult to predict),
we are confident macroeconomic data will steadily improve as
major economies slowly re-open. Through active management and
strong credit selection, we believe deteriorating situations can
largely be avoided and attractive opportunities can be harnessed.
In terms of positioning, we remain constructive on high yield and
currently prefer bonds to loans. We are currently broadly running
above market-level risk, with investment weighted towards the best
relative-value opportunities given the evolving backdrop.
Outlook: Spreads appear attractive vs. historic averages and
will drive strong returns for investors with longer-term time
horizons. Over the near term, the market may remain volatile
(but relatively range-bound) amid virus concerns. Active credit
selection will be a differentiating factor between managers in
volatile markets.
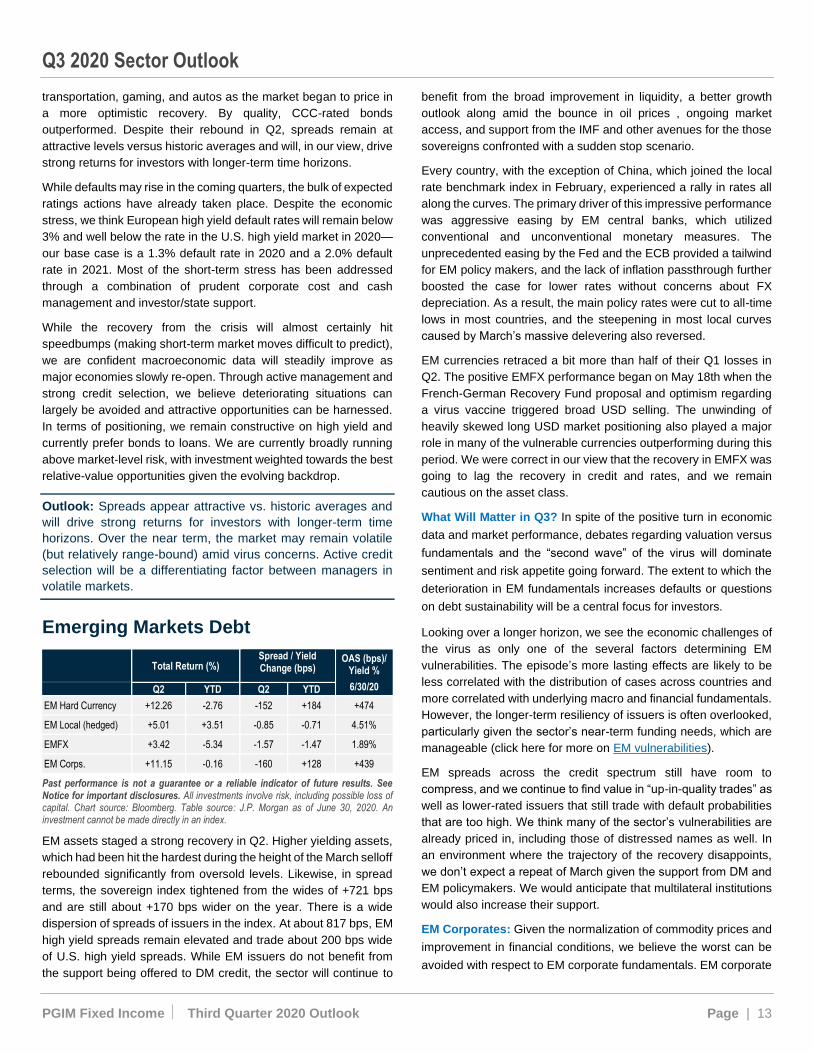
Emerging Markets Debt
Total Return (%) Spread / Yield Change (bps)
OAS (bps)/ Yield %
6/30/20 Q2 YTD Q2 YTD
EM Hard Currency +12.26 -2.76 -152 +184 +474
EM Local (hedged) +5.01 +3.51 -0.85 -0.71 4.51%
EMFX +3.42 -5.34 -1.57 -1.47 1.89%
EM Corps. +11.15 -0.16 -160 +128 +439
Past performance is not a guarantee or a reliable indicator of future results. See Notice for important disclosures. All investments involve risk, including possible loss of capital. Chart source: Bloomberg. Table source: J.P. Morgan as of June 30, 2020. An investment cannot be made directly in an index.
EM assets staged a strong recovery in Q2. Higher yielding assets,
which had been hit the hardest during the height of the March selloff
rebounded significantly from oversold levels. Likewise, in spread
terms, the sovereign index tightened from the wides of +721 bps
and are still about +170 bps wider on the year. There is a wide
dispersion of spreads of issuers in the index. At about 817 bps, EM
high yield spreads remain elevated and trade about 200 bps wide
of U.S. high yield spreads. While EM issuers do not benefit from
the support being offered to DM credit, the sector will continue to
benefit from the broad improvement in liquidity, a better growth
outlook along amid the bounce in oil prices , ongoing market
access, and support from the IMF and other avenues for the those
sovereigns confronted with a sudden stop scenario.
Every country, with the exception of China, which joined the local
rate benchmark index in February, experienced a rally in rates all
along the curves. The primary driver of this impressive performance
was aggressive easing by EM central banks, which utilized
conventional and unconventional monetary measures. The
unprecedented easing by the Fed and the ECB provided a tailwind
for EM policy makers, and the lack of inflation passthrough further
boosted the case for lower rates without concerns about FX
depreciation. As a result, the main policy rates were cut to all-time
lows in most countries, and the steepening in most local curves
caused by March’s massive delevering also reversed.
EM currencies retraced a bit more than half of their Q1 losses in
Q2. The positive EMFX performance began on May 18th when the
French-German Recovery Fund proposal and optimism regarding
a virus vaccine triggered broad USD selling. The unwinding of
heavily skewed long USD market positioning also played a major
role in many of the vulnerable currencies outperforming during this
period. We were correct in our view that the recovery in EMFX was
going to lag the recovery in credit and rates, and we remain
cautious on the asset class.
What Will Matter in Q3? In spite of the positive turn in economic
data and market performance, debates regarding valuation versus
fundamentals and the “second wave” of the virus will dominate
sentiment and risk appetite going forward. The extent to which the
deterioration in EM fundamentals increases defaults or questions
on debt sustainability will be a central focus for investors.
Looking over a longer horizon, we see the economic challenges of
the virus as only one of the several factors determining EM
vulnerabilities. The episode’s more lasting effects are likely to be
less correlated with the distribution of cases across countries and
more correlated with underlying macro and financial fundamentals.
However, the longer-term resiliency of issuers is often overlooked,
particularly given the sector’s near-term funding needs, which are
manageable (click here for more on EM vulnerabilities).
EM spreads across the credit spectrum still have room to
compress, and we continue to find value in “up-in-quality trades” as
well as lower-rated issuers that still trade with default probabilities
that are too high. We think many of the sector’s vulnerabilities are
already priced in, including those of distressed names as well. In
an environment where the trajectory of the recovery disappoints,
we don’t expect a repeat of March given the support from DM and
EM policymakers. We would anticipate that multilateral institutions
would also increase their support.
EM Corporates: Given the normalization of commodity prices and
improvement in financial conditions, we believe the worst can be
avoided with respect to EM corporate fundamentals. EM corporate
Q3 2020 Sector Outlook
PGIM Fixed Income Third Quarter 2020 Outlook Page | 14
high yield defaults will likely trend towards the low end of our 6-8%
forecast for 2020 (YTD actual defaults are 1.7%). Companies have
been able to draw credit lines, negotiate asset sales, cut capex and
even access the bond market, which seemed unthinkable as Q1
concluded. EM corporate spreads have tightened over 200 bps
from the wides of late March (vs. a long-term average of mid 300
bps), but valuations are still attractive from a medium- to long-term
perspective. While the supply pipeline remains heavy, issuance in
certain sectors, such as Chinese property, has been less than
feared as companies were able to take advantage of low borrowing
rates in the local market. New issue concessions have compressed
to near zero, but demand has remained healthy. In terms of
positioning, we continue to favor higher-quality, high-yield names
and are underweight sub-scale oil & gas and commodity firms.
EM Local Bonds And FX: In absolute terms, the yields on the
overall local index and individual country index trade at historical
lows, but relative to core rates, the spread between EM and DM
yields still has room to tighten. Alpha opportunities in Q3 will come
from three sources: 1) focusing on the front end of the curves where
the central banks have room to cut rates; 2) taking an active view
on the shape of the curves amid various QE measures; and 3)
playing correlation between EMFX and EM rates.
With the Fed on hold for the next two to three years, the five-year
point of the curve is the new point from which the term premium
can be derived. The spread of the benchmark index to the five-year
U.S. Treasury note is an attractive 425 bps. While the long end of
EM curves may be vulnerable to increasing debt and deficit levels,
the 5- to 7-year segments of the curve are the preferred tenors for
expressing a view on duration.
Policy rates in Mexico, Russia, Indonesia, and China remain higher
than historical lows, and they could conceivably decline to match
those in other countries, such as Brazil and South Africa. We think
policy rates in Mexico, Russia, and Indonesia will have a 3% handle
by end of the year, and we are expressing this view via interest-
rate swaps and bonds in the 2- to 5-year part of the curves in these
three countries. Rates in China appear too high relative to
economic fundamentals, and money market liquidity is likely to
revert to Q1 levels once the PBoC closes various arbitrage
loopholes. With negative real rates and all-time low nominal policy
rates in Chile, Peru, Czech Republic, and Brazil, QE policies may
also provide alpha opportunities. Turkey is the only country where
inflationary pressures have started to rebuild, which warrants
consideration for underweight positioning.
We don’t think the turnaround in EMFX is sustainable if the flow
picture doesn’t improve. In Q2, there were net outflows from both
EM local bonds and EM equities. EMFX market positioning is now
closer to home rather than heavily skewed toward long dollar
positioning. Looking forward, the performance of EMFX hinges
upon the performance of global risk assets, which will be
dependent on the type of recovery that will unfold over the
remainder of the year. If the recovery is faster and stronger, then
inflows are likely to return to local bonds and EM equities, providing
some support to currencies. Conversely, a disappointing recovery
will likely present a challenging backdrop now that the technical
picture is more neutral. Our conviction rests more on relative-value
opportunities. We think FX benefitting from factors, such as
relatively high carry, higher growth, strong external balance
positions, and less reliance on globalization benefits, are likely to
outperform. We favor currencies such as the IDR, RUB, KRW,
SGD, THB, and to a lesser extent MXN and European currencies.
We are cautious on the BRL, CLP, COP, ZAR, and TRY—
currencies with relatively sizeable fiscal deficits, higher current
account deficits, lower growth, and low to negative real rates.
Outlook: Positive. We continue to find value in EM spreads.
Many issuers pre-funded anticipated deterioration in economic
conditions and fiscal slippage. Spreads for certain EM
sovereign and corporate issuers across the credit spectrum are
likely to tighten. Further alpha in local rates may emerge from
curve positioning as well as in markets with positive real rates
and expectations for policy rate cuts. We are more cautious on
EMFX and recognize attractive relative-value opportunities
between variously affected currencies.
Municipal Bonds
Total Return (%)
Q2 YTD
High Grade 2.72 2.08
High Yield 4.55 -2.64
Long Taxable Munis 9.15 9.07
Past performance is not a guarantee or a reliable indicator of future results. See Notice for important disclosures. All investments involve risk, including possible loss of capital. Represents data for the Bloomberg Barclays Municipal Bond Indices. Source: Bloomberg Barclays as of June 30, 2020. An investment cannot be made directly in an index.
Manageable issuance YTD ($198B through Q2) is expected to
continue into Q3; taxable municipal issuance accounts for over
35% of the total, providing a supportive technical for the tax-exempt
market. The expectation of continued mutual fund inflows adds to
the favorable technical backdrop for tax-exempts in Q3. In addition,
the relatively steep municipal yield curve (the 5- to 30-year muni
curve steepened by 32 bps in Q2 to 122 bps) presents attractive
opportunities on the long end with the expectation that the muni
curve will flatten in Q3. While credit spreads for many high-grade
sectors have largely recovered from recent wides, certain sectors,
including transportation and hospitals, have lagged. In addition,
lower investment grade credits have unperformed relative to AAA
and AA credits. We expect segments of the market that have
lagged through Q2 to outperform from a credit spread tightening
perspective in Q3.
While the fundamental, long-term credit profile for most municipal
sectors is stable, the short-term outlook for many sectors has
weakened. Uncertainty regarding the depth and duration of the

Q3 2020 Sector Outlook
PGIM Fixed Income Third Quarter 2020 Outlook Page | 15
economic downturn and the ultimate impact on muni credit
continues to weigh on segments of the market. Federal support
provided via the CARES Act and the Fed’s newly created Municipal
Liquidity Facility (MLF), helped to stabilize the market in Q2.
However, additional federal stimulus funds will be required to
prevent deep expenditure cuts, furloughs and layoffs of public
sector workers, and increased borrowing as budget gaps persist for
many states and localities. The urgency of another federal stimulus
package has increased as a resurgence in COVID cases is
pressuring certain states and localities. We continue to believe that
certain high yield muni credits dependent on narrow revenue
streams will likely experience a pickup in defaults.
High grade taxable municipals should perform in line with
comparably rated corporate bonds, but may be subject to more
constrained liquidity. However, we believe that essential service
revenue bond issuers provide better insulation from multi-notch
downgrade risk than corporate bonds.
Outlook: A constructive backdrop amid attractive valuations
for many market segments and supportive technical
conditions. Yet, a near-term cautious view is warranted
given the recent spike in U.S. COVID cases. Without
additional near-term federal support for states and localities,
the sector could experience an increase in volatility.
Important Information
PGIM Fixed Income Third Quarter 2020 Outlook Page | 16
Source of data (unless otherwise noted): PGIM Fixed Income and Bloomberg as of July 2020
PGIM Fixed Income operates primarily through PGIM, Inc., a registered investment adviser under the U.S. Investment Advisers Act of 1940, as
amended, and a Prudential Financial, Inc. (“PFI”) company. Registration as a registered investment adviser does not imply a certain level or skill or
training. PGIM Fixed Income is headquartered in Newark, New Jersey and also includes the following businesses globally: (i) the public fixed income
unit within PGIM Limited, located in London; (ii) PGIM Netherlands B.V. located in Amsterdam; (iii) PGIM Japan Co., Ltd. (“PGIM Japan”), located in
Tokyo; and (iv) the public fixed income unit within PGIM (Singapore) Pte. Ltd., located in Singapore (“PGIM Singapore”). PFI of the United States is
not affiliated in any manner with Prudential plc, incorporated in the United Kingdom or with Prudential Assurance Company, a subsidiary of M&G plc,
incorporated in the United Kingdom. Prudential, PGIM, their respective logos, and the Rock symbol are service marks of PFI and its related entities,
registered in many jurisdictions worldwide.
These materials are for informational or educational purposes only. The information is not intended as investment advice and is not a
recommendation about managing or investing assets. In providing these materials, PGIM is not acting as your fiduciary. These materials
represent the views, opinions and recommendations of the author(s) regarding the economic conditions, asset classes, securities, issuers or financial
instruments referenced herein. Distribution of this information to any person other than the person to whom it was originally delivered and to such
person’s advisers is unauthorized, and any reproduction of these materials, in whole or in part, or the divulgence of any of the contents hereof,
without prior consent of PGIM Fixed Income is prohibited. Certain information contained herein has been obtained from sources that PGIM Fixed
Income believes to be reliable as of the date presented; however, PGIM Fixed Income cannot guarantee the accuracy of such information, assure
its completeness, or warrant such information will not be changed. The information contained herein is current as of the date of issuance (or such
earlier date as referenced herein) and is subject to change without notice. PGIM Fixed Income has no obligation to update any or all of such
information; nor do we make any express or implied warranties or representations as to the completeness or accuracy or accept responsibility for
errors. All investments involve risk, including the possible loss of capital. These materials are not intended as an offer or solicitation
with respect to the purchase or sale of any security or other financial instrument or an y investment management services and should not
be used as the basis for any investment decision. No risk management technique can guarantee the mitigation or elimination of risk in
any market environment. Past performance is not a guarantee or a reliable indicator of future results and an investment could lose value.
No liability whatsoever is accepted for any loss (whether direct, indirect, or consequential) that may arise from any use of the information
contained in or derived from this report. PGIM Fixed Income and its affiliates may make investment decisions that are inconsistent with
the recommendations or views expressed herein, including for proprietary accounts of PGIM Fixed Income or its affiliates.
The opinions and recommendations herein do not take into account individual client circumstances, objectives, or needs and are not intended as
recommendations of particular securities, financial instruments or strategies to particular clients or prospects. No determination has been made
regarding the suitability of any securities, financial instruments or strategies for particular clients or prospects. For any securities or financial
instruments mentioned herein, the recipient(s) of this report must make its own independent decisions.
Conflicts of Interest: PGIM Fixed Income and its affiliates may have investment advisory or other business relationships with the issuers of
securities referenced herein. PGIM Fixed Income and its affiliates, officers, directors and employees may from time to time have long or short
positions in and buy or sell securities or financial instruments referenced herein. PGIM Fixed Income and its affiliates may develop and publish
research that is independent of, and different than, the recommendations contained herein. PGIM Fixed Income’s personnel other than the author(s),
such as sales, marketing and trading personnel, may provide oral or written market commentary or ideas to PGIM Fixed Income’s clients or prospects
or proprietary investment ideas that differ from the views expressed herein. Additional information regarding actual and potential conflicts of interest
is available in Part 2A of PGIM Fixed Income’s Form ADV.
In the European Economic Area (“EEA”), information is issued by PGIM Limited or PGIM Netherlands to persons who are professional clients
as defined in Directive 2014/65/EU (MiFID II). PGIM Limited’s registered office: Grand Buildings, 1-3 Strand, Trafalgar Square, London, WC2N
5HR. PGIM Limited is authorised and regulated by the Financial Conduct Authority (“FCA”) of the United Kingdom (Firm Reference Number
193418). PGIM Netherlands B.V. is authorised by the Dutch Authority for the Financial Markets (Autoriteit Financiële Markten – AFM) as an
alternative investment fund manager with MiFID top up service capabilities under registration number 15003620. PGIM Limited and PGIM
Netherlands are authorized to provide services or operate with a passport in various jurisdictions in the EEA. In certain countries in Asia,
information is presented by PGIM (Singapore) Pte. Ltd., a Singapore investment manager registered with and licensed by the Monetary
Authority of Singapore. In Japan, information is presented by PGIM Japan Co. Ltd., registered investment adviser with the Japanese Financial
Services Agency. In South Korea, information is presented by PGIM, Inc., which is licensed to provide discretionary investment management
services directly to South Korean investors. In Hong Kong, information is provided by PGIM (Hong Kong) Limited, a regulated entity with the
Securities & Futures Commission in Hong Kong to professional investors as defined in Section 1 of Part 1 of Schedule 1 (paragraph (a) to (i)
of the Securities and Futures Ordinance (Cap.571). In Australia, this information is presented by PGIM (Australia) Pty Ltd (“PGIM Australia”)
for the general information of its “wholesale” customers (as defined in the Corporations Act 2001). PGIM Australia is a representative of
PGIM Limited, which is exempt from the requirement to hold an Australian Financial Services License under the Australian Corporations Act
2001 in respect of financial services. PGIM Limited is exempt by virtue of its regulation by the FCA (Reg: 193418) under the laws of the United
Kingdom and the application of ASIC Class Order 03/1099. The laws of the United Kingdom differ from Australian laws. In South Africa, PGIM,
Inc. is an authorised financial services provider – FSP number 49012.
© 2020 PFI and its related entities.
Important Information
PGIM Fixed Income Third Quarter 2020 Outlook Page | 17
U.S. Investment Grade Corporate Bonds: Bloomberg Barclays U.S. Corporate Bond Index: The Bloomberg Barclays U.S. Investment Grade Corporate Bond Index covers U.S.D-
denominated, investment-grade, fixed-rate or step up, taxable securities sold by industrial, utility and financial issuers. It includes publicly issued U.S. corporate and foreign
debentures and secured notes that meet specified maturity, liquidity, and quality requirements. Securities included in the index must have at least 1 year until final maturity and be
rated investment-grade (Baa3/ BBB-/BBB-) or better using the middle rating of Moody’s, S&P, and Fitch.
European Investment Grade Corporate Bonds: Bloomberg Barclays European Corporate Bond Index (unhedged): The Bloomberg Barclays Euro-Aggregate: Corporates bond Index
is a rules-based benchmark measuring investment grade, EUR denominated, fixed rate, and corporate only. Only bonds with a maturity of 1 year and above are eligible.
U.S. High Yield Bonds: ICE BofAML U.S. High Yield Index: The ICE BofAML U.S. High Yield Index covers US dollar denominated below investment grade corporate debt publicly
issued in the US domestic market. Qualifying securities must have a below investment grade rating (based on an average of Moody’s, S&P and Fitch), at least 18 months to final
maturity at the time of issuance, and at least one year remaining term to final maturity as of the rebalancing date.
European High Yield Bonds: ICE BofAML European Currency High Yield Index: This data represents the ICE BofAML Euro High Yield Index value, which tracks the performance
of Euro denominated below investment grade corporate debt publicly issued in the euro domestic or eurobond markets. Qualifying securities must have a below investment grade
rating (based on an average of Moody's, S&P, and Fitch). Qualifying securities must have at least one year remaining term to maturity, a fixed coupon schedule, and a minimum
amount outstanding of €100 M. ICE Data Indices, LLC, used with permission. ICE DATA INDICES, LLC IS LICENSING THE ICE DATA INDICES AND RELATED DATA "AS IS,"
MAKES NO WARRANTIES REGARDING SAME, DOES NOT GUARANTEE THE SUITABILITY, QUALITY, ACCURACY, TIMELINESS, AND/OR COMPLETENESS OF THE ICE
DATA INDICES OR ANY DATA INCLUDED IN, RELATED TO, OR DERIVED THEREFROM, ASSUMES NO LIABILITY IN CONNECTION WITH THEIR USE, AND DOES NOT
SPONSOR, ENDORSE, OR RECOMMEND PGIM FIXED INCOME OR ANY OF ITS PRODUCTS OR SERVICES.
U.S. Senior Secured Loans: Credit Suisse Leveraged Loan Index: The Credit Suisse Leveraged Loan Index is a representative, unmanaged index of tradable, U.S. dollar
denominated floating rate senior secured loans and is designed to mirror the investable universe of the U.S. dollar denominated leveraged loan market. The Index return does not
reflect the impact of principal repayments in the current month.
European Senior Secured Loans: Credit Suisse Western European Leveraged Loan Index: All Denominations EUR hedged. The Index is a representative, unmanaged index of
tradable, floating rate senior secured loans designed to mirror the investable universe of the European leveraged loan market. The Index return does not reflect the impact of
principal repayments in the current month.
Emerging Markets U.S.D Sovereign Debt: JP Morgan Emerging Markets Bond Index Global Diversified: The Emerging Markets Bond Index Global Diversified (EMBI Global) tracks
total returns for U.S.D-denominated debt instruments issued by emerging market sovereign and quasi-sovereign entities: Brady bonds, loans, and Eurobonds. It limits the weights
of those index countries with larger debt stocks by only including specified portions of these countries’ eligible current face amounts of debt outstanding. To be deemed an emerging
market by the EMBI Global Diversified Index, a country must be rated Baa1/BBB+ or below by Moody’s/S&P rating agencies. Information has been obtained from sources believed
to be reliable, but J.P. Morgan does not warrant its completeness or accuracy. The Index is used with permission. The Index may not be copied, used, or distributed without J.P.
Morgan's prior written approval. Copyright 2020, J.P. Morgan Chase & Co. All rights reserved.
Emerging Markets Local Debt (unhedged): JPMorgan Government Bond Index-Emerging Markets Global Diversified Index: The Government Bond Index-Emerging Markets Global
Diversified Index (GBI-EM Global) tracks total returns for local currency bonds issued by emerging market governments.
Emerging Markets Corporate Bonds: JP Morgan Corporate Emerging Markets Bond Index Broad Diversified: The CEMBI tracks total returns of U.S. dollar-denominated debt
instruments issued by corporate entities in Emerging Markets countries.
Emerging Markets Currencies: JP Morgan Emerging Local Markets Index Plus: The JP Morgan Emerging Local Markets Index Plus (JPM ELMI+) tracks total returns for local
currency–denominated money market instruments.
Municipal Bonds: Bloomberg Barclays Municipal Bond Indices: The index covers the U.S.D-denominated long-term tax-exempt bond market. The index has four main sectors: state
and local general obligation bonds, revenue bonds, insured bonds, and pre-refunded bonds. The bonds must be fixed-rate or step ups, have a dated date after Dec. 13, 1990, and
must be at least 1 year from their maturity date. Non-credit enhanced bonds (municipal debt without a guarantee) must be rated investment grade (Baa3/BBB-/BBB- or better) by
the middle rating of Moody's, S&P, and Fitch.
U.S. Treasury Bonds: Bloomberg Barclays U.S. Treasury Bond Index: The Bloomberg Barclays U.S. Treasury Index measures U.S. dollar-denominated, fixed-rate, nominal debt
issued by the U.S. Treasury. Treasury bills are excluded by the maturity constraint but are part of a separate Short Treasury Index.
Mortgage Backed Securities: Bloomberg Barclays U.S. MBS - Agency Fixed Rate Index: The Bloomberg Barclays U.S. Mortgage Backed Securities (MBS) Index tracks agency
mortgage backed pass-through securities (both fixed-rate and hybrid ARM) guaranteed by Ginnie Mae (GNMA), Fannie Mae (FNMA), and Freddie Mac (FHLMC). The index is
constructed by grouping individual TBA-deliverable MBS pools into aggregates or generics based on program, coupon and vintage.
Commercial Mortgage-Backed Securities: Bloomberg Barclays CMBS: ERISA Eligible Index: The index measures the performance of investment-grade commercial mortgage-
backed securities, which are classes of securities that represent interests in pools of commercial mortgages. The index includes only CMBS that are Employee Retirement Income
Security Act of 1974, which will deem ERISA eligible the certificates with the first priority of principal repayment, as long as certain conditions are met, including the requirement
that the certificates be rated in one of the three highest rating categories by Fitch, Inc., Moody’s Investors Services or Standard & Poor’s.
U.S. Aggregate Bond Index: Bloomberg Barclays U.S. Aggregate Bond Index: The Bloomberg Barclays U.S. Aggregate Index covers the U.S.D-denominated, investment-grade,
fixed-rate or step up, taxable bond market of SEC-registered securities and includes bonds from the Treasury, Government-Related, Corporate, MBS (agency fixed-rate and hybrid
ARM passthroughs), ABS, and CMBS sectors. Securities included in the index must have at least 1 year until final maturity and be rated investment-grade (Baa3/ BBB-/BBB-) or
better using the middle rating of Moody’s, S&P, and Fitch.
The S&P 500® is widely regarded as the best single gauge of large-cap U.S. equities. There is over U.S.D 9.9 trillion indexed or benchmarked to the index, with indexed assets
comprising approximately U.S.D 3.4 trillion of this total. The index includes 500 leading companies and captures approximately 80% coverage of available market capitalization.
2020-4400