
Julia Matevosyan, Resource Adequacy January, 2014 Application of KERMIT in the DOE LTS process.
22
Julia Matevosyan, Resource Adequacy January, 2014 Application of KERMIT in the DOE LTS process
-
Upload
rosamond-tyler -
Category
Documents
-
view
228 -
download
0
Transcript of Julia Matevosyan, Resource Adequacy January, 2014 Application of KERMIT in the DOE LTS process.
Julia Matevosyan, Resource Adequacy
January, 2014
Application of KERMIT in the DOE LTS process
2
Motivation
• ERCOT’s transmission planning processes so far relied on generation expansion tools (Market Power), production cost simulation tools (PROMOD, UPLAN) and tools for AC analysis (PSS/E, PowerWorld).
• These tools do not capture intra-hourly production variability of the renewables and ability of the future generation fleet to maintain system frequency at all times.
• Planning scenarios with high share of renewables may require higher operating reserves to achieve acceptable frequency performance.
• Consideration of higher operating reserves impacts unit commitment and dispatch. It may also impact generation expansion in a scenario.
• Need for a new tool that would capture:̶� Renewable power production uncertainty and variability;̶� Relevant ERCOT market and operation processes.

3
Integrating Renewables / KERMIT analysis
• ERCOT procured KEMA’s Renewable Market Integration Tool (KERMIT), for assessment of operating reserves needed to balance generation portfolios with increasing share of renewables.
• KERMIT is Simulink/Matlab/Excel based platform.
• Models generation fleet, load and renewable variability, generation and system frequency control actions (governor response, AGC).
• Simulates second-by-second system operation, for 24 hour horizon.
• Provides an assessment of a power system’s ability to achieve adequate balancing and maintain system frequency.

4
Relevant ERCOT Processes and Modules in KERMIT
Governor response
Regulation (AGC)
SCED
Unit Commitment
Inertia response First few seconds
10-30 seconds
20 seconds to 5 minutes
every 5 minutes
Every hour
KERMIT Modules
Separate Module outside of KERMIT

5
Metrics to use for reserve adequacy analysis
For planning scenarios, real time operation can be simulated with KERMIT for representative days in a year.
The following metrics can be used to assess reserve adequacy of future generation scenario:
•Sufficiency of available resources to balance renewables and load variability;•System frequency second to second; •Compliance with NERC’s Control Performance Standard 1, (CPS1 ≥ 100%),
If reserve adequacy is not established, higher reserve requirements should be added in production cost simulation and study needs to be re-ran.

6
Scenarios studied in KERMIT as a part of DOE LTS
• Scenario 3 (S3) – BAU all Tech
− 18 GW Wind & 2.5 GW Solar− Year 2022
• Scenario 8 (S8) Environmental with DR/EE mandates,
− 50 GW Wind & 1.5 GW Geothermal− Year 2016
7
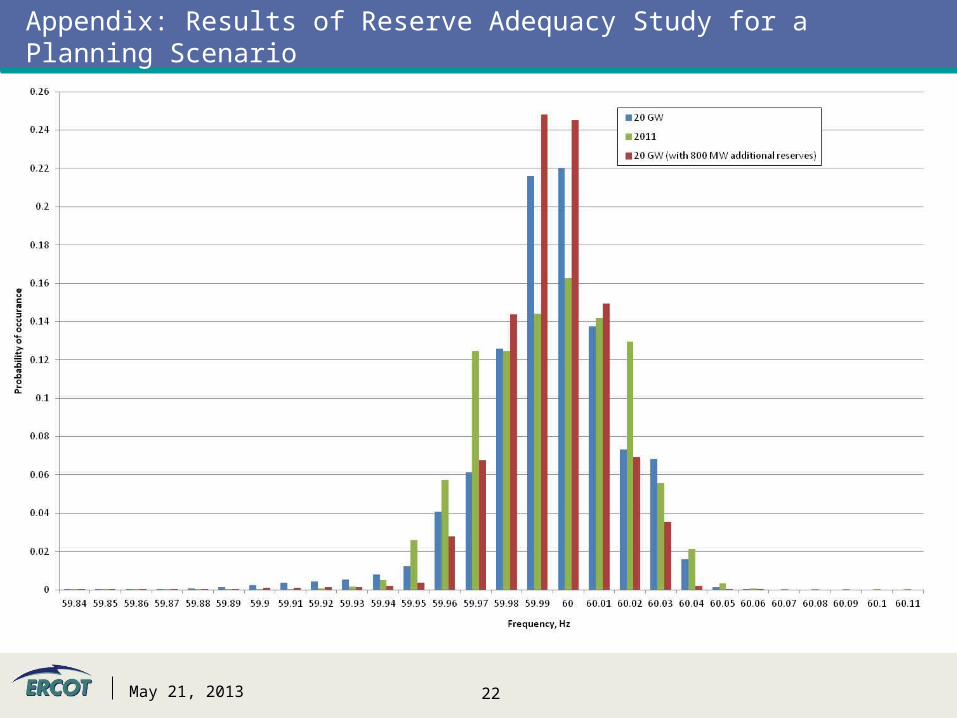
Results of Reserve Adequacy Study for Planning Scenarios
The results from the KERMIT study show:
•Unit commitment in both scenarios does not have sufficient dispatchable capacity to follow 5-minute to 5-minute net load ramp-ups in spring and autumn months (low load/high wind situations);
•In both scenarios without additional reserves, NERC Reliability Standard is not fulfilled (CPS1<100%);
•Hypothetical reserve with 0 start up time and ramping capability of 800MW/5min (S3) and 1300 MW/5min (S8) was added to achieve CPS1 score similar to the current situation;
•Seldom-occurring high-magnitude net load ramps call for significant increase in deployments of existing quick-start/non-spin reserves.
•In S8 at low load/high wind conditions, conventional generators are dispatched close to minimum and are not able to follow 5-minute to 5-minute net load ramp-downs. Wind energy curtailment.
8
Results of Reserve Adequacy Study for Planning Scenarios
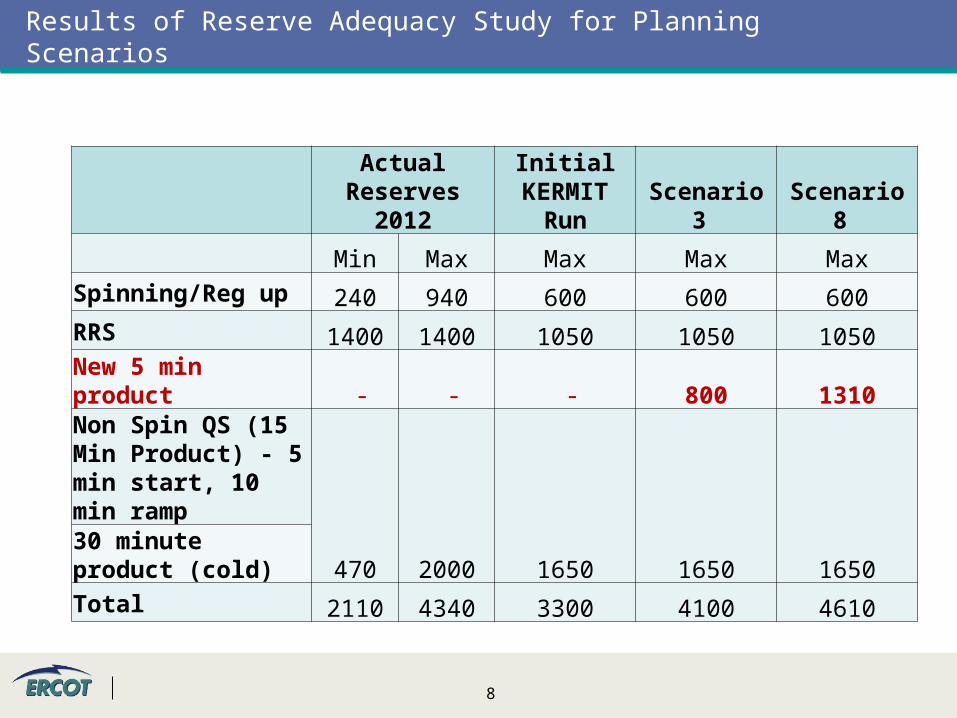
Actual Reserves 2012
Initial KERMIT Run Scenario 3 Scenario 8
Min Max Max Max MaxSpinning/Reg up 240 940 600 600 600RRS 1400 1400 1050 1050 1050
New 5 min product - - - 800 1310Non Spin QS (15 Min Product) - 5 min start, 10 min ramp
470 2000 1650 1650 165030 minute product (cold)Total 2110 4340 3300 4100 4610

9
Impact of the assumptions
• Only normal operation was studied with KERMIT for the future scenarios.
• Scenarios with large amount of renewable (non-synchronous) generation may lead to unacceptably large frequency deviations during generation outages.
• This may become a limiting factor on share of renewables that can be reliably integrated in the ERCOT system.
• The study was based on the assumption that ERCOT electricity market design will remain unchanged.
• More frequent deployment of non-spinning reserves and intra-day unit commitment compared to current situation may call for changes in market design and/or Ancillary Services products.
10
Conclusions
• ERCOT has recently improved the planning process to include the impact of high renewables on the system.
• In both studied scenarios the system needs more reserves through a new 5 min AS product or increase in Regulation Reserve requirement.
• There are a few but highly impactful high magnitude ramps caused by renewables
• Curtailments will be necessary to maintain system reliability in low load/high wind situations
• Simulation of generator outages in KERMIT may put additional restrictions on amount of renewables in ERCOT system and will be studied in the future work.
11
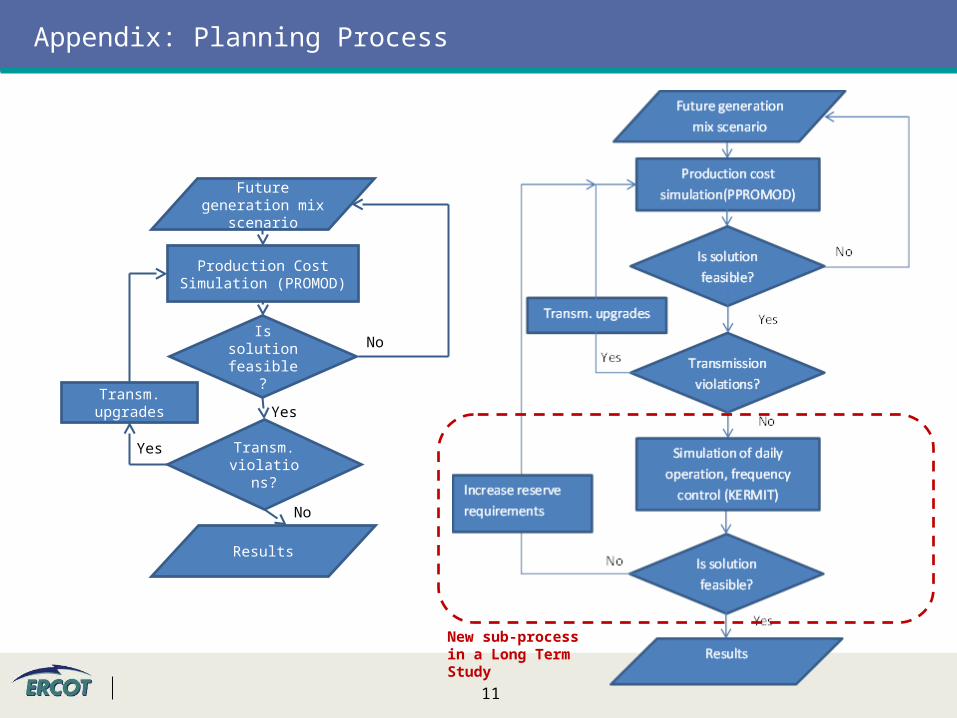
Appendix: Planning Process
Yes
No
Future generation mix scenario
Production Cost Simulation (PROMOD)
Is solution feasible?
Transm. violations?
Results
Transm. upgrades
Yes
No
New sub-process in a Long Term Study
12
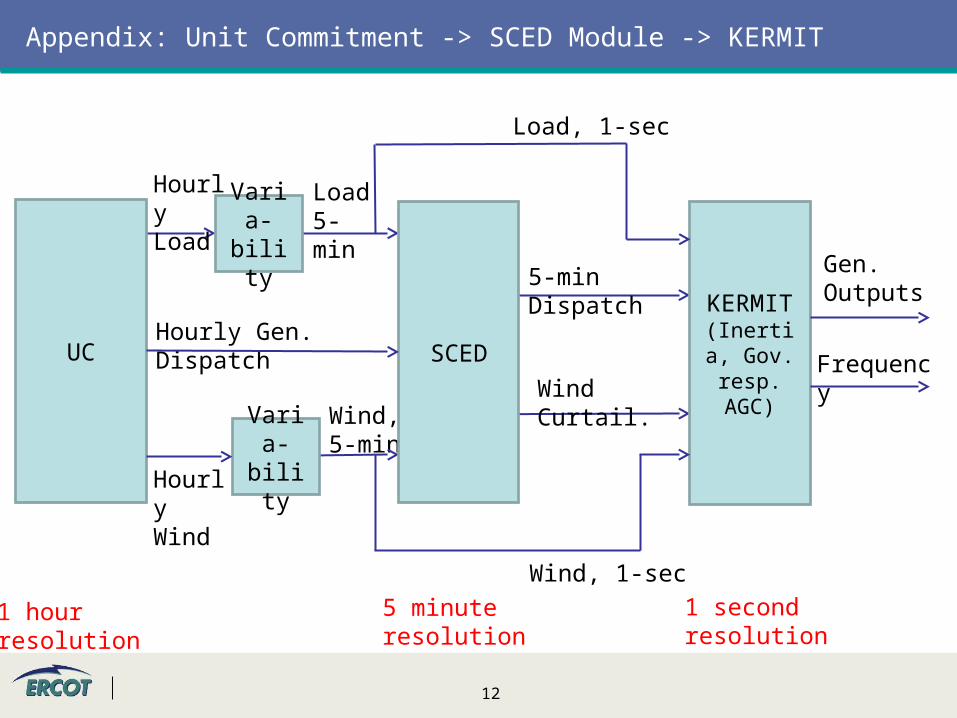
Appendix: Unit Commitment -> SCED Module -> KERMIT
Load 5-min
Wind, 5-min
Hourly Gen. Dispatch
5-min Dispatch
Wind Curtail.
KERMIT(Inertia,
Gov. resp. AGC)
Load, 1-sec
Wind, 1-sec
Gen. Outputs
FrequencyUC SCED
Varia-bility
Hourly Load
Varia-bilityHourly
Wind
1 hour resolution
5 minute resolution
1 second resolution

13
Appendix: KERMIT
Load (1-sec)
AGCFreq.
changeConv. Plants
Renewables
LoadRRS
Δf ΔPReg
Δf
Δf
PBPPRenew
PG
PRRS
PGen
PGen
PBP
Renew. (1-sec)
PLoad
PRenew.
SCED (5-min)
PBP
Δf
StorageΔfPStorage

14
Appendix: DOE LTS Scenario Examples
Economic assessments performed as part of the DOE study suggested increasing proportions of wind generation on the ERCOT system.
We needed to assess the adequacy of operational reserves for increasing proportions of wind and solar generation.
S3, 2022, 7GW of new wind, 2.5 GW solar S8, 2016, 39 GW of new wind
15
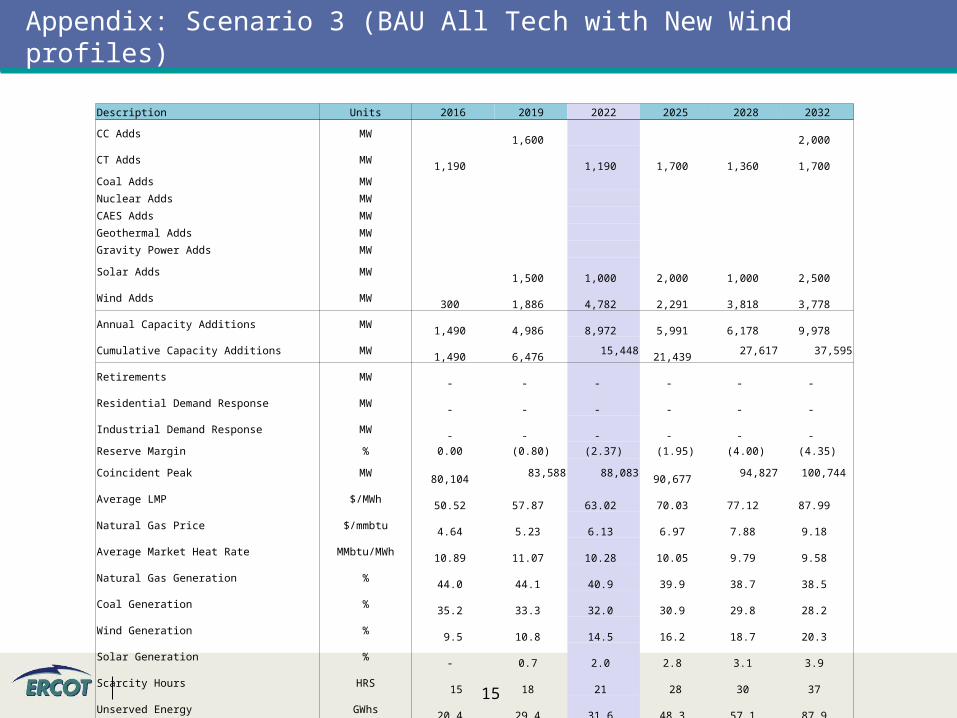
Appendix: Scenario 3 (BAU All Tech with New Wind profiles)
Description Units 2016 2019 2022 2025 2028 2032
CC Adds MW 1,600 2,000
CT Adds MW 1,190 1,190 1,700 1,360 1,700
Coal Adds MW
Nuclear Adds MW
CAES Adds MW
Geothermal Adds MW
Gravity Power Adds MW
Solar Adds MW 1,500 1,000 2,000 1,000 2,500
Wind Adds MW 300 1,886 4,782 2,291 3,818 3,778
Annual Capacity Additions MW 1,490 4,986 8,972 5,991 6,178 9,978
Cumulative Capacity Additions MW 1,490 6,476 15,448 21,439 27,617 37,595
Retirements MW - - - - - -
Residential Demand Response MW - - - - - -
Industrial Demand Response MW - - - - - -
Reserve Margin % 0.00 (0.80) (2.37) (1.95) (4.00) (4.35)
Coincident Peak MW 80,104 83,588 88,083 90,677 94,827 100,744
Average LMP $/MWh 50.52 57.87 63.02 70.03 77.12 87.99
Natural Gas Price $/mmbtu 4.64 5.23 6.13 6.97 7.88 9.18
Average Market Heat Rate MMbtu/MWh 10.89 11.07 10.28 10.05 9.79 9.58
Natural Gas Generation % 44.0 44.1 40.9 39.9 38.7 38.5
Coal Generation % 35.2 33.3 32.0 30.9 29.8 28.2
Wind Generation % 9.5 10.8 14.5 16.2 18.7 20.3
Solar Generation % - 0.7 2.0 2.8 3.1 3.9
Scarcity Hours HRS 15 18 21 28 30 37
Unserved Energy GWhs 20.4 29.4 31.6 48.3 57.1 87.9
SO2 Tons 356,096 355,301 356,347 356,442 357,140 357,409
CO2 (k) Tons 246,956 250,747 248,318 249,700 251,057 255,536
NOx Tons 276,450 276,541 273,803 273,774 274,846 273,963
16
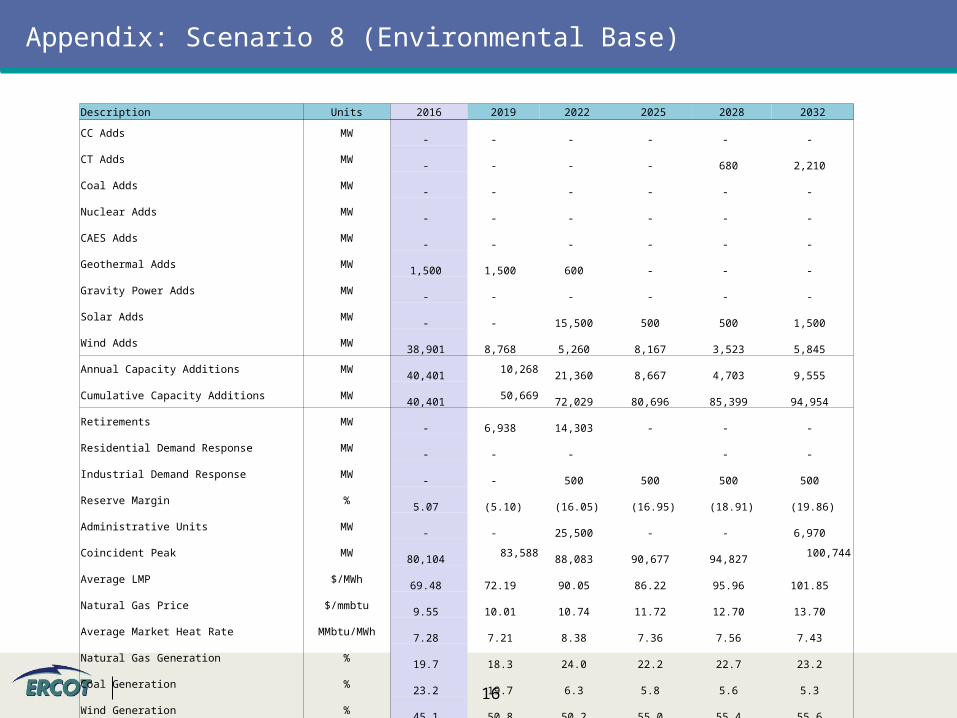
Appendix: Scenario 8 (Environmental Base)
Description Units 2016 2019 2022 2025 2028 2032
CC Adds MW - - - - - -
CT Adds MW - - - - 680 2,210
Coal Adds MW - - - - - -
Nuclear Adds MW - - - - - -
CAES Adds MW - - - - - -
Geothermal Adds MW 1,500 1,500 600 - - -
Gravity Power Adds MW - - - - - -
Solar Adds MW - - 15,500 500 500 1,500
Wind Adds MW 38,901 8,768 5,260 8,167 3,523 5,845
Annual Capacity Additions MW 40,401 10,268 21,360 8,667 4,703 9,555
Cumulative Capacity Additions MW 40,401 50,669 72,029 80,696 85,399 94,954
Retirements MW - 6,938 14,303 - - -
Residential Demand Response MW - - - - -
Industrial Demand Response MW - - 500 500 500 500
Reserve Margin % 5.07 (5.10) (16.05) (16.95) (18.91) (19.86)
Administrative Units MW - - 25,500 - - 6,970
Coincident Peak MW 80,104 83,588 88,083 90,677 94,827 100,744
Average LMP $/MWh 69.48 72.19 90.05 86.22 95.96 101.85
Natural Gas Price $/mmbtu 9.55 10.01 10.74 11.72 12.70 13.70
Average Market Heat Rate MMbtu/MWh 7.28 7.21 8.38 7.36 7.56 7.43
Natural Gas Generation % 19.7 18.3 24.0 22.2 22.7 23.2
Coal Generation % 23.2 19.7 6.3 5.8 5.6 5.3
Wind Generation % 45.1 50.8 50.2 55.0 55.4 55.6
Solar Generation % - - 6.8 6.7 6.7 6.9
Scarcity Hours HRS - 4.0 26.0 19.0 15.0 14.0
Unserved Energy GWhs - 2.0 46.4 35.4 22.1 33.2
SO2 Tons 217,810 192,720 23,108 23,003 21,436 21,696
CO2 (k) Tons 148,543 135,939 86,273 83,035 86,014 90,442
NOx Tons 171,238 156,730 83,051 80,534 83,277 86,848
17
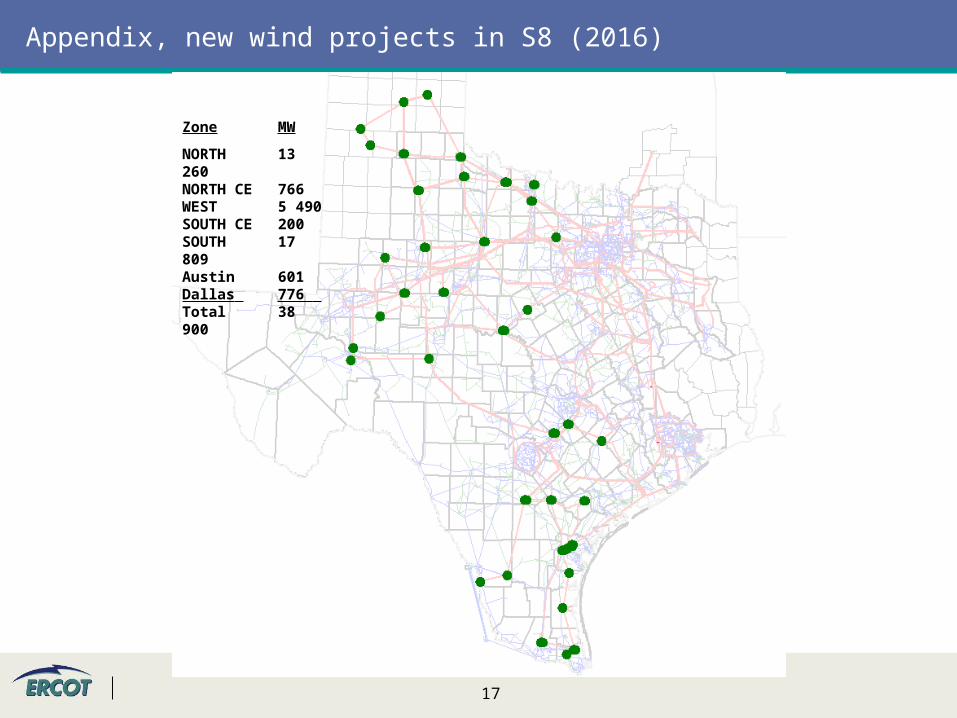
Appendix, new wind projects in S8 (2016)
Zone MW
NORTH 13 260NORTH CE 766 WEST 5 490 SOUTH CE 200 SOUTH 17 809Austin 601 Dallas 776 Total 38 900

18
Appendix, new wind projects in S3 (2022)
Zone MW
NORTH 4792NORTH CE 205WEST 1 971Total 6 968
Wind (7 GW)
Solar (2.5 GW)
Gas (17.9 GW)
19
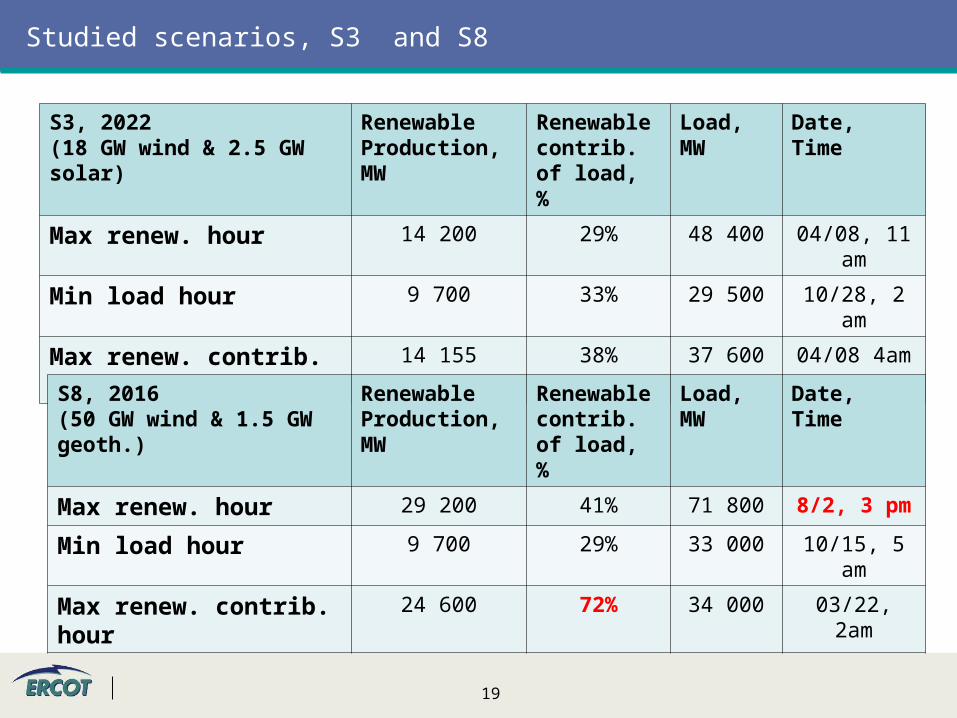
Studied scenarios, S3 and S8
S3, 2022(18 GW wind & 2.5 GW solar)
Renewable Production, MW
Renewable contrib. of load, %
Load, MW
Date, Time
Max renew. hour 14 200 29% 48 400 04/08, 11 am
Min load hour 9 700 33% 29 500 10/28, 2 am
Max renew. contrib. hour 14 155 38% 37 600 04/08 4am
S8, 2016(50 GW wind & 1.5 GW geoth.)
Renewable Production, MW
Renewable contrib. of load, %
Load, MW
Date, Time
Max renew. hour 29 200 41% 71 800 8/2, 3 pm
Min load hour 9 700 29% 33 000 10/15, 5 am
Max renew. contrib. hour 24 600 72% 34 000 03/22, 2am

20
Appendix: Integrating Renewables / KERMIT Study
May 21, 2013

21
Appendix: Integrating Renewables / KERMIT Study
May 21, 2013
22
Appendix: Results of Reserve Adequacy Study for a Planning Scenario
May 21, 2013


