Keeping Bad Science out of the Courtroom: Why Post-Daubert ...

JUDICIAL TREATMENT OF DAUBERT MOTIONS:
AN EMPIRICAL EXAMINATION
James C. Cooper, George Mason University School of Law
George Mason University Law and Economics Research Paper Series
15-12
This paper is available on the Social Science Research Network at http://ssrn.com/abstract=2593065

Judicial Treatment of Daubert Motions: An Empirical Examination
James C. Cooper*
DRAFT April 9, 2015
Abstract: In 1993, the Supreme Court established a new standard for the admissibility of expert evidence with its decision in Daubert v. Merrell Dow Pharmaceuticals. Daubert, provided an interpretation of Federal Rule of Evidence 702 that replaced the “general acceptance” standard under Frye v. United States, with one that focuses on methodological rigor. Several studies have attempted to examine the extent to which Daubert has been an effective gatekeeper in purging “junk science” from the courtroom. Rather than attempting to measure impacts from Daubert, this study examines the way in which courts handle Daubert motions. Utilizing a sample of 2,127 Daubert motions made in 1,010 private civil federal district court cases from 2003-2014, and involving 57 different causes of action, this paper empirically examines how courts handle Daubert motions. The data suggest that Daubert rulings serve as inflection points in litigation, and that the longer a Daubert motion pends with the court, the lower the odds of settlement. Using a Cox proportional hazards model, I estimate that the relative odds of settlement is nearly ten-times lower for cases with median motion pendency times compared to those in the 10th percentile, and cases with pendency times in the 90th percentile are three times less likely to settle than those with median pendency durations. The apparent impact of Daubert rulings on case termination suggests that courts might reduce litigation time and costs if they were to adopt “Lone Pine”-type procedures that structure expert discovery and concomitant Daubert motions early, especially for claims that require expert testimony to prove certain elements.
* Director, Research and Policy, Law & Economics Center, and Lecturer in Law, George Mason University School of Law. I thank Matthew Sibery, Elise Nelson, and Lindsey Edwards for research assistance.
1

1. INTRODUCTION AND BACKGROUND
In 1993, the Supreme Court established a new standard for the admissibility of expert evidence with its decision in Daubert v. Merrell Dow Pharmaceuticals.1 Daubert, along with Gen. Electric Co. vs. Joiner2 and Kumho Tires Co. v. Carmichael,3 provided an interpretation of Federal Rule of Evidence 702 that replaced the “general acceptance” standard under Frye v. United States,4 with one that focuses on methodological rigor. Further, the Court made clear in this trilogy that the trial judge would serve the gatekeeper function. Several studies have attempted to examine the extent to which Daubert has been an effective gatekeeper in purging “junk science” from the court room.5 Rather than attempting to measure impacts from Daubert, this study examines the way in which courts handle Daubert motions. Utilizing a sample of 2,127 Daubert motions made in 1,017 private civil federal district court cases from 2003-2014, and involving 57 different causes of action, this paper empirically examines how courts handle Daubert motions. This paper follows a handful of studies that also examine how Daubert has impacted the flow of expert testimony in courts,6 and contributes to this literature by bringing to bear a substantially larger sample and using statistical analysis to answer a broader array of questions.7 An important contribution of this paper is that it employs survival analysis to examine the impact of timing and outcome of Daubert motions on the likelihood that cases terminate early, either through settlement or summary judgment. This is an significant question from a policy perspective because to the extent that Daubert rulings reveal information about parties’ odds of prevailing at trial, they should make settlement more likely.8 Further, Daubert rulings that eliminate or greatly retard a plaintiff’s ability to mount a case—for example, by striking the testimony of a medical expert in a medical malpractice case—may lead to summary adjudication. Accordingly, if courts are not timely in their Daubert rulings, they may needlessly prolong litigation.
1 509 U.S. 579 (1993). 2 522 U.S 136 (1997). 3 526 U.S. 137 (1999). 4 293 F.1013 (D.C. Cir. 1923). 5 See, e.g., Eric Helland & Jonathan Klick, Does Anyone Get Stopped at the gate? An Empirical Assessment of the Daubert Trilogy in the States; Jennifer L. Groscup et al. , The Effects of Daubert on the Admissibility of Expert Evidence, 28 JUST. SYS. J 1 (2007); (2002); Lloyd Dixon & Brian Gill, Changes in the Standards for Admitting Expert Evidence in Federal Civil Cases Since the Daubert Decision, 8 PSYCHOL. PUB POL’Y & L 251 (2002); Edward Cheng & Albert Yoon, Does Frye of Daubert Matter? A Study of Scientific Admissibility Standards, 91 VA. L. REV. 471 (2005). 6 See NICOLE L. WATERS & JESSICA P. HODGE, THE EFFECTS OF THE DAUBERT TRILOGY IN DELAWARE SUPERIOR COURT (2005); Flores et al., Examining the Effects of the Daubert Trilogy on Expert Evidence Practices in Federal Civil Court: An Empirical Analysis, 34 S. IL. L. REV. 533 (2010). 7 Waters & Hodge examine 57 cases and Flores et al. examine 191 cases. 8 See Flores et al., supra note __ at 32 (quoting a South Carolina attorney who notes that Daubert rulings “play an important role in helping the parties evaluate their relative positions in the case and help parties understand the case in a way that helps them resolve it.”).
2

I find that the average time that a Daubert motion remains pending before the court after all briefing is complete is 84 days. Courts appear to take slightly longer to rule on defendants’ Daubert motions, and the distribution varies widely by court and by cause of action, but not over time. About three-quarters of all Daubert challenges are filed before summary judgment decisions. The data also show that defendants are more likely to win their Daubert motions than plaintiffs (.50 vs. .40), and that this directional pattern holds true across almost all causes of action. Whether a plaintiff wins a Daubert motion has the largest impact on subsequent litigation outcomes; the win rate is 1/3 lower for plaintiffs who lose their Daubert motions. The outcome of defendant Daubert motions appears to have little impact on subsequent litigation success. Consistent with anecdotal evidence from earlier studies, the analysis suggests that early Daubert decisions are likely to promote faster resolution of cases through either settlement or summary adjudication. Specifically, using a Cox proportional hazards model, I estimate that the relative odds of settlement is nearly ten-times lower for cases with median motion pendency times compared to those in the 10th percentile, and cases with pendency times in the 90th percentile are three times less likely to settle than those with median pendency durations. The apparent impact of Daubert rulings on case termination suggests that Courts might increase the efficiency of litigation if they were to adopt “Lone Pine”-type procedures, that structure expert discovery and concomitant Daubert motions early, especially for claims that require expert testimony to prove certain elements. The remainder of this paper is organized as followings. Section 2 describes the sample collection procedure and summary statistics for the sample. Section 3 presents the main empirical findings on duration, win rates, and the association between Daubert outcomes and case outcomes. Section 4 offers some policy suggestions and concludes. 2. SAMPLE OVERVIEW
2.1 Sample Construction To examine the Daubert ruling process in detail, including its impact on case outcomes, a random sample of private civil federal district court cases involving Daubert motions was collected for the years 2003-2014.9 The first step in this process was to find a sample of cases in which the court entertained a Daubert motion by using a broad search term in Lexis-Nexis Daubert tracker database. The cases returned from this broad search were then examined to assure that there they did not concern Rule 702 technicalities, such as failure to timely provide the identity of an expert or to make adequate disclosures. Those that did were excluded as the main interest of this research project is the judicial treatment of motions that require an evaluation of expert testimony under the Daubert standard. Cases that settled
9 The size was set to assure sufficient statistical power to detect relatively small average differences in metrics to be measured.
3

prior to the judge ruling on a Daubert motion were excluded from the sample, as were prisoner petitions. After this process, 1,017 cases comprise the final sample. 2.2 Summary of Sample Cases Table 1 provides some summary statistics for the cases in the sample. The sampled cases last an average of 1,005 days, and in almost all (87.9%), the plaintiff requested a jury trial. The average case length for those ending in trial is 1,069 days, compared with 990 days for both those ending settlement and summary judgment. Thus, it appears that the cases in the sample that end up at trial are not significantly longer than those settle or end in summary judgment. Indeed, those cases ending in summary judgment end about ten days sooner on average than those that settle. This finding suggests that case-specific factors related to case length also play a role in selection into settlement versus summary adjudication or trial. Most cases in the sample were resolved by settlement (62.1%), with remainder of resolutions being nearly evenly split between summary judgment and a trial verdict. Plaintiffs win 31.9 percent of cases that go to resolution: 46.7 percent of the cases that go to trial, and only 16 percent of those cases decided at summary judgment.
Table 1 Case Selection Summary
Cases 1,010 Average Duration: Days from Filing to Termination 1,005
Percent Jury Demand 87.9% Number of District Courts 91 Number of Judges 562 Resolution:
Summary Judgment 17.9% Trial 19.5% Settle 62.5%
Plaintiff Win Rate: across all resolution types 32.1% Summary Judgment 16.0% Trial 46.7%
The cases come from 91 of the 94 U.S. federal district courts. A full list is provided in the Appendix. The top ten most represented courts in terms of number of motions in the sample are: Middle District of Florida (76); Southern District of Florida (69); Minnesota (68); Eastern District of Missouri (65); Arizona (59); Colorado (57); Western District of Oklahoma (56); Eastern District of Pennsylvania (55); Southern District of Mississippi (53); and Northern District of Alabama (51). The
4
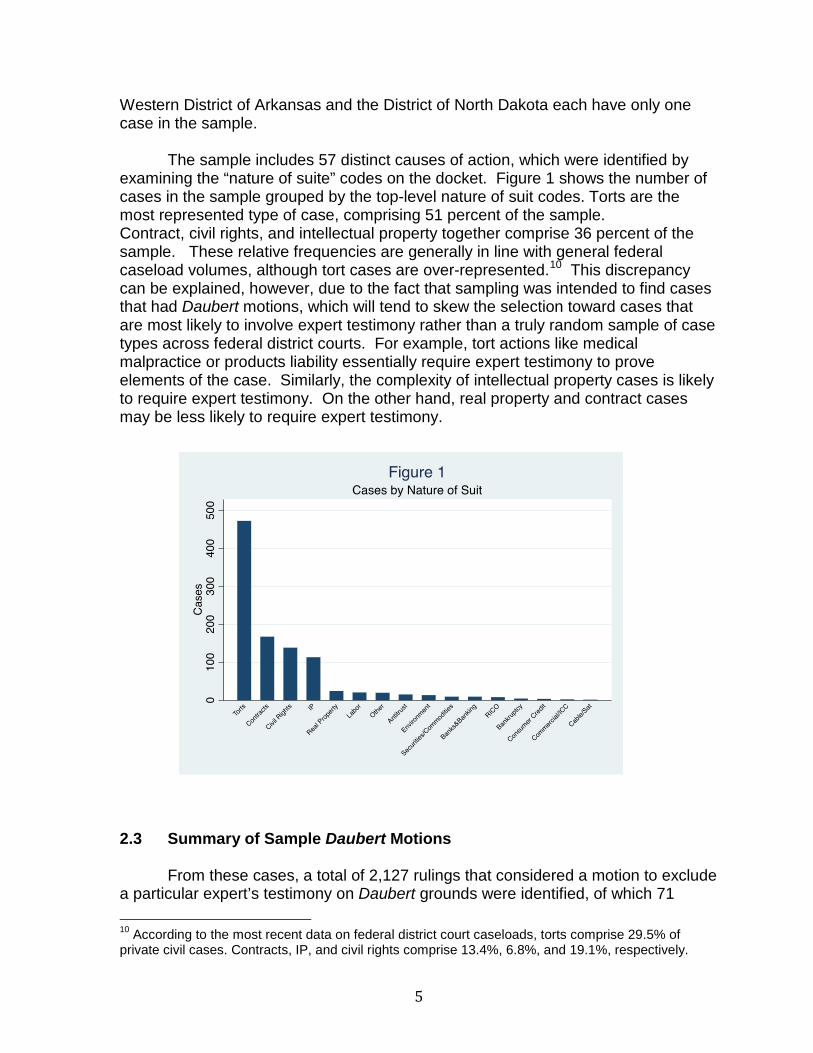
Western District of Arkansas and the District of North Dakota each have only one case in the sample. The sample includes 57 distinct causes of action, which were identified by examining the “nature of suite” codes on the docket. Figure 1 shows the number of cases in the sample grouped by the top-level nature of suit codes. Torts are the most represented type of case, comprising 51 percent of the sample. Contract, civil rights, and intellectual property together comprise 36 percent of the sample. These relative frequencies are generally in line with general federal caseload volumes, although tort cases are over-represented.10 This discrepancy can be explained, however, due to the fact that sampling was intended to find cases that had Daubert motions, which will tend to skew the selection toward cases that are most likely to involve expert testimony rather than a truly random sample of case types across federal district courts. For example, tort actions like medical malpractice or products liability essentially require expert testimony to prove elements of the case. Similarly, the complexity of intellectual property cases is likely to require expert testimony. On the other hand, real property and contract cases may be less likely to require expert testimony.
2.3 Summary of Sample Daubert Motions From these cases, a total of 2,127 rulings that considered a motion to exclude a particular expert’s testimony on Daubert grounds were identified, of which 71
10 According to the most recent data on federal district court caseloads, torts comprise 29.5% of private civil cases. Contracts, IP, and civil rights comprise 13.4%, 6.8%, and 19.1%, respectively.
5

percent were made by defendants to exclude plaintiff experts and 29 percent by plaintiffs to exclude defendant experts. The number of Daubert rulings is greater than the number of cases because almost half (480) of the cases in the sample involve multiple Daubert motions. For example, a plaintiff may file Daubert motions against two of the defendant’s experts, and the defendant may file a Daubert motion against one of the plaintiff’s expert, causing there to be three separate motions for one case. There are an average of 2.1 motions per case. Table 2 shows the distribution of motions over time. The most heavily sampled years are 2006 and 2011-2013. Only a handful of cases come from 2003, 2004, or 2014.
Table 2 Observations by Year
Ruling Year Number of Observations
2003 1 2004 3 2005 40 2006 674 2007 78 2008 44 2009 36 2010 91 2011 174 2012 175 2013 798 2014 13
Table 3 lists motions by expert type. Experts in the medical field, which include doctors, psychologists/psychiatrists, and experts in other fields of medicine—e.g., pharmacology, toxicology, radiology—comprise the largest group in the sample (31%). Engineering, technical, and environmental science experts make up 24 percent of the sample. Accountants comprise ten percent of the sample. Legal, business, accident reconstruction experts, economists, police/law enforcement, vocational, and public administration experts round out the rest of the sample. Experts in social and behavioral sciences (e.g., anthropology) are less than one percent of the sample.
Table 3
6

Types of Experts
Expert Category Frequency Percentage
Medical 665 31.27% Medical Doctor 366 17.21%
Medical Science* 197 9.26%
Psychologist/Psychiatrist 102 4.80%
Engineering/Technical/Environmental 502 23.60% Accountant 221 10.39% Legal 168 7.90% Business 119 5.59% Accident Reconstruction And Investigation 113 5.31% Economist 102 4.80% Police/Law Enforcement 58 2.73% Vocational Expert 53 2.49% Public Administration 42 1.97% Social & Behavioral Sciences 19 0.89% Other** 65 3.06%
2,127 100.0%
Notes: *Medical Science contains individuals with the following expertise: pharmacology, toxicology, chemistry, forensic science, biology, nursing, biostatistics, radiology, medical devices, biochemistry, biotechnology, cancer research, cardiovascular disease, microbiology, molecular biology, nursing, pharmaceutical chemistry, and physiology. **Other included the following: admiralty/maritime, aviation, transportation, language/linguistics, art, athletics, bass fishing, communications, coroner, driving, drug trafficking, food & product safety, furniture valuation, hypnosis, labels & warnings, Muslim charities, nutrition, paints, philosophy, photography, radio personality, recreation, religion, security management, sports, studio television production, taekwondo, trucking. No expert category comprises more than 0.42% of the sample. Two types of expertise occurred with this frequency: admiralty/maritime and aviation.
Table 4 breaks down experts by the causes of action that comprise more than 90 percent of the sample: contracts, torts, civil rights, intellectual property (IP), real property, labor, and antitrust. The relative ranking of expert use varies across cases. Because torts comprise the largest part of the sample, it should not be surprising that for most categories of experts, the majority is found in torts claims. This is especially true for medical doctors and engineering/technical/environmental experts (285). There are a few exceptions. Accountants and business experts are most prevalent in contracts, legal experts are most prevalent in IP, and police/law enforcement experts are most prevalent in civil rights claims. Although medical science experts are used predominantly in torts claims, psychologists/psychiatrists are also prevalent in civil rights cases. Not surprisingly, economists comprise the majority of experts used in antitrust, and real property claims rely predominantly on engineering/technical/environmental experts.
7

Table 4 Expert Type by Nature of Suit
Expert Category Contracts Torts Civil Rights IP Real
Property Labor Antitrust
Medical 38 484 73 25 5 8 1 Medical Doctor 28 285 37 7 0 2 1
Medical Science* 15 144 8 15 1 3 0
Psychologist/Psychiatrist 5 55 28 3 4 3 0
Engineering/Technical/Environmental 84 285 21 44 23 3 6 Accountant 85 31 16 41 8 8 8 Legal 37 35 21 41 5 5 0 Business 34 25 9 20 9 2 3 Accident Reconstruction And Investigation 9 97 4 0 1 0 0 Economist 11 26 16 14 3 3 16 Police/Law Enforcement 5 19 32 0 1 0 0 Vocational Expert 4 30 9 3 1 2 0 Public Administration 3 8 25 1 2 2 0 Social & Behavioral Sciences 1 5 7 1 1 0 1 Other** 3 30 10 7 0 1 0 324 1,087 243 197 59 34 35
Notes: *Medical Science contains individuals with the following expertise: pharmacology, toxicology, chemistry, forensic science, biology, nursing, biostatistics, radiology, medical devices, biochemistry, biotechnology, cancer research, cardiovascular disease, microbiology, molecular biology, nursing, pharmaceutical chemistry, and physiology. **Other includes the following: admiralty/maritime, aviation, transportation, language/linguistics, art, athletics, bass fishing, communications, coroner, driving, drug trafficking, food & product safety, furniture valuation, hypnosis, labels & warnings, Muslim charities, nutrition, paints, philosophy, photography, radio personality, recreation, religion, security management, sports, studio television production, taekwondo, trucking. No expert category comprises more than 0.42% of the sample. Two types of expertise occurred with this frequency: admiralty/maritime and aviation.
3. EMPIRICAL FINDINGS This section examines the outcomes and durations of Daubert motions, as well as the relationship between Daubert outcomes and subsequent litigation outcomes. 3.1 Win Rates Table 5 reports moving party Daubert win-rates from 2005-2013. A “Full Grant” is a rulings that provide the moving party all of the relief they requested in their motion, such as total exclusion of an expert’s testimony. A “partial grant” is a ruling that provides the moving party some of their requested relief, such as exclusion of a portion of an expert’s testimony or analysis. Defendants are more likely to win their motions—either fully or partially—than plaintiffs (.22 & .53 vs. .21 & .45). There do not appear to be any strong trends over the time period.
8

Table 5
Daubert Win Rates: 2005-2013 Defendant Motion Plaintiff Motion Year Full
Grant Any
Grant Full
Grant Any
Grant
2005 .23 .27 .36 .50
2006 .31 .56 .16 .39
2007 .21 .51 .38 .57
2008 .31 .48 0 0*
2009 .25 .46 .13 .25
2010 .35 .51 .10 .23
2011 .19 .33 .09 .33
2012 .23 .39 .18 .37
2013 .22 .53 .21 .45
Total .25 .50 .18 .40 Notes: 2003, 2004, and 2014 excluded because of small sample sizes. *No winning motions for plaintiffs in the sample for 2008. Table 6 examines plaintiff and defendant motion win rates by the nature of the suit. Defendants generally have more success across all causes of action save real property and intellectual property. Defendants’ likelihood of obtaining at least a partial grant of their Daubert motion is highest for antitrust and consumer credit cases and over 50 percent for five categories (antitrust, contracts, torts, civil rights, RICO, and consumer credit). Real property and contracts are the causes of actions that have the highest level of plaintiff success in obtaining any relief, although plaintiff odds of success are below 50 percent across all types of claims.
9

Table 6 Daubert Motion Win Rates: By Nature of Suit
Defendant Motion Plaintiff Motion
Nature of Suit Full Grant
Any Grant
Full Grant Any Grant
Contracts .23 .52 .19 .43 Real Property .19 .38 .41 .47 Torts .30 .52 .16 .37 Antitrust .04 .59 .25 .38 Bankruptcy .38 .38 0 0 Banks & Banking .27 .36 - - Civil Rights .21 .56 .17 .37 Commercial/ICC - - 0 0 RICO .20 .53 0 0 Consumer Credit 0 .60 - - Labor .27 .27 0 .38 Cable/Sat - - 1 1 IP .13 .39 .22 .42 Securities/Commodities .08 .42 0 0 Environment .09 .42 0 .25
3.2 Timing of Daubert Rulings Another important research question is the time it takes judges to rule on Daubert motions. As discussed above, by providing litigants more information about the quality of their case, Daubert rulings are likely to encourage settlement, which reduces use scarce judicial resources.11 The more quickly judges decide these motions, the sooner parties may disengage from litigation. This section first examines univariate statistics and then estimates a multivariate survival model to control simultaneously for potential multiple influences on the timing of Daubert rulings. 3.2.1 Univariate Statistics Table 7 shows the timing of Daubert motion filing. The vast majority (73.7%) of parties file Daubert motions either sometime prior to summary judgment. This finding is consistent with Flores et al.’s study of South Carolina federal district courts, which found that after rule 26 disclosures judges “see a motion in limine to exclude
11 See Flores et al., supra note__, at 41 (finding that when a defendant’s motion to exclude is denied, “then serious settlement talks are usually provoked.”); Waters & Hodge, supra note__, at 16 (finding that after Daubert, defendants’ denied motions to excluded tended to lead to out of court settlements).
10

testimony, followed by a flurry of briefs opposing or supporting.”12 Another 26 percent of Daubert motions come after summary judgment, and only .2 percent of the Daubert motions in the sample were made at trial. These patterns are similar across plaintiff and defendant motions, but plaintiffs tend to file a larger proportion of their Daubert motions after summary judgment. Daubert hearings are rare: only 15.8 percent of all Daubert motions involve a hearing, although—and perhaps not surprisingly—37.8 percent of Daubert motions made at trial have a hearing.13
Table 7 Timing of Daubert Motions
Percent Filed Case Commencement to Daubert Motion (Days)
Average Median Prior to Summary Judgment 73.7% 786 666
After Summary Judgment & Before Trial
26.1% 881 704
At Trial .2% 618 633 Total 813 647 The average time from the case commencement date to the filing of a Daubert motion is over two years (813 days), but a substantially lower median (647 days) suggests that the mean is skewed by outliers. The median time increases as the timing of the filing moves from before to after summary judgment. Interestingly, the shortest average and median times to file Daubert motions occur when cases go to trial, suggesting that there is some factor associated with cases selected into trial that make them move more quickly. Table 8 reports the average and median times (in parentheses) for judges to rule on Daubert motions, measured both from the time the moving party filed the motion and from the time that the last Daubert brief was filed. For the full sample, it takes on average 125 days from initial filing of the Daubert motion to ruling, and 84.2 days from the filing of the last brief associated with the Daubert motion until ruling. Courts appear to take longer to rule on defendant motions. The median durations for all categories are around 30-40 days shorter than the averages, suggesting that these averages are driven in large part by outliers.
12 Flores et al., supra note__, at 41. 13 See id. at 41 (judges reporting that Daubert hearings are “rare”).
11

Table 8 Pendency Time for Daubert Motions
Duration in Days Moving Party: Filing to
Decision Last Brief to
Decision
Defendant 131.2 (90)
87.0 (54.5)
Plaintiff 108.7 (70)
77.5 (42)
All 124.7 (84)
84.2 (51)
Notes: Medians in parentheses. This can be seen in Figures 2a and 2b, which show the distribution of Daubert motion pendency durations. Most motions are ruled on closer to the median time of around 84 days from filing to decision or 51 days from last briefing until decision. The distribution of last brief to ruling is much less dispersed than that of filing-to-ruling likely due to the fact that more factors can interfere with the case flow in the time between filing the motion and final brief that have little to do with judicial attention paid to the Daubert motion. For example, parties may file other motions or request extensions to file response and reply briefs. Accordingly, in what follows, unless otherwise noted, the focus is on the duration from the last brief—rather than filing—to the Daubert ruling, as this measure is more likely to capture factors that are within judicial control.
12

Because a large number of Daubert motions are filed with summary judgment, many Daubert decisions are handed down with summary judgment rulings. This factor could bias duration upwards, as courts may wait to rule on all motions together. Table 9 breaks down average pendency durations by the timing of the ruling. The data are consistent with the conjecture; courts that rule on summary judgment and Daubert motions simultaneously take around a month longer than those ruling before summary judgment, and about 19 days longer than those that rule on a Daubert motion after summary judgment. These differences persist when measured at medians as well.
13

Table 9 Days Pending by Timing of Ruling
Time of Ruling: Mean Median Number
Before SJ 73.9 49 513
With SJ 101.9 69 599
After SJ 84.1 40 595
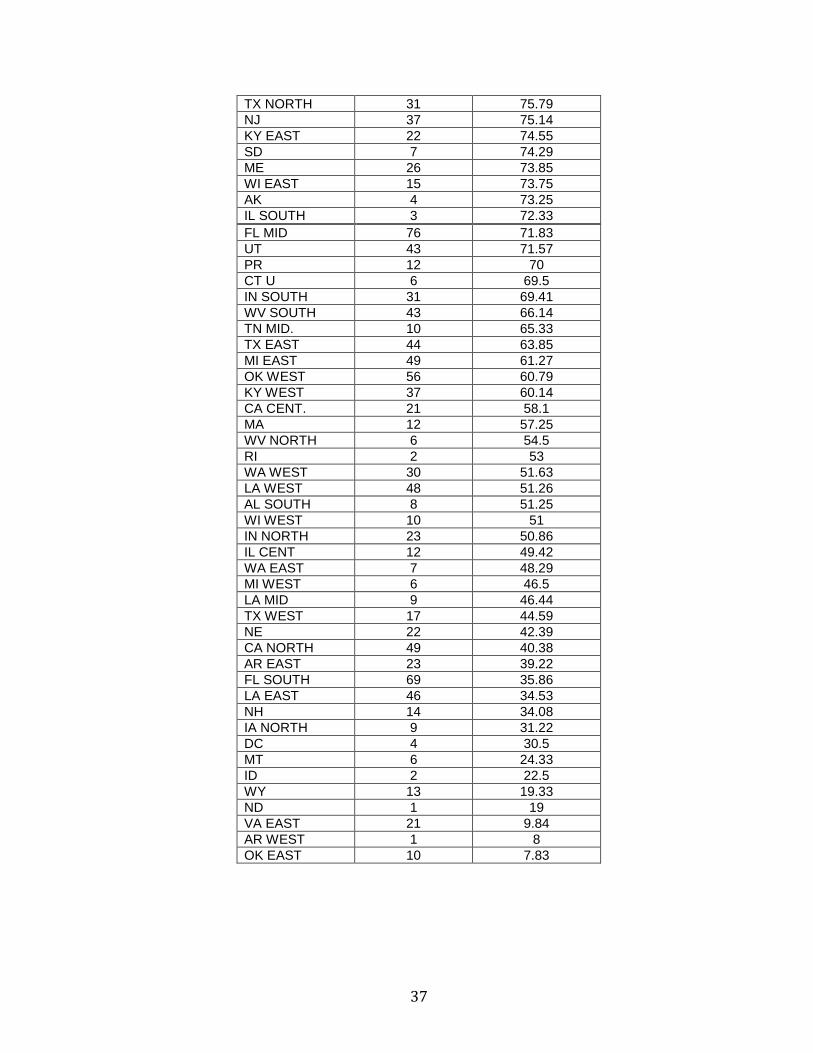
Next I examine the extent to which the timing of Daubert rulings varies by court and by cause of action. Figure 3 shows the distribution of average and median duration of Daubert motion pendency from the time of the last brief for each court, ranked by average from highest to lowest. Clearly, there is a large distribution, ranging from nearly 300 days to less than ten days. Further, differences between medians and averages exist for most courts, suggesting skewed distributions of duration within courts as well as across them.
14

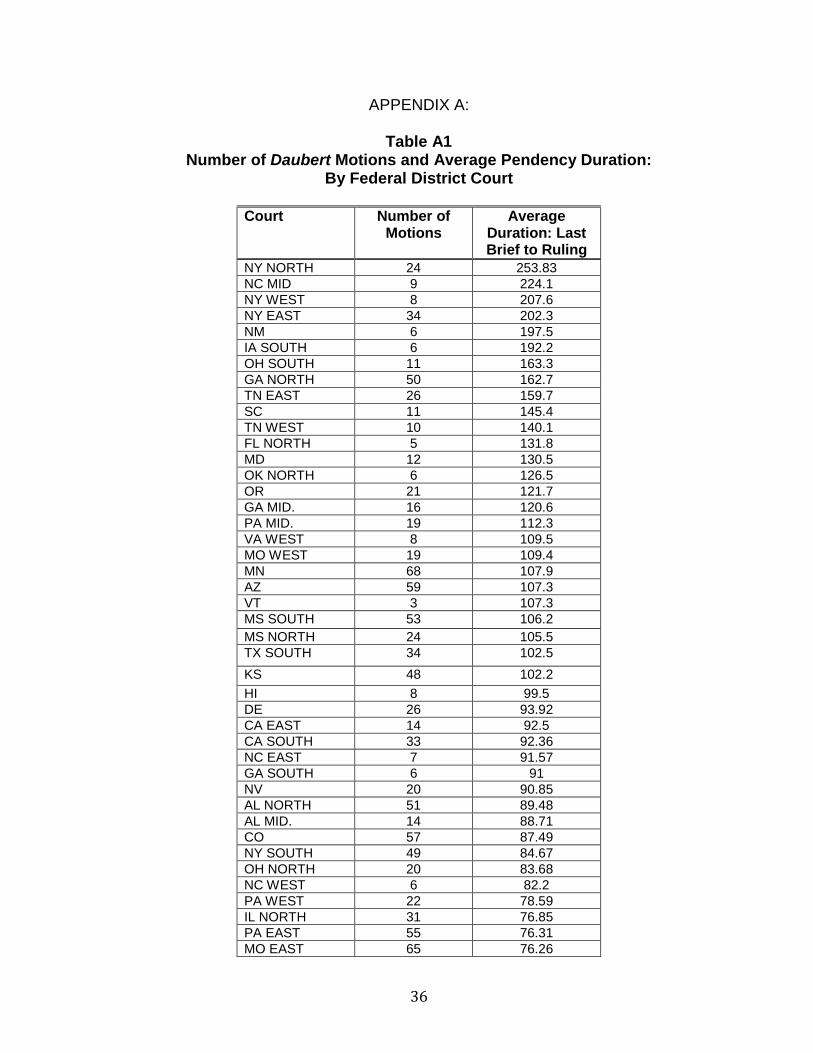
Table A1 in the Appendix, provides the detail underlying Figure 3. The Northern District of New York has the highest average duration (254 days), followed by the Middle District of North Carolina (224 days), and the Western District of New York (208 days), although the latter two are based on very small samples (9 and 8 motions, respectively). The average duration of Daubert pendency in the Eastern District New York is 202 days. The shortest durations are found in the Western District of Arkansas (8 days) and the Eastern District of Oklahoma (7.8 days), again these are very small sample sizes (1 and 10, respectively). The Eastern District of Virginia has the lowest average durations (9.8 days) of those districts with reasonable samples sizes (22), consistent with this district’s moniker “the rocket docket.” Table 10 lists average and median pendency times by nature of suit. The type of suit may impact the time it takes a court to rule to the extent that different causes of action involve more complexity. The longest average durations are cases involving ICC/Commercial nature of suit codes. However, these data come from only one case with two Daubert motions, so it is unlikely to be representative of these types of cases. Of suit types that have meaningful sample sizes, environmental cases have the longest average and median durations (203 and 165 days, respectively). The causes of action with the most observations – torts, contracts, intellectual property, and civil rights – all have relatively similar average (median) durations, ranging from 65 to 81 (34-51) days. It is also interesting to note that intellectual property disputes and antitrust, which often deal with highly technical issues and complex statistics, have among the lowest pendency times. Further, these cases have significantly lower pendency times than real property, civil RICO, or labor claims. These finding suggest that the time it takes a court to rule on a Daubert motion may have little to do with the underlying complexity of the case.
15
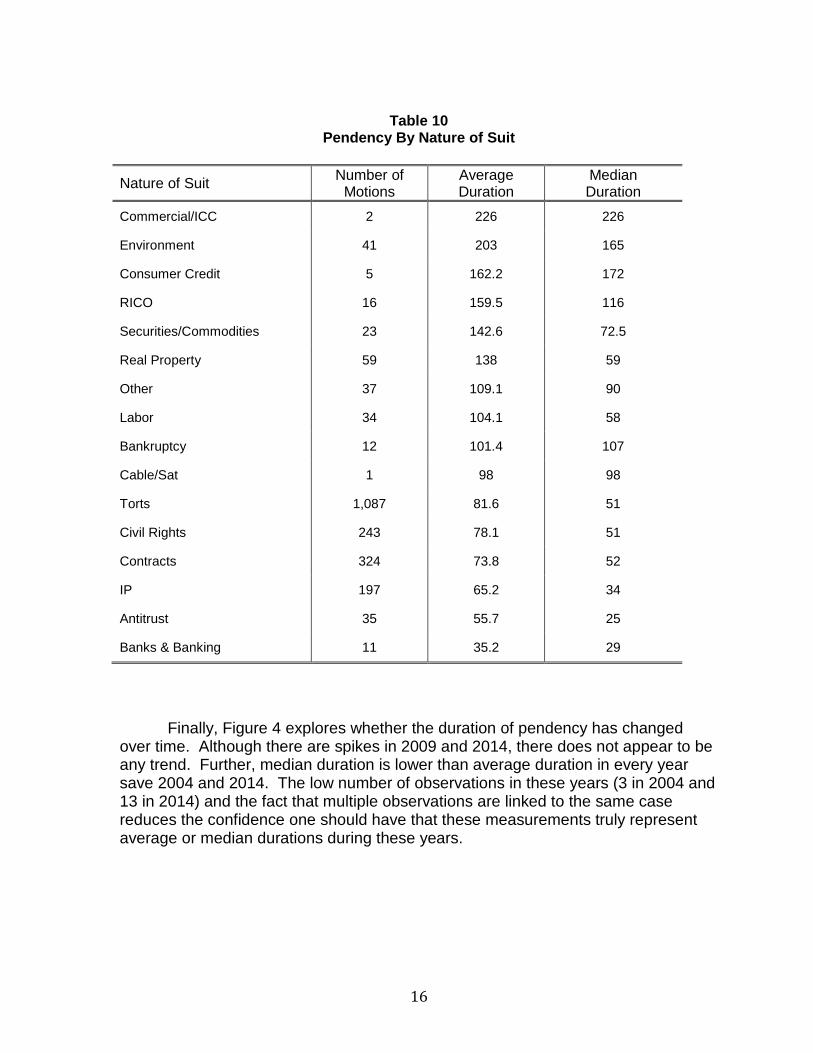
Table 10
Pendency By Nature of Suit
Nature of Suit Number of Motions
Average Duration
Median Duration
Commercial/ICC 2 226 226
Environment 41 203 165
Consumer Credit 5 162.2 172
RICO 16 159.5 116
Securities/Commodities 23 142.6 72.5
Real Property 59 138 59
Other 37 109.1 90
Labor 34 104.1 58
Bankruptcy 12 101.4 107
Cable/Sat 1 98 98
Torts 1,087 81.6 51
Civil Rights 243 78.1 51
Contracts 324 73.8 52
IP 197 65.2 34
Antitrust 35 55.7 25
Banks & Banking 11 35.2 29
Finally, Figure 4 explores whether the duration of pendency has changed over time. Although there are spikes in 2009 and 2014, there does not appear to be any trend. Further, median duration is lower than average duration in every year save 2004 and 2014. The low number of observations in these years (3 in 2004 and 13 in 2014) and the fact that multiple observations are linked to the same case reduces the confidence one should have that these measurements truly represent average or median durations during these years.
16

3.2.2 Survival Analysis This section presents results from a survival model, which is used to control for multiple influences on the length of time that it takes courts to rule on Daubert motion. Survival analysis estimates the probability that a subject will survive to time t+1 given that they have survived to time t. Subjects remaining in the sample—or those that survive to time t—are said to be at hazard of suffering a failure event (e.g., a death or a mechanical failure) that removes them from the sample. In the following analysis, the “subject” is a Daubert motion and the failure event that ends survival of a motion is a judicial ruling. Thus, S(t) measures the probability of a Daubert motion pending at time t given that it has yet to be ruled on. Figure 5 shows the baseline survival function for all cases. Rulings occur rapidly for most cases – after fifty days of pendency, courts have ruled on half of the motions, and after 100 days over 70 percent of Daubert motions have been decided. As time goes on, however, the slope of the survival function flattens, indicating that a decreasing number of rulings occur each period.
17

Figure 6 shows the baseline survival function for each of the most common causes of action in the sample—contracts, torts, IP, and Civil rights.14 All have very similar Daubert survival rates except for IP cases, for which it appears that courts dispose of Daubert motions more quickly. For example, after 50 days, half of the Daubert motions are still pending (surviving) for torts, contracts, and civil rights claims, whereas only 39 percent of claims are still pending for IP cases.
14 Together, these causes of action comprise 87 percent of the sample.
18

To examine the impact of multiple factors that are likely to influence the timing of Daubert rulings, I estimate a Cox proportional hazards model:
ℎ(𝑡𝑡;𝑋𝑋)ℎ0(𝑡𝑡) = 𝑒𝑒𝛽𝛽𝑋𝑋. (1)
In (1), ℎ(𝑡𝑡;𝑋𝑋)
ℎ0(𝑡𝑡) is the ratio of the hazard rate conditional on covariates X to the baseline hazard function (ℎ0(𝑡𝑡)), which is the rate of failure at time t without the influence of any covariates. 15 The term 𝑒𝑒𝛽𝛽𝑋𝑋 is a scaling factor that shifts the hazard ratio depending on the values in �̂�𝛽, which is a vector of estimated regression coefficients.16 As with the survival analysis, the failure event is a Daubert ruling, and t measures the time from the last Daubert brief until ruling. Table 11 presents estimates of this model with various controls. The parameter estimates are hazard ratios, which in this context measure the change in relative risk of a ruling occurring at any time due to a one-unit change in a control variable. Parameter estimates greater than one suggest that the variable increases the likelihood of a ruling at any time, and those less than one suggest the opposite. The first specification controls for which party filed the motion, whether the motion was granted or denied, when the motion was filed (before or after summary judgment), the total number of Daubert motions filed in the case, and the cause of action. There is no statistically significant association between Daubert outcome, the number of motions, or the party filing a Daubert motion and the time it pends before a court. Somewhat surprisingly, the results suggest that relative to a motion filed after summary judgment, a motion filed before summary judgment is 16 percent less likely to be ruled on at any given time. This result may be picking up the fact that, as reported in Table 9, the longest pendency times are for those Daubert motions resolved with summary judgment motions, and that many judges wait to resolve summary judgment and Daubert rulings simultaneously. Real Property, RICO, Consumer Credit, Commercial, Cable, and Environmental cases all are associated with longer pendency times (relative to the baseline of Contract cases), whereas Daubert motions in Banking cases are almost twice as likely as Contract cases to be ruled on at any given time.17
15 The hazard function underlies the survival function, and it measures the instantaneous rate at which an event that takes a subject out of the sample will occur at time t+1 given that it has not occurred to that point. Formally, thee survival function, S(t) is related to the hazard rate, h(t) in the following manner: 𝑆𝑆(𝑡𝑡) = 𝑓𝑓(𝑡𝑡)
ℎ(𝑡𝑡) , where f(t) is the probability density function of time to failure. See
GREENE, ECONOMETRICS. 16 This is a class of proportional hazard models, in which covariates are assumed to shift the baseline hazard by the same amount for all values of t. The Weibull, which is more flexible, was also estimated and yields almost identical results. 17 Some of the causes of action have low numbers of observations (e.g., Cable = 1; Commercial = 2; Consumer Credit = 5), so these estimates should are not likely to be reliable.
19
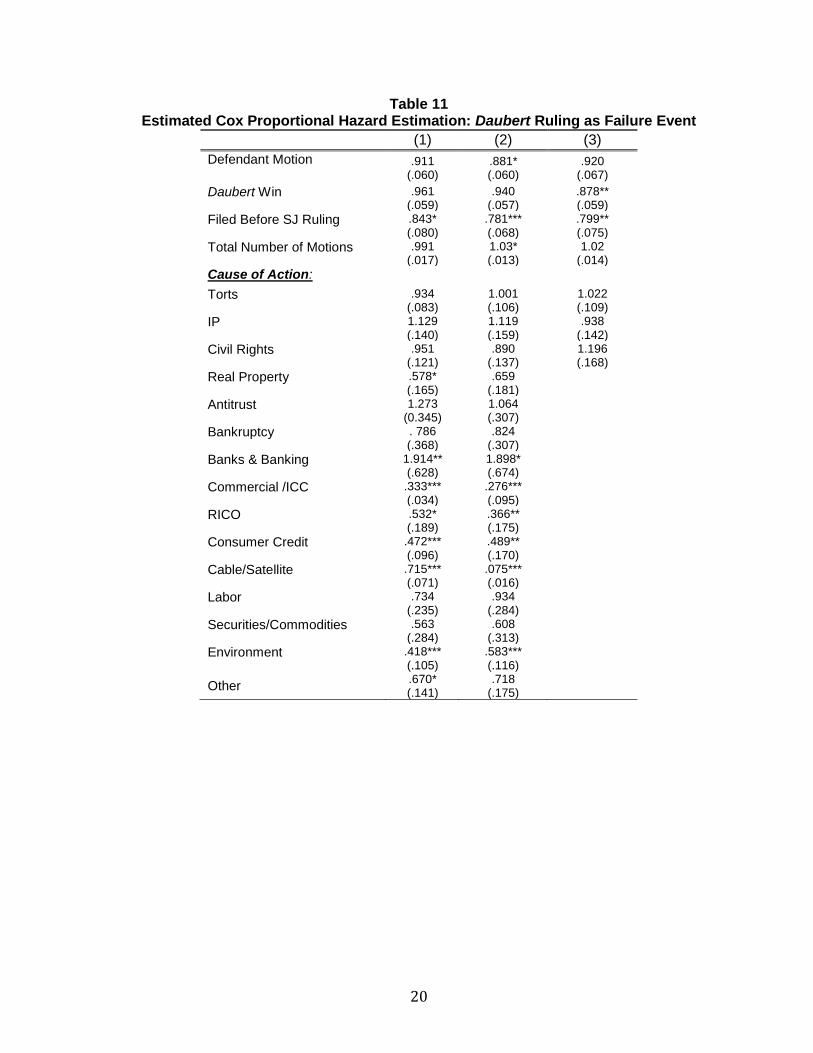
Table 11 Estimated Cox Proportional Hazard Estimation: Daubert Ruling as Failure Event
(1) (2) (3) Defendant Motion .911
(.060) .881* (.060)
.920 (.067)
Daubert Win .961 (.059)
.940 (.057)
.878** (.059)
Filed Before SJ Ruling .843* (.080)
.781*** (.068)
.799** (.075)
Total Number of Motions .991 (.017)
1.03* (.013)
1.02 (.014)
Cause of Action:
Torts .934 (.083)
1.001 (.106)
1.022 (.109)
IP 1.129 (.140)
1.119 (.159)
.938 (.142)
Civil Rights .951 (.121)
.890 (.137)
1.196 (.168)
Real Property .578* (.165)
.659 (.181)
Antitrust 1.273 (0.345)
1.064 (.307)
Bankruptcy . 786 (.368)
.824 (.307)
Banks & Banking 1.914** (.628)
1.898* (.674)
Commercial /ICC .333*** (.034)
.276*** (.095)
RICO .532* (.189)
.366** (.175)
Consumer Credit .472*** (.096)
.489** (.170)
Cable/Satellite .715*** (.071)
.075*** (.016)
Labor .734 (.235)
.934 (.284)
Securities/Commodities .563 (.284)
.608 (.313)
Environment .418*** (.105)
.583*** (.116)
Other .670* (.141)
.718 (.175)
20

Table 11(cont.) Estimated Cox Proportional Hazard Estimation:
Daubert Ruling as Failure Event
Expert Type:
Accountant - .948 (.158)
.979 (.169)
Business - .791 (.139)
.692** (.130)
Economics - .903 (.164)
.930 (.182)
Engineering, Technical, Environmental
- .785* (.114)
.732** (.107)
Law - .909 (.145)
.845 (.139)
Medical - .757 ** (.108)
.703** (.101)
Police/Law Enforcement - 1.049 (.202)
1.043 (.209)
Public Administration - 1.017 (.178)
.987 (.179)
Social & Behavioral Sciences
- .684 (.183)
.706 (.206)
Vocational Expert - 1.259 (.342)
1.421 (.426)
Other - .840 (.152)
.816 (.157)
Court Controls N Y Y Year Controls N Y Y N 2,000 1,999 1,736 Wald Chi2 515.44*** 1469.14*** 1355.49***
Notes: ***Significant at 1% level; **Significant at 5% level; *Significant at 10% level. The second specification includes additional controls for court, expert type, and year. This time, the hazard ratio for party is statistically significant, suggesting that defendants’ motions are 12 percent less likely than plaintiffs’ motions to be ruled upon. The results also show a small (2%) increase in odds that a motion is ruled on associated with each additional motion. The coefficients on causes of action reveal the same pattern as specification (1). The only types of experts that have a statistically significant association with Daubert ruling timing are engineering/technical/environmental and medical experts, each associated with 22 and 26 percent lower odds of resolution, respectively. The third column repeats the analysis, but restricts it to only contracts, torts, IP, and civil rights, which combine for 87 percent of the cases in the sample. Again, motions filed before summary judgment are associated with lower probabilities of being ruled upon. In this
21

specification, winning motions have a statistically significant and negative association with the probability of a Daubert ruling at any time. There appears to be no association between the party filing and the relative hazard of a ruling. None of the causes of action have a statistically different hazard from contracts, although the difference between the hazard ratio of IP and Civil Rights claims is statistically significant, and reflects what was seen in Figure 6. The impact of expert type is nearly identical to that estimated in prior specifications. 3.3 Impact on Case Outcomes and Case Duration Litigation theory generally predicts that failure to settle is due to a lack of information, which causes parties to be relatively optimistic about their cases.18 For example, a plaintiff may believe that her chance of prevailing at trial is .80, and a defendant, viewing the same evidence may believe that the plaintiff’s chance of winning is .30.19 These differing beliefs could arise because the law in this area is unsettled, the evidence is open to different interpretations, or one party has private information about the case. To the extent that Daubert rulings reveal information about parties’ odds of prevailing at trial, it should make settlement more likely.20 For example, Daubert rulings that eliminate or greatly retard a plaintiff’s or defendant’s ability to mount a case—for example, by striking the testimony of a medical expert in a medical malpractice case— will impact the odds of prevailing.21 This new information will be apparent to both parties, and may make the plaintiff more willing to accept the defendant’s settlement offer by increasing the odds that the defendant will prevail at summary judgment. This section first examines the extent to which litigation outcomes—settlements and plaintiff win rates at trial and summary
18 See, e.g., George Priest & Benjamin Klein, The Selection of Disputes for Litigation, 13 J. LEG. STUD. 1 (1984); Keith N. Hylton, Asymmetric Information and the Selection of Disputes for Litigation, 22 J. LEG. STUD. 187 (1993). 19 In the standard litigation model, the plaintiff values her case at Pp*D - c, where Pp is the plaintiff’s estimate of her probability of prevailing, D is damages that will be awarded if the plaintiff wins, and c is litigation costs. If the defendant’s estimate of the plaintiff’s probability of prevailing in litigation is PD, both parties have the same costs and both parties agree on D, a case goes to litigation only if 𝑃𝑃𝑝𝑝 − 𝑃𝑃𝐷𝐷 > 2𝑐𝑐
𝐷𝐷 . Accordingly, this case would settle only if the ratio of total litigation costs to expected
damages were greater than .5. 20 See Flores et al., supra note __ at 32 (quoting a South Carolina attorney who notes that Daubert rulings “play an important role in helping the parties evaluate their relative positions in the case and help parties understand the case in a way that helps them resolve it.”). 21 See, e.g., Hill v. Sqibb & Sons, 592 P.2d 1383 (Mt. 1979)(expert testimony required to show that drug company failed to adequately warn); Wills v. Amerada Hess Corp., 379 F.3d 32 (2d Cir. 2004) (expert testimony required to prove causation in toxic tort case); Hughes v. Dist. of Columbia, 425 A.2d 1299 (D.C. 1981)(expert testimony required to establish proper care in correctional institute case); District of Columbia v. Hampton, 666 A.2d 30 (D.C. 1995) (expert testimony required in medical malpractice claim); Moore v. Crone, 970 A.2d 757 (Conn. App. 2009) (expert testimony required in legal malpractice claim); Avilla v. Willits Environmental Remediation Trust, 633 F.3d 828, 836 (9th Cir. 2011) (noting that under California law “in a personal injury action causation must be proven within a reasonable medical probability based upon competent expert testimony.”); Arias v. Dyncorp, 2014 WL 2219103, at *3 (D.C. Cir. May 30, 2014) (noting that D.C. law requires expert testimony “where the parties offer competing causal explanations for an injury that turns on scientific information”).
22
judgment—vary by Daubert outcomes. Next, it explores the association between the time it takes courts to rule on Daubert motions and the duration of litigation. 3.3.1 Case Outcomes Table12 explores the relationship between Daubert outcomes and subsequent litigation outcomes. The first three columns report the percentage of motions that are associated with a case that settles, ends in summary judgment, or ends in trial.22 There is essentially no difference in the proportion of cases that settle based on Daubert outcomes, as the settlement rate ranges between .59 and .62. This finding is somewhat surprising, as one would expect that losing a Daubert motion would increase incentives to settle as it likely would cause parties to revise their odds of prevailing in litigation downward. One possible explanation for this finding is that given multiple Daubert rulings for each case, conflicting outcomes may confound the impact of bad news. For example, it is unclear if settlement would be more or less likely if both parties were successful in striking their opponent’s expert.23 To control for this possibility, outcomes that involve only cases that had one Daubert motion are listed in parentheses. Although this narrower focus reveals similar settlement patterns with respect to defendant motions, the settlement differences in probabilities between Daubert wins and losses are much larger for plaintiffs. Seventy-one percent of cases involving only one Daubert motion settle when a plaintiff is successful in striking a defendant expert, whereas only 59 percent settle when the motion is denied. Together, these findings suggest that the loss of an expert bodes worse for a defendant’s case than failure to strike the plaintiff’s expert, as only the loss of an expert appears to increase the odds of settlement.24 The disposition of cases that do not settle does not appear to vary by the outcome of defendants’ Daubert motions. A roughly equal proportion (19-20 percent) of cases associated with granted and denied motions end in either trial or summary judgment. The pattern is different with respect to plaintiffs’ Daubert motions: when granted, only 7 percent of cases end in summary judgment, compared with 32 percent in trial; when denied, 16 percent of cases end in summary judgment and 25 percent end in trial. The patterns remain essentially the same when focusing on only those cases with one Daubert motion.
22 Because most cases have multiple Daubert motions, the unit of observation is the Daubert motion, not the case. 23 Logit regressions (not reported) controlling for year, cause of action, expert type, and number of Daubert motions filed in the case finds no statistically measurable impact of Daubert outcome on the probability of settling. 24 Logit regressions (not reported) find that a plaintiff win increases the odds of settlement by 78 percent (p=.107), controlling for year and cause of action.
23

Table 12 Win Rates by Daubert Outcomes
Case Disposition Plaintiff Win Rate Settle SJ Trial All SJ Trial
Plaintiff Motion
Granted .606 (.712)
.071 (.068)
.324 (.220)
.421 (.647)
.412 (.50)
.423 (.692)
Denied .588 (.593)
.160 (.210)
.251 (.247)
.286 (.303)
.117 (.154)
.394 (.40)
Defendant Motion
Granted .618 (.630)
.189 (.216)
.193 (.154)
.254 (.274)
.139 (.102)
.367 (.514)
Denied . 615 (.596)
.185 (.228)
.20 (.175)
.308 (.312)
.187 (.179)
.420 (.50)
Outcomes for cases with only one Daubert motion listed in parentheses. Case disposition does vary with the outcomes in plaintiffs’ Daubert motions. Of the cases that do not settle, over four times as many cases end in trial than summary judgment when Daubert motions are granted. When Daubert motions are denied, the ratio of trial to summary judgment is less than 2:1. Focusing only on cases that involve one Daubert motion, the ratio of trial to summary judgment disposition falls to three (.22:.07), and an almost equivalent proportion of cases end in summary judgment and trial when a plaintiff’s Daubert motions are denied (.21 vs. .25). The second panel in Table12 reports plaintiff win rates by case disposition and Daubert outcome. Win rates follow the expected pattern; they are highest when courts grant plaintiffs’ motions and reject defendants’ motions, and lowest when courts deny plaintiffs’ motions and grant defendants’ motions. For example, plaintiffs’ overall win rate is .42 when their motions are granted compared to .29 when their motions are denied. Further, plaintiffs win 31 percent of the cases when defendants’ motions are denied and only 25 percent when defendants’ motions are granted. This pattern holds for all disposition types, although the difference in win rates is much smaller for trials, which is consistent with only the strongest cases—i.e., those that still have a change of prevailing without an expert—are selected into trial. The patterns remain basically the same when examining cases involving only one Daubert motion. Plaintiff win-rates rise across the board, and the gap between trial win rates with respect to plaintiff motion outcomes jumps from .02 to .29.
24

3.3.2 Case Duration Figure 7 shows the distribution of case duration from Daubert ruling to case termination. As can readily be seen, the distribution is heavily skewed toward zero. A quarter of all case settle or are resolved through summary judgment within 36 days of a Daubert ruling. We can also examine the impact of Daubert rulings on case termination by examining the estimated survival function.
Figures 7 clearly suggests that Daubert rulings are key inflection points in litigation, spurring disposition either through settlement or summary adjudication. Accordingly, the longer a Daubert ruling is delayed, the longer it takes a case to reach this inflection point and hence the less likely it is to settle at a given point in time. For example, consider two cases filed at the same time. Both cases proceed on identical timelines, including the filing of Daubert motions, except that the court in case A decides makes its Daubert ruling before the court in case B. As a consequence, Case A enters the post-Daubert ruling phase more quickly and has a higher probability than Case B of settling during this time window. To examine this hypothesis, survival analysis is used to estimate the impact of the timing of Daubert rulings on early case termination, where settlement or summary judgment is the “failure event” because it takes the case from the judicial system. Figures 8 and 9 show baseline survival functions that estimate the cumulative probability that a case beginning at time t=t0 has ended before trial (settled or summary judgment) or settled by time t0+t, where time is measured in days from
25

initial commencement of the case.25 Unlike the survival curves for Daubert decisions that fell rapidly then leveled off, case survival is flat for almost the first year, reflecting the fact that few cases involving experts settle early; after 300 days, only two percent of cases have terminated. Between 400-500 days, the case termination rate picks up and remains relatively constant. After 1,000 days, 398 cases have settled, 117 have ended due to summary judgment, and 107 cases have ended in trial. The estimated probability of a case neither settling nor ending in summary judgment conditional on being active after 1,000 days is 44 percent, and avoiding exit due to settlement only to be 54 percent.
25 The probabilities
26

Figures 10 and 11 examine the impact of Daubert ruling timing on survival rates, again looking at summary judgment and settlement combined, and just settlement as the failure event. In these figures, the time between the last brief filed and the Daubert ruling is broken into quartiles, and a different survival function is estimated for each quartile. Like the full sample survival curves, almost no cases leave the sample for about the first year. The survival curves begin to fall earliest for the first and second quartiles, and not until nearly 500 days for the third and fourth quartiles. As cases begin to fall from the sample, a separation between quartiles is revealed, with cases with the earliest Daubert rulings clearly falling out sooner than those in the other quartiles. The widening gap illustrates the cases with the shortest pendency duration on Daubert motions entering the post-Daubert inflection point sooner. For example, at day 500, 83 percent of cases with the earliest Daubert rulings survive compared with 93 percent of cases with the latest Daubert rulings. With both summary judgment and settlement as failure, there is little difference between the second and third quartiles. The gaps are larger when settlement is the failure event.
27

That the gaps between quartiles appear to close slightly as the case duration increases reflects the fact that after a certain time period, the likelihood of case termination falls; as most cases are selected into summary judgment or settlement, only the hardest to resolve cases are left. Multiple factors likely influence case duration. To the extent that these factors are also related to Daubert ruling timing, they will bias estimates of the impact of Daubert ruling timing on case survival. Table 13 presents the results from various
28

specifications of a Cox proportional hazard regression model that estimates the relationship between case duration and Daubert ruling timing (in days), including the following additional controls: Nature of Suit; Court; Moving Party; Daubert Outcome; number of Daubert motions; and Year.26 The Cox models are estimated at the motion level—that is, the unit of observation is a motion rather than a case. This is done because it has the advantage of additional power and the ability to control for a richer set of variables than can be controlled for when motions are aggregated. A problem that arises from this approach, however, is that too much weight is put on cases with a large number of Daubert motions. If the number of motions per case were distributed randomly, it would not pose a problem. However, those cases with the most motions tend to have longer durations, likely because they are more complex. Further, as seen in Table 11, the number of motions in a case has a weak negative association with the time it takes a judge to rule on a Daubert motion. To ameliorate this problem, errors are clustered at the case level. Further, all specifications are also estimated at the case level (reported in Appendix B), and yield nearly identical results.
Table 13 Cox Proportional Hazard Regressions:
Impact of Daubert Ruling Timing on Time of Case Resolution
Settle as Failure Settle or Summary Judgment as Failure
Time From Last Brief to Ruling
.998 *** (.0003)
.998*** (.0003)
.998*** (.0004)
.999*** (.0003)
.999*** (.0003)
.999** (.0004)
Defendant Motion
- .965 (.061)
1.014 (.075) - 1.044
(.069) 1.122 (.087)
Granted - 1.048 (.061)
.991 (.066) - 1.098
(.063) .984
(.066) Number of Motions
- .911*** (.010)
.901*** (.013) - .903***
(.009) .883*** (.013)
Year, Court, Nature of Suit, and Expert Controls
N N Y N N Y
Wald Chi2 57.02*** 145.43*** 872.68*** 27.76*** 147.00*** 798.75***
N 2,006 2,006 2005 1,504 1,504 1,503
Estimated Cox proportional hazard ratio reported; full controls include year, nature of suit, and court effects, plus control for party and Daubert outcome. Robust standard errors clustered at case level in parentheses. ***Significant at 1% level; **Significant at 5% level.
26 The unit of observation is a Daubert motion rather than a case as most cases in the sample with multiple Daubert motions. This allows for a more powerful test. Errors are clustered by case, however, to account for the fact that Daubert motions from the same case are not independent.
29

All estimated specifications show a statistically significant negative relationship between the time a Daubert motion pends with the court and the odds that a case will settle or end in summary judgment at any time. The estimated parameter on Daubert motion timing is small in magnitude, due to measurement being in days, which is a small time increment in relation to the average length of a case. The estimated hazard ratio suggests that a one-day increase in the time it takes a court to rule on a Daubert motion reduces the odds of early termination by .2 percentage points. Holding all else constant, this means that the likelihood of settlement is nearly ten-times lower for cases with median pendency durations compared to those in the 10th percentile. Those cases with pendency durations in the 90th percentile are three times less likely to settle than those with median pendency durations. The total number of Daubert motions in the case also has a negative impact on the odds that a case settles are ends early due to summary judgment, again probably reflecting underlying complexity of the case. Figure 12 shows different survival curves from the fullest model with settlement as a failure for the 10th, 50th, 75th, and 90th percentiles of Daubert pendency durations (7, 51, 111, and 210 days, respectively).27 Although the curves suggest similar likelihoods of settlement for the first year and a half of a case, the impact of Daubert pendency becomes apparent as time passes. The gap between median and 10th percentile pendency is relatively smaller than that between median and 90th percentile given the larger absolute differences in durations, but all gaps appear to widen as case duration increases. The results in Table 13 reflect the average affect of an extra day of Daubert motion pendency on the likelihood of a case terminating early, either through settlement or summary judgment. The importance of expert testimony, however, varies by case.
27 The estimated parameter is converted into a change in hazard ratio using the following relationship: �ℎ(𝑡𝑡;𝑥𝑥𝑖𝑖)
ℎ(0)� = 𝑒𝑒𝛽𝛽�𝑥𝑥𝑖𝑖, where �̂�𝛽 is the estimated parameter on days between last brief and Daubert ruling,
and xi is the value of Daubert motion duration. The estimated hazard ratio for the median pendency (51 days) is .898 and .987 for pendency duration in the 10th percentile (7 days).
30

For example, because expert testimony is a required element of products liability or
medical malpractice claims, a Daubert grant would increase the odds of a defendant winning summary judgment and concomitantly increase the odds of a settlement.28 Alternatively, most expert testimony in contract cases relate to damages, so exclusion of expert early in the case would have little impact on liability. Accordingly, the impact of Daubert delay on early disposition is likely to vary by case type. To address this empirical question, Table 14 reports Cox proportional hazard estimates for contracts, torts, civil rights, and IP causes of action. These claims comprise nearly 90 percent of the sample and also provide variation over the importance of expert testimony to establishing liability. Contract claims serve as benchmark; it is expected that delay in Daubert rulings will have a larger impact on other causes of action because such rulings are inflection points regarding the viability of the claim, and hence more likely to spur settlement or summary judgment. The first three columns use settlement as the failure event and the three use early termination through settlement or summary judgment as the failure event. All specifications include court-, expert-, year-, and cause of action-specific effects.
28 See note__, supra.
31

TABLE 14 COX REGRESSIONS WITH NATURE OF SUIT INTERACTIONS
Settle as Failure Settle or Summary Judgment As Failure
Time From Last Brief to Ruling
1.000 (.002)
.999** (.001)
1.002 (.002)
1.000 (.001)
.999 (.001)
.999 (.002)
Time X Torts .996** (.002) -
-
.999 (.001) -
-
Time X Civil Rights .996
(.002) - -
.999 (.002) -
-
Time X IP .999 (.002) -
-
1.000 (.002) -
Time X PL /Med-Mal/Employment
- .963 (.182)
- - 1.000
(.001) -
Time X Contract-Other - - .998
(.003) - - 1.000 (.003)
Time X Contract PL - - .994
(.009) - - .996
(.006)
Time X Marine Torts - - .933** (.027) - -
.879** (.049)
Time X Marine PL - - .986*** (.003) - -
.963** (.015)
Time X Motor Vehicle - - .991*** (.003) - -
.995 (.004)
Time X Motor Vehicle PL - - .992* (.005) - -
1.011*** (.004)
Time X Other Personal Injury - - .995* (.003) - -
.999 (.003)
Time X Med Mal - - .978*** (.008) - -
.984** (.007)
Time X Product Liability - - .997
(.003) - - 1.000 (.003)
Time X Asbestos PL - - .947
(.041) - - .998
(.003) Time X Personal Prop. Damage
- - 1.012** (.006) - -
1.009 (.006)
Time X Property PL - - .965*** (.013) - -
.981 (.013)
Time X Other Civil Rights - - .998
(.002) - - 1.000 (.003)
Time X Employment - - .986*** (.005) - -
.998 (.004)
Time X Housing - - 1.003 (.019) - -
.967** (.015)
Time X ADA – Employment - - 1.018 (.016) - -
1.022** (.011)
Time X ADA- Other - - 1.005 (.027) - -
-
Time X Copyright - - .992** (.003) - -
.993* (.004)
Time X Patent - - .997
(.003) - - .999
(.003)
32

Table 14 con’t
Time X Trademark - - 1.000 (.004) - -
1.004 (.005)
Defendant Motion . 972 (.092)
1.004 (.093)
.902 (.091)
1.093 (.104)
1.128 (.107)
.994 (.097)
Granted . 958 (.093)
.933 (.090)
.978 (.098)
.963 (.089)
.977 (.091)
1.035 (.101)
Number of Motions .888*** (.028)
.897*** (.028)
.884*** (.027)
.872*** (.026)
.878*** (.024)
.848*** (.025)
Year, Court, Nature of Suit, and Expert Controls
Y Y
Y Y Y
Y
Wald Chi2 798.98*** 815.07*** 1045.90*** 986.62*** 1001.41*** 1124.70***
N 1,741 1,741 1,716 1,313 1,313 1,313
Estimated Cox proportional hazard ratio reported; full controls include year, nature of suit, and court effects, plus control for party and Daubert outcome. Robust standard errors clustered at case level in parentheses. ***Significant at 1% level; **Significant at 5% level.
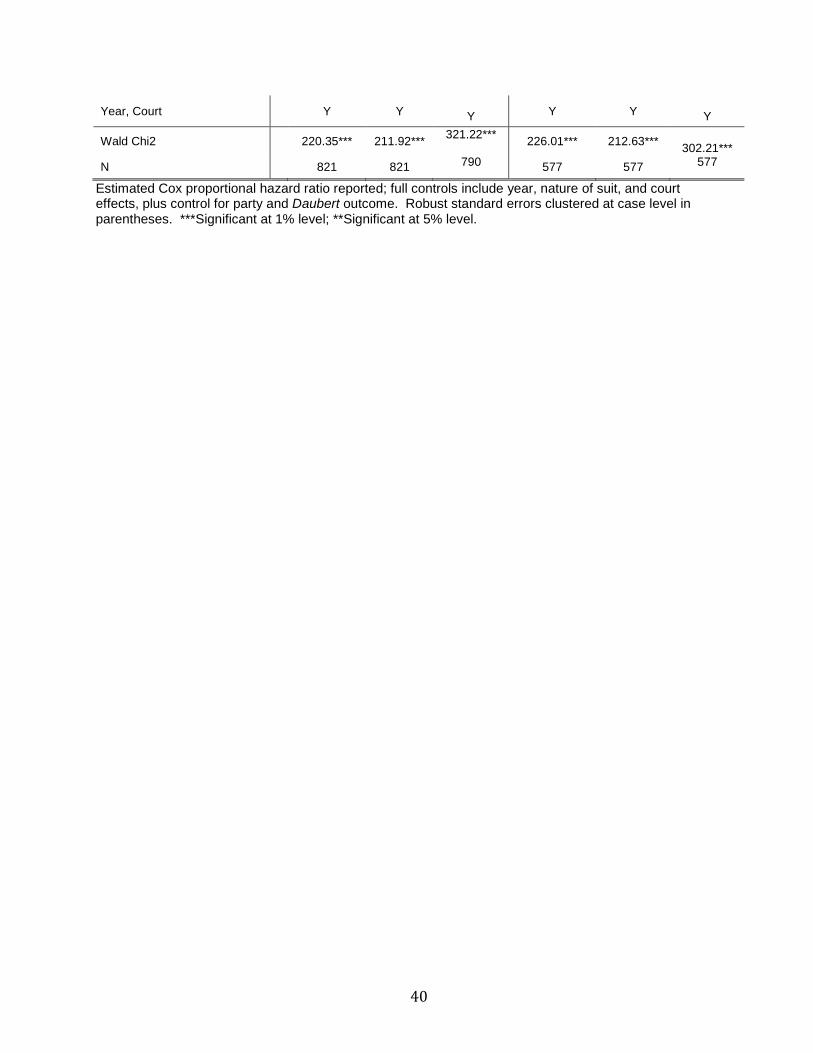
The first specification examines interactions at the top-level cause of action. The results suggest that each day that a Daubert motion pends reduces the odds of a tort claim settling by .4 percentage points relative to contract claims. There is no statistically significant impact on IP or civil rights claims. The second specification examines the impact of Daubert ruling timing on claims that involve products liability, medical malpractice, and environmental claims, which all rely heavily on expert testimony. The interaction with Daubert pendency time and this class of claims has no statistical impact on the odds that a case will settle. The final specification is the most flexible, reporting parameter estimates on interactions for all detailed-level nature of suit codes. The results suggest that the impact of additional days of Daubert motion pendency reduce the odds of settlement for medical malpractice, marine torts, several types of product liability claims, as well as copyright and civil rights employment claims. These results are consistent with the fact that these claims largely require expert testimony to succeed, meaning that Daubert rulings are likely to have important effects on a plaintiff’s likelihood of success. Somewhat surprisingly, additional days of Daubert pendency do not appear to have any impact on the odds that product liability claims settle relative to contract claims. The results reported in the last three columns of Table 14 show the same set of Cox regressions, but use any early exit—settlement or summary judgment—as the failure event. Results are generally the same, although the interactions with fewer tort claims are significant.
33

4. DISCUSSION & CONCLUSION
The results from Section 3 suggest that Daubert rulings are key inflection points in litigation. Within 100 days of a Daubert ruling, more than half of the cases in the sample ended in settlement or summary judgment, and survival analysis shows that an additional 40 days of Daubert motion pendency is associated with a ten percent reduction in the relative likelihood of termination by settlement or summary judgment at any time. There is also some evidence that these impacts are larger for certain claims that require expert testimony to establish required elements. Further, the number of motions in a case also appears to be strongly associated with reduced likelihood of early termination. The apparent importance of Daubert rulings to case flow suggests that an active judicial role in managing expert testimony could reduce litigation length and its concomitant costs. Indeed, the Federal Rules of Civil (FRCP) have evolved to give judges “broad discretion to manage discovery and to control the course of litigation.”29 One procedure that courts have developed under this discretion is the so-called “Lone Pine” order, which require plaintiffs to make some prima facie showing of injury and causation in large tort cases.30 For example, in Acuna v. Brown & Root Inc., the Fifth Circuit approved the use of a Lone Pine order that required plaintiffs in a suit alleging injury from exposure to uranium to provide expert affidavits that specified for each plaintiff “injuries or illnesses suffered,” “that materials causing the injuries,” “the dates or circumstances and means of exposure,” and “the scientific and medical bases for the expert’s opinion.”31 Several state and federal courts have embraced the use of Lone Pine orders as a case management technique to cull non-meritorious cases early.32 In the spirit of Lone Pine orders, courts could schedule Rule 26(a)(2)(b) disclosures and attendant Daubert motions earlier in the case, especially for cases that rely on expert testimony to prove certain elements. Like Lone Pine orders, such a case management tool would come after the court has ruled on a motion to dismiss or the defendant has answered the complaint, but before full factual discovery. Unlike Lone Pine orders, which ask only for prima facie showings, not full expert reports, this case management tool would ask both parties to submit full Rule 26 expert reports, conduct expert depositions, and submit Daubert motions. Because these reports would be addressed at required elements of a claim, if a court were to grant a Daubert motion striking a report, the winning party could move
29 Avilla v. Willits Environmental Remediation Trust, 633 F.3d 828, 833 (9th Cir. 2011). See also Advisory Committee notes to 1983 Amendments to Rules 16, 26(a), 26(b), 26(g). 30 See Lore v. Lone Pine Corp., 1986 WL 637507 (N.J. Super Ct., Nov. 18, 1986). 31 200 F.3d 334, 337 (5th Cir. 2000). 32 See Rick Faulk, There’s Nothing “New” about “Lone Pine” Orders for Active Case Management, Washington Legal Foundation (Jul. 7, 2014); David B. Weinstein & Christopher Torres, Managing the Complex: A Brief Survey of Lone Pine Orders, 34 Westlaw Envt’l J. 1 (Aug. 21, 2013). See also RAND Report (recommending use of Lone Pine in ).
34

for summary judgment. What’s more, this new development is likely to increase the odds of settlement. The discretion embodied in the FRCP would seem to accommodate such a procedure. Rule 16(c), for example, authorizes the court to take “appropriate action” to control the timing of discovery and disclosures, and to adopt “special procedures for managing” complex cases.33 Further, Rule 26(a)(2) allows courts to determine the schedule and sequence of expert disclosures.34 This procedure is more feasible for expert testimony that relies on data that is likely to be in the plaintiffs’ possession (or publicly available), for example tort claims based on exposure to a chemical or a defective drug. On the other hand, some experts may need access to data only available from discovery to form an opinion, and depositions and rebuttal reports may require access to evidence in the opposing party’s possession. For example, some courts have denied the enforcement of Lone Pine orders when plaintiffs would require access to defendants’ records through normal fact discovery to comply.35 Nonetheless, Rule 16(c) allows courts to “order the presentation of evidence early in the trial on a manageable issue that might, on the evidence, be the basis for a judgment as a matter of law.”36 Court could limit initial factual discovery to data in defendant’s possession that were needed to produce an expert report or to adequately prepare a rebuttal report or for deposition. In addition to structuring expert testimony early in some cases, in light of the strong statistical association between the number of Daubert motions and the likelihood of early termination, courts also should actively exercise their 16(c)(2)(D) power “to limit the use of [expert] testimony.” Finally, even if expert discovery comes early in the process, courts should also be mindful of ruling on these motions in a timely fashion given the impact that delay appears to have on the likelihood of early termination.
33 FRCP 16(c)(2). 34 See Avilla, 633 F.3d. at 834. 35 See Adinolfe v. United Technologies Corp., 768 F.3d 1161, 1168 (11th Cir. 2014); Singleton v. Chevron U.S.A., 2011 WL 6818870, at * 3 (E.D. La. Dec. 28, 2011). 36 FRCP 16(c)(2)(N).
35
APPENDIX A:
Table A1 Number of Daubert Motions and Average Pendency Duration:
By Federal District Court
Court Number of Motions
Average Duration: Last Brief to Ruling
NY NORTH 24 253.83 NC MID 9 224.1 NY WEST 8 207.6 NY EAST 34 202.3 NM 6 197.5 IA SOUTH 6 192.2 OH SOUTH 11 163.3 GA NORTH 50 162.7 TN EAST 26 159.7 SC 11 145.4 TN WEST 10 140.1 FL NORTH 5 131.8 MD 12 130.5 OK NORTH 6 126.5 OR 21 121.7 GA MID. 16 120.6 PA MID. 19 112.3 VA WEST 8 109.5 MO WEST 19 109.4 MN 68 107.9 AZ 59 107.3 VT 3 107.3 MS SOUTH 53 106.2 MS NORTH 24 105.5 TX SOUTH 34 102.5 KS 48 102.2 HI 8 99.5 DE 26 93.92 CA EAST 14 92.5 CA SOUTH 33 92.36 NC EAST 7 91.57 GA SOUTH 6 91 NV 20 90.85 AL NORTH 51 89.48 AL MID. 14 88.71 CO 57 87.49 NY SOUTH 49 84.67 OH NORTH 20 83.68 NC WEST 6 82.2 PA WEST 22 78.59 IL NORTH 31 76.85 PA EAST 55 76.31 MO EAST 65 76.26
36
TX NORTH 31 75.79 NJ 37 75.14 KY EAST 22 74.55 SD 7 74.29 ME 26 73.85 WI EAST 15 73.75 AK 4 73.25 IL SOUTH 3 72.33 FL MID 76 71.83 UT 43 71.57 PR 12 70 CT U 6 69.5 IN SOUTH 31 69.41 WV SOUTH 43 66.14 TN MID. 10 65.33 TX EAST 44 63.85 MI EAST 49 61.27 OK WEST 56 60.79 KY WEST 37 60.14 CA CENT. 21 58.1 MA 12 57.25 WV NORTH 6 54.5 RI 2 53 WA WEST 30 51.63 LA WEST 48 51.26 AL SOUTH 8 51.25 WI WEST 10 51 IN NORTH 23 50.86 IL CENT 12 49.42 WA EAST 7 48.29 MI WEST 6 46.5 LA MID 9 46.44 TX WEST 17 44.59 NE 22 42.39 CA NORTH 49 40.38 AR EAST 23 39.22 FL SOUTH 69 35.86 LA EAST 46 34.53 NH 14 34.08 IA NORTH 9 31.22 DC 4 30.5 MT 6 24.33 ID 2 22.5 WY 13 19.33 ND 1 19 VA EAST 21 9.84 AR WEST 1 8 OK EAST 10 7.83
37

Appendix B
Table 13A Cox Proportional Hazard Regressions:
Impact of Daubert Ruling Timing on Time of Case Resolution (Case-Level Analysis)
Settle as Failure Settle or Summary Judgment as Failure
Time From Last Brief to Ruling
.998*** (.0005)
.998*** (.0005)
.998*** (.0006)
.998*** (.0004)
.998*** (.0004)
.998*** (.0005)
Number of Motions
- .922*** (.023)
.893*** (.026) - .886***
(.023) .846*** (.028)
Year, Court, Nature of Suit
N N Y N N Y
Wald Chi2 25.69*** 37.95*** 289.3*** 14.57*** 41.21*** 274.97***
N 939 939 939 677 677 677
Estimated Cox proportional hazard ratio reported; full controls include year, nature of suit, and court effects, plus control for party and Daubert outcome. Robust standard errors clustered at case level in parentheses. ***Significant at 1% level; **Significant at 5% level.
38

TABLE 14A COX REGRESSIONS WITH NATURE OF SUIT INTERACTIONS – CASE LEVEL
Settle as Failure Settle or Summary Judgment As Failure
Time From Last Brief to Ruling
1.000 (.002)
.998 (.001)***
.999 (.003)
.999 (.002)
.998** (.001)
.996 (.003)
Time X Torts .996** (.002) -
-
.998 (.002) -
-
Time X Civil Rights .996 (.002) -
-
1.000 (.002) -
-
Time X IP .997 (.002) -
- 1.000 (.002) -
-
Time X PL /Med-Mal/Employment/Environment
- .998 (.001)
- - 1.001
(.001) -
Time X Contract-Other - - 1.002 (.003) - -
1.004 (.004)
Time X Contract PL - - - - -
-
Time X Marine Torts - - .948** (.023) - -
.915** (.036)
Time X Marine PL - - .995
(.004) - - .996
(.005)
Time X Motor Vehicle PL - - .991
(.006) - - 1.012** (.006)
Time X Other Personal Injury - - .995
(.003) - - .995
(.004)
Time X Med Mal - - .984** (.007) - -
.992 (.006)
Time X PL - - .999
(.003) - - 1.003 (.003)
Time X Asbestos PL - - .931
(.045) - - 1.003 (.003)
Time X Personal Prop. Damage
- - 1.018*** (.006) - -
1.003 (.003)
Time X Property PL - - .977** (.010) - -
.990 (.018)
Time X Other Civil Rights - - .999
(.003) - - 1.003 (.003)
Time X Employment - - .989** (.005) - -
1.000 (.004)
Time X Housing - - - - -
-
Time X ADA – Employment - - 1.013 (.011) - -
1.016 (.012)
Time X ADA- Other - - - - -
-
Time X Copyright - - .996 (.006) - - .999
(.006)
Time X Patent - - .997
(.004) - - 1.003 (.004)
Time X Trademark - - 1.000 (.004) - -
1.004 (.004)
Number of Motions .884*** (.028)
.906*** (.028)
.862*** (.029)
.829*** (.029)
.852*** (.029)
.804*** (.030)
39
Year, Court Y Y
Y Y Y
Y
Wald Chi2 220.35*** 211.92*** 321.22*** 226.01*** 212.63*** 302.21***
N 821 821 790 577 577 577
Estimated Cox proportional hazard ratio reported; full controls include year, nature of suit, and court effects, plus control for party and Daubert outcome. Robust standard errors clustered at case level in parentheses. ***Significant at 1% level; **Significant at 5% level.
40