Juan Pablo Jiménez - Tax Compact · Juan Pablo Jiménez [email protected] ITC-Workshop...
28
Juan Pablo Jiménez Economic Commission for Latin America and the Caribbean ITC-Workshop “How to Operationalize the International Tax and Development Agenda” 12-14 September 2011 Bonn, Germany
-
Upload
phungquynh -
Category
Documents
-
view
215 -
download
0
Transcript of Juan Pablo Jiménez - Tax Compact · Juan Pablo Jiménez [email protected] ITC-Workshop...
Juan Pablo Jiménez Economic Commission for Latin America and the Caribbean
ITC-Workshop “How to Operationalize the International Tax and Development Agenda”
12-14 September 2011 Bonn, Germany

I. Diagnosis and Challenges for Latin America Countries
II. Agenda and proposals

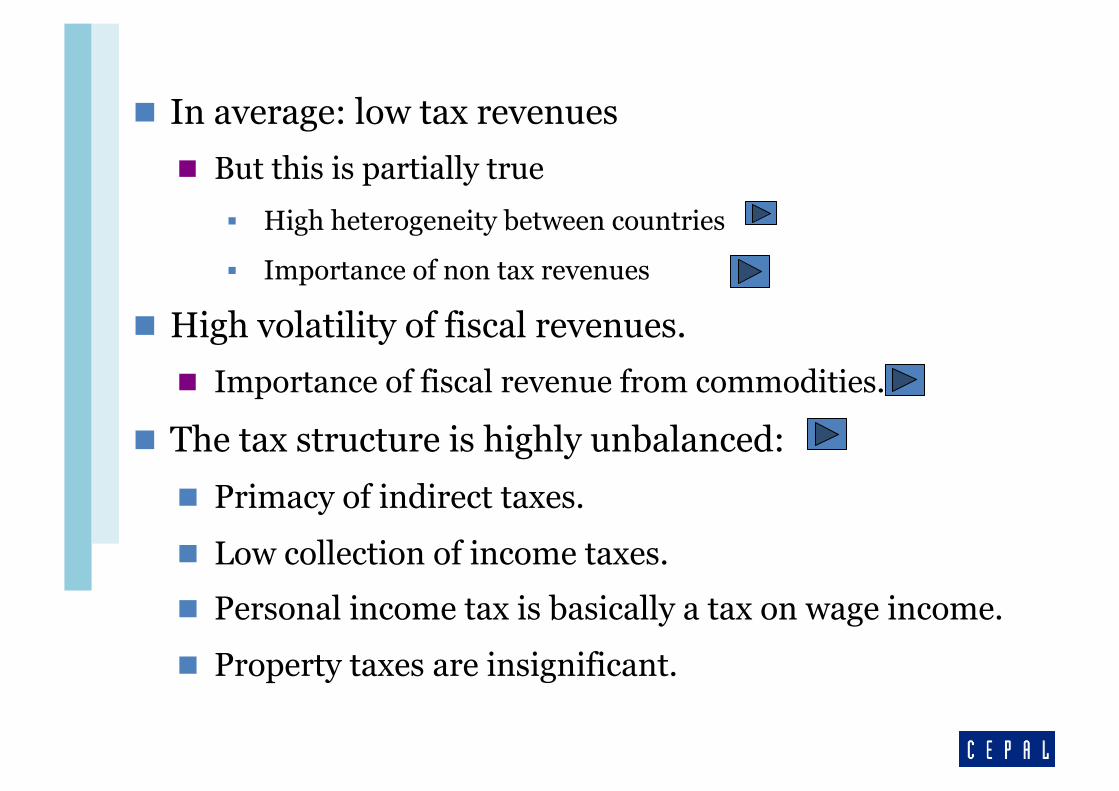
In average: low tax revenues But this is partially true
High heterogeneity between countries
Importance of non tax revenues
High volatility of fiscal revenues. Importance of fiscal revenue from commodities.
The tax structure is highly unbalanced:
Primacy of indirect taxes.
Low collection of income taxes.
Personal income tax is basically a tax on wage income.
Property taxes are insignificant.
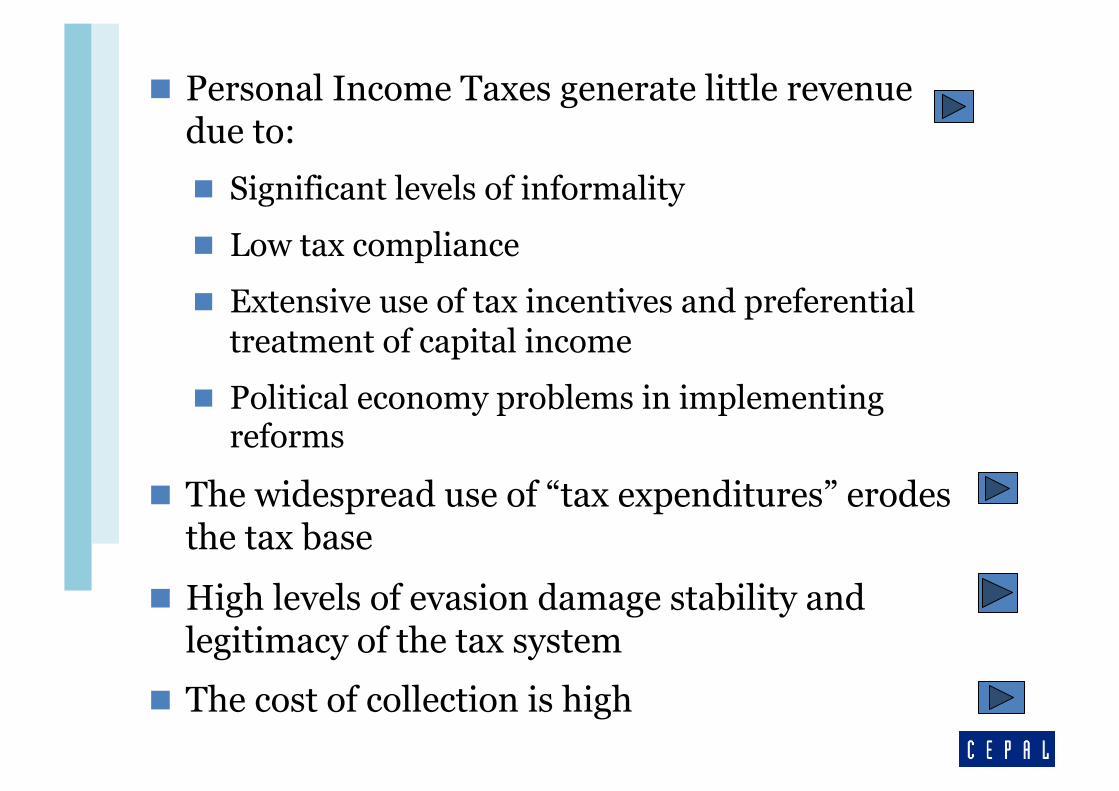
Personal Income Taxes generate little revenue due to:
Significant levels of informality
Low tax compliance
Extensive use of tax incentives and preferential treatment of capital income
Political economy problems in implementing reforms
The widespread use of “tax expenditures” erodes the tax base
High levels of evasion damage stability and legitimacy of the tax system
The cost of collection is high

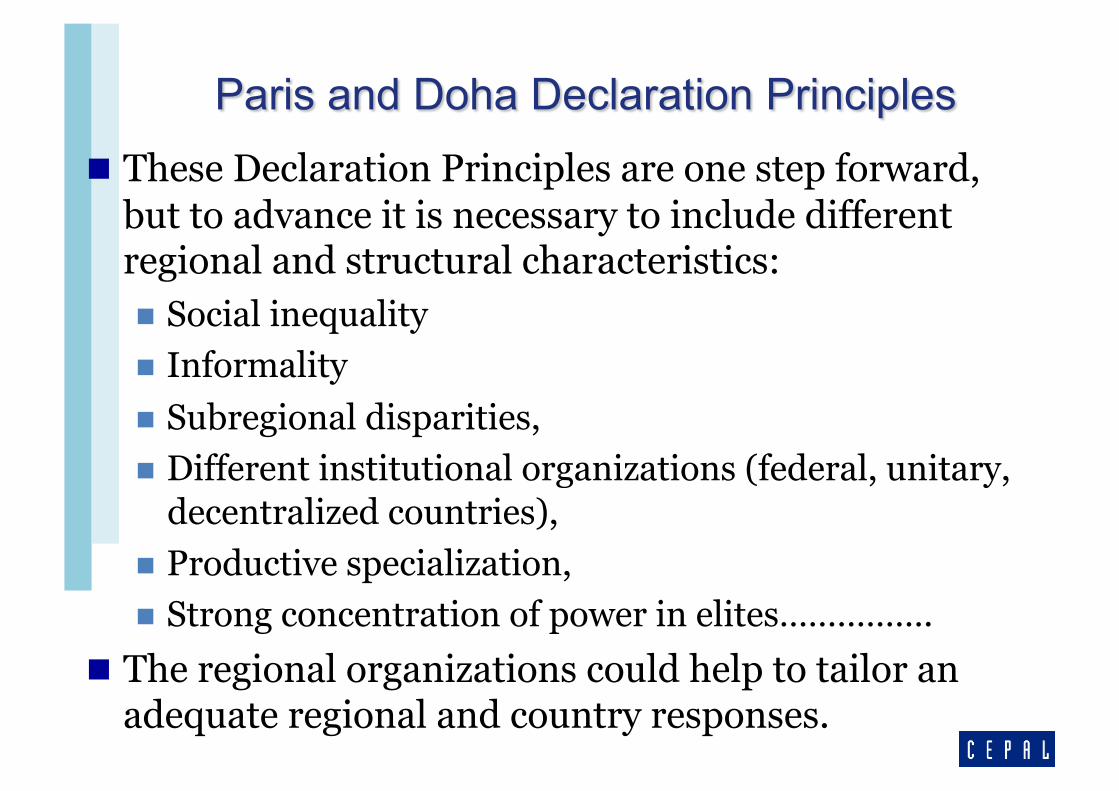
These Declaration Principles are one step forward, but to advance it is necessary to include different regional and structural characteristics: Social inequality Informality Subregional disparities, Different institutional organizations (federal, unitary,
decentralized countries), Productive specialization, Strong concentration of power in elites…………….
The regional organizations could help to tailor an adequate regional and country responses.

Strengthen direct taxation, especially the personal income tax. Expand the tax bases Taxing capital income
Review the use of tax incentives: Set clear goals Improve measurement of tax expenditures Analyze the impact of these incentives
Improve capacity management and effective control of tax administrations
Measuring the tax evasion and tax gap.

Strengthen property taxes, especially at subnational levels.
Taxation of natural resources Political economy of the tax reform in LA So we could face two major challenges:
Rebuilding the fiscal space Addressing the multiple dimensions of
inequality in the region

Juan Pablo Jiménez [email protected]
ITC-Workshop “How to Operationalize the International Tax and Development Agenda”
12-14 September 2011 Bonn, Germany

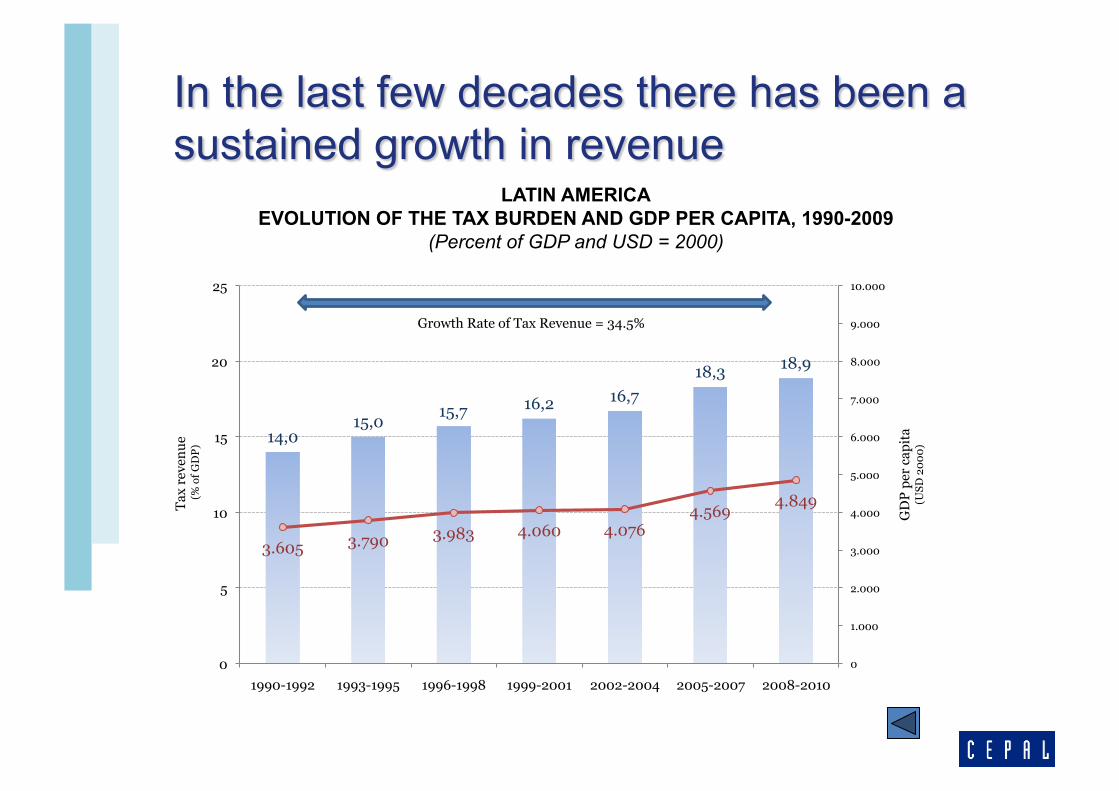
LATIN AMERICA EVOLUTION OF THE TAX BURDEN AND GDP PER CAPITA, 1990-2009
(Percent of GDP and USD = 2000)
14,0 15,0
15,7 16,2 16,7 18,3 18,9
3.605 3.790 3.983 4.060 4.076 4.569
4.849
0
1.000
2.000
3.000
4.000
5.000
6.000
7.000
8.000
9.000
10.000
0
5
10
15
20
25
1990-1992 1993-1995 1996-1998 1999-2001 2002-2004 2005-2007 2008-2010
GD
P pe
r ca
pita
(U
SD 2
000)
Tax
reve
nue
(% o
f GD
P)
Growth Rate of Tax Revenue = 34.5%

Note: Coverage is for central government, except for Argentina, Brazil, Bolivia, Chile, and Mexico which refers to general government (including tax revenues of subnational levels of government)..
0 5 10 15 20 25 30 35
México
Guatemala
Paraguay
Rep. Dominicana
El Salvador
Costa Rica
Venezuela
Ecuador
Colombia
Panamá
Perú
Honduras
Chile
Bolivia
Nicaragua
Uruguay
Argentina
Brasil
Percentage of GDP
2002-2010 1990-2001
GROUP 1
GROUP 2
GROUP 3

6
8
10
12
14
16
18
20
1990 1991 1992 1993 1994 1995 1996 1997 1998 1999 2000 2001 2002 2003 2004 2005 2006 2007 2008 2009 2010 2011(p)
Other income Tax Revenue
LATIN AMERICA AND THE CARIBBEAN: COMPOSITION OF REVENUE, 1990-2011 (Percentages of GDP)

LATIN AMERICA AND EUROPE: SELECTED COUNTRIES VOLATILITY OF TAX REVENUE (WITHOUT SOCIAL SECURITY) 1980-2008
(Standard deviation of the tax revenue growth in USD, 2000)
12,3
4,5
0,0
5,0
10,0
15,0
20,0
25,0
Vene
zuel
a E
cuad
or
Cos
ta R
ica
Per
u B
oliv
ia
Arg
entin
a P
anam
a D
omin
ican
R
. P
arag
uay
ElS
alva
dor
Gua
tem
ala
Uru
guay
N
icar
agua
C
hile
H
ondu
ras
Mex
ico
Bra
zil
Col
ombi
a
Gre
ece
Icel
and
P
ortu
gal
Finl
and
Japa
n S
wed
en
Spa
in
US
A N
orw
ay
Net
herla
nds
Italy
A
ustra
lia
Uni
ted
Kin
gdom
D
enm
ark
Aus
tria
Fran
ce
Bel
gium
Latin America Developed countries
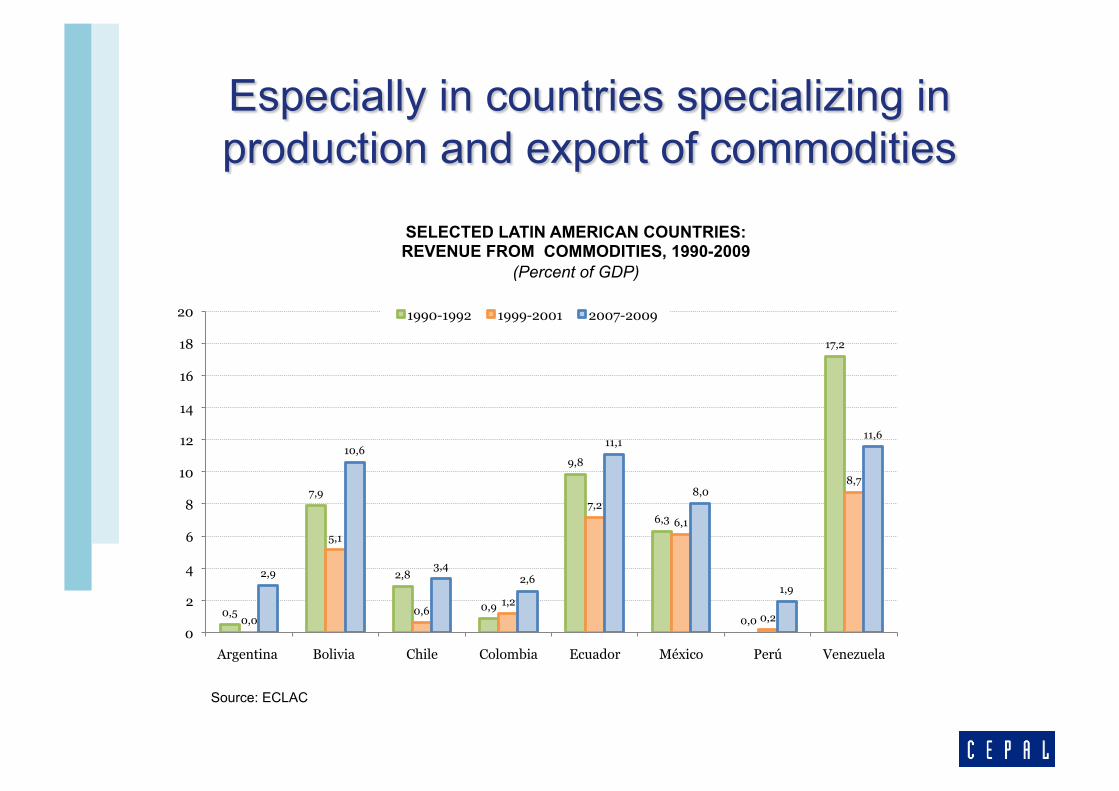
SELECTED LATIN AMERICAN COUNTRIES: REVENUE FROM COMMODITIES, 1990-2009
(Percent of GDP)
0,5
7,9
2,8
0,9
9,8
6,3
0,0
17,2
0,0
5,1
0,6 1,2
7,2
6,1
0,2
8,7
2,9
10,6
3,4 2,6
11,1
8,0
1,9
11,6
0
2
4
6
8
10
12
14
16
18
20
Argentina Bolivia Chile Colombia Ecuador México Perú Venezuela
1990-1992 1999-2001 2007-2009
Source: ECLAC
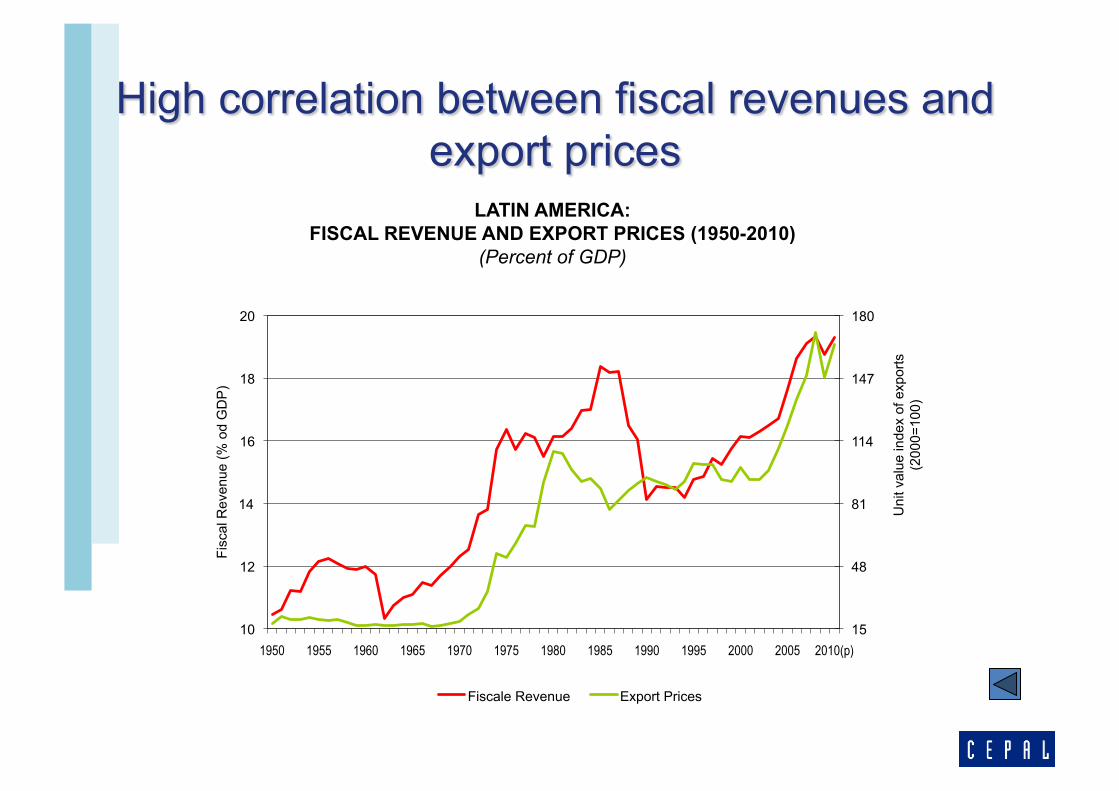
LATIN AMERICA: FISCAL REVENUE AND EXPORT PRICES (1950-2010)
(Percent of GDP)
15
48
81
114
147
180
10
12
14
16
18
20
1950 1955 1960 1965 1970 1975 1980 1985 1990 1995 2000 2005 2010(p)
Uni
t val
ue in
dex
of e
xpor
ts
(200
0=10
0)
Fisc
al R
even
ue (%
od
GD
P)
Fiscale Revenue Export Prices

Between 1990 and 2009, in the average tax structure at the regional level, the relative weight of indirect taxes (as VAT ) increased 54%, from 22.8% to 35.1% of total collections per year.
AMÉRICA LATINA : EVOLUCIÓN DE LA ESTRUCTURA TRIBUTARIA PROMEDIO, 1990-2009
(En porcentaje del total recaudado)
25,5
22,8
20,3
14,1
17,3
30,1
35,1
11,6
5,7
17,5
0
10
20
30
40
Direct Taxes (Income + Property)
VAT
Excises & others International trade & transactions
Social security contributions
1990 2009

LATIN AMERICA , OECD and USA AVERAGE REVENUE OF INCOME TAX

SELECTED LATIN AMERICAN COUNTRIES: TAX EXPENDITURES, 2007
The major methodological differences in the estimates of tax expenditures among countries restrict comparative analysis.
Country
As percentage of
GDP Tax Revenue
Argen8na 2.21 8.90
Brazil 2.29 9.10
Chile 4.97 24.60
Colombia 3.52 22.00
Ecuador 4.60 35.30
Guatemala 7.91 63.50
Mexico 5.92 50.70
Peru 2.05 11.90
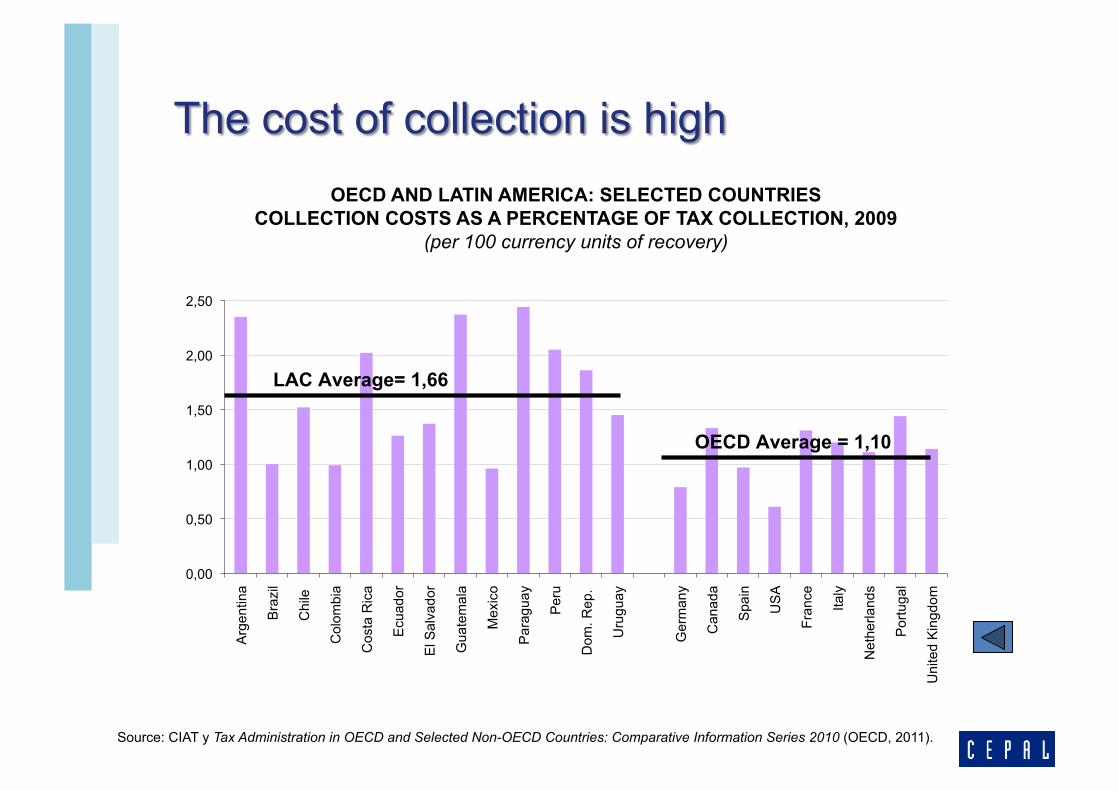
OECD AND LATIN AMERICA: SELECTED COUNTRIES COLLECTION COSTS AS A PERCENTAGE OF TAX COLLECTION, 2009
(per 100 currency units of recovery)
Source: CIAT y Tax Administration in OECD and Selected Non-OECD Countries: Comparative Information Series 2010 (OECD, 2011).
0,00
0,50
1,00
1,50
2,00
2,50
Arg
entin
a
Bra
zil
Chi
le
Col
ombi
a
Cos
ta R
ica
Ecu
ador
El S
alva
dor
Gua
tem
ala
Mex
ico
Par
agua
y
Per
u
Dom
. Rep
.
Uru
guay
Ger
man
y
Can
ada
Spa
in
US
A
Fran
ce
Italy
Net
herla
nds
Por
tuga
l
Uni
ted
Kin
gdom
LAC Average= 1,66
OECD Average = 1,10
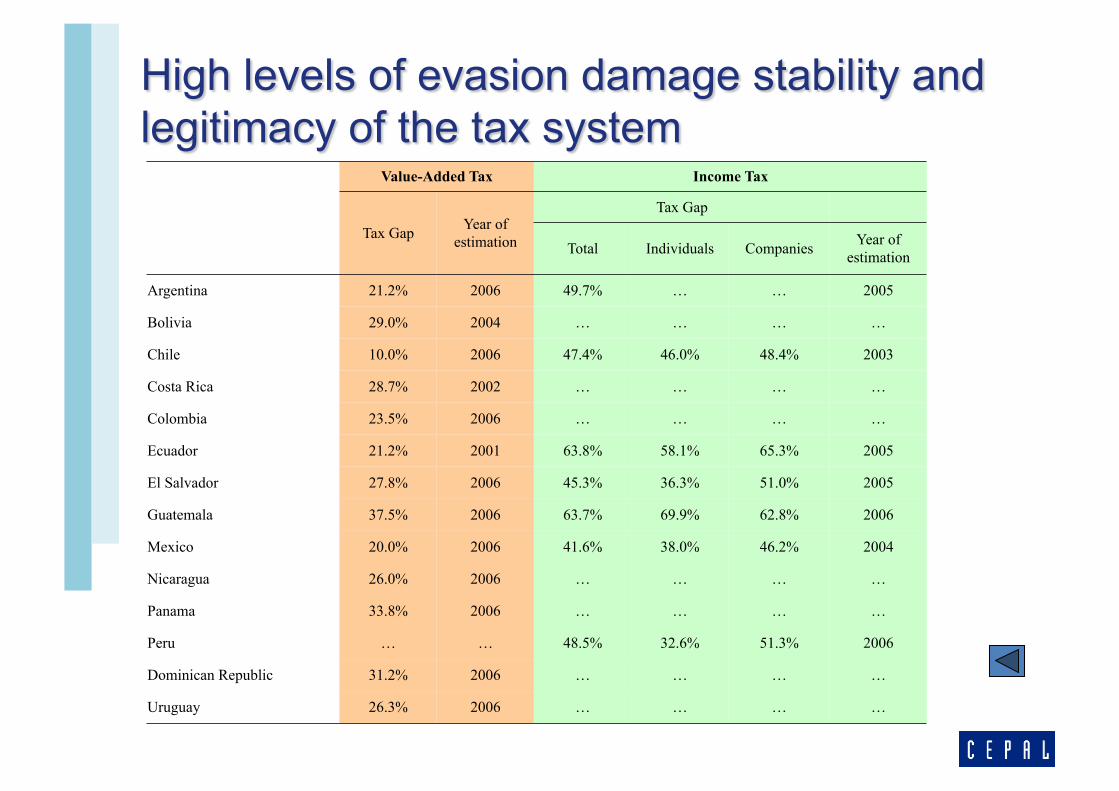
Value-Added Tax Income Tax
Tax Gap Year of estimation
Tax Gap
Total Individuals Companies Year of estimation
Argentina 21.2% 2006 49.7% … … 2005
Bolivia 29.0% 2004 … … … …
Chile 10.0% 2006 47.4% 46.0% 48.4% 2003
Costa Rica 28.7% 2002 … … … …
Colombia 23.5% 2006 … … … …
Ecuador 21.2% 2001 63.8% 58.1% 65.3% 2005
El Salvador 27.8% 2006 45.3% 36.3% 51.0% 2005
Guatemala 37.5% 2006 63.7% 69.9% 62.8% 2006
Mexico 20.0% 2006 41.6% 38.0% 46.2% 2004
Nicaragua 26.0% 2006 … … … …
Panama 33.8% 2006 … … … …
Peru … … 48.5% 32.6% 51.3% 2006
Dominican Republic 31.2% 2006 … … … …
Uruguay 26.3% 2006 … … … …

LATIN AMERICA TAX BURDEN, 1990-2001, 2002-2010
(Percentage of GDP)
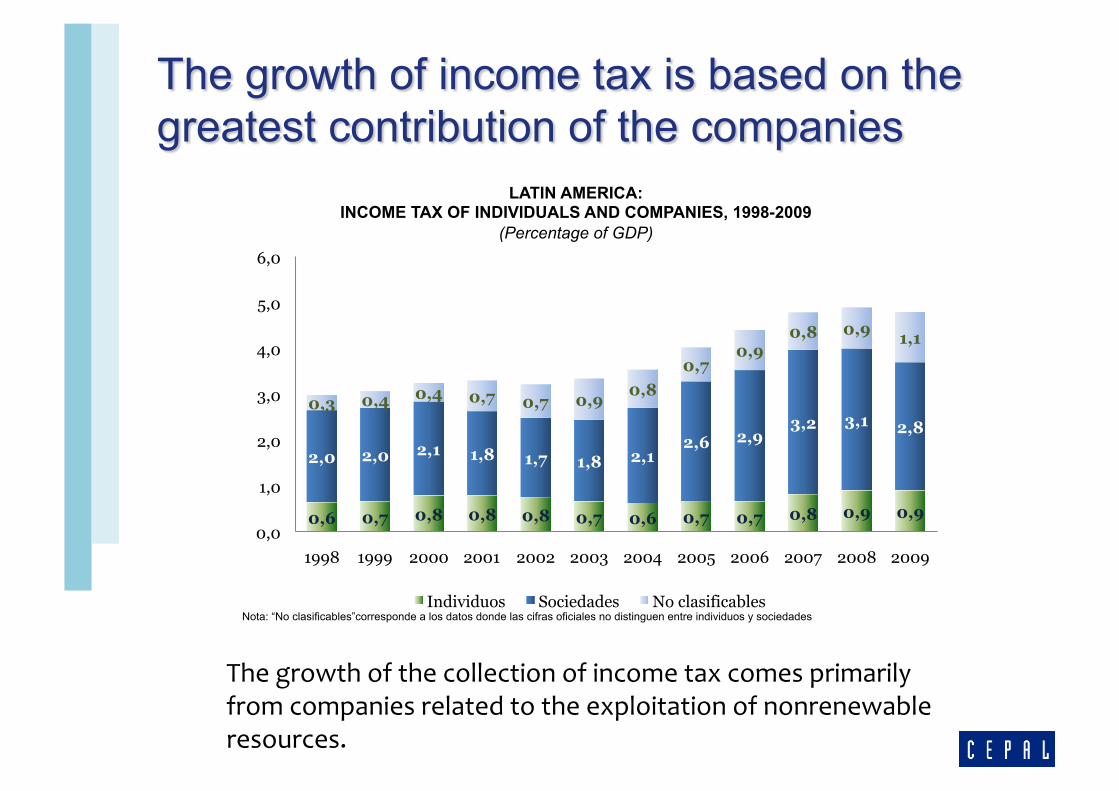
Nota: “No clasificables”corresponde a los datos donde las cifras oficiales no distinguen entre individuos y sociedades
LATIN AMERICA: INCOME TAX OF INDIVIDUALS AND COMPANIES, 1998-2009
(Percentage of GDP)
0,6 0,7 0,8 0,8 0,8 0,7 0,6 0,7 0,7 0,8 0,9 0,9
2,0 2,0 2,1 1,8 1,7 1,8 2,1 2,6 2,9
3,2 3,1 2,8 0,3 0,4 0,4 0,7 0,7 0,9 0,8
0,7 0,9
0,8 0,9 1,1
0,0
1,0
2,0
3,0
4,0
5,0
6,0
1998 1999 2000 2001 2002 2003 2004 2005 2006 2007 2008 2009
Individuos Sociedades No clasificables
The growth of the collection of income tax comes primarily from companies related to the exploitation of nonrenewable resources.

SELECTED COUNTRIES: STRUCTURE OF THE PERSONAL INCOME TAX, 2007
(Percentage of GDP)

Some issues related to fiscal policy: Undertake reforms, such as public management reform,
that may be necessary to launch and fuel sustainable capacity development processes
Strengthen public financial management capacity: Intensify efforts to mobilise domestic resources, strengthen
fiscal sustainability, and create an enabling environment for public and private investments.
Publish timely, transparent and reliable reporting on budget execution.
Take leadership of the public financial management reform process.
Strengthen as appropriate the parliamentary role in national development strategies and/or budgets
Some issues related to fiscal policy: Countercyclical policies should be expanded Public investment should be consistent with medium- and
long-term fiscal sustainability Continue to undertake fiscal reform, including tax reform. Continue to improve budgetary processes and to enhance
the transparency of public financial management and the quality of expenditures
Enhance tax revenues through modernized tax systems, more efficient tax collection, broadening the tax base and effectively combating tax evasion
Make tax systems more pro‑poor Promote international cooperation in tax matters