'JTIFSJFT 1SPHSBN 1SFMJNJOBSZ 3FTVMUT PG 'JYFE …
12
Transcript of 'JTIFSJFT 1SPHSBN 1SFMJNJOBSZ 3FTVMUT PG 'JYFE …

Preliminary Results of Fixed DIDSON Evaluations at the Electric Dispersal Barrier in theChicago Sanitary and Ship Canal
Report Prepared By: Aaron D. Parker, P. Bradley Rogers, Samuel T. Finney, and Robert L. Simmonds Jr.Department of the InteriorU.S. Fish and Wildlife ServiceCarterville Fish and Wildlife Conservation Office, Illinois
December 2013
Fisheries Program

1
Executive Summary
Beginning in June 2011, the U.S. Fish and Wildlife Service’s (USFWS) Carterville Fish and Wildlife Conservation Office (FWCO) began evaluating wild fish populations and their behavior within the electric dispersal barrier located in the Chicago Sanitary and Ship Canal. Using a dual-frequency identification SONAR (DIDSON; Sound Metrics Corp., Bellevue, WA) unit, we evaluated fish populations throughout the entire barrier system, which covered the entire gradient of barrier voltages, and also performed concentrated evaluations directly over the strongest part of the barrier. Results of our sampling across the entire barrier system, using DIDSON equipment, revealed a significant accumulation of fish below the active barrier. Some of the fish that were immediately below the active barrier were observed persistently probing and challenging the barrier.
During the concentrated sampling, there were also multiple incidences, in which fish were observed swimming across the entire DIDSON viewing cone. However, no conclusions could be drawn as to whether actual crossings of the barrier had occurred. The hesitancy to draw conclusions regarding crossings was due, in part, to the fact that a single DIDSON unit can only sample half the width of the narrow arrays. Further obscuring the interpretation of the DIDSON footage between the narrow arrays was the movement of the boat (and subsequently the viewing cone) within the canal as we tried to hold position with the boat engine. Because of a concern that fish crossings of the barrier may have occurred, we began pursuing options for deploying two DIDSON units off of a sturdy, fixed structure. From July 30 to August 1, 2013, we were able to perform our first sampling event over the narrow arrays using two DIDSON units that were deployed from a fixed structure.
The two DIDSON units were deployed from the west bank of the CSSC using a telescopic boom lift. The DIDSON units were deployed 10 m from the western canal wall, 1 m below the water surface, and were aimed towards the western wall. Both of the DIDSON units were simultaneously operated from one computer. We were able to obtain 72, 10-minute recordings with the 2 DIDSON units. Out of the 72 recordings that were taken, 44 (61%) of them captured at least 1 occurrence of fish crossing the barrier. Of those 44 recordings which captured fish crossings, 27 (61%) of those revealed multiple fish crossings of the barrier. The sizes of the fish that crossed the barrier were estimated to range from approximately 5 - 10 cm in length. All of the fish observed crossing the barrier did so in schools. Typically, as the schools of fish penetrated deeper into the zone of ultimate field strength, the size of the school contracted into a tight sphere shape and after they crossed, the group expanded again. To determine the species of fish that we most likely observed crossing the barrier, the USFWS Columbia FWCO sampled fish within and near the narrow arrays on September 27, 2013 and caught Gizzard Shad (Dorosoma cepedianum), Threadfin Shad (Dorosoma petenense), and Skipjack Herring (Alosa chrysochloris) ranging in size from 10 - 30 cm in length.

2
Introduction
Beginning in June 2011, the U.S. Fish and Wildlife Service’s (USFWS) Carterville Fish and Wildlife Conservation Office (FWCO) began evaluating wild fish populations and their behavior within the electric dispersal barrier system located in the Chicago Sanitary and Ship Canal (CSSC). Using a dual-frequency identification SONAR (DIDSON; Sound Metrics Corp., Bellevue, WA) unit, we evaluated fish populations throughout the entire barrier system, which covered the entire gradient of barrier voltages (0 – 0.91 V/cm), and also performed concentrated evaluations directly over the strongest part of the barrier. Results of our sampling across the entire barrier system using DIDSON equipment revealed a significant accumulation of fish below the active barrier, similar to the findings of Godlewska et al. (2007). Some of the fish that were immediately below the active barrier were observed persistently probing and challenging the barrier, which was consistent with other observations of fish behavior at electric barriers (Stewart 1981; Savino et al. 2001; Holliman 2011). We defined “probing” behavior as persistent movement up and down and/or sideways along an invisible plane (in this case the barrier). “Challenging” was defined as fish swimming upstream into the barrier and being able to penetrate further than the other fish that were probing.
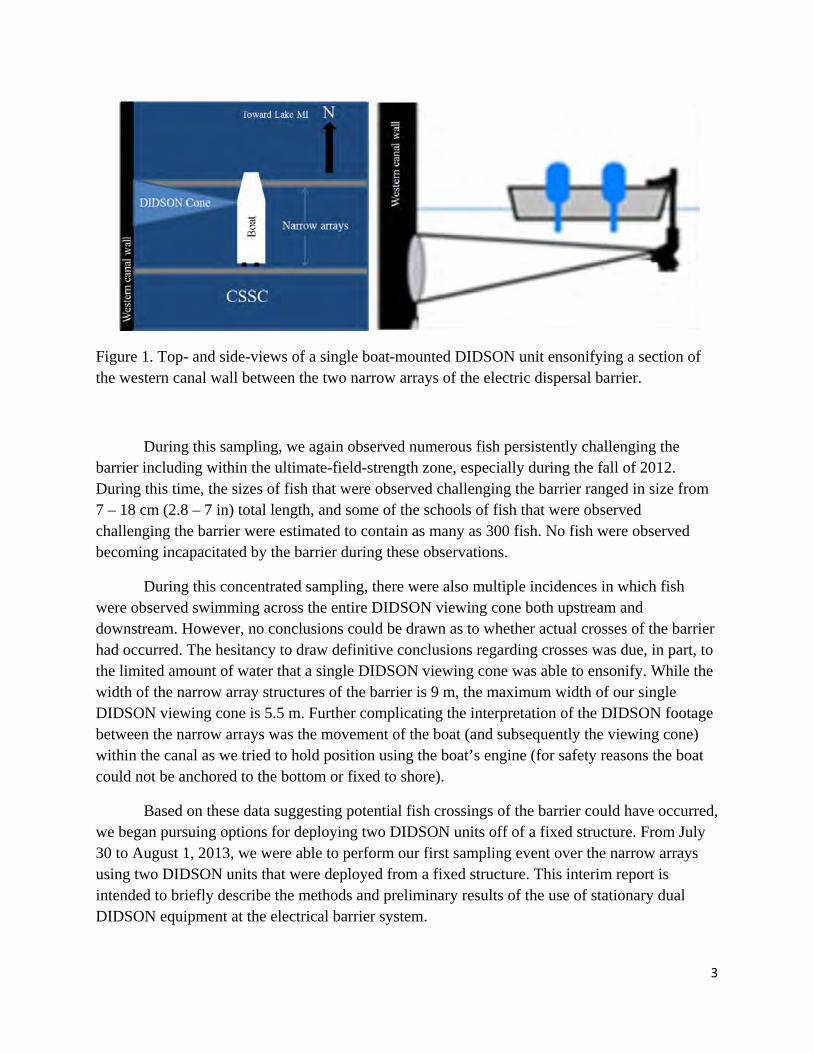
Because of the significant amount of fish accumulating below the active barrier and the persistent probing and challenging behavior observed, a secondary set of sampling began, in April 2012, focusing solely on the portion of the barrier containing the ultimate field strength of 2.5 ms, 30Hz, 0.91 V/cm (0.91 V/cm). The ultimate field strength of 0.91 V/cm covers approximately 2 m of the water surface between the narrow arrays of the barrier, which are 9 m apart at the canal bottom (Holliman 2011). Sampling this area required positioning a DIDSON-equipped boat between the narrow arrays of the electrical barrier, and ensonifying the volume of water immediately below the surface and adjacent to the western canal wall (Figure 1).
We focused our concentrated sampling effort on the water surface near the western canal wall within the zone of ultimate field strength. This sampling location was chosen following previous DIDSON sampling events, which had covered multiple areas within the zone of ultimate field strength. Those surveys showed that when fish occupied that part of the barrier, that they were most abundant at the water surface, near the canal walls.
3
Figure 1. Top- and side-views of a single boat-mounted DIDSON unit ensonifying a section of the western canal wall between the two narrow arrays of the electric dispersal barrier.
During this sampling, we again observed numerous fish persistently challenging the barrier including within the ultimate-field-strength zone, especially during the fall of 2012. During this time, the sizes of fish that were observed challenging the barrier ranged in size from 7 – 18 cm (2.8 – 7 in) total length, and some of the schools of fish that were observed challenging the barrier were estimated to contain as many as 300 fish. No fish were observed becoming incapacitated by the barrier during these observations.
During this concentrated sampling, there were also multiple incidences in which fish were observed swimming across the entire DIDSON viewing cone both upstream and downstream. However, no conclusions could be drawn as to whether actual crosses of the barrier had occurred. The hesitancy to draw definitive conclusions regarding crosses was due, in part, to the limited amount of water that a single DIDSON viewing cone was able to ensonify. While the width of the narrow array structures of the barrier is 9 m, the maximum width of our single DIDSON viewing cone is 5.5 m. Further complicating the interpretation of the DIDSON footage between the narrow arrays was the movement of the boat (and subsequently the viewing cone) within the canal as we tried to hold position using the boat’s engine (for safety reasons the boat could not be anchored to the bottom or fixed to shore).
Based on these data suggesting potential fish crossings of the barrier could have occurred, we began pursuing options for deploying two DIDSON units off of a fixed structure. From July 30 to August 1, 2013, we were able to perform our first sampling event over the narrow arrays using two DIDSON units that were deployed from a fixed structure. This interim report is intended to briefly describe the methods and preliminary results of the use of stationary dual DIDSON equipment at the electrical barrier system.
4
Materials and Methods
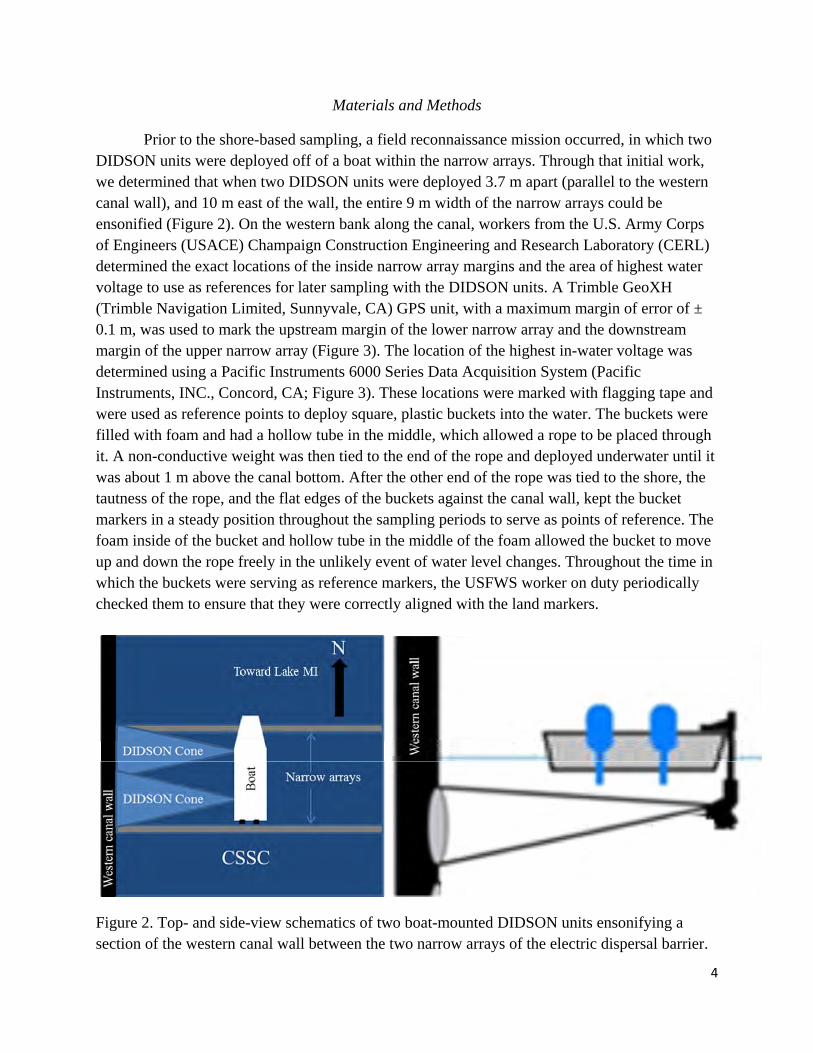
Prior to the shore-based sampling, a field reconnaissance mission occurred, in which two DIDSON units were deployed off of a boat within the narrow arrays. Through that initial work, we determined that when two DIDSON units were deployed 3.7 m apart (parallel to the western canal wall), and 10 m east of the wall, the entire 9 m width of the narrow arrays could be ensonified (Figure 2). On the western bank along the canal, workers from the U.S. Army Corps of Engineers (USACE) Champaign Construction Engineering and Research Laboratory (CERL) determined the exact locations of the inside narrow array margins and the area of highest water voltage to use as references for later sampling with the DIDSON units. A Trimble GeoXH (Trimble Navigation Limited, Sunnyvale, CA) GPS unit, with a maximum margin of error of ± 0.1 m, was used to mark the upstream margin of the lower narrow array and the downstream margin of the upper narrow array (Figure 3). The location of the highest in-water voltage was determined using a Pacific Instruments 6000 Series Data Acquisition System (Pacific Instruments, INC., Concord, CA; Figure 3). These locations were marked with flagging tape and were used as reference points to deploy square, plastic buckets into the water. The buckets were filled with foam and had a hollow tube in the middle, which allowed a rope to be placed through it. A non-conductive weight was then tied to the end of the rope and deployed underwater until it was about 1 m above the canal bottom. After the other end of the rope was tied to the shore, the tautness of the rope, and the flat edges of the buckets against the canal wall, kept the bucket markers in a steady position throughout the sampling periods to serve as points of reference. The foam inside of the bucket and hollow tube in the middle of the foam allowed the bucket to move up and down the rope freely in the unlikely event of water level changes. Throughout the time in which the buckets were serving as reference markers, the USFWS worker on duty periodically checked them to ensure that they were correctly aligned with the land markers.
Figure 2. Top- and side-view schematics of two boat-mounted DIDSON units ensonifying a section of the western canal wall between the two narrow arrays of the electric dispersal barrier.

5
Figure 3. Schematic of the narrow array barrier structures within the CSSC. The red squares denote where the reference markers (buckets) were placed signifying the locations of the inner narrow array margins and the location of the ultimate field strength.
To deploy the DIDSON units into the canal from the western canal bank, a mobile telescopic boom lift was used (Figure 4A-C). The DIDSON units were attached to custom-made mounts including a dielectric coupler, which attached the DIDSON mount to the cage at the end of the boom, thus electrically isolating the boom lift from the barrier electricity. The DIDSON units were deployed 10 m from the western canal wall, 1 m below the water surface, and were aimed towards the western wall. Both of the DIDSON units were simultaneously operated from one computer (Figure 4D).

6
Figure 4. Two DIDSON units being deployed into the CSSC using a telescopic boom lift (A-C) and the two DIDSON units being operated on one computer (D).
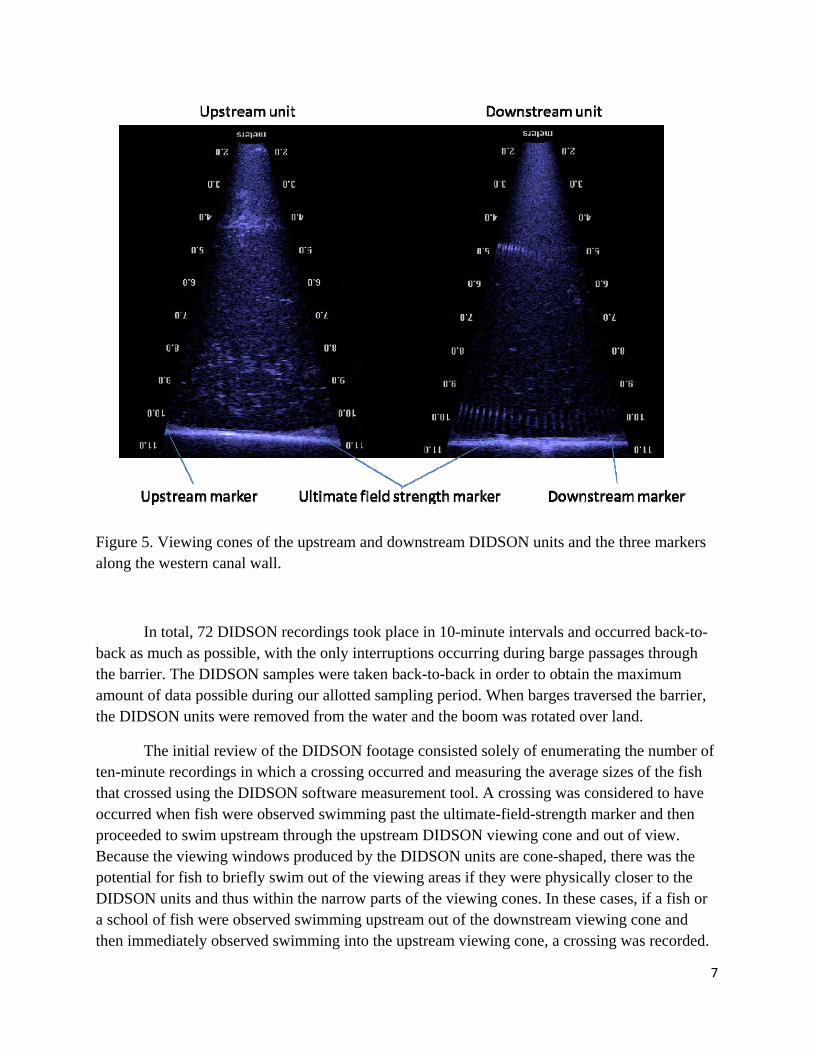
The two DIDSON units were able to ensonify the entire width of the narrow array. To focus our study on fish that were swimming upstream, we positioned the DIDSON units so that the entire downstream array marker was clearly visible in the DIDSON cone, and so that the middle marker denoting the area of the ultimate field strength was visible in both DIDSON cones. By positioning the DIDSON units this way, if fish were to swim immediately adjacent to the canal wall and past the ultimate-field-strength marker, they would be briefly ensonified within both the upstream and downstream DIDSON viewing cones before proceeding further upstream. However, because the DIDSON units were positioned slightly downstream, only a portion of the upstream marker is visible within the upstream DIDSON viewing cone (Figure 5).
7
Figure 5. Viewing cones of the upstream and downstream DIDSON units and the three markers along the western canal wall.
In total, 72 DIDSON recordings took place in 10-minute intervals and occurred back-to-back as much as possible, with the only interruptions occurring during barge passages through the barrier. The DIDSON samples were taken back-to-back in order to obtain the maximum amount of data possible during our allotted sampling period. When barges traversed the barrier, the DIDSON units were removed from the water and the boom was rotated over land.
The initial review of the DIDSON footage consisted solely of enumerating the number of ten-minute recordings in which a crossing occurred and measuring the average sizes of the fish that crossed using the DIDSON software measurement tool. A crossing was considered to have occurred when fish were observed swimming past the ultimate-field-strength marker and then proceeded to swim upstream through the upstream DIDSON viewing cone and out of view. Because the viewing windows produced by the DIDSON units are cone-shaped, there was the potential for fish to briefly swim out of the viewing areas if they were physically closer to the DIDSON units and thus within the narrow parts of the viewing cones. In these cases, if a fish or a school of fish were observed swimming upstream out of the downstream viewing cone and then immediately observed swimming into the upstream viewing cone, a crossing was recorded.
8
Results and Discussion
From July 30 to August 1, 2013, we were able to obtain 72, 10-minute recordings with the paired DIDSON units. The number of recordings that we were able to perform was reduced during the first two days because of inclement weather, which created unsafe working conditions. Although we were not able to record as much footage as we intended, the results that we did obtain were revealing. Throughout the entire sampling period, large schools of fish were observed between the narrow arrays persistently probing and challenging the barrier.
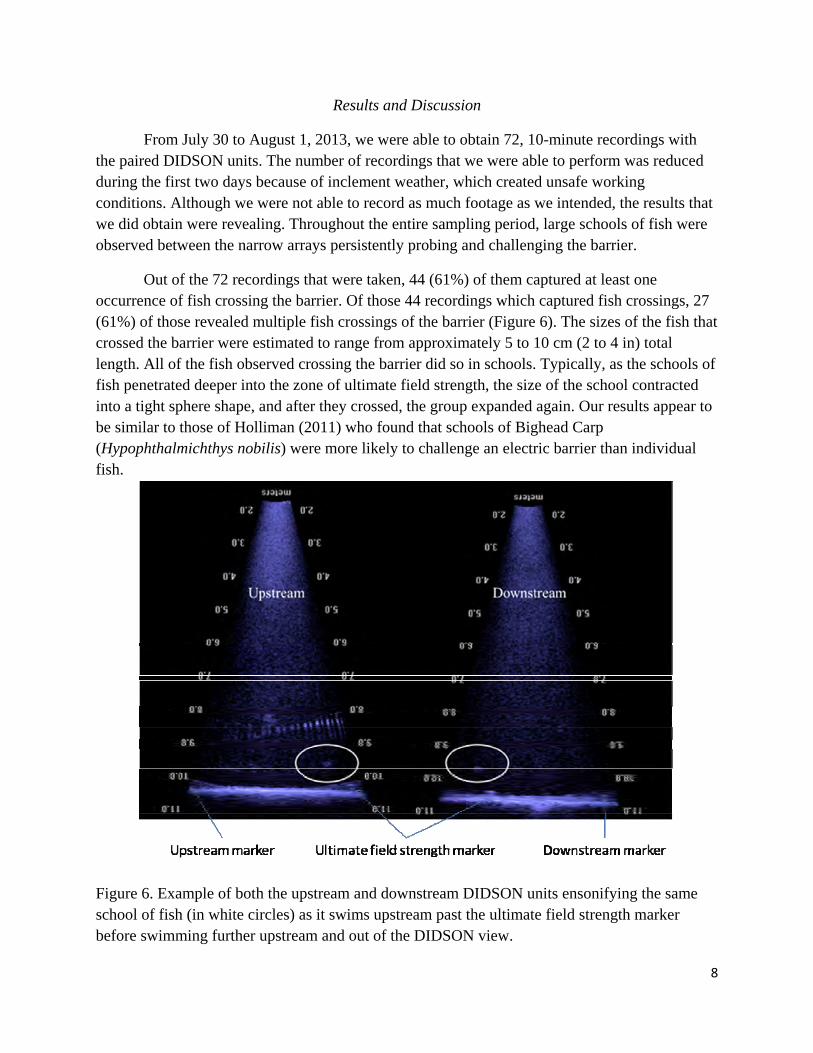
Out of the 72 recordings that were taken, 44 (61%) of them captured at least one occurrence of fish crossing the barrier. Of those 44 recordings which captured fish crossings, 27 (61%) of those revealed multiple fish crossings of the barrier (Figure 6). The sizes of the fish that crossed the barrier were estimated to range from approximately 5 to 10 cm (2 to 4 in) total length. All of the fish observed crossing the barrier did so in schools. Typically, as the schools of fish penetrated deeper into the zone of ultimate field strength, the size of the school contracted into a tight sphere shape, and after they crossed, the group expanded again. Our results appear to be similar to those of Holliman (2011) who found that schools of Bighead Carp (Hypophthalmichthys nobilis) were more likely to challenge an electric barrier than individual fish.
Figure 6. Example of both the upstream and downstream DIDSON units ensonifying the same school of fish (in white circles) as it swims upstream past the ultimate field strength marker before swimming further upstream and out of the DIDSON view.
9
During the period of time that the DIDSON recordings were taking place, field personnel were not able to directly see the fish swimming in the water because of high turbidity in the CSSC. However, several fish that appeared to be Clupeidae species were observed being preyed upon by birds following barge passages through the barrier. Furthermore, the USFWS Columbia FWCO sampled fish near and within the narrow arrays on September 27, 2013, and sampled Gizzard Shad (Dorosoma cepedianum), Threadfin Shad (Dorosoma petenense), and Skipjack Herring (Alosa chrysochloris).
The accumulation of fish below the barrier is not surprising given that fish migrate upstream in lotic systems for numerous reasons, such as foraging, migration, reproduction, and escape from predation (Northcote 1978; Dingle 1980; Stewart 1990). Our observations of the fish continuously probing and challenging the barrier is also consistent with other findings of fish repeatedly challenging an electrical barrier (Stewart 1981; Savino et al. 2001; Holliman 2011). In some cases, fish that have a strong desire to move upstream will continuously challenge an electrical barrier until they cross it, are harmed, or even killed (Stewart 1990; Bullen and Carlson 2003).
To date based on all available monitoring data, the probability of small Asian carp being present at the electric barrier is low. However, both Bighead Carp and Silver Carp (H. molitrix) have been shown to exhibit positive rheotaxis (directed upstream movement against water current) and make long upstream movements (Peters et al. 2006; DeGrandchamp et al. 2008; Holliman 2011; Hoover et al. 2012). Holliman (2011) found that when small Bighead Carp were placed in a laboratory raceway with flowing water and a small electrical barrier, that the fish continuously challenged the barrier. Some fish even re-challenged the barrier immediately upon regaining muscle control after being incapacitated and swept downstream out of the electrical field. This persistent challenging of the electrical field resulted in some fish crossing the barrier (Holliman 2011)..
Conclusions and future work
Based on our preliminary findings, small fish appear to be able to cross the electric dispersal barrier. The sizes of these fish were estimated to range from approximately 5 to 10 cm (2 to 4 in). Future work will include the following:
- We will continue to perform fixed DIDSON monitoring of the electric barrier using the telescopic boom lift in summer and fall 2014, when abundances of small fish at the barrier are greatest (USFWS unpublished data). Our intent was to conduct sampling during 4 weeks in fall 2013; however, due to space limitations we were only able to conduct work at Barrier IIB, and it was not the primary operating barrier during our sampling period.
- Once additional data are collected, we will conduct a more thorough analysis of all data.

10
- Additional study is underway to further evaluate operational protocols of the barriers and to identify any potential actions that may be employed to address the findings discussed in this paper. The research, consisting of six tasks conducted in the USACE Engineer Research and Development Center (ERDC), will include:
o Simulations of a variety of fish behaviors during encroachment into the electric fields of Barriers IIA and IIB including extended stays in the low field (wide array) of the barriers, cross-channel swimming at the downstream edge of the high field (narrow array), and multiple challenges of the barriers;
o Simulations of fish behavior at seasonal extremes of water temperature, water current velocity, and water conductivity;
o Evaluation of the relationships between duration of electrical exposure and fish stress, injury, and mortality;
o Evaluation of volitional challenges of electric fields by groups of fish; and o Simulations using other fish observed in the CSSC near the barriers, such as
Gizzard Shad and Common Carp, to evaluate how similar their responses are to those of the Bighead and Silver Carps.
Acknowledgements
This work was funded by the Great Lakes Restoration Initiative. Support was provided by numerous agencies and companies including the USACE Chicago and Rock Island Districts, USACE Champaign CERL, JEI Inc, and SYTE Corporation.
11
References
Bullen, C. R. and T. J. Carlson. 2003. Non-physical fish barrier systems: their development and potential applications to marine ranching. Reviews in Fish Biology and Fisheries 13:201- 212.
DeGrandchamp, K. L., J. E. Garvey, and R. E. Colombo. 2008. Movement and habitat selection by invasive Asian carps in a large river. Transactions of the American Fisheries Society 137:45-56.
Dingle H. 1980. Ecology and evolution of migration. Pages 2-101 in Gauthreaux Jr., S. A., editor. Animal migration, orientation, and navigation. Academic Press, London.
Godlewska, M., L. Doroszczyk, B. Długoszewski, and M. Mokwa. 2007. Acoustical monitoring of fish at an electric barrier. Fisheries Bethesda.
Holliman, F. M. 2011. Operational protocols for electric barriers on the Chicago Sanitary and Ship Canal: influence of electrical characteristics, water conductivity, fish behavior, and water velocity on risk for breach by small silver and bighead carp. March, 2011, Smith- Root Inc, Vancouver, WA.
Hoover, J. J., L. W. Southern, A. W. Katzenmeyer, and N. M. Hahn. 2012. Swimming performance of Bighead Carp and Silver Carp: methodology, metrics, and management applications. ANSRP Technical Notes Collection. ERDC/TN ANSRP-12-3. Vicksburg, MS: U.S. Army Engineer Research and Development Center.
Northcote, T. G. 1978. Migratory strategies and production in freshwater fishes. Pages 326-359 in S. D. Gerking, editor. Ecology of freshwater fish production. John Wiley and Sons, Inc, New York, NY.
Peters, L. M., M. A. Pegg, and U. G. Reinhardt. 2006. Movements of adult radio-tagged Bighead Carp in the Illinois River. Transactions of the American Fisheries Society 135:1205- 1212.
Savino, J. F., D. J. Jude, and M. J. Kostich. 2001. Use of electrical barriers to deter movement of round goby. Pages 171-182 in C. C. Coutant, editor. Behavioral technologies for fish guidance. American Fisheries Society, Symposium 26, Bethesda, Maryland.
Stewart, P. A. M. 1990. Electric screens and guides. Pages 140-156 in I.G. Cowx and P. Lamarque, editors. Fishing with electricity, applications in freshwater fisheries management. Fishing News Books, Oxford.
Stewart, P. A. M. 1981. An investigation into the reactions of fish to electrified barriers and bubble curtains. Fisheries Research 1: 3-22.