JSW Ispat Special Products Ltd. JSW Steel Limited
16
JSW Steel Limited Investor presentation August, 2020 JSW Ispat Special Products Ltd. Formerly known as Monnet Ispat & Energy Ltd. Corporate Presentation October 2021
Transcript of JSW Ispat Special Products Ltd. JSW Steel Limited
JSW Steel Limited
Investor presentation August, 2020
JSW Ispat Special Products Ltd.
Formerly known as Monnet Ispat & Energy Ltd.
Corporate Presentation
October 2021
Confidential Better Everyday
Source: Company Reports, Bloomberg
Note: * Listed company
(a) Market Cap as per Bloomberg as of 30 September 2021
Latin text
Heading: Arial Body: Arial
East Asian text
Heading: SimHei Body: SimHei Cover title:
Arial/30pt/R255,G255,B255/Bold
Cover subtitle:
Arial/16pt/R255,G255,B255
79
129
189
Theme
Color
(RGB)
192
80
77 219
132
61 137
165
78 113
88
143 0
80
163
255
255
255 0
0
0 255
255
255 0
0
0
JSW Group overview
2
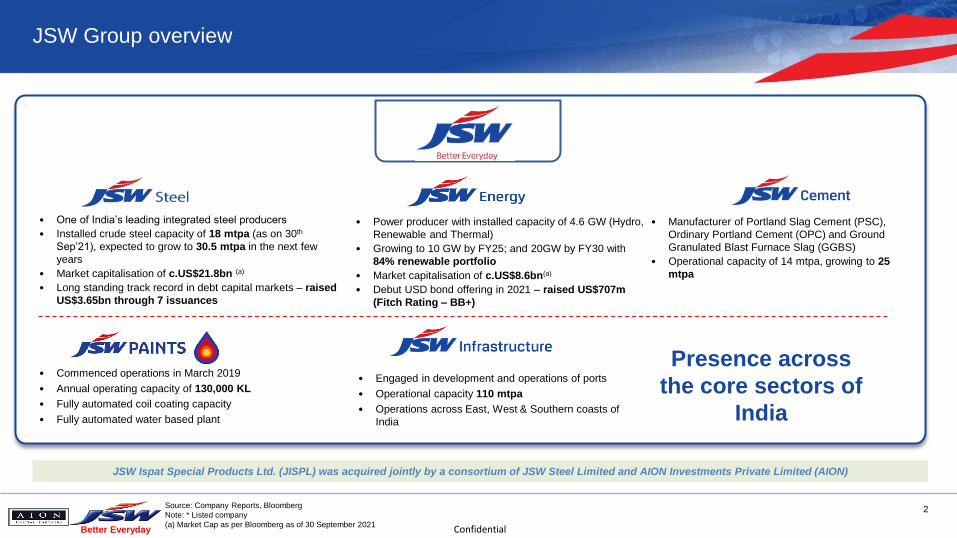
JSW Ispat Special Products Ltd. (JISPL) was acquired jointly by a consortium of JSW Steel Limited and AION Investments Private Limited (AION)
Presence across
the core sectors of
India
• One of India’s leading integrated steel producers
• Installed crude steel capacity of 18 mtpa (as on 30th
Sep’21), expected to grow to 30.5 mtpa in the next few
years
• Market capitalisation of c.US$21.8bn (a)
• Long standing track record in debt capital markets – raised
US$3.65bn through 7 issuances
• Power producer with installed capacity of 4.6 GW (Hydro,
Renewable and Thermal)
• Growing to 10 GW by FY25; and 20GW by FY30 with
84% renewable portfolio
• Market capitalisation of c.US$8.6bn(a)
• Debut USD bond offering in 2021 – raised US$707m
(Fitch Rating – BB+)
• Manufacturer of Portland Slag Cement (PSC),
Ordinary Portland Cement (OPC) and Ground
Granulated Blast Furnace Slag (GGBS)
• Operational capacity of 14 mtpa, growing to 25
mtpa
• Commenced operations in March 2019
• Annual operating capacity of 130,000 KL
• Fully automated coil coating capacity
• Fully automated water based plant
• Engaged in development and operations of ports
• Operational capacity 110 mtpa
• Operations across East, West & Southern coasts of
India
Confidential Better Everyday
(1) As of June 2021
Latin text
Heading: Arial Body: Arial
East Asian text
Heading: SimHei Body: SimHei Cover title:
Arial/30pt/R255,G255,B255/Bold
Cover subtitle:
Arial/16pt/R255,G255,B255
79
129
189
Theme
Color
(RGB)
192
80
77 219
132
61 137
165
78 113
88
143 0
80
163
255
255
255 0
0
0 255
255
255 0
0
0
Apollo overview
3
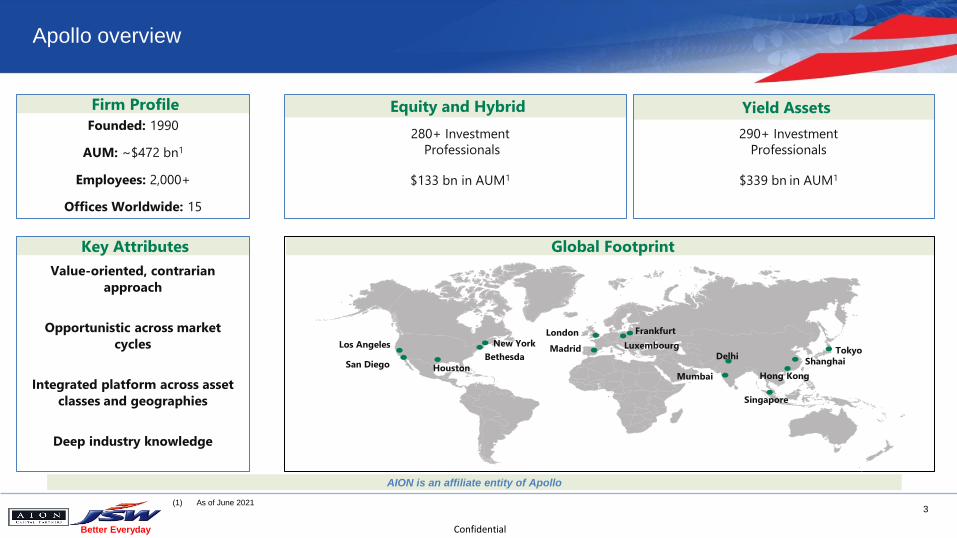
AION is an affiliate entity of Apollo
Key Attributes Global Footprint
Value-oriented, contrarian
approach
Opportunistic across market
cycles
Integrated platform across asset
classes and geographies
Deep industry knowledge
Equity and Hybrid
280+ Investment
Professionals
$133 bn in AUM1
Yield Assets
290+ Investment
Professionals
$339 bn in AUM1
New York
Bethesda
Houston
Los Angeles
London
Madrid
Frankfurt
Luxembourg Delhi
Mumbai
Shanghai
Hong Kong
Singapore
Firm Profile
Founded: 1990
AUM: ~$472 bn1
Employees: 2,000+
Offices Worldwide: 15
Tokyo
San Diego
Confidential Better Everyday 4
30
40
50
60
70S
ep-1
9
Dec-1
9
Ma
r-20
Jun
-20
Se
p-2
0
Dec-2
0
Ma
r-21
Jun
-21
Se
p-2
1
US EurozoneChina Japan
Global Economy
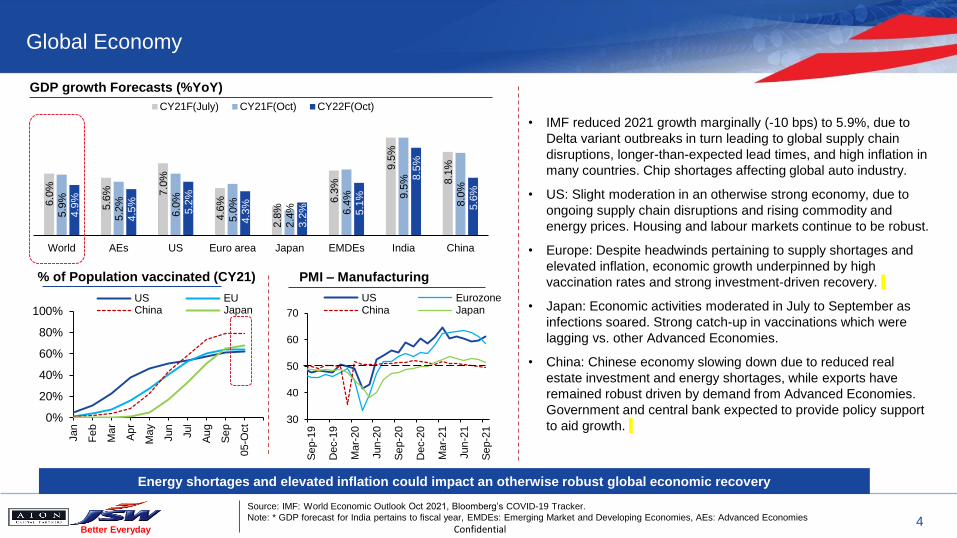
Energy shortages and elevated inflation could impact an otherwise robust global economic recovery
Source: IMF: World Economic Outlook Oct 2021, Bloomberg’s COVID-19 Tracker.
Note: * GDP forecast for India pertains to fiscal year, EMDEs: Emerging Market and Developing Economies, AEs: Advanced Economies
GDP growth Forecasts (%YoY)
• IMF reduced 2021 growth marginally (-10 bps) to 5.9%, due to
Delta variant outbreaks in turn leading to global supply chain
disruptions, longer-than-expected lead times, and high inflation in
many countries. Chip shortages affecting global auto industry.
• US: Slight moderation in an otherwise strong economy, due to
ongoing supply chain disruptions and rising commodity and
energy prices. Housing and labour markets continue to be robust.
• Europe: Despite headwinds pertaining to supply shortages and
elevated inflation, economic growth underpinned by high
vaccination rates and strong investment-driven recovery.
• Japan: Economic activities moderated in July to September as
infections soared. Strong catch-up in vaccinations which were
lagging vs. other Advanced Economies.
• China: Chinese economy slowing down due to reduced real
estate investment and energy shortages, while exports have
remained robust driven by demand from Advanced Economies.
Government and central bank expected to provide policy support
to aid growth. 0%
20%
40%
60%
80%
100%
Jan
Fe
b
Ma
r
Ap
r
Ma
y
Jun
Jul
Au
g
Se
p
05-O
ct
US EUChina Japan
% of Population vaccinated (CY21) PMI – Manufacturing
6.0
%
5.6
%
7.0
%
4.6
%
2.8
% 6
.3%
9.5
%
8.1
%
5.9
%
5.2
%
6.0
%
5.0
%
2.4
%
6.4
%
9.5
%
8.0
%
4.9
%
4.5
%
5.2
%
4.3
%
3.2
%
5.1
%
8.5
%
5.6
%
World AEs US Euro area Japan EMDEs India China
CY21F(July) CY21F(Oct) CY22F(Oct)
Confidential Better Everyday 5
2,000
2,500
3,000
3,500
4,000
Zinc (US$/mt)
Aluminium (US$/mt)
200
600
1,000
1,400
1,800
2,200
2,600
Oct-19 Apr-20 Oct-20 Apr-21 Oct-21
N.America ExW
N.Europe ExW
China FOB
Black Sea FOB
Global Steel 6
69
12
45
57
6
70
0
11
99
49
9
73
0
13
20
59
0
China World World ex-China
Jan-Aug CY19 Jan-Aug CY20 Jan-Aug CY21
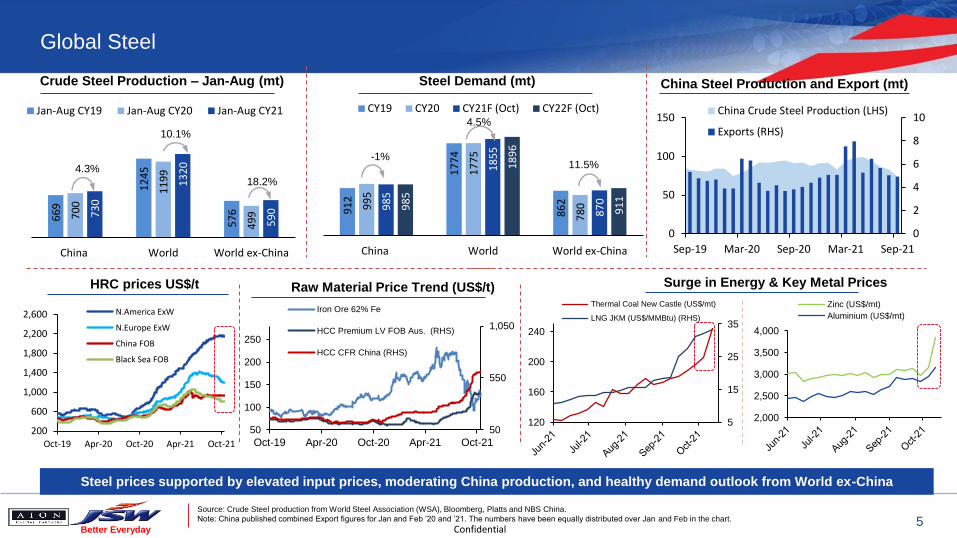
Crude Steel Production – Jan-Aug (mt)
HRC prices US$/t
Source: Crude Steel production from World Steel Association (WSA), Bloomberg, Platts and NBS China.
Note: China published combined Export figures for Jan and Feb ’20 and ’21. The numbers have been equally distributed over Jan and Feb in the chart.
Steel prices supported by elevated input prices, moderating China production, and healthy demand outlook from World ex-China
China Steel Production and Export (mt)
Raw Material Price Trend (US$/t)
4.3%
10.1%
18.2%
0
2
4
6
8
10
0
50
100
150
Sep-19 Mar-20 Sep-20 Mar-21 Sep-21
China Crude Steel Production (LHS)
Exports (RHS)
50
550
1,050
50
100
150
200
250
Oct-19 Apr-20 Oct-20 Apr-21 Oct-21
Iron Ore 62% Fe
HCC Premium LV FOB Aus. (RHS)
HCC CFR China (RHS)
Steel Demand (mt)
Surge in Energy & Key Metal Prices
91
2
17
74
86
2
99
5
17
75
78
0
98
5
18
55
87
0
98
5
18
96
91
1
China World World ex-China
CY19 CY20 CY21F (Oct) CY22F (Oct)
-1%
4.5%
11.5%
5
15
25
35
120
160
200
240
Thermal Coal New Castle (US$/mt)
LNG JKM (US$/MMBtu) (RHS)
Confidential Better Everyday 6
0
100
200
300
400
0
50
100
150
Se
p-1
9
Dec-1
9
Ma
r-20
Jun
-20
Se
p-2
0
Dec-2
0
Ma
r-21
Jun
-21
Se
p-2
1
Tractor (LHS) CV (LHS)
PV (RHS)
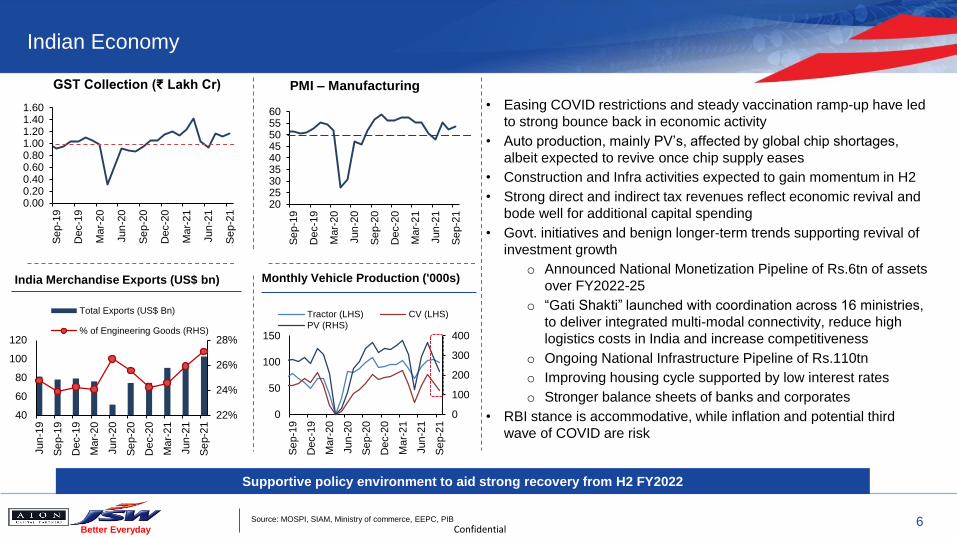
Indian Economy
Source: MOSPI, SIAM, Ministry of commerce, EEPC, PIB
• Easing COVID restrictions and steady vaccination ramp-up have led
to strong bounce back in economic activity
• Auto production, mainly PV’s, affected by global chip shortages,
albeit expected to revive once chip supply eases
• Construction and Infra activities expected to gain momentum in H2
• Strong direct and indirect tax revenues reflect economic revival and
bode well for additional capital spending
• Govt. initiatives and benign longer-term trends supporting revival of
investment growth
o Announced National Monetization Pipeline of Rs.6tn of assets
over FY2022-25
o “Gati Shakti” launched with coordination across 16 ministries,
to deliver integrated multi-modal connectivity, reduce high
logistics costs in India and increase competitiveness
o Ongoing National Infrastructure Pipeline of Rs.110tn
o Improving housing cycle supported by low interest rates
o Stronger balance sheets of banks and corporates
• RBI stance is accommodative, while inflation and potential third
wave of COVID are risk
Supportive policy environment to aid strong recovery from H2 FY2022
Monthly Vehicle Production ('000s)
PMI – Manufacturing
202530354045505560
Se
p-1
9
Dec-1
9
Ma
r-20
Jun
-20
Se
p-2
0
Dec-2
0
Ma
r-21
Jun
-21
Se
p-2
1
India Merchandise Exports (US$ bn)
22%
24%
26%
28%
40
60
80
100
120
Jun
-19
Se
p-1
9
Dec-1
9
Ma
r-20
Jun
-20
Se
p-2
0
Dec-2
0
Ma
r-21
Jun
-21
Se
p-2
1
Total Exports (US$ Bn)
% of Engineering Goods (RHS)
0.000.200.400.600.801.001.201.401.60
Se
p-1
9
Dec-1
9
Ma
r-20
Jun
-20
Se
p-2
0
Dec-2
0
Ma
r-21
Jun
-21
Se
p-2
1
GST Collection (₹ Lakh Cr)
Confidential Better Everyday 7
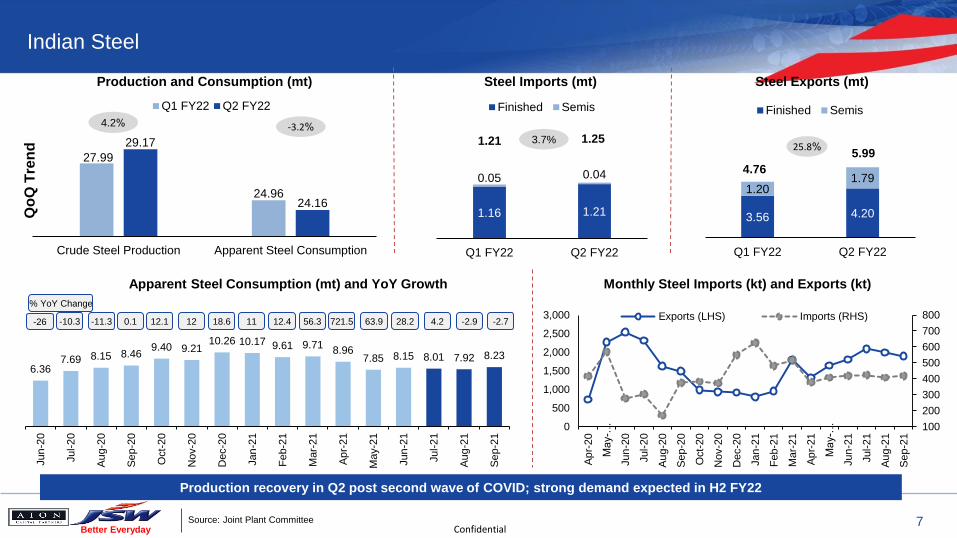
Indian Steel
Steel Imports (mt) Steel Exports (mt) Production and Consumption (mt)
Production recovery in Q2 post second wave of COVID; strong demand expected in H2 FY22
Source: Joint Plant Committee
27.99
24.96
29.17
24.16
Crude Steel Production Apparent Steel Consumption
Q1 FY22 Q2 FY22
4.2% -3.2%
1.16 1.21
0.05 0.04
Q1 FY22 Q2 FY22
Finished Semis
1.21 1.25 3.7%
3.56 4.20
1.20 1.79
Q1 FY22 Q2 FY22
Finished Semis
4.76
5.99 25.8%
Qo
Q T
ren
d
Monthly Steel Imports (kt) and Exports (kt)
100
200
300
400
500
600
700
800
0
500
1,000
1,500
2,000
2,500
3,000
Ap
r-20
Ma
y-…
Jun
-20
Jul-2
0
Au
g-2
0
Se
p-2
0
Oct-
20
Nov-2
0
Dec-2
0
Jan
-21
Fe
b-2
1
Ma
r-21
Ap
r-21
Ma
y-…
Jun
-21
Jul-2
1
Au
g-2
1
Se
p-2
1
Exports (LHS) Imports (RHS)
6.36 7.69 8.15 8.46
9.40 9.21 10.26 10.17 9.61 9.71
8.96 7.85 8.15 8.01 7.92 8.23
Jun
-20
Jul-2
0
Au
g-2
0
Se
p-2
0
Oct-
20
Nov-2
0
Dec-2
0
Jan
-21
Fe
b-2
1
Ma
r-21
Ap
r-21
Ma
y-2
1
Jun
-21
Jul-2
1
Au
g-2
1
Se
p-2
1
-2.7 -2.9 -11.3 0.1 12.1 12 18.6 11 12.4 56.3 721.5 63.9
% YoY Change
Apparent Steel Consumption (mt) and YoY Growth
28.2 4.2 -10.3 -26
Confidential Better Everyday
Latin text
Heading: Arial Body: Arial
East Asian text
Heading: SimHei Body: SimHei Cover title:
Arial/30pt/R255,G255,B255/Bold
Cover subtitle:
Arial/16pt/R255,G255,B255
79
129
189
Theme
Color
(RGB)
192
80
77 219
132
61 137
165
78 113
88
143 0
80
163
255
255
255 0
0
0 255
255
255 0
0
0
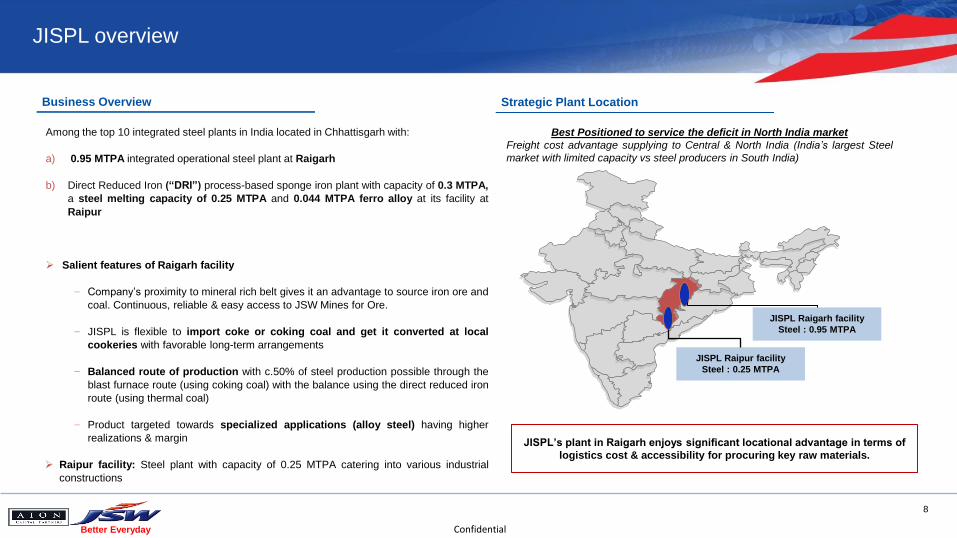
JISPL overview
8
Among the top 10 integrated steel plants in India located in Chhattisgarh with:
a) 0.95 MTPA integrated operational steel plant at Raigarh
b) Direct Reduced Iron (“DRI”) process-based sponge iron plant with capacity of 0.3 MTPA,
a steel melting capacity of 0.25 MTPA and 0.044 MTPA ferro alloy at its facility at
Raipur
Salient features of Raigarh facility
− Company’s proximity to mineral rich belt gives it an advantage to source iron ore and
coal. Continuous, reliable & easy access to JSW Mines for Ore.
− JISPL is flexible to import coke or coking coal and get it converted at local
cookeries with favorable long-term arrangements
− Balanced route of production with c.50% of steel production possible through the
blast furnace route (using coking coal) with the balance using the direct reduced iron
route (using thermal coal)
− Product targeted towards specialized applications (alloy steel) having higher
realizations & margin
Raipur facility: Steel plant with capacity of 0.25 MTPA catering into various industrial
constructions
JISPL’s plant in Raigarh enjoys significant locational advantage in terms of
logistics cost & accessibility for procuring key raw materials.
JISPL Raigarh facility
Steel : 0.95 MTPA
JISPL Raipur facility
Steel : 0.25 MTPA
Best Positioned to service the deficit in North India market
Freight cost advantage supplying to Central & North India (India’s largest Steel
market with limited capacity vs steel producers in South India)
Business Overview Strategic Plant Location
Confidential Better Everyday
Latin text
Heading: Arial Body: Arial
East Asian text
Heading: SimHei Body: SimHei Cover title:
Arial/30pt/R255,G255,B255/Bold
Cover subtitle:
Arial/16pt/R255,G255,B255
79
129
189
Theme
Color
(RGB)
192
80
77 219
132
61 137
165
78 113
88
143 0
80
163
255
255
255 0
0
0 255
255
255 0
0
0
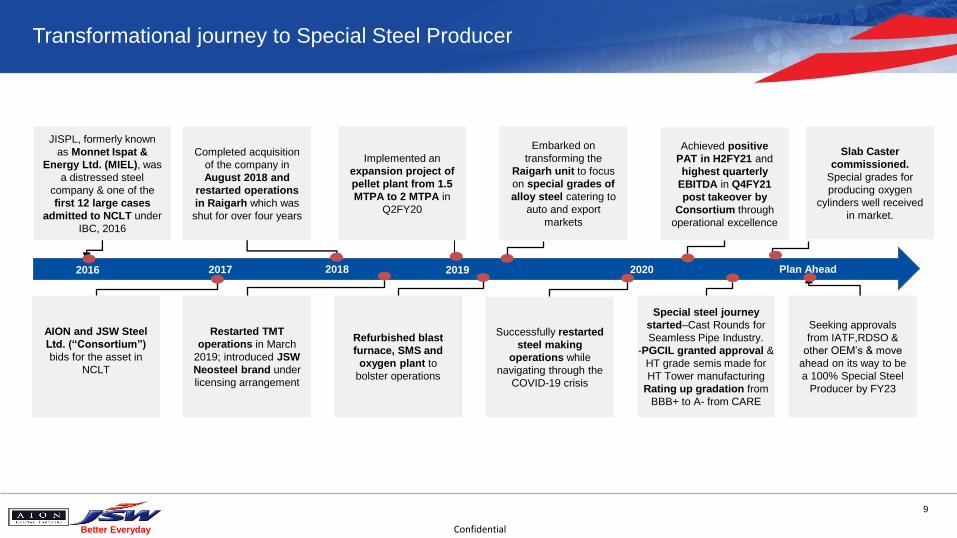
Transformational journey to Special Steel Producer
9
JISPL, formerly known
as Monnet Ispat &
Energy Ltd. (MIEL), was
a distressed steel
company & one of the
first 12 large cases
admitted to NCLT under
IBC, 2016
AION and JSW Steel
Ltd. (“Consortium”)
bids for the asset in
NCLT
Completed acquisition
of the company in
August 2018 and
restarted operations
in Raigarh which was
shut for over four years
Restarted TMT
operations in March
2019; introduced JSW
Neosteel brand under
licensing arrangement
Implemented an
expansion project of
pellet plant from 1.5
MTPA to 2 MTPA in
Q2FY20
Refurbished blast
furnace, SMS and
oxygen plant to
bolster operations
Embarked on
transforming the
Raigarh unit to focus
on special grades of
alloy steel catering to
auto and export
markets
Successfully restarted
steel making
operations while
navigating through the
COVID-19 crisis
Achieved positive
PAT in H2FY21 and
highest quarterly
EBITDA in Q4FY21
post takeover by
Consortium through
operational excellence
Seeking approvals
from IATF,RDSO &
other OEM’s & move
ahead on its way to be
a 100% Special Steel
Producer by FY23
2019 2016 2017 2018 2020 Plan Ahead
Special steel journey
started–Cast Rounds for
Seamless Pipe Industry.
-PGCIL granted approval &
HT grade semis made for
HT Tower manufacturing
Rating up gradation from
BBB+ to A- from CARE
Slab Caster
commissioned.
Special grades for
producing oxygen
cylinders well received
in market.
Confidential Better Everyday
Latin text
Heading: Arial Body: Arial
East Asian text
Heading: SimHei Body: SimHei Cover title:
Arial/30pt/R255,G255,B255/Bold
Cover subtitle:
Arial/16pt/R255,G255,B255
79
129
189
Theme
Color
(RGB)
192
80
77 219
132
61 137
165
78 113
88
143 0
80
163
255
255
255 0
0
0 255
255
255 0
0
0
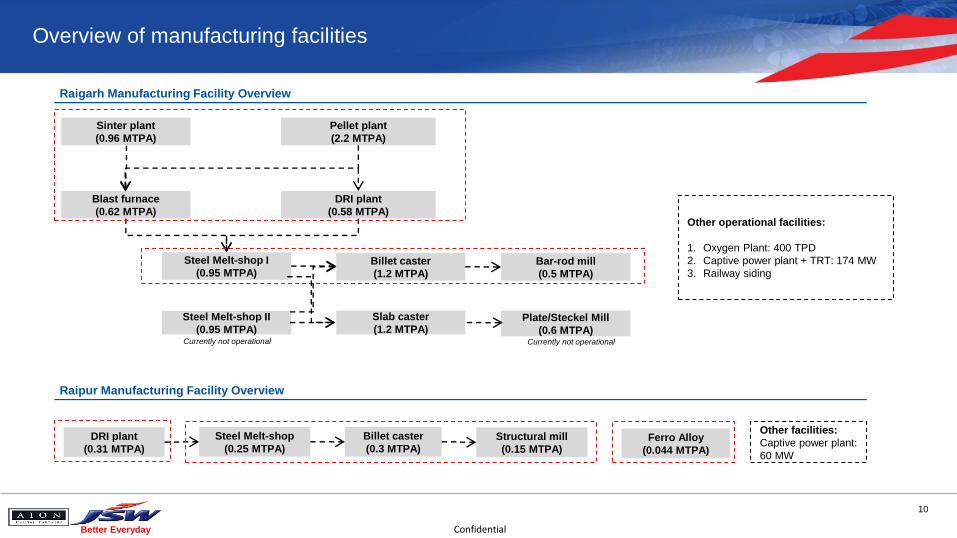
Overview of manufacturing facilities
10
Other operational facilities:
1. Oxygen Plant: 400 TPD
2. Captive power plant + TRT: 174 MW
3. Railway siding
DRI plant
(0.31 MTPA)
Steel Melt-shop
(0.25 MTPA)
Billet caster
(0.3 MTPA) Structural mill
(0.15 MTPA)
Other facilities:
Captive power plant:
60 MW
Ferro Alloy
(0.044 MTPA)
Sinter plant
(0.96 MTPA)
Pellet plant
(2.2 MTPA)
Blast furnace
(0.62 MTPA)
DRI plant
(0.58 MTPA)
Steel Melt-shop I
(0.95 MTPA)
Steel Melt-shop II
(0.95 MTPA)
Billet caster
(1.2 MTPA)
Bar-rod mill
(0.5 MTPA)
Slab caster
(1.2 MTPA) Plate/Steckel Mill
(0.6 MTPA) Currently not operational Currently not operational
Raigarh Manufacturing Facility Overview
Raipur Manufacturing Facility Overview
Confidential Better Everyday
Latin text
Heading: Arial Body: Arial
East Asian text
Heading: SimHei Body: SimHei Cover title:
Arial/30pt/R255,G255,B255/Bold
Cover subtitle:
Arial/16pt/R255,G255,B255
79
129
189
Theme
Color
(RGB)
192
80
77 219
132
61 137
165
78 113
88
143 0
80
163
255
255
255 0
0
0 255
255
255 0
0
0
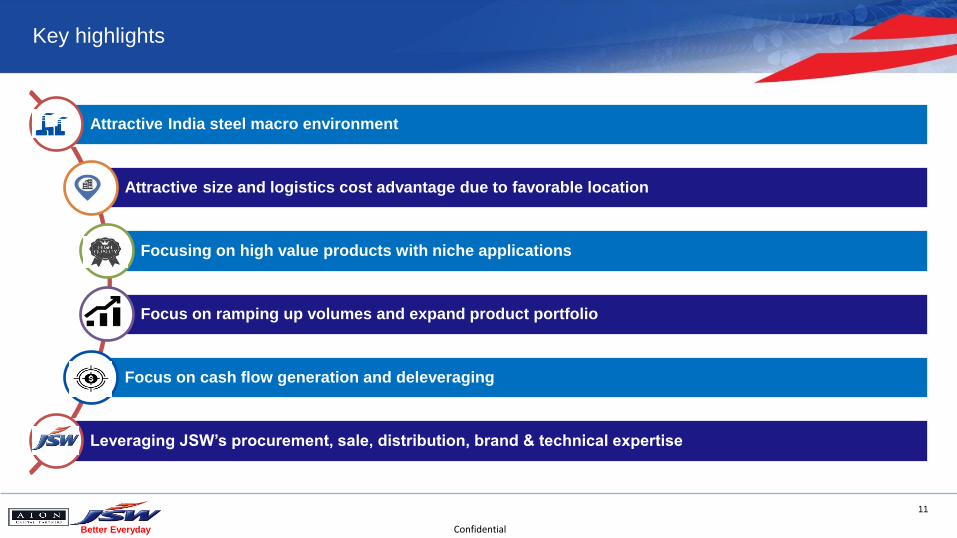
Key highlights
11
Attractive India steel macro environment
Attractive size and logistics cost advantage due to favorable location
Focusing on high value products with niche applications
Focus on ramping up volumes and expand product portfolio
Focus on cash flow generation and deleveraging
Leveraging JSW’s procurement, sale, distribution, brand & technical expertise
Confidential Better Everyday
*Sales are net of internal consumption
#Rolled products include TMT, Special Rolled, Structural Steel & Ferro Alloys
Latin text
Heading: Arial Body: Arial
East Asian text
Heading: SimHei Body: SimHei Cover title:
Arial/30pt/R255,G255,B255/Bold
Cover subtitle:
Arial/16pt/R255,G255,B255
79
129
189
Theme
Color
(RGB)
192
80
77 219
132
61 137
165
78 113
88
143 0
80
163
255
255
255 0
0
0 255
255
255 0
0
0
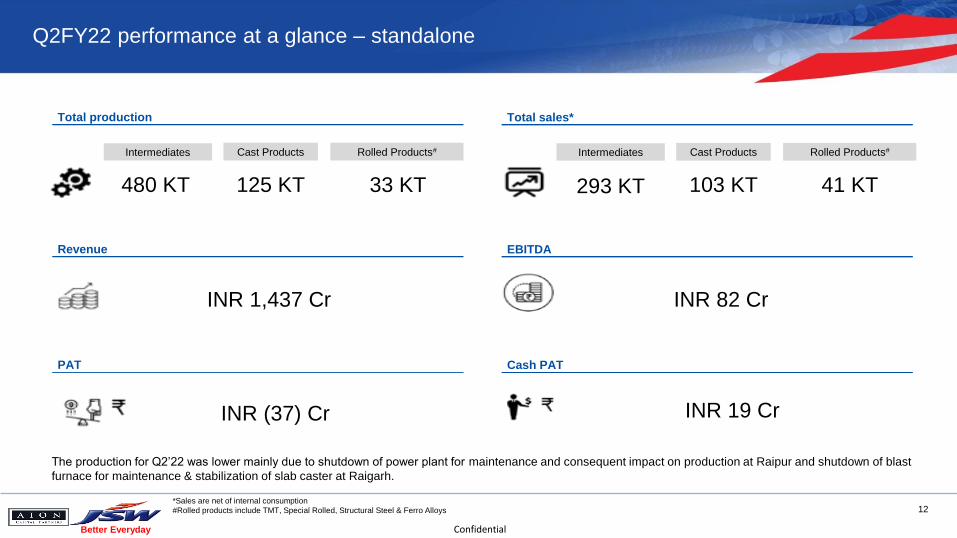
Q2FY22 performance at a glance – standalone
12
Intermediates Rolled Products#
480 KT 33 KT 293 KT 41 KT
INR 1,437 Cr INR 82 Cr
INR (37) Cr INR 19 Cr
Cast Products
103 KT 125 KT
Intermediates Rolled Products# Cast Products
Total production Total sales*
Revenue EBITDA
PAT Cash PAT
The production for Q2’22 was lower mainly due to shutdown of power plant for maintenance and consequent impact on production at Raipur and shutdown of blast
furnace for maintenance & stabilization of slab caster at Raigarh.
Confidential Better Everyday
*Sales are net of internal consumption
#Rolled products include TMT, Special rolled, Structural Steel & Ferro Alloys
Latin text
Heading: Arial Body: Arial
East Asian text
Heading: SimHei Body: SimHei Cover title:
Arial/30pt/R255,G255,B255/Bold
Cover subtitle:
Arial/16pt/R255,G255,B255
79
129
189
Theme
Color
(RGB)
192
80
77 219
132
61 137
165
78 113
88
143 0
80
163
255
255
255 0
0
0 255
255
255 0
0
0
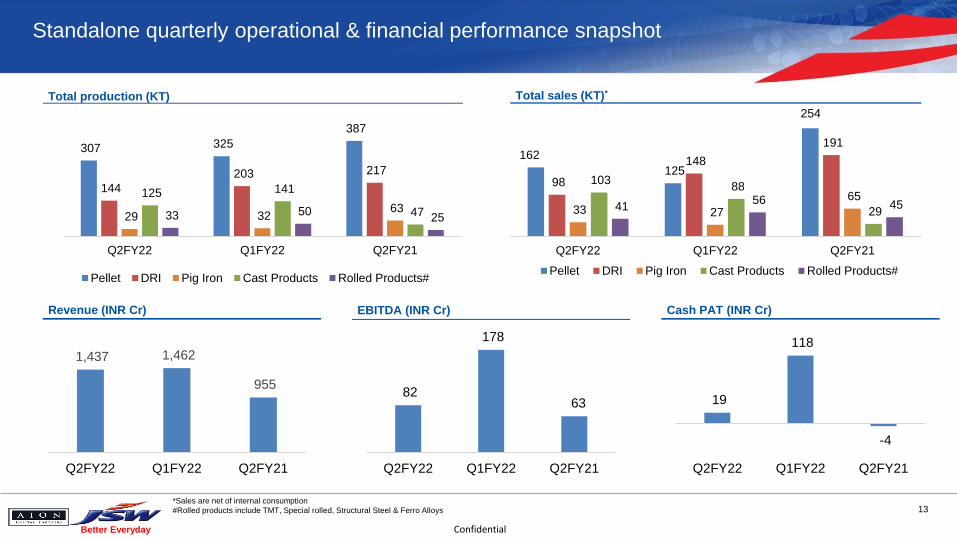
Standalone quarterly operational & financial performance snapshot
13
307 325
387
144
203 217
29 32 63
125 141
47 33 50 25
Q2FY22 Q1FY22 Q2FY21
Pellet DRI Pig Iron Cast Products Rolled Products#
162
125
254
98
148
191
33 27
65
103 88
29 41 56 45
Q2FY22 Q1FY22 Q2FY21
Pellet DRI Pig Iron Cast Products Rolled Products#
1,437 1,462
955
Q2FY22 Q1FY22 Q2FY21
82
178
63
Q2FY22 Q1FY22 Q2FY21
19
118
-4
Q2FY22 Q1FY22 Q2FY21
Total production (KT) Total sales (KT)*
Revenue (INR Cr) EBITDA (INR Cr) Cash PAT (INR Cr)
Confidential Better Everyday
Latin text
Heading: Arial Body: Arial
East Asian text
Heading: SimHei Body: SimHei Cover title:
Arial/30pt/R255,G255,B255/Bold
Cover subtitle:
Arial/16pt/R255,G255,B255
79
129
189
Theme
Color
(RGB)
192
80
77 219
132
61 137
165
78 113
88
143 0
80
163
255
255
255 0
0
0 255
255
255 0
0
0
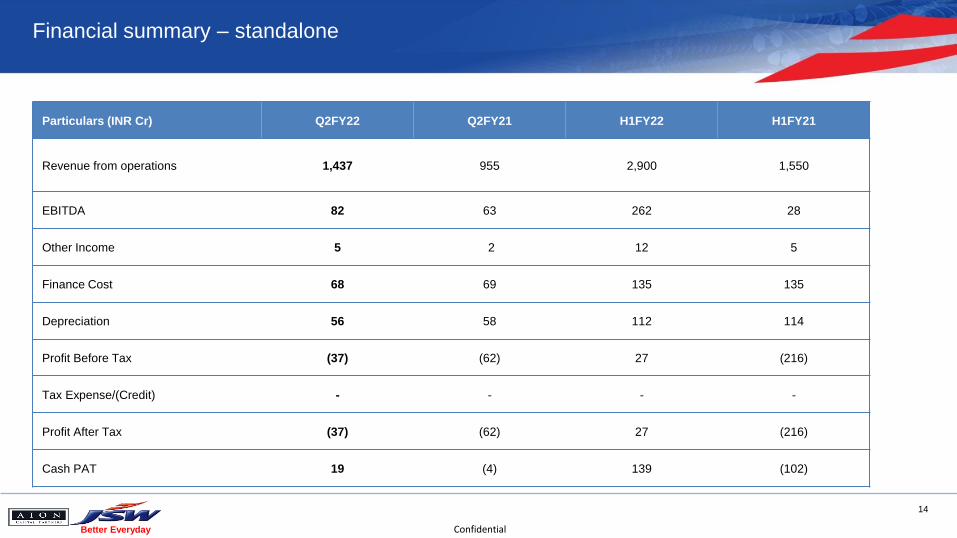
Financial summary – standalone
14
Particulars (INR Cr) Q2FY22 Q2FY21 H1FY22 H1FY21
Revenue from operations 1,437 955 2,900 1,550
EBITDA 82 63 262 28
Other Income 5 2 12 5
Finance Cost 68 69 135 135
Depreciation 56 58 112 114
Profit Before Tax (37) (62) 27 (216)
Tax Expense/(Credit) - - - -
Profit After Tax (37) (62) 27 (216)
Cash PAT 19 (4) 139 (102)
Confidential Better Everyday
Latin text
Heading: Arial Body: Arial
East Asian text
Heading: SimHei Body: SimHei Cover title:
Arial/30pt/R255,G255,B255/Bold
Cover subtitle:
Arial/16pt/R255,G255,B255
79
129
189
Theme
Color
(RGB)
192
80
77 219
132
61 137
165
78 113
88
143 0
80
163
255
255
255 0
0
0 255
255
255 0
0
0
Forward looking and cautionary statement
15
Certain statements in this report concerning our future growth prospects are forward looking statements, which involve a number of risks, and uncertainties that could cause actual results to differ materially from
those in such forward looking statements. The risk and uncertainties relating to these statements include, but are not limited to risks and uncertainties regarding fluctuations in earnings, our ability to manage growth,
intense competition within Steel industry including those factors which may affect our cost advantage, wage increases in India, our ability to attract and retain highly skilled professionals, time and cost overruns on
fixed-price, fixed-time frame contracts, our ability to commission mines within contemplated time and costs, our ability to raise the finance within time and cost client concentration, restrictions on immigration, our
ability to manage our internal operations, reduced demand for steel, our ability to successfully complete and integrate potential acquisitions, liability for damages on our service contracts, the success of the
companies in which the Company has made strategic investments, withdrawal of fiscal/governmental incentives, impact of regulatory measures, political instability, legal restrictions on raising capital or acquiring
companies outside India, unauthorized use of our intellectual property and general economic conditions affecting our industry. The company does not undertake to update any forward looking statements that may be
made from time to time by or on behalf of the company.
JSW Steel Limited
Investor presentation August, 2020
Thank You