JPM_Spring_Mtgs_Apr_2014.pdf
54
(*) Deputy-Governor, International Affairs and Financial Regulation, Banco Central do Brasil. These remarks are personal and do not necessarily reflect the opinions of the Banco Central do Brasil (BCB) 1 Luiz Awazu Pereira da Silva* April 2014 Brazil Economic Outlook & Challenges when Normalization begins IMF-World Bank Spring Meetings 2014 Washington DC
-
Upload
angela-kulaif -
Category
Documents
-
view
212 -
download
0
Transcript of JPM_Spring_Mtgs_Apr_2014.pdf

(*) Deputy-Governor, International Affairs and Financial Regulation, Banco Central do Brasil. These remarks are
personal and do not necessarily reflect the opinions of the Banco Central do Brasil (BCB) 1
Luiz Awazu Pereira da Silva*
April 2014
Brazil Economic Outlook
& Challenges when
Normalization begins
IMF-World Bank Spring Meetings 2014
Washington DC

Outline
• Global Economy
• EMEs
• Brazil
– Fundamentals, Differentiation, Policy Reaction
– Inflation
– Growth
– Challenges
2

Main Messages (1)
• Global economy a bit better (e.g., US recovery, less tail risks/false positive in EuroZone, China)
• Normalization has begun, it’s a net positive; better coordination, FED’s communication on UMP exit (e.g., separation, spillovers, caution); repricing underway of EMEs assets w/ some volatility
• Nothing really new in challenges faced by EMEs (Impossible Trinity, Mundell-Fleming) during GFC (e.g., transmission of K flows into inflation, asset prices, exchange rate, credit market, etc.), except for unprecedented speed+intensity + simultaneity of UMP (ZIF+QE+FG) in 3 major monetary areas
3

Main Messages (2)
• EME monetary policy frameworks (IT or not) had to address challenges posing significant risks to monetary and/or financial stability (e.g., typical “boom” & “feel good” moment, followed by “sudden stop”, reversal); but not only an EME bp (e.g., EZ periphery, Baltics, East-Asia)
• Good news: many EMEs had experienced, more prepared are always riding some global financial cycle (local MP in AE have global effects), we are always into some kind of “beauty contest”, especially deficit-savings countries
• Bad news (in a while): UMP unprecedented, AEs’ exit not synchronized (FED, BoJ, ECB), “New Normal”’ equilibria?
4

Main Messages (3) • Brazil’s textbook response in this transition is working
well: flexible ER, AD management (FP+MP) with sizeable buffer of self-insurance (reserves); MaPs worked well for financial stability and complemented MP in upswing; FX buffer is important to reduce volatility during “tapering” and help financial stability (FS)
• Brazil’s took early action (MP), prepared the reversal, addressed inflation pressure (early 2013), put in place FX hedge program, but challenges remain: ST high-persistent inflation, sticky expectations, supply shock food prices, growth-confidence nexus; MLT rotating growth from C to I, more TFP through increasing physical & human K stocks
5

Slightly Better but Complex, Why?
• UMP unprecendented policy framework, despite the FED’s much improved FG for exit there are the Known Unknowns and the Unknown Unknowns, like what?
• AEs: NAIRU, labor market & wage, transmission into inflation, neutral rate, risks of new bubbles, potential growth & “secular decline”, etc. Issue: anxiety about “control” over slope of yield curve & timing of future changes in monetary conditions (anticipation?)
• EMEs: life after “easy money” and the commodity super-cycle? “Decoupling” or “middle-income growth traps”? Issue: anxiety about how local political economy conditions would allow necessary & timely adjustments
6

7
Different Studies for Nairu, Phillips Curve and ST-LT Unemployment & Inflation wages in the US
Source: Krueger, Alan B. Cramer, Judd, and Cho. Are the Long-Term Unemployed on the Margins of the Labor Market?, Brookings Panel on Economic Activity, March 20–21, 2014, Princeton University & NBER

8
US-Nairu
Source: Deutsche Bank. U.S. Employment Outlook. Sep., 2013.

9
US-Do you look by duration?
Source: Krueger, Alan B. Cramer, Judd, and Cho. Are the Long-Term Unemployed on the Margins of the Labor Market?, Brookings Panel on Economic Activity, March 20–21, 2014, Princeton University & NBER

US-Do you look by skills?
10
0
2
4
6
8
10
12
14
16
18m
ar-
00
nov-0
0
jul-01
mar-
02
nov-0
2
jul-03
mar-
04
nov-0
4
jul-05
mar-
06
nov-0
6
jul-07
mar-
08
nov-0
8
jul-09
mar-
10
nov-1
0
jul-11
mar-
12
nov-1
2
jul-13
mar-
14
%
Unemployment Rates by Education
Less than a high school diploma High school graduates, no college
Less than a bachelor's degree College graduates
Source: US Bureau of Census for the Bureau of Labor Statistics - Current Population Survey (CPS)
11
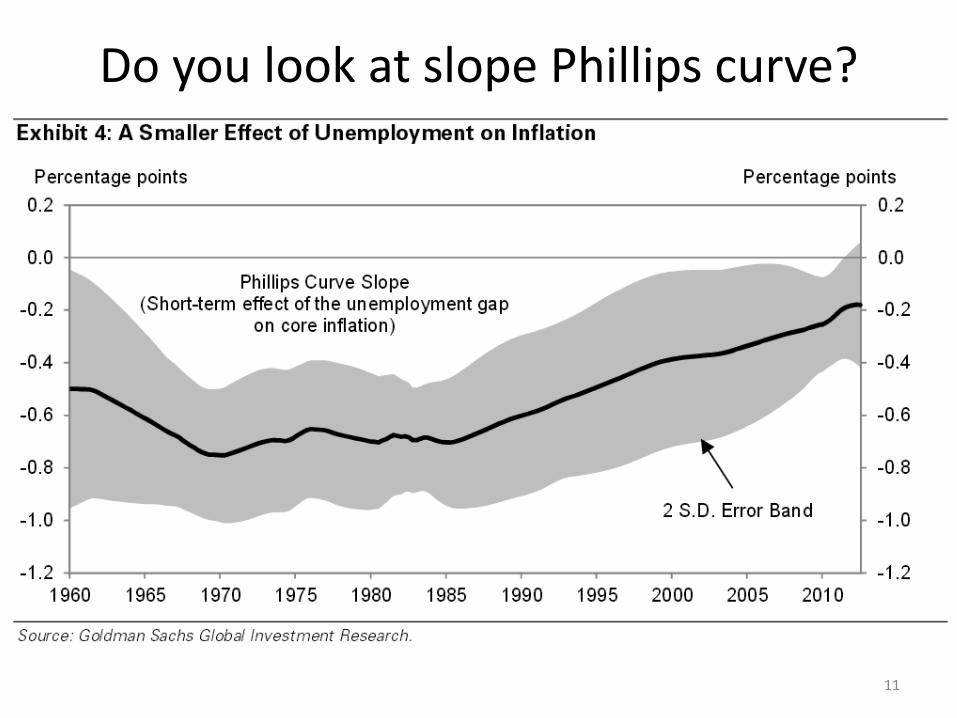
Do you look at slope Phillips curve?

Do you look at slope Phillips curve?
12 Source: IMF, Monetary Policy In the New Normal, SDN April 2014

13
US-Which Unemployment Projects Better Wage Growth?

14
US-Which Unemployment Measure Projects Better CPI?

US-Unskilled Labor Wage Moderation
15
70
75
80
85
90
95
100
105
110
115
mar
00
set 00
mar
01
se
t 0
1
mar
02
set 02
mar
03
set 03
mar
04
set 04
mar
05
set 05
mar
06
set 06
mar
07
set 07
mar
08
se
t 0
8
mar
09
set 09
mar
10
set 10
mar
11
set 11
mar
12
set 12
mar
13
set 13
méd
ia d
e 2
008
= 1
00
Weekly and hourly earnings data from the Current Population Survey
Less than a high school diploma High school graduates, no college*Some college or associate degree Bachelor's degree or higher
Source: US Bureau of Census for the Bureau of Labor Statistics - Current Population Survey (CPS)

US: No inflationary surprises
16
0,0%
0,5%
1,0%
1,5%
2,0%
2,5%
3,0%J
an
12
Fe
b 1
2
Ma
r 1
2
Ap
r 1
2
Ma
y 1
2
Ju
n 1
2
Ju
l 1
2
Au
g 1
2
Se
p 1
2
Oc
t 1
2
No
v 1
2
De
c 1
2
Ja
n 1
3
Fe
b 1
3
Ma
r 1
3
Ap
r 1
3
Ma
y 1
3
Ju
n 1
3
Ju
l 1
3
Au
g 1
3
Se
p 1
3
Oc
t 1
3
No
v 1
3
De
c 1
3
Ja
n 1
4
Fe
b 1
4
Yo
Y
PCE PCE - Core Dallas FED - trimmed mean
Sources: US Bureau of Economic Analysis (BEA), FED and Bloomberg

17
Similar Nairu Changes – selected AEs
Source: la Serve, M.E.; Lemoine, M. 2011. Measuring the Nairu: a complementary approach. Document de Travail 342. Banque de France.
Thin line: unemployment rate; bold line: tv-Nairu; dotted lines: 95%-confidence interval; dashed line: unemployment gap.

18 Source: The Neutral Interest Rate and the Stance of Monetary Policy in Brazil. Anpec 2013
And Great Moderation Neutral interest rate?

19
And Great Moderation Neutral interest rate?
Source: THE EFFECTIVENESS OF MONETARY POLICY SINCE THE ONSET OF THE FINANCIAL CRISIS ECONOMICS DEPARTMENT WORKING PAPER No. 1081. OECD

And Policy Rates in EMEs? My Taylor is Poor?
Sources: IMF, International Financial Statistics and World Economic Outlook; Bloomberg; CEIC;
Consensus Economics; Datastream; national data; BIS calculations.

Baseline for Exiting UMP in the US
• Net positive for the rest of the World, despite ST volatility that will also depend on local policy stances and conditions
• FED communication is working, separation “tapering” & “tightening”, cautious approach, mindful of spillovers
• Labor market conditions, different Studies for Nairu, Phillips Curve and ST-LT unemployment & inflation wages in the US nominal wage rigidity in downturn might moderate and/or delay wage adjustment in upturn
• Neutral interest rates different studies for AEs levels after Great Moderation and GFC might have changed
• For the moment: despite these uncertainties, stick to Baseline, as the most likely scenario
21

Chronicle of a Death Foretold: EME
• As the Story goes: EMEs benefitted from “easy money” and allowed excessive relaxation of policy stances
• Local political economy favored counter-cyclical policy (especially the expansionary bit)
• Fundamentals deteriorated (e.g., asset-credit bubbles, higher current account deficits, inflationary pressure, fiscal stance-debt-to-GDP ratios, external financing for both corporates and sovereigns, etc.)
• No structural reforms in good times: lower growth prospects in the future
• Perfect storm in the making: higher vulnerability to “sudden stops” crisis looming
22

Our Answer in Brazil: No Quite So..
23

Brazil: Fundamentals
• Floating ERR, repricing of assets and depreciation is part of the solution and is not vulnerability
• Financial Sector has proven resilience, strong capital, provision and liquidity indicators
• Ratios of external financing (stocks and flows) are strong & sustainable
• Hedge program is contributing to reduce volatility, including after “perfect storm” events (e.g., tapering, EME January sell-off, Brazil’s downgrading)
24

External Financing
25 Source: IIF e Datastream
0 10 20 30 40 50
India
Colombia
Indonesia
Brazil
Mexico
Peru
SouthAfrica
Chile
Turkey
%
External Debt/GDP
0 10 20 30
Brazil
Colombia
Peru
SouthAfrica
Chile
Mexico
India
Indonesia
Turkey
%
Short Debt/Total External Debt
2013*
2012

Source: BCB
External Debt Ratios
120,6%
63,4%
38,8%
19,9% 27,8%
13,9%
0
20
40
60
80
100
120
140
short term debt/intl.reserves
debtservices/exports
external debt/GDP
Dec 03 Feb 14*
%
*estimate

Liquid Assets to Short Term
Liabilities
11,6
12,0
13,3
13,4
13,9
14,0
14,3
14,4
14,4
14,7
14,8
15,7
16,1
16,4
17,1
19,1
10 12 14 16 18 20
Australia
Spain
India
Russia
Italy
South Korea
France
United States
Canada
Japan
South Africa
Turkey
Mexico
United Kingdom
Brazil
Germany
26,1
36,1
40,0
44,9
45,0
46,7
49,9
72,5
76,4
82,0
96,9
121,4
140,3
160,0
0 50 100 150 200
India
South Africa
United Kingdom
Canada
Australia
Mexico
Japan
Turkey
United States
Russia
Italy
South Korea
Germany
Brazil
-86,3
-31,9
-22,2
-19,2
-14,7
-14,5
-13,6
-13,6
-10,9
-6,0
-3,9
-3,2
7,7
10,6
-120 -20 80
Italy
Spain
South Africa
Japan
Australia
United Kingdom
United States
India
Russia
Canada
South Korea
Turkey
Mexico
Brazil
Source: IMF (FSI – latest available data)
Sound financial system Regulatory Capital to
Risk-Weighted Assets ( Provisions – NPL) / Capital

Source: BCB
Feb 14
Origin of Bank Funding
Banks: Low Share of External Funding
95,6
88,7 85,6
91,2
4,4
11,3 14,4
8,8
60%
80%
100%
public-owned private-owned foreign-controlled total
Domestic External

Source: Bloomberg
UMP exit brought higher volatility
5,0
7,5
10,0
12,5
15,0
17,5
jan 1
3
fev 1
3
mar
13
abr
13
mai 13
jun
13
jul 1
3
ago
13
set
13
out 1
3
nov 1
3
dez 1
3
jan 1
4
BRL Volatility (3-Months At-the-money Implied)
Chairman BB May 22 Speech

But FX hedge program effect
30
2,1
2,15
2,2
2,25
2,3
2,35
2,4
2,45
2,5-6000
-5000
-4000
-3000
-2000
-1000
0
1000
2000
3000
USD millions
Swap Repo FX USD.BRL

Brazil: Resulting Differentials
31
-10
-5
0
5
10
SinceMay
22,2013
2 Weeks 2014
NEER (chg %) *
* Positive sign indicates appreciation of the country's currency / group.
-8-6-4-202468
10
Since May22,2013
2 Weeks 2014
USD/Currency (chg %) *

Brazil: Resulting Differentials
32
-40-30-20-10
010203040
Since May22,2013
2 Weeks 2014
CDS (chg bps)
-15
-10
-5
0
5
10
Since May22,2013
2 Weeks 2014
Equity (chg %)

Brazil: Reversal of Sentiment?
33
IOF on fixed income at 6% IOF on fixed income at 0% IOF on equities at 2% IOF on equities at 0%
-200
-100
0
100
200
300
400
500
Portfolio Investment - Net Flows (USD Millions)
Equities Bonds Other Flows
Monthly Avg.
USD Millions
Source: Central Bank of Brazil. Inflows from forex contracts.

Brazil: Policy Anticipation & Reaction
• We knew that reversal of market sentiment would eventually come and prepared ourselves, accumulated sizeable reserves to be used as buffers (alternative strategy: less reserves and more reliance on multilateral support like IMF-FCL)
• Preventive measures during upswing (MaPs for tightening excessive credit growth); keep strong capital, provisions & liquidity in our financial system, cautious reliance on external sources of funding
• Took early and sizeable action on Monetary Policy, complemented by Fiscal Policy
34

Brazil: Why Then Such Variance? Because there are legitimate albeit difficult analytical challenges everywhere and in particular in Brazil:
• Where is our NAIRU? Effects on wage bargaining process?
• Where is our Neutral interest rate? Down and MP more effective in an environment of less confidence
• How long would our J-Curve take? And then to affect domestic absorption and growth?
And in addition:
• Inflation headline hit by temporary supply shock, headline inflation impacts expectations, issue of persistence (see Roache, IMF (2014))
• Growth: confidence indicators in transition; supply policies (investment in infrastructure underway)
35

Skilled Wage Moderation?
36
Are we in the opposite symetric of the US case? Would it also affect unskilled wage cycles?
80
90
100
110
120
130
140
150
ago
02
fev 0
3
ago
03
fev 0
4
ago
04
fev 0
5
ago
05
fev 0
6
ago
06
fev 0
7
ago
07
fev 0
8
ago
08
fev 0
9
ago
09
fev 1
0
ago
10
fev 1
1
ago
11
fev 1
2
ago
12
fev 1
3
ago
13
fev 1
4
200
8 A
ve
rag
e+
10
0
Without formal education 1 to 3 years of schooling
4 to 7 years of schooling 8 to 11 years of schooling
Source: Ministry of Labor and Employment/CAGED.

Sources: BM&FBovespa / BCB
Real Actual Interest Rate %
an
nu
al
Apr 4th
4.9%
360-day market rate discounted by the IPCA expected for the next 12 months (Focus)
0
5
10
15
20
25abr
02
abr
03
abr
04
abr
05
ab
r 0
6
abr
07
abr
08
abr
09
abr
10
abr
11
ab
r 1
2
abr
13
abr
14

38
Neutral interest rate - literature review shows large variation
Source: The Neutral Interest Rate and the Stance of Monetary Policy in Brazil. Anpec 2013

39 Source: Nicolas E. Magud and Evridiki Tsounta. To Cut or Not to Cut? That is the (Central Bank’s) Question. IMF Working Paper. October 2012
Compared to our Region?

Brazil: Headline Inflation
• Inflation has been high and resistant, reflecting the elevated services inflation inertia and administrated prices realignment
• BCB has acted to secure the convergence of inflation to the target.
• MP effects on inflation are cumulative and take place with lags. In this sense, significant part of prices response to the tightening cycle is yet to materialize.
• At this moment, there are renewed external and domestic food price pressure, but in a much tighter monetary conditions environment
40

Sources: IBGE / FGV
% in 1
2 m
on
ths
3.22% IPP Nov 11
6.25% IPA-10 Nov 11
8.05% IPA-DI Mar 14
8.24% IPP Feb 14
0
2
4
6
8
10n
ov 1
1
jan 1
2
mar
12
mai 12
jul 1
2
set 12
nov 1
2
jan 1
3
mar
13
mai 13
jul 1
3
set 13
nov 1
3
jan 1
4
mar
14
IPP IPA (10, M and DI)
Producer Price Indexes

Sources: IBGE / Fipe / FGV
% in 1
2 m
onth
s
IPC-Fipe = 5.12% 1st/Apr 14
IPC-DI = 6.09% Mar 14
IPCA = 6.15% Mar 14
INPC = 5.62% Mar 14
3,5
4,0
4,5
5,0
5,5
6,0
6,5
7,0
7,5fe
v 1
2
abr
12
jun 1
2
ago
12
out 1
2
dez 1
2
fev 1
3
abr
13
jun 1
3
ago
13
out 1
3
dez 1
3
fev 1
4
abr
14
IPCA-15 and IPCA INPC IPC-Fipe IPC (10, M and DI)
Consumer Price Indexes

-3
0
3
6
9
12
15
18
21
24
27ja
n 0
1
jan 0
2
jan 0
3
jan 0
4
jan 0
5
jan 0
6
jan 0
7
jan 0
8
jan 0
9
jan 1
0
jan 1
1
jan 1
2
jan 1
3
jan 1
4
Variation (
%)
12 m
on
ths a
ccum
ula
ted
IPCA Alimentação e bebidas IPCA exceto Alimentação e bebidas
Source: IBGE
IPCA and Food Prices Component
5,47
Abr/2013
14,0
5,68
June/2008
15,8
May/2003
27,0
6,31
Food and Beverages IPCA ex-Food and Beverages

Headline Dependent Expectations?
44
y = 1,7299x + 0,0106 R² = 0,79
y = 3,0765x + 0,0661 R² = 0,50
y = 1,527x - 0,0011 R² = 0,81
-3,0
-2,0
-1,0
0,0
1,0
2,0
3,0
4,0
5,0
-1 -1 0 1 1
Ch
ange
in E
xpec
ted
An
nu
al IP
CA
an
ual
aft
er a
Su
rpri
se in
Mo
nth
ly IP
CA
(in
m+1
, v-
a-v
m-1
)
Surprise in monthly IPCA mensal (v-a-v expected IPCA of each period)
Change in Expected Annual IPCA anual after a Surprise in Monthly IPCA
m-1 m m-2
Source: BCB/DEPEC.

Sources: BCB / IBGE
Inflation – Convergence to Target %
yo
y
*Central Bank of Brazil Forecast (Inflation Report – Mar 14)
reference
scenario*
target (4.5%)
0
2
4
6
8
10m
ar
05
mar
06
mar
07
mar
08
mar
09
mar
10
mar
11
mar
12
mar
13
mar
14
mar
15
mar
16

46
J – Curve Lags, about one year?
Sources: MOURA, GUILHERME and SERGIO DA SILVA, (2005) "Is There a Brazilian J−Curve?", Economics Bulletin, Vol. 6, No. 10 pp. 1−17, July 2005. HSING, Y. “A Study of the J-Curve for Seven Selected Latin American Countries”, Global Economy Journal, 2008, 8(4). KALYONCU, H., OZTURK, I., ARTAN, S., KALYONCU, K. “Devaluation and trade balance in Latin American countries”, Zb. rad. Ekon. fak. Rij., 2009, vol. 27, sv.1, 115-128. ONAFOWORA, OLUGBENGA, (2003) "Exchange rate and trade balance in east asia: is there a J−curve?." Economics Bulletin, Vol. 5, No. 18 pp. 1−13, 2003. BAHMANI-OSKOOEE, M. and GOSWAMI, G. G. “A Disaggregated Approach to Test the J-Curve Phenomenon: Japan versus Her Major Trading Partners” Journal of Economics and Finance, Volume 27, Number 1, Spring 2003. AHMAD, J. AND YANG, J. “Estimation of the J-Curve In China”, East-West Center Working Papers”, Economic Series, nº 67, March 2004. HALICIOGLU, F. “The Bilateral J-curve: Turkey versus her 13 Trading Partners”, Munich Personal RePEc Archive Paper No. 3564, 15. June 2007. BAHMANI-OSKOOEE, M., GOSWAMI, G. G. and TALUKDAR, B. K. “The Bilateral J-Curve: Australia Versus her 23 Trading Partners”, Australian Economic Papers, Blackwell Publishing Ltd/University of Adelaide and Flinders University, June 2005 and Moodley, S. “An estimation of the J-Curve effect between South Africa and the BRIC countries”, University of Pretoria, nov. 2010.
No evidence / partial evidence (p)
N ot specify the lag
South Africa 1 Argentina 1 3,5 Austr a lia p
Chile 1 China 1 Colo mbia 1 Ec uador 1 Indon e sia 4 Japan p Malaysia 4 Me xico 1 Peru 1 4 T hailand 1 Tur key 1 Uruguay 4
Number of citations Lag (quarter s)

Source: Bloomberg
Ind
ex D
ec 0
7 =
100
Cumulative Real GDP Growth
Growth since the Global Financial Crisis
118.0 117.7
117.7
110.2
106.3
97.9
90
95
100
105
110
115
1204
Q 0
7
1Q
08
2Q
08
3Q
08
4Q
08
1Q
09
2Q
09
3Q
09
4Q
09
1Q
10
2Q
10
3Q
10
4Q
10
1Q
11
2Q
11
3Q
11
4Q
11
1Q
12
2Q
12
3Q
12
4Q
12
1Q
13
2Q
13
3Q
13
4Q
13
Poland Brazil South Korea Mexico US Euro Area

Source: UNCTAD
Brazil - Leading destination for FDI
197,9
114,7
85,7
82,7
50,6
48,6
48,5
46,9
43,3
42,8
40,8
35,2
32,5
30,6
29,2
0 50 100 150 200
US
China
Belgium
Hong Kong
UK
Singapore
Brazil
Germany
Russia
Ireland
Spain
Australia
Switzerland
France
Saudi Arabia
Thousands
2010
226,9
124,0
103,3
96,1
66,7
65,8
64,0
52,9
51,1
41,4
40,9
40,4
34,3
31,6
29,5
0 50 100 150 200
US
China
Belgium
Hong Kong
Brazil
Australia
Singapore
Russia
UK
Canada
France
Germany
Italy
India
Spain
Thousands
2011
146,7
119,7
72,5
65,3
62,5
58,9
54,4
48,5
47,2
44,1
39,6
27,3
26,4
22,6
19,3
0 50 100 150
US
China
Hong Kong
Brazil
UK
France
Singapore
Australia
Canada
Russia
Ireland
India
Chile
Luxembourg
Belgium
Thousands
2012

49
5%
7%
7%
7%
7%
10%
12%
17%
30%
33%
0 5 10 15 20 25 30 35
Mexico
Japan
Indonesia
Russia
India
UK
Brazil
Germany
US
China
%
Which 3 countries, excluding the country in which the CEO is based, do they consider most
important for their overall growth prospects over the next 12 months? *
Source: PwC 17th Annual Global CEO Survey *Base: 1,344 respondents
Global CEO Survey 2014: Key Countries

Model Rotation: GFCF / GDP (%)
50

Brazil: Prospects & Challenges • Brazilian economy is also passing through a transition,
with investment expansion and families’ consumption moderation.
• Brazil has been conducing a structural reform agenda to qualify work force, amplify investments and boost productivity, as well as improving business environment.
• Concerning investments, it is noteworthy the ample concessions program, which includes the transfer of airport, road, railroad and port management to private sector.
51

Brazil: Prospects & Challenges
• Brazilian economy faces a transition period pursuing new engines to growth: productivity gains and investment expansion. In 2014, economic activity should be somewhat lower than in 2013.
• Industry – recovery, but not very strong signs of support.
• Services – lower growth rates than previous years.
• Agribusiness – record harvest year after year, besides bad weather in 2014.
52

Brazil: Prospects & Challenges
• Investiment started to grow again in 2013 (~6% more than the ~2% for private consumption) – continuity will depend on confidence and tends to gain traction led by infrastructure projects and oil fields exploration.
• Reform agenda – more efficient allocation of production factors of the economy and productivity gains.
53

Thank You!
54