
JPMorgan Investment Funds Global Macro Opportunities … · FOR PROFESSIONAL CLIENTS / QUALIFIED...
45
FOR PROFESSIONAL CLIENTS / QUALIFIED INVESTORS ONLY – NOT FOR RETAIL USE OR DISTRIBUTION JPMorgan Investment Funds – Global Macro Opportunities Fund 2018
Transcript of JPMorgan Investment Funds Global Macro Opportunities … · FOR PROFESSIONAL CLIENTS / QUALIFIED...

FOR PROFESSIONAL CLIENTS / QUALIFIED INVESTORS ONLY – NOT FOR RETAIL USE OR DISTRIBUTION
JPMorgan Investment Funds – Global Macro Opportunities Fund
2018

1 | FOR PROFESSIONAL CLIENTS/QUALIFIED INVESTORS ONLY – NOT FOR RETAIL USE OR DISTRIBUTION
JPMorgan Investment Funds – Global Macro Opportunities Fund
Targets cash +7% annualised with <10% volatility over the medium term, gross of fees
Potential to deliver positive returns regardless of the market environment
Attractive risk/return
target over cash
Daily liquid,
transparent and
low cost
Luxembourg registered UCITS open-ended, daily liquid fund
Fees - C share class 0.60% AMC1, 0.15% O&A2, no performance fee
Seek to take advantage of the mispricing of macroeconomic trends using a focused and
flexible approach.
Proven macro
investment
approach
Dedicated macro managers and strategists determine most relevant macro themes
Macro managers select focused investment strategies
Risk-aware approach supported by fully integrated, proprietary system
The above target risk/return are the investment manager’s internal guidelines to achieve the Fund’s investment
objective and policy as stated in the prospectus. There is no guarantee that these objectives will be met.1Annual Management and Advisory fee. 2Operating and Administrative expenses.

2 | FOR PROFESSIONAL CLIENTS/QUALIFIED INVESTORS ONLY – NOT FOR RETAIL USE OR DISTRIBUTION
A difficult environment for traditional investors
Based on our long-term asset class expectations investors will have to take more risk for less return going forward
As monetary policy normalises, volatility is likely to pick up and investors will be more reliant on funds that can deliver attractive
returns regardless of the market environment
5.1%
8.9% 8.7%
7.3%
3.6%
0%
1%
2%
3%
4%
5%
6%
7%
8%
9%
10%
Since Euro introduction Post-GFC Last five years Last three years The next 10 years?
Investors will have to take more risk for less return going forward, 50/50 allocation returns, % annualised in EUR
Source: J.P. Morgan Asset Management, Bloomberg. Expectations are based on our Long-Term Capital Market Assumptions (LTCMA) for the relevant years. 50% MSCI World Index and 50%
JPMorgan Global GBI Index, both hedged to EUR. Data as at 30 November 2017 (updated annually). Opinions, estimates, forecasts, projections and statements of financial market trends are based on
market conditions at the date of the publication, constitute our judgment and are subject to change without notice. There can be no guarantee they will be met.
Past performance and forecasts are not reliable indicators of current and future results.
3 | FOR PROFESSIONAL CLIENTS/QUALIFIED INVESTORS ONLY – NOT FOR RETAIL USE OR DISTRIBUTION
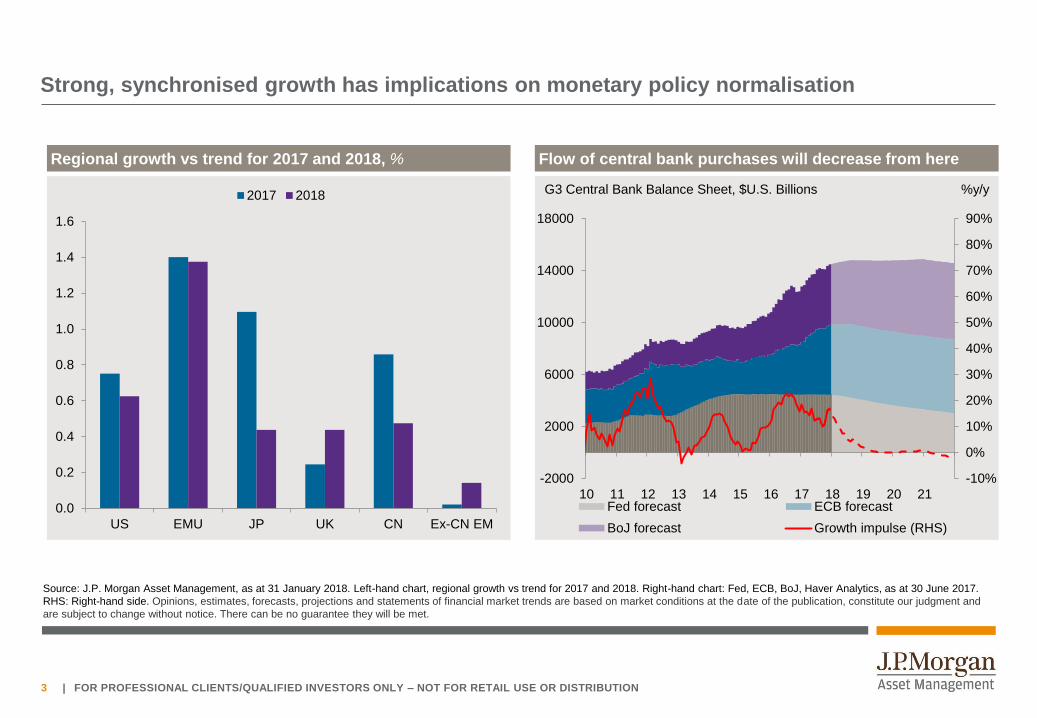
Strong, synchronised growth has implications on monetary policy normalisation
-10%
0%
10%
20%
30%
40%
50%
60%
70%
80%
90%
-2000
2000
6000
10000
14000
18000
10 11 12 13 14 15 16 17 18 19 20 21Fed forecast ECB forecast
BoJ forecast Growth impulse (RHS)
G3 Central Bank Balance Sheet, $U.S. Billions %y/y
0.0
0.2
0.4
0.6
0.8
1.0
1.2
1.4
1.6
US EMU JP UK CN Ex-CN EM
2017 2018
Regional growth vs trend for 2017 and 2018, % Flow of central bank purchases will decrease from here
Source: J.P. Morgan Asset Management, as at 31 January 2018. Left-hand chart, regional growth vs trend for 2017 and 2018. Right-hand chart: Fed, ECB, BoJ, Haver Analytics, as at 30 June 2017.
RHS: Right-hand side. Opinions, estimates, forecasts, projections and statements of financial market trends are based on market conditions at the date of the publication, constitute our judgment and
are subject to change without notice. There can be no guarantee they will be met.

4 | FOR PROFESSIONAL CLIENTS / QUALIFIED INVESTORS ONLY – NOT FOR RETAIL USE OR DISTRIBUTION
JPMorgan Investment Funds – Global Macro Opportunities Fund uses in a client portfolio
2. Global hedge fund allocation
Daily liquidity can improve profile of alternatives allocation
Lower cost than traditional macro hedge funds
Transparent and clear reporting of portfolio holdings
1. Complement to traditional assets
Unconstrained by an asset-based benchmark
Not solely reliant on rising markets to generate return
Focused implementation can boost return potential
Adding Global Macro Opportunities Fund to a 50% equity
/50% bond allocation can improve risk-adjusted returns
7%
8%
9%
4% 5% 6% 7% 8%
40% = 1.61 Sharpe ratio
30% = 1.59 Sharpe ratio
20% = 1.53 Sharpe ratio10% = 1.42 Sharpe ratio
Re
turn
Risk
Source: J.P. Morgan Asset Management, as at 31 December 2017. Opinions, estimates, forecasts, projections and statements of financial market trends are based on market conditions at the date of
the publication, constitute our judgment and are subject to change without notice. There can be no guarantee they will be met. Annualised return of traditional 50/50 equity/bond portfolio 15 February
2013 to 31 December 2017, represented by 50% MSCI World Index Daily Net Total Return (EUR hedged) and 50% J.P. Morgan Global Government Bond Index (EUR hedged) using weekly returns
with net income reinvested. The indices do not include fees or operating expenses and are not available for actual investment. The index returns are calculated using the weighted market value returns
for the underlying securities, as determined by the index calculation methodology. Performance returns are weekly and shown based on the quoted price of the Global Macro Opportunities Fund using
the C (acc) share class in EUR. All calculations are net of any applicable charges and taxes incurred by the Fund, but gross of any entry/exit fees or taxes charged to the shareholders. Volatility is the
annualised standard deviation using weekly returns. Past performance is not a reliable indicator of current and future results. The portfolio risk
management process includes an effort to monitor and manage risk, but does not imply low risk.

5 | FOR PROFESSIONAL CLIENTS / QUALIFIED INVESTORS ONLY – NOT FOR RETAIL USE OR DISTRIBUTION
-3%
-2%
-1%
0%
1%
2%
3%
Equity down
(19 months)
Fixed income down
(28 months)
50/50 balancedportfolio down(18 months)
Equity up
(47 months)
Fixed income up
(38 months)
50/50 balancedportfolio up(48 months)
Retu
rn
Fund average return
Market indices average return
Delivering positive returns in varying market environments
Average monthly fund returns (net of C share class fees) vs. average performance of equity and fixed income
DOWN
MARKETS
UP
MARKETS
Source: J.P. Morgan Asset Management. Fund performance is shown based on the NAV of the share class C in EUR with income (gross) reinvested including actual ongoing charges excluding any
entry and exit fees. Indices do not include fees or operating expenses. Indices used: for equity, MSCI World Index Daily Net Total Return hedged to EUR; and for fixed income, JPM Global Government
Bond Index hedged EUR. Indices do not include fees or operating expenses. Past performance is not a reliable indicator of current and future results.
JPMorgan Investment Funds – Global Macro Opportunities Fund from 30 November 2012 to 31 May 2018

6 | FOR PROFESSIONAL CLIENTS / QUALIFIED INVESTORS ONLY – NOT FOR RETAIL USE OR DISTRIBUTION
Dedicated global macro investment team and broad research resources
Multi-Asset Solutions research platform
9 qualitative strategists 8 quantitative analysts
Source: J.P. Morgan Asset Management, as at 31 May 2018. First number represent years of industry experience, second number represents years at the firm.
James Elliot, 22/21
Lead portfolio manager
Shrenick Shah, 15/7
Lead portfolio manager
Global macro investment team, years in industry/years at JPMAM
Joshua Berelowitz, 6/6 Benoit Lanctot, 12/6 Rose Thomas, 3/3 Lucy Reid, 2/2

7 | FOR PROFESSIONAL CLIENTS/QUALIFIED INVESTORS ONLY – NOT FOR RETAIL USE OR DISTRIBUTION
An investment process founded in macroeconomic research
Less than 10% volatility*8 macro themes 20-40 strategies
Generate macro themes
Establish and maintain set of themes
that encompasses structural and
cyclical trends in the global
macroeconomic environment
Select investment strategies
Seek mix of focused strategies.
Criteria for selection:
1. Reflect at least one macro theme
2. Offer positive return potential
3. Desired impact on portfolio
Risk management
Fully integrated, real-time risk
analysis informs decision making and
ensures continued robustness
*annualised over the medium term.
The portfolio risk management process includes an effort to monitor and manage risk, but does not imply low risk.
8 | FOR PROFESSIONAL CLIENTS/QUALIFIED INVESTORS ONLY – NOT FOR RETAIL USE OR DISTRIBUTION
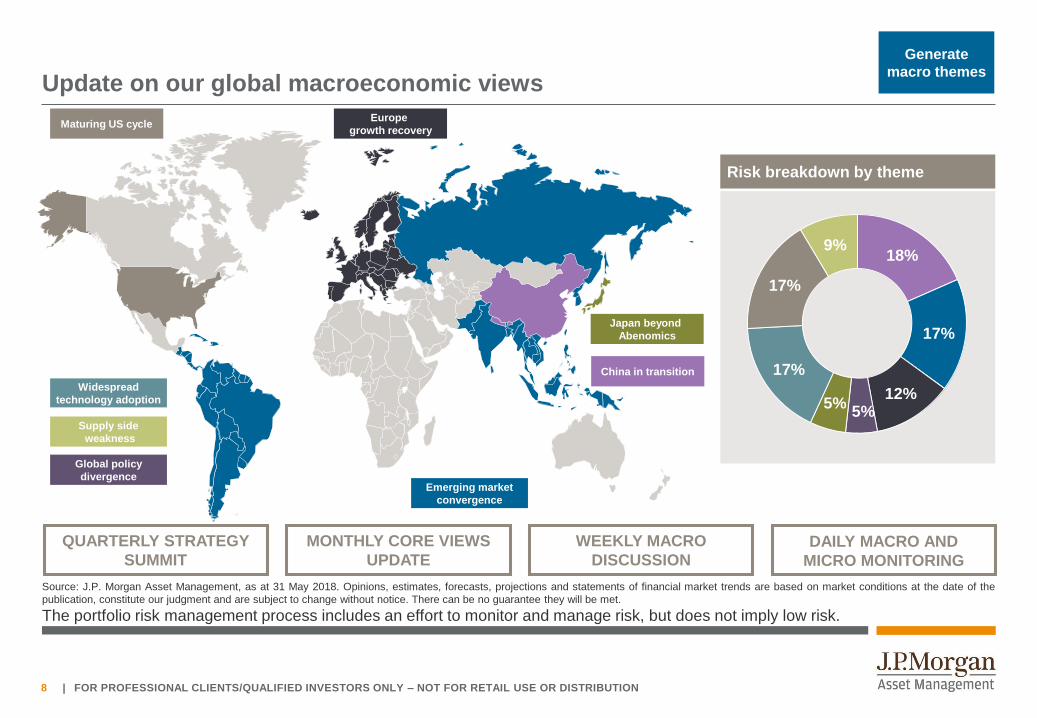
Update on our global macroeconomic views
Global policy
divergence
Maturing US cycle
Japan beyond
Abenomics
Europe
growth recovery
China in transition
Emerging market
convergence
Supply side
weakness
18%
17%
12%5%
5%
17%
17%
9%
Risk breakdown by theme
Generate
macro themes
DAILY MACRO AND
MICRO MONITORING
WEEKLY MACRO
DISCUSSION
MONTHLY CORE VIEWS
UPDATE
QUARTERLY STRATEGY
SUMMIT
Widespread
technology adoption
Source: J.P. Morgan Asset Management, as at 31 May 2018. Opinions, estimates, forecasts, projections and statements of financial market trends are based on market conditions at the date of the
publication, constitute our judgment and are subject to change without notice. There can be no guarantee they will be met.
The portfolio risk management process includes an effort to monitor and manage risk, but does not imply low risk.

9 | FOR PROFESSIONAL CLIENTS/QUALIFIED INVESTORS ONLY – NOT FOR RETAIL USE OR DISTRIBUTION
Select a mix of complementary strategies
Select
investment
strategies
Sophisticated strategiesTraditional strategies
Long physical equity (focused baskets of stocks)
Long fixed income
Equity long, short or relative value
Fixed income short or relative value
Currency
Equity derivatives
Volatility
Each strategy must be driven by a macro theme, be attractively valued, have favourable market dynamics and
provide the desired impact on portfolio exposure and risk
Use in portfolio:
Deliver market beta-linked returns
Provide interest-rate exposure Use in portfolio:
Provide exposure to long/short market beta
and idiosyncratic risk premia
Can offer protection from adverse scenarios
Traditional strategy examples
Equity - consumer staples
Equity - financials
Equity - health care
Equity - industrials
Equity - information technology
Equity - utilities
Fixed income - US 10-year Treasuries
Sophisticated strategy examples
Equity - long China (via H shares index futures)
Equity - short US consumer staples
Equity - long EU basic resources vs short UK
Fixed income - short German 30-year Bunds
Currency - long Australian dollar vs short US dollar
Equity - Long EU puts
Volatility - long US volatility (via VIX index futures)
Traditional and sophisticated investment strategies in a risk-aware framework.
10 | FOR PROFESSIONAL CLIENTS/QUALIFIED INVESTORS ONLY – NOT FOR RETAIL USE OR DISTRIBUTION
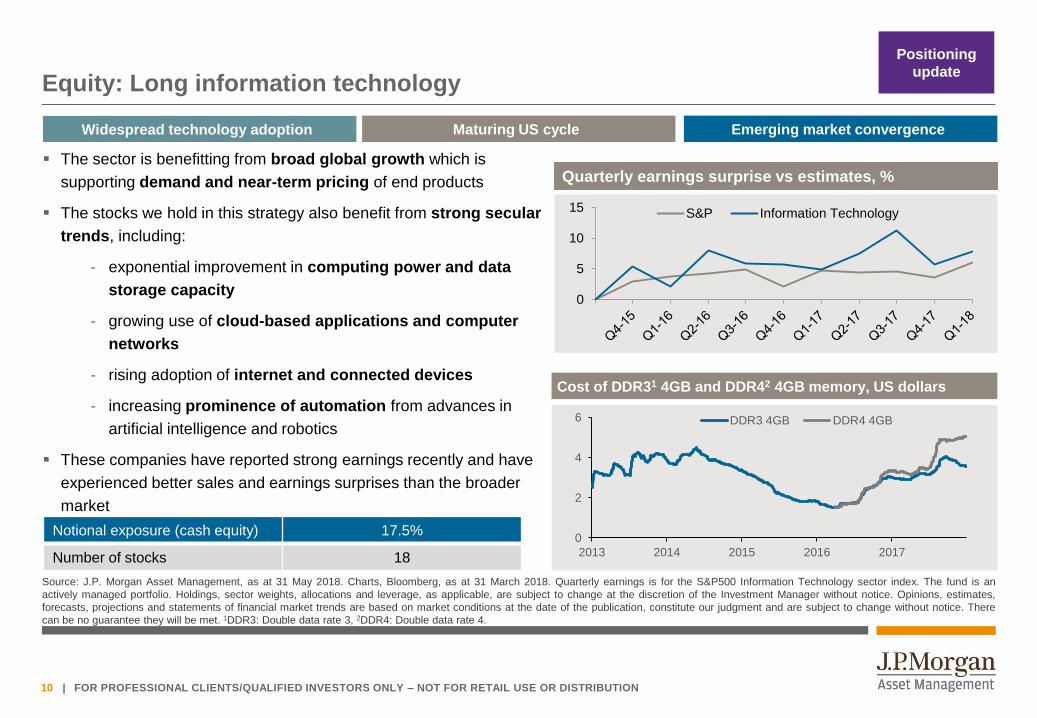
Equity: Long information technology
The sector is benefitting from broad global growth which is
supporting demand and near-term pricing of end products
The stocks we hold in this strategy also benefit from strong secular
trends, including:
- exponential improvement in computing power and data
storage capacity
- growing use of cloud-based applications and computer
networks
- rising adoption of internet and connected devices
- increasing prominence of automation from advances in
artificial intelligence and robotics
These companies have reported strong earnings recently and have
experienced better sales and earnings surprises than the broader
market
Cost of DDR31 4GB and DDR42 4GB memory, US dollars
Widespread technology adoption Maturing US cycle
Notional exposure (cash equity) 17.5%
Number of stocks 18
Quarterly earnings surprise vs estimates, %
Emerging market convergence
Source: J.P. Morgan Asset Management, as at 31 May 2018. Charts, Bloomberg, as at 31 March 2018. Quarterly earnings is for the S&P500 Information Technology sector index. The fund is an
actively managed portfolio. Holdings, sector weights, allocations and leverage, as applicable, are subject to change at the discretion of the Investment Manager without notice. Opinions, estimates,
forecasts, projections and statements of financial market trends are based on market conditions at the date of the publication, constitute our judgment and are subject to change without notice. There
can be no guarantee they will be met. 1DDR3: Double data rate 3, 2DDR4: Double data rate 4.
0
2
4
6
2013 2014 2015 2016 2017
DDR3 4GB DDR4 4GB
Positioning
update
0
5
10
15 S&P Information Technology

11 | FOR PROFESSIONAL CLIENTS/QUALIFIED INVESTORS ONLY – NOT FOR RETAIL USE OR DISTRIBUTION
Chinese bank valuations are low given their profitability
Equity: Long financials
Emerging market convergence
Positioning
update
China in transition
JapanSouth Korea
Taiwan Singapore
Malaysia
Philippines
Thailand
India
Indonesia
Australia
China
Hong Kong
0.5
1
1.5
2
2.5
3
3.5
6 8 10 12 14 16 18
Price-t
o-b
ook (
last
report
ed)
Average of 2017 & 2018 RoE
Maturing US cycle
Notional exposure (cash equity) 11.9%
Number of stocks 13
Banks’ CCAR1 payout ratios are rising
56%
84%
101%
2015 2016 2017
China: Banks should benefit from a stable domestic growth
environment and a focus from the authorities on financial stability.
There is scope for re-rating as markets price in a lower probability of
a sharp growth slowdown
US: Banks are likely to benefit from continued strong growth, a
positive impulse from the tax reform package and gradual monetary
policy tightening. Potential for an increasingly favourable regulatory
environment and improving capital return are a further support
Emerging markets: Singapore banks are well placed to benefit from
global cyclical momentum, along with rising US rates, while insurance
companies with significant exposure in the region are seeing strong
structural growth driven by demographics and low penetration rates
Source: J.P. Morgan Asset Management, as at 31 May 2018. Charts, Bloomberg, as at 30 September 2017. The fund is an actively managed portfolio. Holdings, sector weights, allocations and
leverage, as applicable, are subject to change at the discretion of the Investment Manager without notice. Opinions, estimates, forecasts, projections and statements of financial market trends are based
on market conditions at the date of the publication, constitute our judgment and are subject to change without notice. There can be no guarantee they will be met. 1Comprehensive Capital Analysis and
Review.
12 | FOR PROFESSIONAL CLIENTS/QUALIFIED INVESTORS ONLY – NOT FOR RETAIL USE OR DISTRIBUTION
Portfolio positioning
Source: J.P. Morgan Asset Management, as at 31 May 2018. The fund is an actively managed portfolio. Holdings, sector weights, allocations and leverage, as applicable, are subject to change at the
discretion of the Investment Manager without notice. Duration excludes inflation and credit default swaps. Currency breakdown accounts for all active currency strategies. *Global Industry
Classification Standards®. Equity derivatives is the delta from futures and options broken down into the sectors from which the derivative is derived. Equity includes ETFs.
Positioning
update
Active currency positionsDuration, yearsGICS* Sector breakdown
Total duration now 0.5 years
-20% -10% 0% 10%
USD
JPY
KRW
BRL
SEK
MXN
INR
AUD
EUR
Equity exposure (delta)
Total equity delta now 30.7%
-20% 0% 20%
Europe ex-UK
UK
Emerging market
Japan
North America
Asia ex-Japan
The portfolio risk management process includes an effort to monitor and manage risk, but does not imply low risk.
-2 -1 0 1 2
Europe ex-UK
UK
Emerging market
Japan
North America
Asia ex-Japan
-10% 0% 10% 20%
Utilities
Telecommunication services
Real estate
Materials
Information technology
Industrials
Health care
Financials
Energy
Consumer staples
Consumer discretionary
Axis Title
Equity
Equity derivatives
Total-50% 0% 50% 100%

13 | FOR PROFESSIONAL CLIENTS/QUALIFIED INVESTORS ONLY – NOT FOR RETAIL USE OR DISTRIBUTION
Historical equity delta exposure (using 3 month moving averages)
Asia ex-Japan & Emerging Market North America
Europe & UK Japan
-40%
-30%
-20%
-10%
0%
10%
20%
30%
40%
-20%
-10%
0%
10%
20%
30%
40%
0%
5%
10%
15%
20%
25%
30%
35%
-5%
0%
5%
10%
15%
20%
25%
Positioning
update
Source: J.P. Morgan Asset Management, as at 31 May 2018. Time series calculated using a 3 month moving average. In November 2012 the internal investment process and team changed with no
impact on Fund investment policy and objective. The fund is an actively managed portfolio. Holdings, sector weights, allocations and leverage, as applicable are subject to change at the discretion of the
Investment Manager without notice. The portfolio risk management process includes an effort to monitor and manage risk, but does not imply low risk.
14 | FOR PROFESSIONAL CLIENTS/QUALIFIED INVESTORS ONLY – NOT FOR RETAIL USE OR DISTRIBUTION
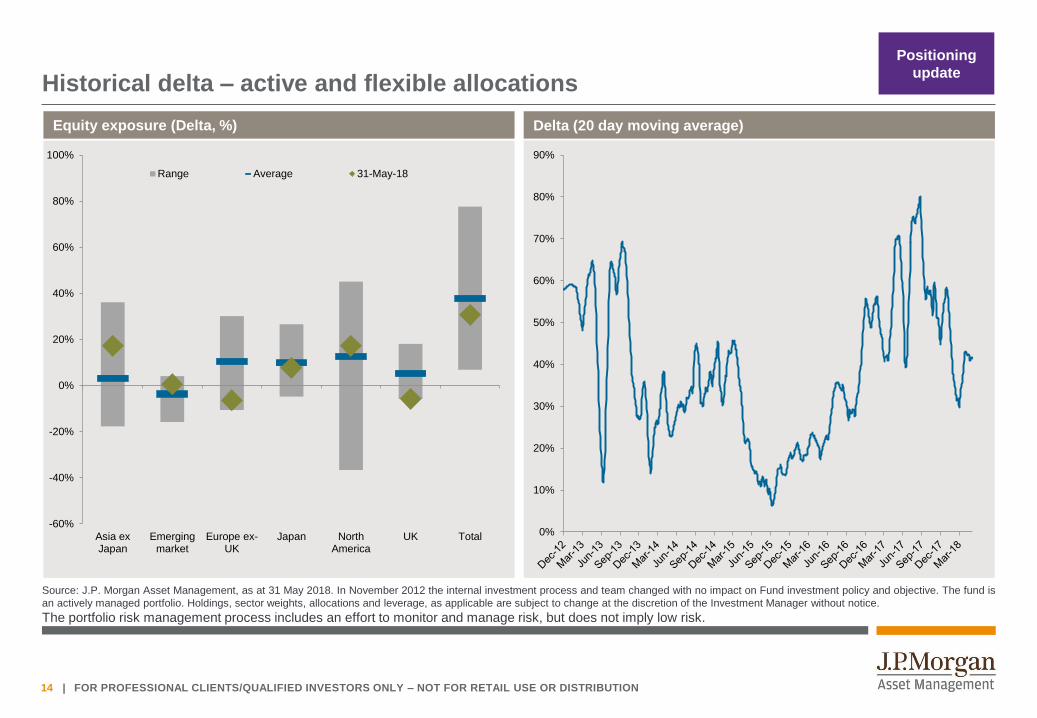
Historical delta – active and flexible allocations
Equity exposure (Delta, %)
-60%
-40%
-20%
0%
20%
40%
60%
80%
100%
Asia exJapan
Emergingmarket
Europe ex-UK
Japan NorthAmerica
UK Total
Range Average 31-May-18
Delta (20 day moving average)
0%
10%
20%
30%
40%
50%
60%
70%
80%
90%
Positioning
update
Source: J.P. Morgan Asset Management, as at 31 May 2018. In November 2012 the internal investment process and team changed with no impact on Fund investment policy and objective. The fund is
an actively managed portfolio. Holdings, sector weights, allocations and leverage, as applicable are subject to change at the discretion of the Investment Manager without notice.
The portfolio risk management process includes an effort to monitor and manage risk, but does not imply low risk.

15 | FOR PROFESSIONAL CLIENTS/QUALIFIED INVESTORS ONLY – NOT FOR RETAIL USE OR DISTRIBUTION
Historical duration – active and flexible allocations
Duration (20 day moving average)
-3
-2
-1
0
1
2
3
4
5
6
7
Duration (years)
-4
-2
0
2
4
6
8
Asia exJapan
Emergingmarket
Europe ex-UK
Japan NorthAmerica
UK Total
Range Average 31-May-18
Positioning
update
Source: J.P. Morgan Asset Management, as at 31 May 2018. In November 2012 the internal investment process and team changed with no impact on Fund investment policy and objective. The fund is
an actively managed portfolio. Holdings, sector weights, allocations and leverage, as applicable are subject to change at the discretion of the Investment Manager without notice. Duration excludes
inflation and credit default swaps. The portfolio risk management process includes an effort to monitor and manage risk, but does not imply low risk.

16 | FOR PROFESSIONAL CLIENTS/QUALIFIED INVESTORS ONLY – NOT FOR RETAIL USE OR DISTRIBUTION
Multi-dimensional risk analysis
Source: J.P. Morgan Asset Management, as at 31 May 2018. The fund is an actively managed portfolio, holdings, sector weights, allocations and leverage, as applicable are subject to change at
the discretion of the Investment Manager without notice. In November 2012 the internal investment process and team changed with no impact on Fund investment policy and objective.
By macro theme Current breakdown
Risk
management
18%
17%
12%
5%5%
17%
17%
9%
0%
20%
40%
60%
80%
100% Widespread technology adoption
US economic strength
Maturing US cycle
Europe growth recovery
Europe gradual growth recovery
Low growth Europe
Supply side weakness
Japan beyond Abenomics
Japan economic recovery
Global policy divergence
Emerging market rebalancing
Emerging market convergence
China in transition
Low inflation
By asset class Current breakdown
0%
20%
40%
60%
80%
100%
Equity
Fixed income
Currency
Advanced derivatives74%
3%
11%
12%
The portfolio risk management process includes an effort to monitor and manage risk, but does not imply low risk.

17 | FOR PROFESSIONAL CLIENTS/QUALIFIED INVESTORS ONLY – NOT FOR RETAIL USE OR DISTRIBUTION
Fund exposure
0%
2%
4%
6%
8%
10%
12%
14%
Realised volatility (rolling 3 year)Ex-ante volatility
Source: J.P. Morgan Asset Management, as at 31 May 2018. Ex-ante volatility is calculated with a 2-year look back and a 6 month half life (prior to 31st January 2018 a 3 month half life was
used). Realised volatility uses monthly 3 year rolling volatility
Risk
management
Total standalone volatility Total nominal gross exposure
0%
100%
200%
300%
400%
500%
0%
5%
10%
15%
20%
25%
30%
0%
1%
2%
3%
4%
5%
6%
7%
8%
9%
10%
The portfolio risk management process includes an effort to monitor and manage risk, but does not imply low risk.

18 | FOR PROFESSIONAL CLIENTS/QUALIFIED INVESTORS ONLY – NOT FOR RETAIL USE OR DISTRIBUTION
Summary
JPMorgan Investment Funds – Global Macro Opportunities Fund as at 31 May 2018
Expertise
Experienced team of macro investors and strategists
Dedicated macro investment team of six with two lead managers
Nine strategists and economists support macro-thematic research
Fully integrated, proprietary portfolio management system provides detailed analysis
Portfolio
Research-oriented and focused approach with risk-aware implementation
Fundamental macro views lead to selection of a focused set of strategies to build robust portfolio
Targets cash +7% annualised with <10% volatility over the medium term, gross of fees
Fees - C share class 0.60% AMC1, 0.15% O&A2, no performance fee
Success
Attractive risk-adjusted returns over the medium term through varying market environments
9.3% annualised return since people and process change in November 2012 (net of C share class fees)
Positive returns regardless of the market environment since inception
The above target risk/return are the investment manager’s internal guidelines to achieve the Fund’s investment objective and policy as stated in the
prospectus. There is no guarantee that these objectives will be met. Past performance is not a reliable indicator of current and future results.1Annual Management and Advisory fee. 2Operating and Administrative expenses.
19 | FOR PROFESSIONAL CLIENTS / QUALIFIED INVESTORS ONLY – NOT FOR RETAIL USE OR DISTRIBUTION
Performance analysis
20 | FOR PROFESSIONAL CLIENTS/QUALIFIED INVESTORS ONLY | NOT FOR PUBLIC DISTRIBUTION
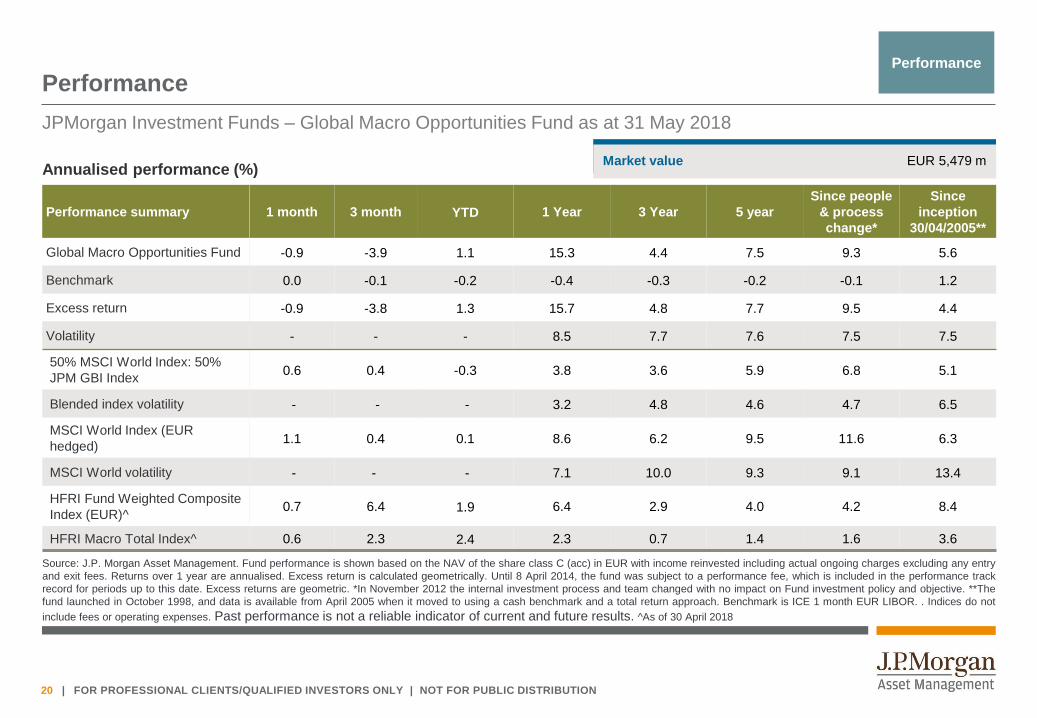
Market value EUR 5,479 m
Performance
Source: J.P. Morgan Asset Management. Fund performance is shown based on the NAV of the share class C (acc) in EUR with income reinvested including actual ongoing charges excluding any entry
and exit fees. Returns over 1 year are annualised. Excess return is calculated geometrically. Until 8 April 2014, the fund was subject to a performance fee, which is included in the performance track
record for periods up to this date. Excess returns are geometric. *In November 2012 the internal investment process and team changed with no impact on Fund investment policy and objective. **The
fund launched in October 1998, and data is available from April 2005 when it moved to using a cash benchmark and a total return approach. Benchmark is ICE 1 month EUR LIBOR. . Indices do not
include fees or operating expenses. Past performance is not a reliable indicator of current and future results. ^As of 30 April 2018
JPMorgan Investment Funds – Global Macro Opportunities Fund as at 31 May 2018
Annualised performance (%)
Performance summary 1 month 3 month YTD 1 Year 3 Year 5 year
Since people
& process
change*
Since
inception
30/04/2005**
Global Macro Opportunities Fund -0.9 -3.9 1.1 15.3 4.4 7.5 9.3 5.6
Benchmark 0.0 -0.1 -0.2 -0.4 -0.3 -0.2 -0.1 1.2
Excess return -0.9 -3.8 1.3 15.7 4.8 7.7 9.5 4.4
Volatility - - - 8.5 7.7 7.6 7.5 7.5
50% MSCI World Index: 50%
JPM GBI Index0.6 0.4 -0.3 3.8 3.6 5.9 6.8 5.1
Blended index volatility - - - 3.2 4.8 4.6 4.7 6.5
MSCI World Index (EUR
hedged)1.1 0.4 0.1 8.6 6.2 9.5 11.6 6.3
MSCI World volatility - - - 7.1 10.0 9.3 9.1 13.4
HFRI Fund Weighted Composite
Index (EUR)^0.7 6.4 1.9 6.4 2.9 4.0 4.2 8.4
HFRI Macro Total Index^ 0.6 2.3 2.4 2.3 0.7 1.4 1.6 3.6
Performance

21 | FOR PROFESSIONAL CLIENTS/QUALIFIED INVESTORS ONLY | NOT FOR PUBLIC DISTRIBUTION
Performance
JPMorgan Investment Funds – Global Macro Opportunities Fund
Performance
Calendar year performance (%)
2006 2007 2008 2009 2010 2011 2012 2013 2014 2015 2016 2017
Global Macro Opportunities Fund 7.7 4.0 -16.0 14.2 9.8 -5.1 2.7 16.3 13.8 10.4 -4.8 15.2
Benchmark 3.0 4.2 4.4 0.9 0.5 1.3 0.4 0.1 0.1 -0.1 -0.3 -0.4
Excess return 4.6 -0.2 -19.5 13.2 9.2 -6.3 2.3 16.2 13.6 10.5 -4.5 15.7
Source: J.P. Morgan Asset Management. Fund performance is shown based on the NAV of the share class C (acc) in EUR with income reinvested including actual ongoing charges excluding any entry
and exit fees. Until 8 April 2014, the fund was subject to a performance fee, which is included in the performance track record for periods up to this date. Excess returns are geometric. Benchmark is ICE
1 month EUR LIBOR. Indices do not include fees or operating expenses. Excess return is calculated geometrically. Past performance is not a reliable indicator of current and future
results.

22 | FOR PROFESSIONAL CLIENTS/QUALIFIED INVESTORS ONLY | NOT FOR PUBLIC DISTRIBUTION
Fund correlation to different assets
Source: J.P. Morgan Asset Management, as at 31 May 2018. Fund = JPMorgan Investment Funds – Global Macro Opportunities Fund. Fund correlation is based on the NAV of the share class C in
EUR with income (gross) reinvested including actual ongoing charges excluding any entry and exit fees. Correlation data computed using weekly returns, Friday to Friday. Indices used: 50% MSCI
World Index:50% JPM GBI Index. *Since process change 30 November 2012. In November 2012 the internal investment process and team changed with no impact on Fund investment policy and
objective. Past performance is not a reliable indicator of current and future results.
Performance
1 year to 31 May
20182017 2016 2015 2013-2014
Since process
change*
50/50 balanced fund 39% 17% -5% -15% 55% 24%
Developed market equity 44% 37% -18% -25% 57% 23%
Emerging market equity 58% 34% -27% -47% 0% -3%
Global sovereign bonds -26% -38% 45% 33% -12% 3%
US corporate bonds (HY) 32% -1% -21% -21% 13% -2%
US 10 year inflation (implied) 16% 15% -48% -40% 1% -16%
JPM trade-weighted USD index 0% 35% 17% 44% 29% 25%
Gold -5% -3% 21% -11% -23% -13%
Oil 12% -38% -31% -28% -14% -15%
US Cyclicals vs. defensives 53% 44% -59% -22% 15% 3%

23 | FOR PROFESSIONAL CLIENTS/QUALIFIED INVESTORS ONLY | NOT FOR PUBLIC DISTRIBUTION
Fund performance relative to equity and bond performancePerformance
Source: J.P. Morgan Asset Management, Bloomberg, as at 31 May 2018. Fund = JPMorgan Investment Funds – Global Macro Opportunities Fund. Fund performance is shown based on the NAV of the
share class C in EUR with income (gross) reinvested including actual ongoing charges excluding any entry and exit fees. Until 8 April 2014, the fund was subject to a performance fee, which is included in
the performance track record for periods up to this date. In November 2012 the internal investment process and team changed with no impact on Fund investment policy and objective. Maximum
drawdown calculated using monthly data. Indices are total return indices: 50% MSCI World Index and 50% JPM GBI Index (hedged to EUR). Indices do not include fees or operating expenses.
2013 Jan Feb Mar Apr May Jun Jul Aug Sep Oct Nov Dec 2013
Fund 3.66% 1.96% 1.61% 2.47% 2.53% -1.75% -0.16% -2.41% 1.73% 1.90% 2.52% 1.32% 16.29%
MSCI World 5.15% 1.50% 2.68% 2.69% 1.41% -2.44% 4.63% -2.09% 3.67% 3.92% 2.14% 2.05% 28.07%
JPM GBI -0.58% 0.62% 0.70% 1.03% -1.70% -1.11% 0.25% -0.30% 0.68% 0.84% -0.12% -0.77% -0.49%
50:50 Balanced 2.28% 1.06% 1.69% 1.86% -0.14% -1.78% 2.44% -1.19% 2.18% 2.38% 1.01% 0.64% 13.03%
2014 Jan Feb Mar Apr May Jun Jul Aug Sep Oct Nov Dec 2014
Fund 1.53% 0.28% -1.53% -0.83% -0.29% 1.66% -0.79% 1.83% 4.09% -0.76% 3.96% 4.04% 13.75%
MSCI World -3.31% 4.15% 0.19% 0.72% 2.28% 1.37% -0.81% 2.64% -1.05% 1.12% 2.83% -0.81% 9.48%
JPM GBI 1.68% 0.38% 0.09% 0.64% 0.88% 0.31% 0.34% 1.39% -0.29% 0.74% 1.18% 0.84% 8.47%
50:50 Balanced -0.82% 2.27% 0.14% 0.68% 1.58% 0.84% -0.24% 2.02% -0.67% 0.93% 2.00% 0.02% 9.04%
2015 Jan Feb Mar Apr May Jun Jul Aug Sep Oct Nov Dec 2015
Fund 3.46% 1.42% 4.56% -2.72% 0.80% -0.07% 2.35% 4.26% -1.00% -2.50% -1.10% 0.83% 10.43%
MSCI World -0.73% 5.89% -0.49% 1.01% 1.25% -2.96% 2.48% -6.62% -3.60% 7.93% 0.63% -2.17% 1.75%
JPM GBI 2.37% -1.02% 0.80% -0.80% -0.64% -1.32% 1.26% -0.23% 0.91% 0.07% 0.00% -0.29% 1.05%
50:50 Balanced 0.82% 2.44% 0.16% 0.10% 0.31% -2.14% 1.87% -3.43% -1.35% 4.00% 0.31% -1.23% 1.65%
2016 Jan Feb Mar Apr May Jun Jul Aug Sep Oct Nov Dec 2016
Fund 2.53% 0.65% -2.57% -1.12% 0.79% 1.86% -0.05% -3.12% -0.32% -1.60% -3.47% 1.72% -4.81%
MSCI World -5.46% -1.59 5.04% 0.78% 1.73% -1.45% 4.01% 0.33% 0.10% -0.79% 2.61% 2.65% 7.79%
JPM GBI 2.06% 1.22 0.36% -0.26% 0.51% 2.38% 0.25% -0.46% -0.22% -1.57% -1.98% 0.03% 2.25%
50:50 Balanced -1.70% -0.19 2.70% 0.26% 1.12% 0.46% 2.13% -0.06% -0.06% -1.18% 0.31% 1.34% 5.18%
2017 Jan Feb Mar Apr May Jun Jul Aug Sep Oct Nov Dec 2017
Fund -1.87% -1.78% 2.24% 0.41% 2.15% 1.71% 3.24% 1.16% 3.41% 5.15% -1.39% 0.07% 15.20%
MSCI World 1.15% 3.07% 0.86% 1.05% 1.34% -0.11% 1.28% 0.02% 2.21% 2.46% 1.41% 0.94% 16.80%
JPM GBI -0.83% 0.80% -0.25% 0.55% 0.38% -0.53% 0.05% 0.90% -0.88% 0.27% 0.09% -0.12% 0.40%
50:50 Balanced 0.16% 1.93% 0.30% 0.80% 0.86% -0.32% 0.66% 0.46% 0.67% 1.36% 0.75% 0.41% 8.33%
2018 Jan Feb Mar Apr May Jun Jul Aug Sep Oct Nov Dec 2018
Fund 3.86% 1.35% -3.35% 0.34% -0.93% 1.13%
MSCI World 3.53% -3.72% -2.47% 1.80% 1.13% 0.09%
JPM GBI -0.95% -0.23% 0.99% -0.65% 0.10% -0.75%
50:50 Balanced 1.29% -1.97% -0.74% 0.58% 0.61% -0.27%
Past performance is not a reliable indicator of current and future results

24 | FOR PROFESSIONAL CLIENTS/QUALIFIED INVESTORS ONLY | NOT FOR PUBLIC DISTRIBUTION
-5% 0% 5% 10% 15%
Advanced derivativesCurrency
Fixed incomeEquity futures
Total cash equity
Contribution by asset class as at 31 May 2018Performance
1 yearYear-to-date
From process change (November 2012, annualised)3 years (annualised)
-4% -2% 0% 2% 4%
Advanced derivativesCurrency
Fixed incomeEquity futures
Total cash equityAsia
Emerging markets
Europe
Japan
UK
US
-2% 0% 2% 4% 6% 8%
Advanced derivativesCurrency
Fixed incomeEquity futures
Total cash equity
Source: J.P. Morgan Asset Management. Contributions based on gross of fee returns, and may not match the official returns due to differences in system rounding.
Past performance is not a reliable indicator of current and future results.
Asia
Emerging markets
Europe
Japan
UK
US
Asia
Emerging markets
Europe
Japan
UK
US
-5% 0% 5% 10% 15%
Advanced derivativesCurrency
Fixed incomeEquity futures
Total cash equityAsia
Emerging markets
Europe
Japan
UK
US

25 | FOR PROFESSIONAL CLIENTS/QUALIFIED INVESTORS ONLY | NOT FOR PUBLIC DISTRIBUTION
Contribution through time
Calendar year asset class contribution
% 2013 2014 2015 2016 2017 2018 YTD
Equity 21.2 7.9 5.0 1.1 25.3 -2.1
Asia -0.6 0.0 -0.1 0.2 7.7 0.7
Emerging markets 0.0 - - - 1.4 0.0
Europe 4.0 1.4 1.7 0.1 1.9 -0.8
Japan 5.8 -0.7 2.3 -0.6 4.9 -1.4
UK 2.5 1.5 0.9 0.8 1.0 -0.1
US 9.6 5.8 0.1 0.5 8.3 -0.5
Equity futures 0.6 0.1 0.1 -5.8 -1.0 1.4
Cash equity + equity futures 21.8 8.0 5.1 -4.7 24.4 -0.7
Fixed income -1.9 3.5 -0.9 0.2 0.2 0.0
Currency -0.9 1.5 4.1 2.4 -2.4 -0.5
Advanced derivatives -1.2 1.3 3.0 -1.9 -6.0 2.6
Total 17.8 14.4 11.3 -4.1 16.1 1.4
Performance
% 2013 2014 2015 2016 2017 2018 YTD
MSCI World 28.1 9.5 1.7 7.8 16.8 0.1
JPM GBI -0.5 8.5 1.1 2.2 0.4 -0.8
50:50 Balanced 13.0 9.0 1.6 5.2 8.3 -0.3
Source: J.P. Morgan Asset Management, as at 31 May 2018. Contributions based on gross of fee returns, and may not match the official returns due to differences in system rounding. Indices used:
50% MSCI World Index and 50% JPM GBI Index. Indices do not include fees or operating expenses. Past performance is not a reliable indicator of current and future results.

FOR PROFESSIONAL CLIENTS/QUALIFIED INVESTORS ONLY | NOT FOR PUBLIC DISTRIBUTION
Appendix
27 | FOR PROFESSIONAL CLIENTS/QUALIFIED INVESTORS ONLY | NOT FOR PUBLIC DISTRIBUTION
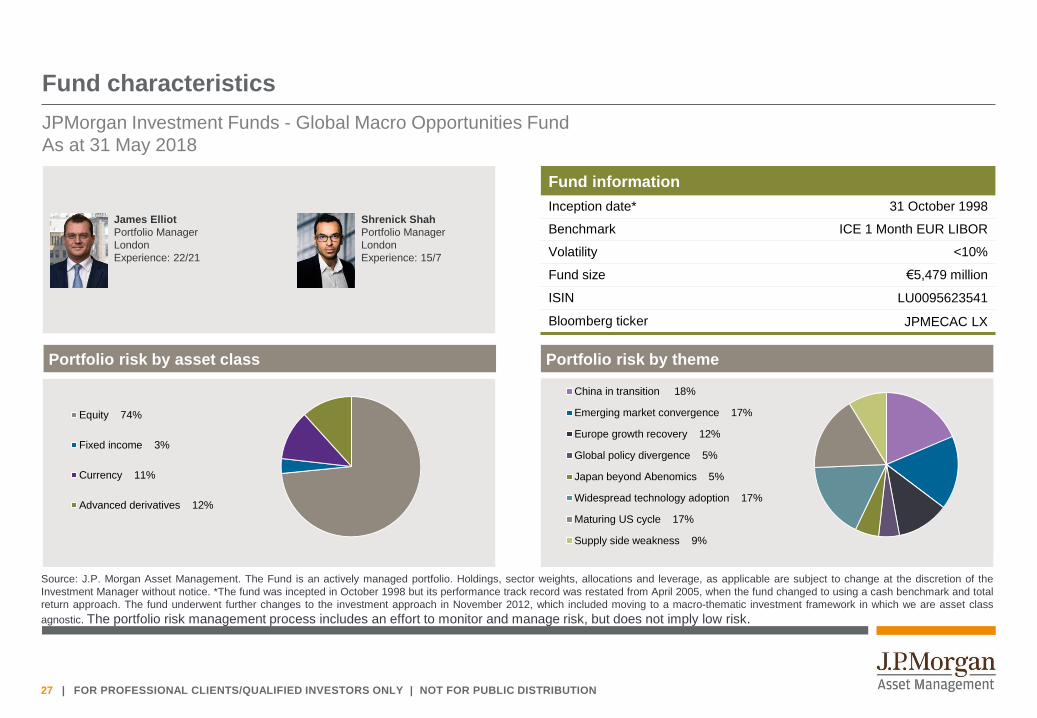
Fund information
Inception date* 31 October 1998
Benchmark ICE 1 Month EUR LIBOR
Volatility <10%
Fund size €5,479 million
ISIN LU0095623541
Bloomberg ticker JPMECAC LX
Fund characteristics
JPMorgan Investment Funds - Global Macro Opportunities Fund
As at 31 May 2018
Portfolio risk by asset class Portfolio risk by theme
James Elliot
Portfolio Manager
London
Experience: 22/21
Shrenick Shah
Portfolio Manager
London
Experience: 15/7
Equity 74%
Fixed income 3%
Currency 11%
Advanced derivatives 12%
China in transition 18%
Emerging market convergence 17%
Europe growth recovery 12%
Global policy divergence 5%
Japan beyond Abenomics 5%
Widespread technology adoption 17%
Maturing US cycle 17%
Supply side weakness 9%
Source: J.P. Morgan Asset Management. The Fund is an actively managed portfolio. Holdings, sector weights, allocations and leverage, as applicable are subject to change at the discretion of the
Investment Manager without notice. *The fund was incepted in October 1998 but its performance track record was restated from April 2005, when the fund changed to using a cash benchmark and total
return approach. The fund underwent further changes to the investment approach in November 2012, which included moving to a macro-thematic investment framework in which we are asset class
agnostic. The portfolio risk management process includes an effort to monitor and manage risk, but does not imply low risk.
28 | FOR PROFESSIONAL CLIENTS/QUALIFIED INVESTORS ONLY – NOT FOR RETAIL USE OR DISTRIBUTION
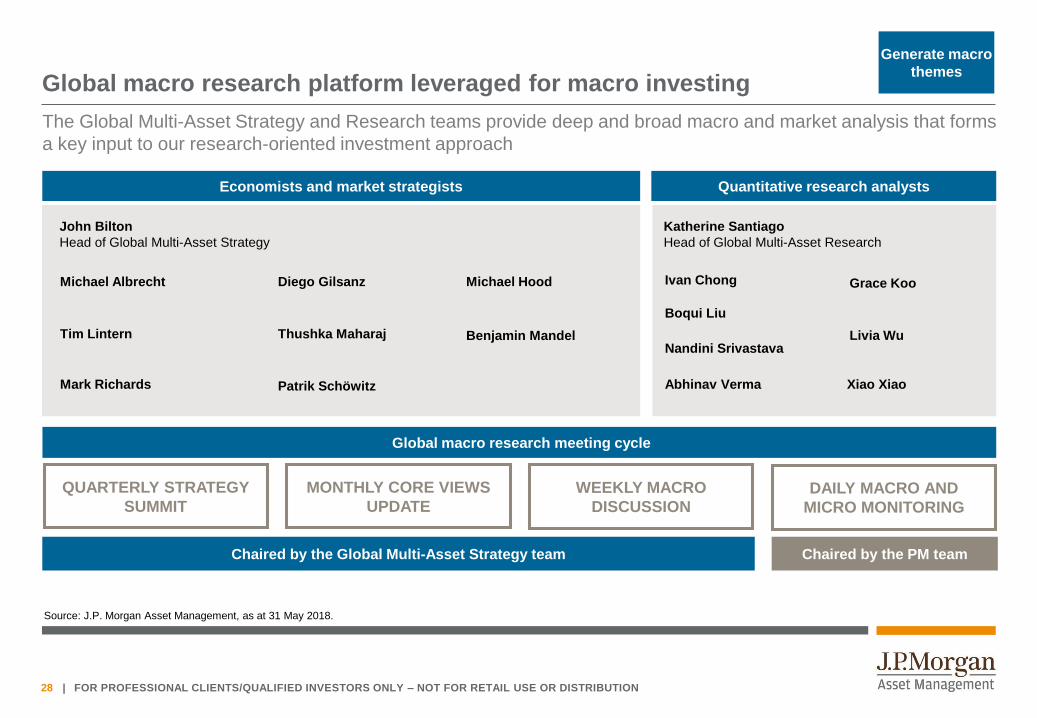
Global macro research platform leveraged for macro investing
Global macro research meeting cycle
John Bilton
Head of Global Multi-Asset Strategy
Thushka Maharaj
DAILY MACRO AND
MICRO MONITORING
WEEKLY MACRO
DISCUSSION
MONTHLY CORE VIEWS
UPDATE
QUARTERLY STRATEGY
SUMMIT
Chaired by the Global Multi-Asset Strategy team Chaired by the PM team
Economists and market strategists
Michael Hood
Mark Richards Patrik Schöwitz
Benjamin Mandel
Michael Albrecht Diego Gilsanz
Tim Lintern
Quantitative research analysts
Katherine Santiago
Head of Global Multi-Asset Research
Grace Koo
Boqui Liu
Livia Wu
The Global Multi-Asset Strategy and Research teams provide deep and broad macro and market analysis that forms
a key input to our research-oriented investment approach
Generate macro
themes
Nandini Srivastava
Xiao Xiao
Source: J.P. Morgan Asset Management, as at 31 May 2018.
Ivan Chong
Abhinav Verma

29 | FOR PROFESSIONAL CLIENTS/QUALIFIED INVESTORS ONLY – NOT FOR RETAIL USE OR DISTRIBUTION
Summary of current macro themes
Generate macro
themes
Source: J.P. Morgan Asset Management Multi-Asset Solutions, as at 31 May 2018. 1Global Financial Crisis 2European Central Bank 3Bank of Japan 4Emerging Markets 5Developed Markets. Opinions,
estimates, forecasts, projections and statements of financial market trends are based on market conditions at the date of the publication, constitute our judgment and are subject to change without
notice. There can be no guarantee they will be met.
Theme Update
Global policy divergencePost GFC1 recoveries have been multi-speed and asynchronous,
reflected in differing policy responses from fiscal authorities and
central banks.
Monetary policy divergence may have peaked for now although is
evident in the varying pace at which policy support is being removed
A further source of divergence is coming from fiscal policy.
Supply side weaknessWeaknesses on the supply-side in labour force, capital and
productivity growth lead to lower trend growth. Supply constraints
may bind more quickly, accelerating inflation.
Unemployment rates have dropped more rapidly than was typical in
the past. Some signs of cost-push inflation is materialising in the US,
although not yet strongly.
Maturing US cycleThe US economy has entered the late phase of a long and flat
business cycle, against a backdrop of generally steady growth.
Solid labour markets and rising wages are supporting the consumer,
while business investment is firming. An additional boost to growth
should come from fiscal stimulus.
Europe growth recoveryEuro area growth has steadily accelerated to an above-trend
pace, with room for this to continue due to years of slow growth,
and monetary policy remains accommodative.
Growth momentum has moderated but remains above-trend and
dispersion across the region has fallen. However, inflation remains
subdued, pointing to a gradual removal of ECB2 policy
accommodation.
Japan beyond AbenomicsMonetary policy has limited scope for further easing. Demand is
decent, but structural problems remain, with a broad range of
possible outcomes for growth and policy.
Growth has stalled a little but is expected to remain firm; inflation is
showing tentative signs of a gradual pickup. Monetary policy remains
extremely ease however the BoJ3 will start to consider its future
policy path later in the year.
Emerging market convergenceConvergence between EM4 and DM5 economies is becoming
more pronounced. A lower level of activity in EM provides scope
to converge, in areas such as income and consumption.
The EM bloc is in the early stages of a new cyclical expansion and
this provides room for convergence to accelerate. Risks stem from
widening fiscal deficits and any slowdown in credit.
China in transitionChina is transitioning from an industrial to services led economy
with lower trend growth. The authorities are focusing on financial
stability - a positive development.
Growth has been steady with only modest monetary policy
tightening. The National Party Congress consolidated President Xi’s
power and this political stability should enable structural reforms.
Widespread technology adoptionEmerging information technologies are reaching inflection points
in innovation and adoption rates. The technology cycle likely
boosts productivity growth providing upside risks to trend growth.
Information technologies are disrupting existing business models
and creating new opportunities, resulting in an environment of
winners and losers.
30 | FOR PROFESSIONAL CLIENTS/QUALIFIED INVESTORS ONLY – NOT FOR RETAIL USE OR DISTRIBUTION
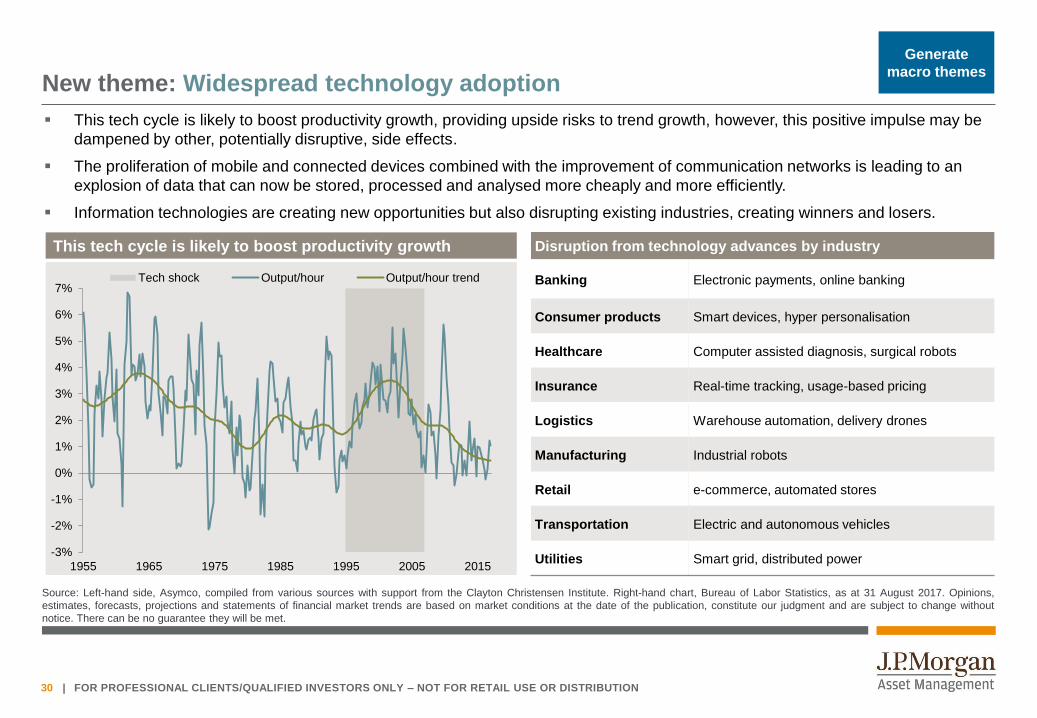
New theme: Widespread technology adoption
Source: Left-hand side, Asymco, compiled from various sources with support from the Clayton Christensen Institute. Right-hand chart, Bureau of Labor Statistics, as at 31 August 2017. Opinions,
estimates, forecasts, projections and statements of financial market trends are based on market conditions at the date of the publication, constitute our judgment and are subject to change without
notice. There can be no guarantee they will be met.
This tech cycle is likely to boost productivity growth, providing upside risks to trend growth, however, this positive impulse may be
dampened by other, potentially disruptive, side effects.
The proliferation of mobile and connected devices combined with the improvement of communication networks is leading to an
explosion of data that can now be stored, processed and analysed more cheaply and more efficiently.
Information technologies are creating new opportunities but also disrupting existing industries, creating winners and losers.
This tech cycle is likely to boost productivity growth
-3%
-2%
-1%
0%
1%
2%
3%
4%
5%
6%
7%
1955 1965 1975 1985 1995 2005 2015
Tech shock Output/hour Output/hour trend
Generate
macro themes
Disruption from technology advances by industry
Banking Electronic payments, online banking
Consumer products Smart devices, hyper personalisation
Healthcare Computer assisted diagnosis, surgical robots
Insurance Real-time tracking, usage-based pricing
Logistics Warehouse automation, delivery drones
Manufacturing Industrial robots
Retail e-commerce, automated stores
Transportation Electric and autonomous vehicles
Utilities Smart grid, distributed power

31 | FOR PROFESSIONAL CLIENTS/QUALIFIED INVESTORS ONLY – NOT FOR RETAIL USE OR DISTRIBUTION
Dynamic reduction of equity risk: Feb 2018
Macro event riskMacro research enables identification of possible risk
Broad-based strong growth through 2017 prompted rising
inflation expectations in markets. In this risk-on environment,
equity markets and global bond yields moved sharply higher.
We believed there was a potential for market volatility to rise
as markets navigate the removal of ultra-easy monetary policy.
While the macro backdrop remained positive, the speed and
magnitude of these markets moves led us to reduce aggregate
portfolio risk.
Strategy selectionFlexible Implementation
We took advantage of the move higher in equity markets by
taking profit on some of our long equity strategies, including
Chinese and US financials and global materials.
We added to protection strategies, adding attractively-priced
long US volatility futures and long US large cap put option
strategies.
In the event…
After the strong start to the year, risk assets suffered in February
and volatility increased. While our cash equity positions broadly
detracted, the losses were more than offset by our long volatility
strategy and short US equity exposure.
Select
investment
strategies
January 2018 – Actively reduced risk as equity markets soared
February 2018 Portfolio outcome (return)
MSCI World Index (Euro hedged) -3.7%
Total portfolio 1.3%
Advanced derivatives 2.1%
Portfolio delta
MSCI World Index (Euro hedged)
Source: J.P. Morgan Asset Management, Bloomberg, as at 28 February 2018. Advanced derivatives included long VIX futures and long US large cap put options. Performance returns are for JPM
Global Macro Opportunities Fund and are shown gross of fees. Past performance is not a reliable indicator of current and future results.
0%
20%
40%
60%
80%
100%
205
210
215
220
225
230
235
240
1-Jan 8-Jan 15-Jan 22-Jan 29-Jan

32 | FOR PROFESSIONAL CLIENTS/QUALIFIED INVESTORS ONLY – NOT FOR RETAIL USE OR DISTRIBUTION
So
ph
isti
ca
ted
Tra
dit
ion
al
Supply side
weakness
China in
transition
Emerging
market
convergence
Global policy
divergence
Japan beyond
Abenomics
Europe growth
recovery
Maturing US
cycle
Widespread
technology
adoption
Macro themes and strategies are interlinked
Str
ate
gy
Select
investment
strategies
Source: J.P. Morgan Asset Management, as at 31 May 2018. Opinions, estimates, forecasts, projections and statements of financial market trends are based on market conditions at the date of the
publication, constitute our judgment and are subject to change without notice. There can be no guarantee they will be met.
Equity - consumer discretionary
Equity - energy
Equity - financials
Equity - health care
Equity - industrials
Equity - information technology
Equity - materials
Equity - telecommunication services
Equity - utilities
Fixed income - France
Fixed income - Japan
Fixed income - US
Equity - long China
Equity - long emerging markets
Equity - long Singapore
Equity - long US energy
Equity - long US financials
Equity - short Australia
Equity - short EU staples
Equity - short Europe
Equity - short UK
Equity - short US utilities
Equity - long US autos via options
Equity - long US large cap calls
Volatility - long VIX
FX - long AUD short USD
FX - long EUR short USD
FX - long USD short JPY
FX - long USD short KRW
FX - short USD long BRL
FX - short USD long INR
FX - short USD long MXN
FX - short USD long SEK
33 | FOR PROFESSIONAL CLIENTS/QUALIFIED INVESTORS ONLY – NOT FOR RETAIL USE OR DISTRIBUTION
-1% 0% 1% 2% 3%
Equity - short Europe
Volatility - long VIX
Equity - short UK
Equity - short Australia
FX - long USD short KRW
Equity - short EU staples
Equity - short US utilities
FX - long USD short JPY
FX - short USD long INR
Equity - long US autos via options
FX - short USD long SEK
FX - short USD long BRL
Equity - long Singapore
FX - long EUR short USD
FX - short USD long MXN
FX - long AUD short USD
Equity - long US financials
Equity - long US energy
Equity - long emerging markets
Equity - long China
Fixed income - US
Fixed income - France
Fixed income - Japan
Equity Utilities
Equity Telecommunication Services
Equity Consumer Discretionary
Equity Materials
Equity Health Care
Equity Industrials
Equity Energy
Equity Financials
Equity Information Technology
0% 1% 2% 3% 4%
Equity - short EU staples
FX - short USD long SEK
Equity - long Singapore
FX - short USD long INR
FX - short USD long BRL
FX - long USD short KRW
Equity - long US autos via options
FX - long USD short JPY
FX - long EUR short USD
FX - long AUD short USD
FX - short USD long MXN
Equity - long US financials
Equity - short Australia
Equity - long emerging markets
Equity - long China
Equity - long US energy
Equity - short US utilities
Equity - short UK
Volatility - long VIX
Equity - short Europe
Fixed income - France
Fixed income - Japan
Fixed income - US
Equity Telecommunication Services
Equity Materials
Equity Health Care
Equity Consumer Discretionary
Equity Utilities
Equity Industrials
Equity Energy
Equity Financials
Equity Information Technology
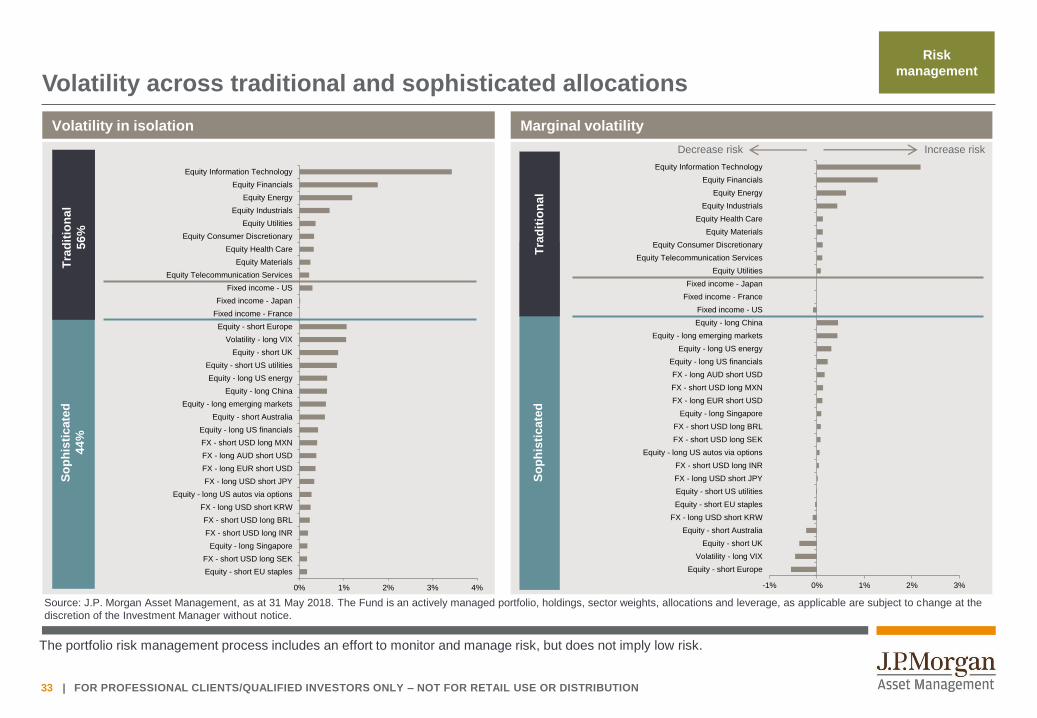
Volatility across traditional and sophisticated allocations
Source: J.P. Morgan Asset Management, as at 31 May 2018. The Fund is an actively managed portfolio, holdings, sector weights, allocations and leverage, as applicable are subject to change at the
discretion of the Investment Manager without notice.
Tra
dit
ion
al
56
%
So
ph
isti
ca
ted
44
%
Volatility in isolation Marginal volatility
So
ph
isti
ca
ted
Tra
dit
ion
al
So
ph
isti
ca
ted
Tra
dit
ion
al
Increase riskDecrease risk
Risk
management
The portfolio risk management process includes an effort to monitor and manage risk, but does not imply low risk.
34 | FOR PROFESSIONAL CLIENTS / QUALIFIED INVESTORS ONLY – NOT FOR RETAIL USE OR DISTRIBUTION
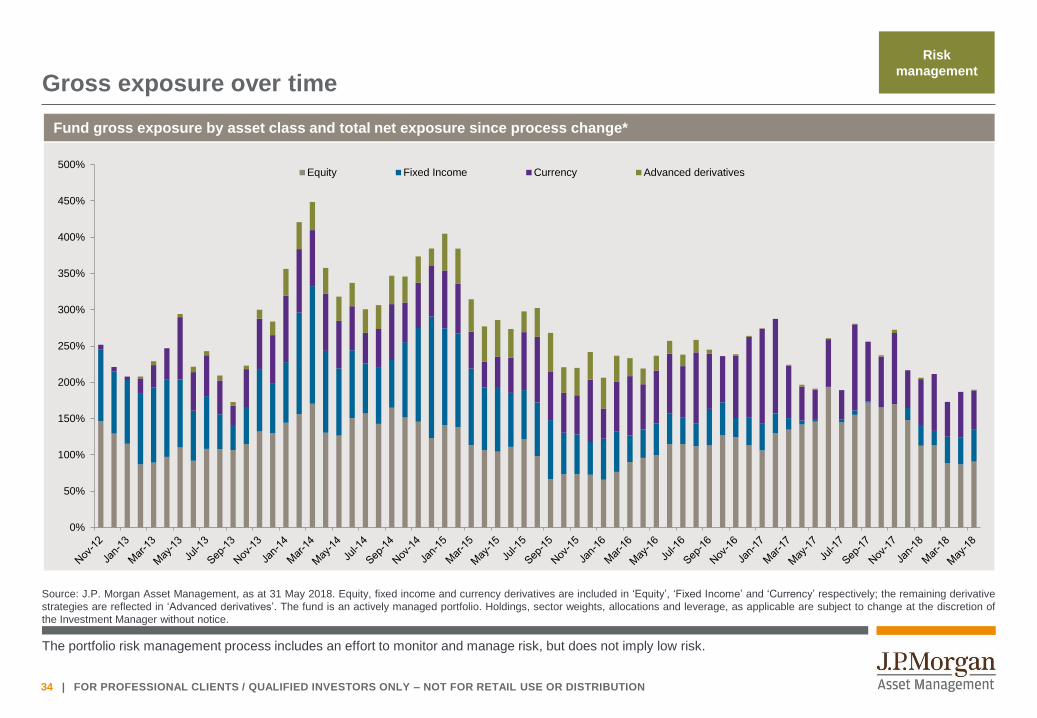
Gross exposure over time
0%
50%
100%
150%
200%
250%
300%
350%
400%
450%
500%Equity Fixed Income Currency Advanced derivatives
Fund gross exposure by asset class and total net exposure since process change*
Risk
management
Source: J.P. Morgan Asset Management, as at 31 May 2018. Equity, fixed income and currency derivatives are included in ‘Equity’, ‘Fixed Income’ and ‘Currency’ respectively; the remaining derivative
strategies are reflected in ‘Advanced derivatives’. The fund is an actively managed portfolio. Holdings, sector weights, allocations and leverage, as applicable are subject to change at the discretion of
the Investment Manager without notice.
The portfolio risk management process includes an effort to monitor and manage risk, but does not imply low risk.

35 | FOR PROFESSIONAL CLIENTS / QUALIFIED INVESTORS ONLY – NOT FOR RETAIL USE OR DISTRIBUTION
Regular and detailed client communication
Webcast is available through BrightTalkTM.
Semi-annual macro theme updatesMonthly webcast on macro strategy Monthly fund commentary

36 | FOR PROFESSIONAL CLIENTS / QUALIFIED INVESTORS ONLY – NOT FOR RETAIL USE OR DISTRIBUTION
Outcome oriented: Needs-driven solutions harnessing our investment strategies
Building the right investment portfolio
Source: J.P. Morgan Asset Management. AUM is as of March 31, 2018 shown in U.S. dollars. Figures do not include custom glidepath and retail advisory assets.
CLIENTNEEDS
• Manage volatility
• Diversifyglobally
• Generate income
• Preserve capital
• Optimize retirement
outcomes
• Manage liabilitiesBALANCEDUSD 57.7bn
TARGET
DATEUSD 88.5bn
OUTCOME
ORIENTEDUSD 93.3bn
MACRO THEMATICUSD 9.4bn
CONVERTIBLESUSD 4.2bn
SINGLEASSETUSD 2.0bn
J.P. MORGAN
ASSET MANAGEMENT
~500 INVESTMENT STRATEGIES
MULTI-
ASSETUSD 255bn
AUM
FIXED
INCOMEUSD 496bn
EQUITIESUSD 507bn
ALTSUSD 125bn
LIQUIDITYUSD 494bn
BETAUSD 24bn
37 | FOR PROFESSIONAL CLIENTS / QUALIFIED INVESTORS ONLY – NOT FOR RETAIL USE OR DISTRIBUTION
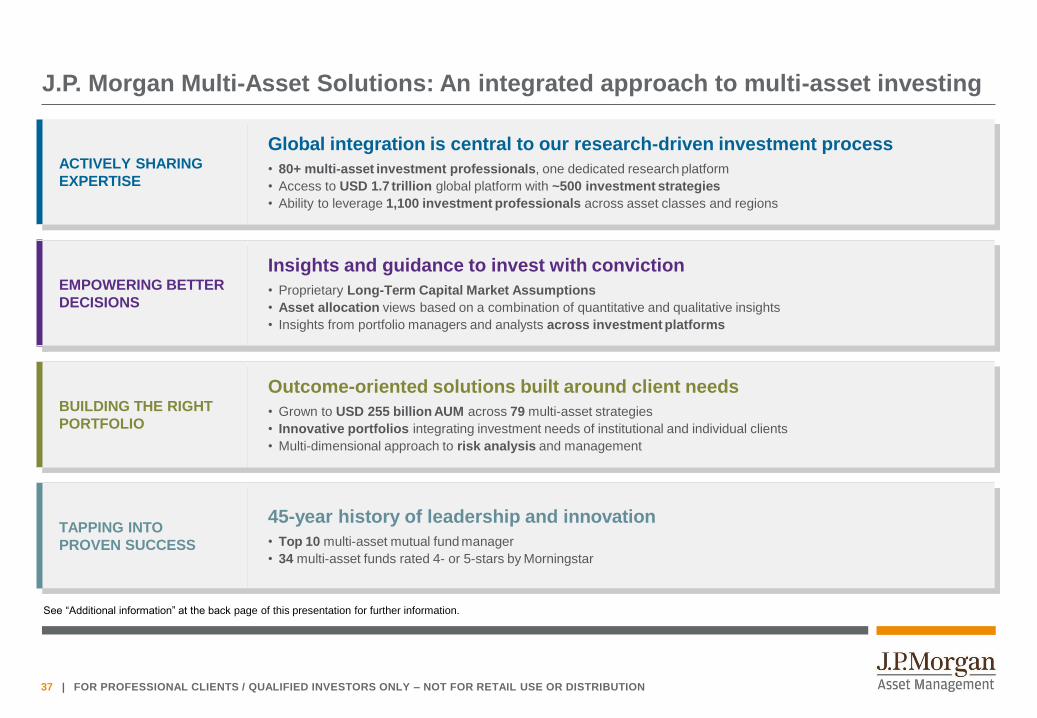
J.P. Morgan Multi-Asset Solutions: An integrated approach to multi-asset investing
See “Additional information” at the back page of this presentation for further information.
ACTIVELY SHARING
EXPERTISE
Global integration is central to our research-driven investment process
• 80+ multi-asset investment professionals, one dedicated research platform
• Access to USD 1.7 trillion global platform with ~500 investment strategies
• Ability to leverage 1,100 investment professionals across asset classes and regions
BUILDING THE RIGHT
PORTFOLIO
Outcome-oriented solutions built around client needs
• Grown to USD 255 billion AUM across 79 multi-asset strategies
• Innovative portfolios integrating investment needs of institutional and individual clients
• Multi-dimensional approach to risk analysis and management
EMPOWERING BETTER
DECISIONS
Insights and guidance to invest with conviction
• Proprietary Long-Term Capital Market Assumptions
• Asset allocation views based on a combination of quantitative and qualitative insights
• Insights from portfolio managers and analysts across investment platforms
TAPPING INTO
PROVEN SUCCESS
45-year history of leadership and innovation
• Top 10 multi-asset mutual fund manager
• 34 multi-asset funds rated 4- or 5-stars by Morningstar

38 | FOR PROFESSIONAL CLIENTS / QUALIFIED INVESTORS ONLY – NOT FOR RETAIL USE OR DISTRIBUTION
JAMES ELLIOTManaging Director
Chief Investment Officer (“CIO”) of the International business of the Multi-Asset Solutions team, based in London. James is responsible for investment oversight of all mandates managed by the Multi-Asset Solutions team in London and Hong Kong, in addition to contributing to the team’s views on broad macroeconomic themes that are reflected across all portfolios managed globally by the Multi-Asset Solutions team. James is also responsible for managing global macro portfolios. James joined J.P. Morgan in 1995. Prior to his current role, James was CIO for the JPMAM Japanese Equity Portfolio Group based in Tokyo and, previously, was co-head of the JPMAM European Equity Group based in London. James left J.P. Morgan for a period of time and worked at RAB Capital plc, where he served as the Director of Europe Equities and manager of the RAB Europe Long/Short Fund. He obtained a B.A. in Modern History from the University of Oxford and is a CFA charterholder.
SHRENICK SHAHManaging director
Portfolio manager in the Multi-Asset Solutions team, based in London, with responsibility for managing global macro portfolios. An employee since
September 2010, Shrenick previously worked in the equity divisions at Deutsche Bank and Credit Suisse. Shrenick obtained a M.Sc. in Econometrics
and Mathematical Economics from the London School of Economics.
Biographies
Portfolio Managers
Source: J.P. Morgan Asset Management, as at 31 May 2018.

39 | FOR PROFESSIONAL CLIENTS / QUALIFIED INVESTORS ONLY – NOT FOR RETAIL USE OR DISTRIBUTION
J.P. Morgan Asset Management
Contacts
Nicola Rawlinson
Executive Director
Client Portfolio Manager, Multi-Asset Solutions
+44 (0) 20 7742 5385
Yuejue Jin
Vice President
Client Portfolio Manager, Multi-Asset Solutions
+852 2800 2891
Mark Jackson
Vice President
Client Portfolio Manager, Multi-Asset Solutions
+44 (0) 20 7742 7022
Olivia Mayell
Managing Director
Client Portfolio Manager, Multi-Asset Solutions
+44 (0) 207 742 5467
Jakob Tanzmeister
Executive Director
Client Portfolio Manager, Multi-Asset Solutions
+44 (0) 20 7742 4914
Jeffrey Wang
Vice President
Client Portfolio Manager, Multi-Asset Solutions
+852 2800 6055
Source: J.P. Morgan Asset Management, as at 31 May 2018.

40 | FOR PROFESSIONAL CLIENTS / QUALIFIED INVESTORS ONLY – NOT FOR RETAIL USE OR DISTRIBUTION
Share classes
Source: J.P. Morgan Asset Management. Minimum subscriptions may vary depending on initial /subsequent subscriptions. Please note that certain share classes have eligibility criteria which must be
met, details can be obtained from the prospectus.
Share class
Launch date ISINBloomberg
identifierSEDOL
Minimum
subscription1
JPM Global Macro Opportunities A (acc) - EUR 10/23/1998 LU0095938881 JPMECAA LX 5671304 35,000
JPM Global Macro Opportunities A (dist) - EUR 06/1/2006 LU0247991580 JPMGCAA LX B11P3F6 35,000
JPM Global Macro Opportunities A (inc) - EUR 06/1/2006 LU0247992398 JPMGCAI LX B11P3S9 35,000
JPM Global Macro Opportunities C (acc) - EUR 02/26/1999 LU0095623541 JPMECAC LX 5671360 10,000,000
JPM Global Macro Opportunities C (dist) - EUR 07/22/2015 LU0848065107 JPMGCAB LX B89LQW3 10,000,000
JPM Global Macro Opportunities C (inc) - EUR 02/4/2016 LU1314349108 JPGMCIE LX BYSRL29 10,000,000
JPM Global Macro Opportunities D (acc) - EUR 12/12/2001 LU0115098948 JPMECAD LX 7322020 5,000
JPM Global Macro Opportunities I (acc) - EUR 02/8/2016 LU0248010471 JPGMIAE LX B12CMT3 10,000,000
JPM Global Macro Opportunities T (acc) - EUR 06/27/2011 LU0605964500 JPMGCET LX B609VF0 5,000
JPM Global Macro Opportunities X (acc) - EUR 04/25/2006 LU0098446601 JPMECAX LX 7249215
JPMorgan Investment Funds – Global Macro Opportunities Fund
as at 31 May 2018

41 | FOR PROFESSIONAL CLIENTS / QUALIFIED INVESTORS ONLY – NOT FOR RETAIL USE OR DISTRIBUTION
Fees and expenses
*Shares of X Share Classes may only be acquired by Institutional Investors who are clients of the Management Company or JPMorgan Chase & Co. and (i) which meet the minimum account
maintenance or qualification requirements established from time to time for JPMorgan Chase & Co. client accounts and/or (ii) whose Share Class X Shares will be held in a JPMorgan Chase & Co. client
account subject to separate advisory fees payable to the Investment Manager or any of its affiliated companies.
Unless stated otherwise in the Fund specific details, Shares of X Share Classes are designed to accommodate an alternative charging structure whereby a fee for the management of the Fund is
administratively levied and collected by the Management Company or through the relevant JPMorgan Chase & Co. entity directly from the Shareholder. The Annual Management and Advisory Fee is
therefore listed as "Nil" in the Fees and Expenses tables in this appendix, due to it not being levied on the Fund.
The fund will charge an AMC of 0.60% per annum, with operating and administrative expenses of 0.15% per annum
for C share classes.
Share class Initial chargeAnnual management
& advisory fee
Operating &
administrative
expenses
Redemption charge Distribution fee
JPM Global Macro Opportunities A 5.00% 1.25% 0.20% 0.50% Nil
JPM Global Macro Opportunities C Nil 0.60% 0.15% Nil Nil
JPM Global Macro Opportunities D 5.00% 1.25% 0.20% 0.50% 0.70%
JPM Global Macro Opportunities I Nil 0.60% 0.11% Nil Nil
JPM Global Macro Opportunities T Nil 1.25% 0.20% Nil 0.70%
JPM Global Macro Opportunities X* Nil Nil 0.10% Nil Nil
Available hedged share classes
CHF PLN
USD SEK
SGD JPY
GBP AUD

42 | FOR PROFESSIONAL CLIENTS / QUALIFIED INVESTORS ONLY – NOT FOR RETAIL USE OR DISTRIBUTION
Investment objective and risk profile
JPMorgan Investment Funds – Global Macro Opportunities Fund
Risk profile– The value of equity securities may go down as well as up in response to the performance of individual companies and general market conditions.
– The value of debt securities may change significantly depending on economic and interest rate conditions as well as the credit worthiness of the issuer.
Issuers of debt securities may fail to meet payment obligations or the credit rating of debt securities may be downgraded. These risks are typically increased
for emerging market and below investment grade debt securities.
– In addition, emerging markets may be subject to increased political, regulatory and economic instability, less developed custody and settlement practices,
poor transparency and greater financial risks. Emerging market currencies may be subject to volatile price movements. Emerging market and below
investment grade debt securities may also be subject to higher volatility and lower liquidity than non emerging market and investment grade debt securities
respectively.
– The credit worthiness of unrated debt securities is not measured by an independent credit rating agency.
– The value of securities in which the Sub-Fund invests may be influenced by movements in commodity prices which can be very volatile.
– Convertible bonds are subject to the credit, interest rate and market risks stated above associated with both debt and equity securities and to risks specific to
convertible securities. Convertible bonds may also be subject to lower liquidity than the underlying equity securities.
– The Sub-Fund may be concentrated in, and have net long or net short exposure to, industry sectors, markets and/or currencies. As a result, the Sub-Fund
may be more volatile than more broadly diversified funds.
– The value of financial derivative instruments can be volatile. This is because a small movement in the value of the underlying asset can cause a large
movement in the value of the financial derivative instrument and therefore, investment in such instruments may result in losses in excess of the amount
invested by the Sub-Fund.
– The possible loss from taking a short position on an asset may be unlimited as there is no restriction on the price to which the asset may rise. The short
selling of investments may be subject to changes in regulations, which could adversely impact returns to investors.
– Movements in currency exchange rates can adversely affect the return of your investment. The currency hedging that may be used to minimise the effect of
currency fluctuations may not always be successful.
Investment objectiveTo achieve capital appreciation in excess of its cash benchmark by investing primarily in securities, globally, using financial derivative instruments where appropriate.

43 | FOR PROFESSIONAL CLIENTS / QUALIFIED INVESTORS ONLY – NOT FOR RETAIL USE OR DISTRIBUTION
Additional information
The number of ‘investment professionals’ includes portfolio managers, research analysts, traders and investment specialists with VP title and above. Sourced from J.P. Morgan Asset Management; as
of March 31, 2018
‘Top 10 multi-asset mutual fund manager’ is sourced from J.P. Morgan Asset Management analysis based on data from Strategic Insight; multi-asset mutual fund peer group is global and excludes
target date funds; based on global data as of March 31,2018.
DC Multi-Asset Fund Manager of the Year – UK Pension Awards. 2017 UK Pension Awards.
Morningstar® Awards 2014. Morningstar, Inc. All rights reserved. The 2014 U.S. Allocation Fund Manager of the Year was awarded to the SmartRetirement team for the management of the JPMorgan
SmartRetirement Target Date Series (Institutional shares). Subsequent winners in the Allocation category were not target date funds. In 2015, Michael Reckmeyer and John Keogh won in the
Allocation category for Vanguard Wellesley Income Fund. In 2016, the Equity and Fixed Income Investment Policy Committees won the Allocation and Alternatives (combined) category for Dodge &
Cox Balanced Fund. Nominations in Morningstar’s Allocation or Allocation/Alternatives categories were awarded in 2012, 2014 and 2017.
The “mutual funds with a 4/5 star rating” analysis is sourced from Morningstar for all funds with the exception of Japan-domiciled funds; Nomura was used for Japan-domiciled funds. The analysis
includes Global Investment Management open-ended funds that are rated by the aforementioned sources. The multi-asset classification used in the illustration is based on J.P. Morgan’s own
categorization. The share class with the highest Morningstar star rating represents its respective fund. The Nomura star rating represents the aggregate fund. Other share classes may have different
performance characteristics and may have different ratings; the highest rated share class may not be available to all investors. All star ratings sourced from Morningstar reflect the Morningstar Overall
RatingTM. For Japan-domiciled funds, the star rating is based on the Nomura 3-year star rating. Funds with fewer than three years of history are not rated by Morningstar nor Nomura and hence
excluded from this analysis. Other funds which do not have a rating are also excluded from this analysis. Ratings are based on past performance and are not indicative of future results.
The Morningstar RatingTM for funds, or "star rating", is calculated for managed products (including mutual funds, variable annuity and variable life subaccounts, exchange-traded funds, closed-end
funds, and separate accounts) with at least a three-year history. Exchange traded funds and open-ended mutual funds are considered a single population for comparative purposes. It is calculated
based on a Morningstar Risk-Adjusted Return measure that accounts for variation in a managed product's monthly excess performance, placing more emphasis on downward variations and rewarding
consistent performance. The top 10% of products in each product category receive 5 stars, the next 22.5% receive 4 stars, the next 35% receive 3 stars, the next 22.5% receive 2 stars, and the bottom
10% receive 1 star. The Overall Morningstar Rating for a managed product is derived from a weighted average of the performance figures associated with its three-, five-, and 10-year (if applicable)
Morningstar Rating metrics. The weights are: 100% three-year rating for 36-59 months of total returns, 60% five-year rating/40% three-year rating for 60-119 months of total returns, and 50% 10- year
rating/30% five-year rating/20% three-year rating for 120 or more months of total returns. While the 10-year overall star rating formula seems to give the most weight to the 10-year period, the most
recent three-year period actually has the greatest impact because it is included in all three rating periods. Rankings do not take sales loads into account.
44 | FOR PROFESSIONAL CLIENTS / QUALIFIED INVESTORS ONLY – NOT FOR RETAIL USE OR DISTRIBUTION
Important Information
For Professional Clients / Qualified Investors only – not for Retail use or distribution
This is a marketing communication and as such the views contained herein are not to be taken as advice or a recommendation to buy or sell any investment or interest thereto.
Reliance upon information in this material is at the sole discretion of the reader. Any research in this document has been obtained and may have been acted upon by J.P. Morgan
Asset Management for its own purpose. The results of such research are being made available as additional information and do not necessarily reflect the views of J.P. Morgan
Asset Management. Any forecasts, figures, opinions, statements of financial market trends or investment techniques and strategies expressed are, unless otherwise stated, J.P.
Morgan Asset Management’s own at the date of this document. They are considered to be reliable at the time of writing, may not necessarily be all inclusive and are not guaranteed
as to accuracy. They may be subject to change without reference or notification to you. It should be noted that the value of investments and the income from them may fluctuate in
accordance with market conditions and taxation agreements and investors may not get back the full amount invested. Changes in exchange rates may have an adverse effect on
the value, price or income of the products or underlying overseas investments. Past performance and yield are not a reliable indicator of current and future results. There is no
guarantee that any forecast made will come to pass. Furthermore, whilst it is the intention to achieve the investment objective of the investment products, there can be no
assurance that those objectives will be met. J.P. Morgan Asset Management is the brand name for the asset management business of JPMorgan Chase & Co. and its affiliates
worldwide. To the extent permitted by applicable law, we may record telephone calls and monitor electronic communications to comply with our legal and regulatory obligations and
internal policies. Personal data will be collected, stored and processed by J.P. Morgan Asset Management in accordance with our EMEA Privacy Policy
www.jpmorgan.com/jpmpdf/1320694304816.pdf. As the product may not be authorized or its offering may be restricted in your jurisdiction, it is the responsibility of every reader to
satisfy himself as to the full observance of the laws and regulations of the relevant jurisdiction. Prior to any application investors are advised to take all necessary legal, regulatory
and tax advice on the consequences of an investment in the products. Shares or other interests may not be offered to, or purchased, directly or indirectly by US persons. All
transactions should be based on the latest available Prospectus, the Key Investor Information Document (KIID) and any applicable local offering document. These documents
together with the annual report, semi-annual report and the articles of incorporation for the Luxembourg domiciled products are available free of charge upon request from
JPMorgan Asset Management (Europe) S.à r.l., 6 route de Trèves, L-2633 Senningerberg, Grand Duchy of Luxembourg, your financial adviser or your J.P. Morgan Asset
Management regional contact. In Switzerland, JPMorgan Asset Management (Switzerland) LLC, Dreikönigstrasse 21, 8002 Zurich, acts as Swiss representative of the funds and
J.P. Morgan (Suisse) SA, 8 Rue de la Confédération, 1204 Geneva, as paying agent of the funds.
This communication is issued in Europe (excluding UK) by JPMorgan Asset Management (Europe) S.à r.l., 6 route de Trèves, L-2633 Senningerberg, Grand Duchy of Luxembourg,
R.C.S. Luxembourg B27900, corporate capital EUR 10.000.000. This communication is issued in the UK by JPMorgan Asset Management (UK) Limited which is authorised and
regulated by the Financial Conduct Authority. Registered in England No. 01161446. Registered address: 25 Bank Street, Canary Wharf, London E14 5JP.
0903c02a8101cd9e