
J.P. Morgan Small Cap Funds
112
Annual Report J.P. Morgan Small Cap Funds June 30, 2020 JPMorgan Small Cap Blend Fund JPMorgan Small Cap Core Fund JPMorgan Small Cap Equity Fund JPMorgan Small Cap Growth Fund JPMorgan Small Cap Value Fund JPMorgan U.S. Small Company Fund Beginning on January 1, 2021, as permitted by regulations adopted by the Securities and Exchange Commission, paper copies of the Funds’ annual and semi-annual shareholder reports will no longer be sent by mail, unless you specifically request paper copies of the reports. Instead, the reports will be made available on the Funds’ website www.jpmorganfunds.com and you will be notified by mail each time a report is posted and provided with a website to access the report. If you already elected to receive shareholder reports electronically, you will not be affected by this change and you need not take any action. You may elect to receive shareholder reports and other communications from the Funds electronically anytime by contacting your financial intermediary (such as a broker dealer, bank, or retirement plan) or, if you are a direct investor, by going to www.jpmorganfunds.com/edelivery. You may elect to receive paper copies of all future reports free of charge. Contact your financial intermediary or, if you invest directly with the Funds, email us at [email protected] or call 1-800-480-4111. Your election to receive paper reports will apply to all funds held within your account(s).
Transcript of J.P. Morgan Small Cap Funds

Annual Report
J.P. Morgan Small Cap FundsJune 30, 2020
JPMorgan Small Cap Blend FundJPMorgan Small Cap Core FundJPMorgan Small Cap Equity FundJPMorgan Small Cap Growth FundJPMorgan Small Cap Value FundJPMorgan U.S. Small Company Fund
Beginning on January 1, 2021, as permitted by regulations adopted by the Securities and Exchange Commission, paper copies of the Funds’annual and semi-annual shareholder reports will no longer be sent by mail, unless you specifically request paper copies of the reports.Instead, the reports will be made available on the Funds’ website www.jpmorganfunds.com and you will be notified by mail each time areport is posted and provided with a website to access the report. If you already elected to receive shareholder reports electronically, youwill not be affected by this change and you need not take any action.
You may elect to receive shareholder reports and other communications from the Funds electronically anytime by contacting your financialintermediary (such as a broker dealer, bank, or retirement plan) or, if you are a direct investor, by going to www.jpmorganfunds.com/edelivery.
You may elect to receive paper copies of all future reports free of charge. Contact your financial intermediary or, if you invest directly withthe Funds, email us at [email protected] or call 1-800-480-4111. Your election to receive paper reports will applyto all funds held within your account(s).

CONTENTS
Letter to Shareholders . . . . . . . . . . . . . . . . . . . . . . . . . . . . . . . . . . . . . . . . . . . . . . . . . . . . . . . . . . . . . . . . . . . . . . . . . . . . . . 1
Market Overview . . . . . . . . . . . . . . . . . . . . . . . . . . . . . . . . . . . . . . . . . . . . . . . . . . . . . . . . . . . . . . . . . . . . . . . . . . . . . . . . . . 2
Fund Commentaries:
JPMorgan Small Cap Blend Fund . . . . . . . . . . . . . . . . . . . . . . . . . . . . . . . . . . . . . . . . . . . . . . . . . . . . . . . . . . . . . . . . . . 3
JPMorgan Small Cap Core Fund . . . . . . . . . . . . . . . . . . . . . . . . . . . . . . . . . . . . . . . . . . . . . . . . . . . . . . . . . . . . . . . . . . . 5
JPMorgan Small Cap Equity Fund . . . . . . . . . . . . . . . . . . . . . . . . . . . . . . . . . . . . . . . . . . . . . . . . . . . . . . . . . . . . . . . . . . 7
JPMorgan Small Cap Growth Fund . . . . . . . . . . . . . . . . . . . . . . . . . . . . . . . . . . . . . . . . . . . . . . . . . . . . . . . . . . . . . . . . . 9
JPMorgan Small Cap Value Fund . . . . . . . . . . . . . . . . . . . . . . . . . . . . . . . . . . . . . . . . . . . . . . . . . . . . . . . . . . . . . . . . . . 11
JPMorgan U.S. Small Company Fund . . . . . . . . . . . . . . . . . . . . . . . . . . . . . . . . . . . . . . . . . . . . . . . . . . . . . . . . . . . . . . . 13
Schedules of Portfolio Investments . . . . . . . . . . . . . . . . . . . . . . . . . . . . . . . . . . . . . . . . . . . . . . . . . . . . . . . . . . . . . . . . . . . . 15
Financial Statements . . . . . . . . . . . . . . . . . . . . . . . . . . . . . . . . . . . . . . . . . . . . . . . . . . . . . . . . . . . . . . . . . . . . . . . . . . . . . . . 48
Financial Highlights . . . . . . . . . . . . . . . . . . . . . . . . . . . . . . . . . . . . . . . . . . . . . . . . . . . . . . . . . . . . . . . . . . . . . . . . . . . . . . . . 64
Notes to Financial Statements . . . . . . . . . . . . . . . . . . . . . . . . . . . . . . . . . . . . . . . . . . . . . . . . . . . . . . . . . . . . . . . . . . . . . . . . 82
Report of Independent Registered Public Accounting Firm . . . . . . . . . . . . . . . . . . . . . . . . . . . . . . . . . . . . . . . . . . . . . . . . . 96
Trustees . . . . . . . . . . . . . . . . . . . . . . . . . . . . . . . . . . . . . . . . . . . . . . . . . . . . . . . . . . . . . . . . . . . . . . . . . . . . . . . . . . . . . . . . 97
Officers . . . . . . . . . . . . . . . . . . . . . . . . . . . . . . . . . . . . . . . . . . . . . . . . . . . . . . . . . . . . . . . . . . . . . . . . . . . . . . . . . . . . . . . . . 100
Schedule of Shareholder Expenses . . . . . . . . . . . . . . . . . . . . . . . . . . . . . . . . . . . . . . . . . . . . . . . . . . . . . . . . . . . . . . . . . . . . 101
Liquidity Risk Management Program . . . . . . . . . . . . . . . . . . . . . . . . . . . . . . . . . . . . . . . . . . . . . . . . . . . . . . . . . . . . . . . . . . 105
Tax Letter . . . . . . . . . . . . . . . . . . . . . . . . . . . . . . . . . . . . . . . . . . . . . . . . . . . . . . . . . . . . . . . . . . . . . . . . . . . . . . . . . . . . . . . 106
Privacy Policy — Located at the back of this Annual Report
Investments in a Fund are not deposits or obligations of, or guaranteed or endorsed by, any bank and are not insured or guar-anteed by the FDIC, the Federal Reserve Board or any other government agency. You could lose money if you sell when aFund’s share price is lower than when you invested.
Past performance is no guarantee of future performance. The general market views expressed in this report are opinions based onmarket and other conditions through the end of the reporting period and are subject to change without notice. These views are notintended to predict the future performance of a Fund or the securities markets. References to specific securities and their issuers arefor illustrative purposes only and are not intended to be, and should not be interpreted as, recommendations to purchase or sell suchsecurities. Such views are not meant as investment advice and may not be relied on as an indication of trading intent on behalf of anyFund.
Prospective investors should refer to the Funds’ prospectuses for a discussion of the Funds’ investment objectives, strategies andrisks. Call J.P. Morgan Funds Service Center at 1-800-480-4111 for a prospectus containing more complete information about a Fund,including management fees and other expenses. Please read it carefully before investing.

L E T T E R T O S H A R E H O L D E R SJULY 28 , 2 020 (Unaud i ted )
Dear Shareholders,While every epoch holds challenges and opportunities, thecurrent year has brought unprecedented challenges thatimpacted communities both globally and locally. J.P. MorganAsset Management has directly confronted the challenges ofthis year, with sensitivity, urgency and a clear vision, servingour shareholders, clients and communities with unwaveringcommitment.
“J.P. Morgan Asset Management hasdirectly confronted the challenges ofthis year, with sensitivity, urgencyand a clear vision, serving ourshareholders, clients andcommunities with unwaveringcommitment.”— Andrea L. Lisher
The advent of the COVID-19 pandemic and the ensuing closureof large parts of global, national and local economies alsobrought severe stress to financial markets. Daily market vola-tility spiked and yields on U.S. Treasury bonds fell to recordlows in March 2020 and by the end of the first quarter of 2020,the value of the S&P 500 Index had declined by 20%. However,the U.S. Federal Reserve, along with other leading centralbanks, slashed interest rates and unleashed a range of ini-tiatives to seek to ensure liquidity and stability in financialmarkets. From their lows on March 23, 2020 to the end of thereporting period, the S&P 500 and the Bloomberg Barclays U.S.
Aggregate Index rebounded by 39.3% and 5.0%, respectively,amid accommodative central bank policies, government stim-ulus programs and global efforts to halt the spread ofCOVID-19.
Many have faced significant challenges throughout the pastyear, whether related to the COVID-19 pandemic or the recentacts of racism and discrimination around the world. JPMorganChase & Co. has recommitted its firm stance against any formof racism, discrimination, or social injustice. As Brian Lamb,Global Head of Diversity & Inclusion for JPMorgan Chase & Co.,recently said, “We are working across the entire firm — beingintentional to strengthen our inclusive environment where ouremployees, customers and partners feel welcomed and valuedin the communities where we do business.” To learn more,please visit JPMorgan Chase & Co.’s Diversity & Inclusionweb site.
On behalf of J.P. Morgan Asset Management, thank you forentrusting us to manage your assets. Should you have anyquestions, please visit www.jpmorganfunds.com or contact theJ.P. Morgan Funds Service Center at 1-800-480-4111.
Sincerely yours,
Andrea L. LisherHead of Americas, ClientJ.P. Morgan Asset Management
JUNE 30, 2020 J.P. MORGAN SMALL CAP FUNDS 1

J.P. Morgan Small Cap FundsM A R K E T O V E R V I E WTWELVE MONTHS ENDED JUNE 30 , 2 020 (Unaud i ted )
While U.S. equity markets generally outperformed other financial markets in the second half of 2019, global prices for a broad rangeof assets fell sharply in the first quarter of 2020 as large sectors of global, national and local economies shut down in response to theCOVID-19 pandemic. However, equity markets rebounded somewhat in the final three months of the reporting period as stimulusprograms from leading central banks and governments took hold and countries in Asia and Europe showed progress in halting thespread of virus.
In late July 2019, the U.S. Federal Reserve (the “Fed”) cut interest rates for the first time in more than a decade as U.S. economicgrowth showed signs of slowing, even as U.S. unemployment remained at historically low levels. The central bank followed with twomore interest rate cuts in September and October 2019. In response to lower rates and improved or stable economic data, equityprices in the U.S. generally rose in the final months of 2019.
Further support for U.S. equity markets came from a “Phase One” trade agreement between the U.S. and China that reduced existingtariffs and headed off the implementation of new tariffs scheduled to take effect December 15, 2019. U.S. investor sentimentremained positive through January 2020 and weathered a brief flare up in military tension between the U.S. and Iran.
While the S&P 500 reached six new closing highs in February – the last one on February 19 – the final weeks of the month weremarked by a broad sell-off of assets and a sharp rise in financial market volatility in reaction to the spread of COVID-19 and theexpected economic damage to follow. In early March 2020, the World Health Organization declared COVID-19 a pandemic and asbusinesses, schools and other institutions across the country began to close, U.S. weekly unemployment claims reached record highs.By the end of the first quarter of 2020, the S&P 500 had declined by 20%.
A U.S. government stimulus package, valued at 10% of U.S. gross domestic product, and the Fed’s decision to slash interest ratesfurther and restart its quantitative easing asset purchasing program -- along with a range of other stimulus programs -- providedsupport for U.S. and global equity markets in the following months. As economies in Asia and Europe, as well as parts of the U.S.,began to reopen in the second quarter of 2020, global prices both for equity and fixed income assets rose. Within U.S. equity mar-kets, large cap stocks generally outperformed mid cap and small cap stocks and growth stocks outperformed value stocks during thereporting period.
2 J.P. MORGAN SMALL CAP FUNDS JUNE 30, 2020

JPMorgan Small Cap Blend FundF U N D C O M M E N T A R YTWELVE MONTHS ENDED JUNE 30 , 2 020 (Unaud i ted )
REPORTING PERIOD RETURN:
Fund (Class A Shares, without a sales charge)* . . . . . . . . . . . . . . . . . . . . . . . . . . . . . . . . . . . . . . . . . . . . . . . . . . . . . . . . . . (0.24)%Russell 2000 Index . . . . . . . . . . . . . . . . . . . . . . . . . . . . . . . . . . . . . . . . . . . . . . . . . . . . . . . . . . . . . . . . . . . . . . . . . . . . . . . . (6.63)%
Net Assets as of 6/30/2020 (In Thousands) . . . . . . . . . . . . . . . . . . . . . . . . . . . . . . . . . . . . . . . . . . . . . . . . . . . . . . . . . . . . . $472,859
INVESTMENT OBJECTIVE**The JPMorgan Small Cap Blend Fund (the “Fund”) seeks capitalgrowth over the long term.
WHAT WERE THE MAIN DRIVERS OF THE FUND’SPERFORMANCE?The Fund’s Class A Shares, without a sales charge, out-performed the Russell 2000 Index (the “Benchmark”) for thetwelve months ended June 30, 2020. The Fund’s securityselection and overweight position in the information technol-ogy sector and its security selection in the industrials sectorwere leading contributors to performance relative to theBenchmark, while the Fund’s security selection in the consumerdiscretionary sector was the sole sector detractor from relativeperformance.
Leading individual contributors to relative performanceincluded the Fund’s overweight positions in Teladoc Health Inc.and Inphi Corp. and its out-of-Benchmark position in HorizonTherapeutics PLC. Shares of Teladoc Health, a provider ofonline health care services, rose amid investor expectationsthat the company would benefit from at-home quarantines inresponse to the COVID-19 pandemic. Shares of Inphi, a semi-conductor components manufacturer, rose amid investorexpectations that it would benefit from the global transition to5G telecommunications networks. Shares of Horizon Ther-apeutics, a pharmaceuticals company, rose after an advisorycommittee of the U.S. Food and Drug Administration recom-mended approval of the company’s drug for thyroid eyedisease.
Leading individual detractors from relative performance includedthe Fund’s underweight position in Quidel Corp., its out-of-Benchmark position in Sage Therapeutics Inc. and its overweightposition in Cinemark Holdings Inc. Shares of Quidel, a medicaldiagnostics testing manufacturer, rose amid investor expect-ations for increased demand for COVID-19 testing kits. Shares ofSage Therapeutics, a drug development company, fell after itstreatment for depressive disorder failed in a Phase 3 clinical trial.Shares of Cinemark Holdings, a cinema chain operator, fell afterthe company closed movie theaters in response to at-homequarantines due to the COVID-19 pandemic.
HOW WAS THE FUND POSITIONED?The Fund’s portfolio managers utilized a bottom-up approachto stock selection, researching individual companies in an effort
to construct a portfolio of companies that are attractively val-ued and stocks that have a history of growth. The Fund’sportfolio managers preferred to invest in high quality compa-nies with durable franchises that, in their view, possessed theability to generate consistent earnings. The Fund is positionedto invest in small cap companies across both growth and valuestyles.
TOP TEN EQUITY HOLDINGS OF THE PORTFOLIO***
1. Independent Bank Corp. . . . . . . . . . . . . . . . . . . . . . 1.1%2. ITT, Inc. . . . . . . . . . . . . . . . . . . . . . . . . . . . . . . . . . . 1.03. Simpson Manufacturing Co., Inc. . . . . . . . . . . . . . . . 0.94. Lithia Motors, Inc., Class A . . . . . . . . . . . . . . . . . . . . 0.95. Applied Industrial Technologies, Inc. . . . . . . . . . . . . 0.96. Texas Roadhouse, Inc. . . . . . . . . . . . . . . . . . . . . . . . 0.97. Littelfuse, Inc. . . . . . . . . . . . . . . . . . . . . . . . . . . . . . 0.88. Helen of Troy Ltd. . . . . . . . . . . . . . . . . . . . . . . . . . . 0.89. Inphi Corp. . . . . . . . . . . . . . . . . . . . . . . . . . . . . . . . . 0.7
10. Terreno Realty Corp. . . . . . . . . . . . . . . . . . . . . . . . . 0.7
PORTFOLIO COMPOSITION BY SECTOR***
Industrials . . . . . . . . . . . . . . . . . . . . . . . . . . . . . . . . . . . . 16.7%Information Technology . . . . . . . . . . . . . . . . . . . . . . . . . 16.7Financials . . . . . . . . . . . . . . . . . . . . . . . . . . . . . . . . . . . . 14.1Health Care . . . . . . . . . . . . . . . . . . . . . . . . . . . . . . . . . . . 13.7Consumer Discretionary . . . . . . . . . . . . . . . . . . . . . . . . . 10.8Real Estate . . . . . . . . . . . . . . . . . . . . . . . . . . . . . . . . . . . 6.3Utilities . . . . . . . . . . . . . . . . . . . . . . . . . . . . . . . . . . . . . . 3.1Consumer Staples . . . . . . . . . . . . . . . . . . . . . . . . . . . . . . 2.2Materials . . . . . . . . . . . . . . . . . . . . . . . . . . . . . . . . . . . . . 2.2Communication Services . . . . . . . . . . . . . . . . . . . . . . . . . 2.1Energy . . . . . . . . . . . . . . . . . . . . . . . . . . . . . . . . . . . . . . . 2.0Short-Term Investments . . . . . . . . . . . . . . . . . . . . . . . . . 10.1
* The return shown is based on net asset values calculated forshareholder transactions and may differ from the return shown inthe financial highlights, which reflects adjustments made to thenet asset values in accordance with accounting principles gen-erally accepted in the United States of America.
** The adviser seeks to achieve the Fund’s objective. There can beno guarantee it will be achieved.
*** Percentages indicated are based on total investments as ofJune 30, 2020. The Fund’s portfolio composition is subject tochange.
JUNE 30, 2020 J.P. MORGAN SMALL CAP FUNDS 3

JPMorgan Small Cap Blend FundF U N D C O M M E N T A R YTWELVE MONTHS ENDED JUNE 30 , 2 020 (Unaud i ted ) ( con t inued )
AVERAGE ANNUAL TOTAL RETURNS AS OF JUNE 30, 2020
INCEPTION DATE OFCLASS 1 YEAR 5 YEAR 10 YEAR
CLASS A SHARES May 19, 1997With Sales Charge* (5.50)% 8.31% 13.28%Without Sales Charge (0.24) 9.48 13.89
CLASS C SHARES January 7, 1998With CDSC** (1.75) 8.93 13.31Without CDSC (0.75) 8.93 13.31
CLASS I SHARES April 5, 1999 0.02 9.75 14.21CLASS R6 SHARES July 2, 2018 0.27 10.03 14.54
* Sales Charge for Class A Shares is 5.25%.** Assumes a 1% CDSC (contingent deferred sales charge) for the one year period and 0% CDSC thereafter.
TEN YEAR PERFORMANCE (6/30/10 TO 6/30/20)
JPMorgan Small Cap Blend Fund - Class A Shares Russell 2000 Index
6/10 6/11 6/12 6/13 6/14 6/15 6/16 6/206/196/186/17
20,000
30,000
$40,000
0
10,000
$27,142$34,807
The performance quoted is past performance and is not a guarantee offuture results. Mutual funds are subject to certain market risks. Investmentreturns and principal value of an investment will fluctuate so that an invest-or’s shares, when redeemed, may be worth more or less than their originalcost. Current performance may be higher or lower than the performancedata shown. For up-to-date month-end performance information please call1-800-480-4111.
Returns for Class R6 Shares prior to their inception dates are based on theperformance of Class I Shares. The actual returns for Class R6 Shares wouldhave been different than those shown because Class R6 have differentexpenses than Class I Shares.
The graph illustrates comparative performance for $10,000 invested in Class AShares of the JPMorgan Small Cap Blend Fund and the Russell 2000 Index fromJune 30, 2010 to June 30, 2020. The performance of the Fund assumesreinvestment of all dividends and capital gain distributions, if any, and includesa sales charge. The performance of the Russell 2000 Index does not reflect thededuction of expenses or a sales charge associated with a mutual fund and hasbeen adjusted to reflect reinvestment of all dividends and capital gain dis-tributions of the securities included in the benchmark, if applicable. The Russell2000 Index is an unmanaged index which measures the performance of the
2000 smallest stocks (on the basis of capitalization) in the Russell 3000 Index.Investors cannot invest directly in an index.
Effective June 1, 2018 (“the Effective Date”), the Fund’s investment strategieschanged. Although past performance is not necessarily an indication of how theFund will perform in the future, in view of these changes, the Fund’s perform-ance record prior to this date might be less relevant for investors consideringwhether to purchase shares of the Fund.
Class A Shares have a $1,000 minimum initial investment and carry a 5.25%sales charge.
Fund performance may reflect the waiver of the Fund’s fees and reimburse-ment of expenses for certain periods. Without these waivers and reimburse-ments, performance would have been lower. Also, performance shown in thissection does not reflect the deduction of taxes that a shareholder would pay onFund distributions or on gains resulting from redemptions of Fund shares.
The returns shown are based on net asset values calculated for shareholdertransactions and may differ from the returns shown in the financial highlights,which reflect adjustments made to the net asset values in accordance withaccounting principles generally accepted in the United States of America.
4 J.P. MORGAN SMALL CAP FUNDS JUNE 30, 2020

JPMorgan Small Cap Core FundF U N D C O M M E N T A R YTWELVE MONTHS ENDED JUNE 30 , 2 020 (Unaud i ted )
REPORTING PERIOD RETURN:
Fund (Class R5 Shares)* . . . . . . . . . . . . . . . . . . . . . . . . . . . . . . . . . . . . . . . . . . . . . . . . . . . . . . . . . . . . . . . . . . . . . . . . . . . (12.04)%Russell 2000 Index . . . . . . . . . . . . . . . . . . . . . . . . . . . . . . . . . . . . . . . . . . . . . . . . . . . . . . . . . . . . . . . . . . . . . . . . . . . . . . (6.63)%
Net Assets as of 6/30/2020 (In Thousands) . . . . . . . . . . . . . . . . . . . . . . . . . . . . . . . . . . . . . . . . . . . . . . . . . . . . . . . . . . . $ 349,861
INVESTMENT OBJECTIVE**The JPMorgan Small Cap Core Fund (the “Fund”) seeks capitalgrowth over the long term.
WHAT WERE THE MAIN DRIVERS OF THE FUND’SPERFORMANCE?The Fund’s Class R5 Shares underperformed the Russell 2000Index (the “Benchmark”) for the twelve months ended June 30,2020.
The Fund’s security selection in the health care and financialssectors was a leading detractor from performance relative tothe Benchmark, while the Fund’s security selection in the mate-rials and consumer discretionary sectors was a leadingcontributor to relative performance.
Leading individual detractors from relative performanceincluded the Fund’s underweight position in Teladoc Health Inc.and its overweight positions in Tivity Health Inc. and MRCGlobal Inc. Shares of Teladoc Health, a provider of online healthcare services, rose amid investor expectations that the com-pany would benefit from at-home quarantines in response tothe COVID-19 pandemic. Shares of Tivity Health, a provider ofweight loss and fitness products, fell after the companyreported lower-than-expected earnings and revenue for thefourth quarter of 2019. Shares of MRC Global, a supplier ofhardware to the petroleum and natural industries, fell amid asharp decline in global demand for oil and natural gas duringthe reporting period.
Leading individual contributors to relative performanceincluded the Fund’s overweight positions in Stamps.com Inc.and Aircastle Ltd. and its out-of-Benchmark position in HorizonTherapeutics PLC. Shares of Stamps.com, an internet providerof postal services, rose after the company reported better-than-expected earnings for the fourth quarter of 2019 andissued an upbeat earnings forecast for 2020. Shares of Air-castle, an aircraft leasing company, rose ahead of its acquis-ition by Marubeni Corp. for $2.4 billion. Shares of HorizonTherapeutics, a pharmaceuticals company, rose after an advi-sory committee of the U.S. Food and Drug Administrationrecommended approval of the company’s drug for thyroid eyedisease.
HOW WAS THE FUND POSITIONED?In accordance with its investment process, the Fund’s portfoliomanagers take limited sector bets and construct the Fund so
that stock selection is typically the primary driver of the Fund’srelative performance versus the Benchmark. The Fund’s portfo-lio managers employ a bottom-up approach to stock selection,using quantitative screening and proprietary analysis to con-struct a portfolio of companies that they believe are attractivelyvalued and possess strong momentum. During the reportingperiod, the Fund was managed and positioned in accordancewith this investment process.
TOP TEN EQUITY HOLDINGS OF THE PORTFOLIO***
1. Deckers Outdoor Corp. . . . . . . . . . . . . . . . . . . . . . . . 1.1%2. Magellan Health, Inc. . . . . . . . . . . . . . . . . . . . . . . . . 1.03. Horizon Therapeutics plc . . . . . . . . . . . . . . . . . . . . . 0.84. Argan, Inc. . . . . . . . . . . . . . . . . . . . . . . . . . . . . . . . . 0.85. ArcBest Corp. . . . . . . . . . . . . . . . . . . . . . . . . . . . . . . 0.86. Hub Group, Inc., Class A . . . . . . . . . . . . . . . . . . . . . . 0.87. Sanmina Corp. . . . . . . . . . . . . . . . . . . . . . . . . . . . . . 0.88. STAG Industrial, Inc. . . . . . . . . . . . . . . . . . . . . . . . . . 0.79. Cornerstone OnDemand, Inc. . . . . . . . . . . . . . . . . . . 0.7
10. Commercial Metals Co. . . . . . . . . . . . . . . . . . . . . . . 0.7
PORTFOLIO COMPOSITION BY SECTOR***
Health Care . . . . . . . . . . . . . . . . . . . . . . . . . . . . . . . . . . . 19.3%Financials . . . . . . . . . . . . . . . . . . . . . . . . . . . . . . . . . . . . 15.0Industrials . . . . . . . . . . . . . . . . . . . . . . . . . . . . . . . . . . . . 14.4Information Technology . . . . . . . . . . . . . . . . . . . . . . . . . 11.7Consumer Discretionary . . . . . . . . . . . . . . . . . . . . . . . . . 9.9Real Estate . . . . . . . . . . . . . . . . . . . . . . . . . . . . . . . . . . . 6.1Materials . . . . . . . . . . . . . . . . . . . . . . . . . . . . . . . . . . . . . 4.4Utilities . . . . . . . . . . . . . . . . . . . . . . . . . . . . . . . . . . . . . . 3.1Consumer Staples . . . . . . . . . . . . . . . . . . . . . . . . . . . . . . 2.6Communication Services . . . . . . . . . . . . . . . . . . . . . . . . . 2.5Energy . . . . . . . . . . . . . . . . . . . . . . . . . . . . . . . . . . . . . . . 1.9Short-Term Investments . . . . . . . . . . . . . . . . . . . . . . . . . 9.1
* The return shown is based on net asset values calculated forshareholder transactions and may differ from the return shown inthe financial highlights, which reflects adjustments made to thenet asset values in accordance with accounting principlesgenerally accepted in the United States of America.
** The adviser seeks to achieve the Fund’s objective. There can beno guarantee it will be achieved.
*** Percentages indicated are based on total investments as ofJune 30, 2020. The Fund’s portfolio composition is subject tochange.
JUNE 30, 2020 J.P. MORGAN SMALL CAP FUNDS 5

JPMorgan Small Cap Core FundF U N D C O M M E N T A R YTWELVE MONTHS ENDED JUNE 30 , 2 020 (Unaud i ted ) ( con t inued )
AVERAGE ANNUAL TOTAL RETURNS AS OF JUNE 30, 2020
INCEPTION DATE OFCLASS 1 YEAR 5 YEAR 10 YEAR
CLASS A SHARES May 31, 2016With Sales Charge* (17.00)% 1.31% 9.71%Without Sales Charge (12.40) 2.41 10.30
CLASS C SHARES May 31, 2016With CDSC** (13.86) 1.99 10.08Without CDSC (12.86) 1.99 10.08
CLASS I SHARES January 3, 2017 (12.20) 2.64 10.42CLASS R2 SHARES July 31, 2017 (12.63) 2.06 9.73CLASS R3 SHARES July 31, 2017 (12.42) 2.32 10.01CLASS R4 SHARES July 31, 2017 (12.19) 2.58 10.28CLASS R5 SHARES January 1, 1997 (12.04) 2.78 10.50CLASS R6 SHARES May 31, 2016 (11.97) 2.83 10.53
* Sales Charge for Class A Shares is 5.25%.** Assumes a 1% CDSC (contingent deferred sales charge) for the one year period and 0% CDSC thereafter.
TEN YEAR PERFORMANCE (6/30/10 TO 6/30/20)
6/10 6/11 6/12 6/13 6/14 6/15 6/16 6/206/196/186/17
Russell 2000 Index
0
10,000
20,000
30,000
$40,000
JPMorgan Small Cap Core Fund - Class R5 Shares
$27,142
$27,139
The performance quoted is past performance and is not a guarantee offuture results. Mutual funds are subject to certain market risks. Investmentreturns and principal value of an investment will fluctuate so that an invest-or’s shares, when redeemed, may be worth more or less than their originalcost. Current performance may be higher or lower than the performancedata shown. For up-to-date month-end performance information please call1-800-480-4111.
Returns for Class A, Class C, Class I, Class R2, Class R3, Class R4 and Class R6Shares prior to their inception dates are based on the performance of Class R5Shares. The actual returns of Class A, Class C, Class I, Class R2, Class R3 andClass R4 Shares would have been lower than those shown because theseclasses have higher expenses than Class R5 Shares. The actual returns of theClass R6 Shares would have been different than those shown because Class R6Shares have different expenses than Class R5 Shares.
The graph illustrates comparative performance for $10,000 invested in Class R5Shares of the JPMorgan Small Cap Core Fund and the Russell 2000 Index fromJune 30, 2010 to June 30, 2020. The performance of the Fund assumesreinvestment of all dividends and capital gain distributions, if any, and does not
include a sales charge. The performance of the Russell 2000 Index does notreflect the deduction of expenses or a sales charge associated with a mutualfund and has been adjusted to reflect reinvestment of all dividends and capitalgain distributions of the securities included in the benchmark, if applicable. TheRussell 2000 Index is an unmanaged index which measures the performance ofthe 2000 smallest stocks (on the basis of capitalization) in the Russell 3000Index. Investors cannot invest directly in an index.
Class R5 Shares have no minimum initial investment.
Fund performance may reflect the waiver of the Fund’s fees and reimburse-ment of expenses for certain periods. Without these waivers and reimburse-ments, performance would have been lower. Also, performance shown in thissection does not reflect the deduction of taxes that a shareholder would pay onFund distributions or on gains resulting from redemptions of Fund shares.
The returns shown are based on net asset values calculated for shareholdertransactions and may differ from the returns shown in the financial highlights,which reflect adjustments made to the net asset values in accordance withaccounting principles generally accepted in the United States of America.
6 J.P. MORGAN SMALL CAP FUNDS JUNE 30, 2020

JPMorgan Small Cap Equity FundF U N D C O M M E N T A R YTWELVE MONTHS ENDED JUNE 30 , 2 020 (Unaud i ted )
REPORTING PERIOD RETURN:
Fund (Class A Shares, without a sales charge)* . . . . . . . . . . . . . . . . . . . . . . . . . . . . . . . . . . . . . . . . . . . . . . . . . . . . . . . . (4.11)%Russell 2000 Index . . . . . . . . . . . . . . . . . . . . . . . . . . . . . . . . . . . . . . . . . . . . . . . . . . . . . . . . . . . . . . . . . . . . . . . . . . . . . . (6.63)%
Net Assets as of 6/30/2020 (In Thousands) . . . . . . . . . . . . . . . . . . . . . . . . . . . . . . . . . . . . . . . . . . . . . . . . . . . . . . . . . . $6,595,486
INVESTMENT OBJECTIVE**The JPMorgan Small Cap Equity Fund (the “Fund”) seeks capitalgrowth over the long term.
WHAT WERE THE MAIN DRIVERS OF THE FUND’SPERFORMANCE?The Fund’s Class A Shares, without a sales charge, out-performed the Russell 2000 Index (the “Benchmark”) for thetwelve months ended June 30, 2020. The Fund’s securityselection and underweight position in the consumer discre-tionary sector and its security selection in the industrials sectorwere leading contributors to performance relative to theBenchmark, while the Fund’s underweight position and securityselection in the health care sector and its security selection inthe real estate sector were leading detractors from relativeperformance.
Leading individual contributors to relative performanceincluded the Fund’s out-of-Benchmark positions in Pool Corp.and West Pharmaceutical Services Inc. and its overweight posi-tion in Kinsale Capital Group Inc. Shares of Pool, a distributor orswimming pool supplies, rose amid investor expectations forincreased demand for its products during at-home quarantinesin response to the COVID-19 pandemic and after the companyincreased its quarter dividend by 22% and increased its sharerepurchase program by $200 million. Shares of West Pharma-ceutical Services, a manufacturer of drugs, vaccines and con-sumer health care products, rose amid investor expectationsthat the company will benefit from demand for testing andtreatments during the COVID-19 pandemic. Shares of KinsaleCapital Group, a provider of property and casualty insurance,rose amid consecutive quarters of better-than-expected earn-ings growth.
Leading individual detractors from relative performanceincluded the Fund’s overweight positions in Cinemark HoldingsInc. and Patterson-UTI Energy Inc. and its out-of-Benchmarkposition in Core Laboratories NV. Shares of Cinemark Holdings,a cinema chain operator, fell after the company closed movietheaters due to the COVID-19 pandemic. Shares of Patterson-UTI Energy, a provider of oil field services to the energy sector,fell amid a sharp decline in global prices for petroleum duringthe reporting period. Shares of Core Laboratories, a provider ofoilfield services to the energy sector, fell amid a sharp declinein global prices for petroleum during the reporting period.
HOW WAS THE FUND POSITIONED?The Fund’s portfolio managers employed a bottom-up approachto stock selection, constructing portfolios based on companyfundamentals and proprietary analysis. The Fund’s portfoliomanagers looked for companies that, in their view, had leadingcompetitive advantages, predictable and durable business mod-els, and sustainable free cash flow generation with managementteams committed to increasing intrinsic value.
TOP TEN EQUITY HOLDINGS OF THE PORTFOLIO***
1. Pool Corp. . . . . . . . . . . . . . . . . . . . . . . . . . . . . . . . . 2.7%2. AptarGroup, Inc. . . . . . . . . . . . . . . . . . . . . . . . . . . . 2.33. Toro Co. (The) . . . . . . . . . . . . . . . . . . . . . . . . . . . . . 2.34. Catalent, Inc. . . . . . . . . . . . . . . . . . . . . . . . . . . . . . . 2.25. Molina Healthcare, Inc. . . . . . . . . . . . . . . . . . . . . . . 1.76. West Pharmaceutical Services, Inc. . . . . . . . . . . . . . 1.77. BJ’s Wholesale Club Holdings, Inc. . . . . . . . . . . . . . . 1.68. LCI Industries . . . . . . . . . . . . . . . . . . . . . . . . . . . . . . 1.59. Brunswick Corp. . . . . . . . . . . . . . . . . . . . . . . . . . . . . 1.5
10. Performance Food Group Co. . . . . . . . . . . . . . . . . . . 1.5
PORTFOLIO COMPOSITION BY SECTOR***
Industrials . . . . . . . . . . . . . . . . . . . . . . . . . . . . . . . . . . . . 19.4%Financials . . . . . . . . . . . . . . . . . . . . . . . . . . . . . . . . . . . . 16.5Information Technology . . . . . . . . . . . . . . . . . . . . . . . . . 12.5Health Care . . . . . . . . . . . . . . . . . . . . . . . . . . . . . . . . . . . 12.4Consumer Discretionary . . . . . . . . . . . . . . . . . . . . . . . . . 11.4Materials . . . . . . . . . . . . . . . . . . . . . . . . . . . . . . . . . . . . . 6.1Real Estate . . . . . . . . . . . . . . . . . . . . . . . . . . . . . . . . . . . 5.7Consumer Staples . . . . . . . . . . . . . . . . . . . . . . . . . . . . . . 4.7Utilities . . . . . . . . . . . . . . . . . . . . . . . . . . . . . . . . . . . . . . 2.2Others (each less than 1.0%) . . . . . . . . . . . . . . . . . . . . . 0.9Short-Term Investments . . . . . . . . . . . . . . . . . . . . . . . . . 8.2
* The return shown is based on net asset values calculated forshareholder transactions and may differ from the return shown inthe financial highlights, which reflects adjustments made to thenet asset values in accordance with accounting principles gen-erally accepted in the United States of America.
** The adviser seeks to achieve the Fund’s objective. There can beno guarantee it will be achieved.
*** Percentages indicated are based on total investments as ofJune 30, 2020. The Fund’s portfolio composition is subject tochange.
JUNE 30, 2020 J.P. MORGAN SMALL CAP FUNDS 7

JPMorgan Small Cap Equity FundF U N D C O M M E N T A R YTWELVE MONTHS ENDED JUNE 30 , 2 020 (Unaud i ted ) ( con t inued )
AVERAGE ANNUAL TOTAL RETURNS AS OF JUNE 30, 2020
INCEPTION DATE OFCLASS 1 YEAR 5 YEAR 10 YEAR
CLASS A SHARES December 20, 1994With Sales Charge* (9.14)% 5.34% 11.71%Without Sales Charge (4.11) 6.48 12.31
CLASS C SHARES February 19, 2005With CDSC** (5.56) 5.97 11.76Without CDSC (4.56) 5.97 11.76
CLASS I SHARES May 7, 1996 (3.83) 6.78 12.63CLASS R2 SHARES November 3, 2008 (4.32) 6.22 12.03CLASS R3 SHARES September 9, 2016 (4.08) 6.50 12.32CLASS R4 SHARES September 9, 2016 (3.83) 6.78 12.63CLASS R5 SHARES May 15, 2006 (3.65) 6.99 12.86CLASS R6 SHARES May 31, 2016 (3.60) 7.04 12.88
* Sales Charge for Class A Shares is 5.25%.** Assumes a 1% CDSC (contingent deferred sales charge) for the one year period and 0% CDSC thereafter.
TEN YEAR PERFORMANCE (6/30/10 TO 6/30/20)
$30,252
6/10 6/11 6/12 6/13 6/14 6/15 6/16 6/206/196/186/17
0
10,000
20,000
$40,000
30,000
JPMorgan Small Cap Equity Fund - Class A Shares Russell 2000 Index
$27,142
The performance quoted is past performance and is not a guarantee of futureresults. Mutual funds are subject to certain market risks. Investment returnsand principal value of an investment will fluctuate so that an investor’s shares,when redeemed, may be worth more or less than their original cost. Currentperformance may be higher or lower than the performance data shown. Forup-to-date month-end performance information please call 1-800-480-4111.
Returns for Class R3 Shares prior to their inception date are based on the per-formance of Class A Shares. The actual returns of Class R3 Shares would havebeen similar to those shown because Class R3 Shares have similar expenses toClass A Shares at time of launch.
Returns for Class R4 Shares prior to their inception date are based on the per-formance of the Class I Shares. The actual returns for Class R4 Shares wouldhave been similar to those shown because Class R4 Shares have similarexpenses to Class I Shares.
Returns for Class R6 Shares prior to their inception date are based on the per-formance of the Class R5 Shares. The actual returns of Class R6 Shares wouldhave been different than those shown because Class R6 Shares have differentexpenses than Class R5 Shares.
The graph illustrates comparative performance for $10,000 invested in Class AShares of the JPMorgan Small Cap Equity Fund and the Russell 2000 Index from
June 30, 2010 to June 30, 2020. The performance of the Fund assumes reinvest-ment of all dividends and capital gain distributions, if any, and includes a salescharge. The performance of the Russell 2000 Index does not reflect the deductionof expenses or a sales charge associated with a mutual fund and has been adjustedto reflect reinvestment of all dividends and capital gain distributions of the secu-rities included in the benchmark, if applicable. The Russell 2000 Index is anunmanaged index which measures the performance of the 2000 smallest stocks(on the basis of capitalization) in the Russell 3000 Index. Investors cannot investdirectly in an index.
Class A Shares have a $1,000 minimum initial investment and carry a 5.25%sales charge.
Fund performance may reflect the waiver of the Fund’s fees and reimburse-ment of expenses for certain periods. Without these waivers and reimburse-ments, performance would have been lower. Also, performance shown in thissection does not reflect the deduction of taxes that a shareholder would pay onFund distributions or on gains resulting from redemptions of Fund shares.
The returns shown are based on net asset values calculated for shareholdertransactions and may differ from the returns shown in the financial highlights,which reflect adjustments made to the net asset values in accordance withaccounting principles generally accepted in the United States of America.
8 J.P. MORGAN SMALL CAP FUNDS JUNE 30, 2020

JPMorgan Small Cap Growth FundF U N D C O M M E N T A R YTWELVE MONTHS ENDED JUNE 30 , 2 020 (Unaud i ted )
REPORTING PERIOD RETURN:
Fund (Class A Shares, without a sales charge)* . . . . . . . . . . . . . . . . . . . . . . . . . . . . . . . . . . . . . . . . . . . . . . . . . . . . . . . . 16.99%Russell 2000 Growth Index . . . . . . . . . . . . . . . . . . . . . . . . . . . . . . . . . . . . . . . . . . . . . . . . . . . . . . . . . . . . . . . . . . . . . . . . 3.48%
Net Assets as of 6/30/2020 (In Thousands) . . . . . . . . . . . . . . . . . . . . . . . . . . . . . . . . . . . . . . . . . . . . . . . . . . . . . . . . . . $3,960,153
INVESTMENT OBJECTIVE**The JPMorgan Small Cap Growth Fund (the “Fund”) seeks long-term capital growth primarily by investing in a portfolio ofequity securities of small-capitalization and emerging growthcompanies.
WHAT WERE THE MAIN DRIVERS OF THE FUND’SPERFORMANCE?The Fund’s Class A Shares, without a sales charge, out-performed the Russell 2000 Growth Index (the “Benchmark”)for the twelve months ended June 30, 2020. The Fund’s secu-rity selection and overweight position in the information tech-nology sector and its security selection in the health care sectorwere leading contributors to performance relative to theBenchmark. While there were no sector detractors from rela-tive performance, the utilities sector, in which the Fund had noholdings, and the Fund’s security selection in the consumerdiscretionary sector were the smallest contributors to relativeperformance.
Leading individual contributors to relative performanceincluded the Fund’s overweight positions in Teladoc Health Inc.and Inphi Inc., and its out-of-Benchmark position in HorizonTherapeutics PLC. Shares of Teladoc Health, a provider ofonline health care services, rose amid investor expectationsthat the company would benefit from at-home quarantines inresponse to the COVID-19 pandemic. Shares of Inphi, a semi-conductor components manufacturer, rose amid investorexpectations that it would benefit from the global transition toso-called 5G telecommunications networks. Shares of HorizonTherapeutics, a pharmaceuticals company, rose after an advi-sory committee of the U.S. Food and Drug Administrationrecommended approval of the company’s drug for thyroid eyedisease.
Leading individual detractors from relative performanceincluded the Fund’s underweight position in Quidel Corp., itsoverweight position in Hudson Ltd. and its out-of-Benchmarkposition in Sage Therapeutics Inc. Shares of Quidel, a medicaldiagnostics testing manufacturer that was not held in the Fund,rose amid investor expectations for increased demand forCOVID-19 testing kits. Shares of Hudson, a retailer of travelproducts, fell as passenger traffic fell sharply in response to theCOVID-19 pandemic. Shares of Sage Therapeutics, a drugdevelopment company, fell after its treatment for depressivedisorder failed in a Phase 3 clinical trial.
HOW WAS THE FUND POSITIONED?The Fund’s portfolio managers utilized a bottom-up approachto stock selection, researching individual companies in an effortto construct portfolios of stocks that have strong fundamentals.The Fund’s portfolio managers preferred to invest in high qual-ity companies with durable franchises that, in their view, pos-sessed the ability to generate strong future earnings growth.
TOP TEN EQUITY HOLDINGS OF THE PORTFOLIO***
1. Inphi Corp. . . . . . . . . . . . . . . . . . . . . . . . . . . . . . . . . 1.6%2. Natera, Inc. . . . . . . . . . . . . . . . . . . . . . . . . . . . . . . . 1.53. Advanced Drainage Systems, Inc. . . . . . . . . . . . . . . 1.54. National Vision Holdings, Inc. . . . . . . . . . . . . . . . . . 1.35. John Bean Technologies Corp. . . . . . . . . . . . . . . . . . 1.36. Halozyme Therapeutics, Inc. . . . . . . . . . . . . . . . . . . 1.37. Lithia Motors, Inc., Class A . . . . . . . . . . . . . . . . . . . . 1.38. Horizon Therapeutics plc . . . . . . . . . . . . . . . . . . . . . 1.39. MKS Instruments, Inc. . . . . . . . . . . . . . . . . . . . . . . . 1.3
10. Envestnet, Inc. . . . . . . . . . . . . . . . . . . . . . . . . . . . . . 1.3
PORTFOLIO COMPOSITION BY SECTOR***
Health Care . . . . . . . . . . . . . . . . . . . . . . . . . . . . . . . . . . . 26.5%Information Technology . . . . . . . . . . . . . . . . . . . . . . . . . 23.3Industrials . . . . . . . . . . . . . . . . . . . . . . . . . . . . . . . . . . . . 15.3Consumer Discretionary . . . . . . . . . . . . . . . . . . . . . . . . . 14.1Financials . . . . . . . . . . . . . . . . . . . . . . . . . . . . . . . . . . . . 3.4Consumer Staples . . . . . . . . . . . . . . . . . . . . . . . . . . . . . . 3.1Real Estate . . . . . . . . . . . . . . . . . . . . . . . . . . . . . . . . . . . 2.1Communication Services . . . . . . . . . . . . . . . . . . . . . . . . . 2.0Short-Term Investments . . . . . . . . . . . . . . . . . . . . . . . . . 10.2
* The return shown is based on net asset values calculated forshareholder transactions and may differ from the return shown inthe financial highlights, which reflects adjustments made to thenet asset values in accordance with accounting principles gen-erally accepted in the United States of America.
** The adviser seeks to achieve the Fund’s objective. There can beno guarantee it will be achieved.
*** Percentages indicated are based on total investments as ofJune 30, 2020. The Fund’s portfolio composition is subject tochange.
JUNE 30, 2020 J.P. MORGAN SMALL CAP FUNDS 9

JPMorgan Small Cap Growth FundF U N D C O M M E N T A R YTWELVE MONTHS ENDED JUNE 30 , 2 020 (Unaud i ted ) ( con t inued )
AVERAGE ANNUAL TOTAL RETURNS AS OF JUNE 30, 2020
INCEPTION DATE OFCLASS 1 YEAR 5 YEAR 10 YEAR
CLASS A SHARES July 1, 1991With Sales Charge* 10.85% 12.66% 15.66%Without Sales Charge 16.99 13.87 16.29
CLASS C SHARES November 4, 1997With CDSC** 15.42 13.30 15.70Without CDSC 16.42 13.30 15.70
CLASS I SHARES March 26, 1996 17.31 14.16 16.58CLASS L SHARES February 19, 2005 17.46 14.33 16.75CLASS R2 SHARES November 3, 2008 16.71 13.59 15.99CLASS R3 SHARES July 31, 2017 16.93 13.86 16.28CLASS R4 SHARES July 31, 2017 17.32 14.16 16.58CLASS R5 SHARES September 9, 2016 17.49 14.33 16.75CLASS R6 SHARES November 30, 2010 17.60 14.45 16.86
* Sales Charge for Class A Shares is 5.25%.** Assumes a 1% CDSC (contingent deferred sales charge) for the one year period and 0% CDSC thereafter.
TEN YEAR PERFORMANCE (6/30/10 TO 6/30/20)
$42,839
6/10 6/176/11 6/12 6/13 6/14 6/15 6/16 6/206/196/18
0
10,000
20,000
$50,000
30,000
JPMorgan Small Cap Growth Fund - Class A Shares Russell 2000 Growth Index
$33,70440,000
The performance quoted is past performance and is not a guarantee offuture results. Mutual funds are subject to certain market risks. Investmentreturns and principal value of an investment will fluctuate so that an invest-or’s shares, when redeemed, may be worth more or less than their originalcost. Current performance may be higher or lower than the performancedata shown. For up-to-date month-end performance information please call1-800-480-4111.
Returns for Class R3 Shares prior to their inception date are based on the per-formance of Class A Shares. Prior performance for Class R3 Shares has beenadjusted to reflect the differences in expenses between classes.
Returns for Class R4 Shares prior to their inception date are based on the per-formance of Class I Shares. Prior performance for Class R4 Shares has beenadjusted to reflect the differences in expenses between classes.
Returns for Class R5 and Class R6 Shares prior to their inception dates arebased on the performance of Class L Shares. The actual returns for Class R5 andClass R6 Shares would have been different than those shown because Class R5and Class R6 Shares have different expenses than Class L Shares.
The graph illustrates comparative performance for $10,000 invested in Class AShares of the JPMorgan Small Cap Growth Fund and the Russell 2000 GrowthIndex from June 30, 2010 to June 30, 2020. The performance of the Fund
assumes reinvestment of all dividends and capital gain distributions, if any, andincludes a sales charge. The performance of the Russell 2000 Growth Indexdoes not reflect the deduction of expenses or a sales charge associated with amutual fund and has been adjusted to reflect reinvestment of all dividends andcapital gain distributions of the securities included in the benchmark, if appli-cable. The Russell 2000 Growth Index is an unmanaged index which measuresthe performance of those Russell 2000 companies with higher price-to-bookratios and higher forecasted growth values. Investors cannot invest directly inan index.
Class A Shares have a $1,000 minimum initial investment and carry a 5.25%sales charge.
Fund performance may reflect the waiver of the Fund’s fees and reimburse-ment of expenses for certain periods. Without these waivers and reimburse-ments, performance would have been lower. Also, performance shown in thissection does not reflect the deduction of taxes that a shareholder would pay onFund distributions or on gains resulting from redemptions of Fund shares.
The returns shown are based on net asset values calculated for shareholdertransactions and may differ from the returns shown in the financial highlights,which reflect adjustments made to the net asset values in accordance withaccounting principles generally accepted in the United States of America.
10 J.P. MORGAN SMALL CAP FUNDS JUNE 30, 2020

JPMorgan Small Cap Value FundF U N D C O M M E N T A R YTWELVE MONTHS ENDED JUNE 30 , 2 020 (Unaud i ted )
REPORTING PERIOD RETURN:
Fund (Class I Shares)* . . . . . . . . . . . . . . . . . . . . . . . . . . . . . . . . . . . . . . . . . . . . . . . . . . . . . . . . . . . . . . . . . . . . . . . . . . . . (16.52)%Russell 2000 Value Index . . . . . . . . . . . . . . . . . . . . . . . . . . . . . . . . . . . . . . . . . . . . . . . . . . . . . . . . . . . . . . . . . . . . . . . . . . (17.48)%
Net Assets as of 6/30/2020 (In Thousands) . . . . . . . . . . . . . . . . . . . . . . . . . . . . . . . . . . . . . . . . . . . . . . . . . . . . . . . . . . . $ 955,573
INVESTMENT OBJECTIVE**The JPMorgan Small Cap Value Fund (the “Fund”) seeks long-term capital growth primarily by investing in equity securitiesof small-capitalization companies.
WHAT WERE THE MAIN DRIVERS OF THE FUND’SPERFORMANCE?The Fund’s Class I Shares outperformed the Russell 2000 ValueIndex (the “Benchmark”) for the twelve months ended June 30,2020. The Fund’s security selection in the consumer discre-tionary and utilities sectors was a leading contributor to per-formance relative to the Benchmark, while the Fund’s securityselection in the real estate sector and its underweight positionand security selection in the consumer staples sector wereleading detractors from relative performance.
Leading individual contributors to relative performanceincluded the Fund’s overweight positions in Stamps.com Inc.,FTI Consulting Inc. and Clearway Energy Inc. Shares ofStamps.com, an internet provider of postal services, rose afterthe company reported better-than-expected earnings for thefourth quarter of 2019 and issued an upbeat earnings forecastfor 2020. Shares of FTI Consulting, a provider of business andregulatory advisory services, rose in late 2019 after the com-pany reported better-than-expected earnings for its third quar-ter of 2019 and after the company unveiled a restructuring planlate in the reporting period. Shares of Clearway, an energyutility, rose after the company reported better-than-expectedrevenue for the first quarter of 2020.
Leading individual detractors from relative performanceincluded the Fund’s overweight positions in Allscripts Health-care Solutions Inc., Sinclair Broadcast Group Inc. and MRCGlobal Inc. Shares of Allscripts Healthcare Solutions, a healthcare information technology provider, fell after consecutivequarters of lower-than-expected earnings during the reportingperiod. Shares of Sinclair Broadcast Group, a television broad-caster, fell amid investor expectations for declining advertisingrevenue in response to the COVID-19 pandemic. Shares of MRCGlobal, a supplier of hardware to the petroleum and natural gasindustries, fell amid a sharp decline in global demand for oiland natural gas during the reporting period.
HOW WAS THE FUND POSITIONED?In accordance its investment process, the Fund’s portfoliomanagers take limited sector bets and construct the Fund so
that stock selection is typically the primary driver of the Fund’srelative performance versus the Benchmark. The Fund’s portfo-lio managers use a quantitative ranking methodology toidentify stocks in each sector that, in their view, trade at attrac-tive levels. Through bottom-up fundamental research, theyseek companies that they believe have attractive valuations,exhibit high earnings quality and have management teams thatmake effective capital deployment decisions. During the report-ing period, the Fund was managed and positioned in accord-ance with this investment process.
TOP TEN EQUITY HOLDINGS OF THE PORTFOLIO***
1. Xperi Holding Corp. . . . . . . . . . . . . . . . . . . . . . . . . . 1.1%2. United Bankshares, Inc. . . . . . . . . . . . . . . . . . . . . . . 1.03. Washington Federal, Inc. . . . . . . . . . . . . . . . . . . . . . 0.94. Builders FirstSource, Inc. . . . . . . . . . . . . . . . . . . . . . 0.95. Trustmark Corp. . . . . . . . . . . . . . . . . . . . . . . . . . . . . 0.96. TRI Pointe Group, Inc. . . . . . . . . . . . . . . . . . . . . . . . 0.87. EMCOR Group, Inc. . . . . . . . . . . . . . . . . . . . . . . . . . . 0.88. ABM Industries, Inc. . . . . . . . . . . . . . . . . . . . . . . . . . 0.89. Wabash National Corp. . . . . . . . . . . . . . . . . . . . . . . . 0.8
10. ArcBest Corp. . . . . . . . . . . . . . . . . . . . . . . . . . . . . . . 0.8
PORTFOLIO COMPOSITION BY SECTOR***
Financials . . . . . . . . . . . . . . . . . . . . . . . . . . . . . . . . . . . . 25.4%Industrials . . . . . . . . . . . . . . . . . . . . . . . . . . . . . . . . . . . . 16.7Consumer Discretionary . . . . . . . . . . . . . . . . . . . . . . . . . 9.0Real Estate . . . . . . . . . . . . . . . . . . . . . . . . . . . . . . . . . . . 8.6Information Technology . . . . . . . . . . . . . . . . . . . . . . . . . 7.9Health Care . . . . . . . . . . . . . . . . . . . . . . . . . . . . . . . . . . . 6.4Materials . . . . . . . . . . . . . . . . . . . . . . . . . . . . . . . . . . . . . 5.3Utilities . . . . . . . . . . . . . . . . . . . . . . . . . . . . . . . . . . . . . . 4.6Energy . . . . . . . . . . . . . . . . . . . . . . . . . . . . . . . . . . . . . . . 3.4Communication Services . . . . . . . . . . . . . . . . . . . . . . . . . 2.6Consumer Staples . . . . . . . . . . . . . . . . . . . . . . . . . . . . . . 1.9Short-Term Investments . . . . . . . . . . . . . . . . . . . . . . . . . 8.2
* The return shown is based on net asset values calculated forshareholder transactions and may differ from the return shown inthe financial highlights, which reflects adjustments made to thenet asset values in accordance with accounting principles gen-erally accepted in the United States of America.
** The adviser seeks to achieve the Fund’s objective. There can beno guarantee it will be achieved.
*** Percentages indicated are based on total investments as ofJune 30, 2020. The Fund’s portfolio composition is subject tochange.
JUNE 30, 2020 J.P. MORGAN SMALL CAP FUNDS 11

JPMorgan Small Cap Value FundF U N D C O M M E N T A R YTWELVE MONTHS ENDED JUNE 30 , 2 020 (Unaud i ted ) ( con t inued )
AVERAGE ANNUAL TOTAL RETURNS AS OF JUNE 30, 2020
INCEPTION DATE OFCLASS 1 YEAR 5 YEAR 10 YEAR
CLASS A SHARES January 27, 1995With Sales Charge* (21.14)% (1.66)% 6.58%Without Sales Charge (16.78) (0.59) 7.16
CLASS C SHARES March 22, 1999With CDSC** (18.14) (1.13) 6.55Without CDSC (17.14) (1.13) 6.55
CLASS I SHARES January 27, 1995 (16.52) (0.34) 7.43CLASS R2 SHARES November 3, 2008 (16.92) (0.84) 6.89CLASS R3 SHARES September 9, 2016 (16.73) (0.59) 7.15CLASS R4 SHARES September 9, 2016 (16.52) (0.35) 7.42CLASS R5 SHARES May 15, 2006 (16.44) (0.21) 7.54CLASS R6 SHARES February 22, 2005 (16.33) (0.10) 7.64
* Sales Charge for Class A Shares is 5.25%.** Assumes a 1% CDSC (contingent deferred sales charge) for the one year period and 0% CDSC thereafter.
TEN YEAR PERFORMANCE (6/30/10 TO 6/30/20)
500,000
1,000,000
1,500,000
2,000,000
$3,000,000
2,500,000$2,047,886
$2,123,273
JPMorgan Small Cap Value Fund - Class I Shares Russell 2000 Value Index
6/10 6/176/11 6/12 6/13 6/14 6/15 6/16 6/206/196/18
The performance quoted is past performance and is not a guarantee offuture results. Mutual funds are subject to certain market risks. Investmentreturns and principal value of an investment will fluctuate so that an invest-or’s shares, when redeemed, may be worth more or less than their originalcost. Current performance may be higher or lower than the performancedata shown. For up-to-date month-end performance information please call1-800-480-4111.
Returns for Class R3 Shares prior to their inception date are based on the per-formance of Class A Shares. Prior performance for Class R3 Shares has beenadjusted to reflect the differences in expenses between classes.
Returns for Class R4 Shares prior to their inception date are based on the per-formance of Class I Shares. Prior performance for Class R4 Shares has beenadjusted to reflect the differences in expenses between classes.
The graph illustrates comparative performance for $1,000,000 invested inClass I Shares of the JPMorgan Small Cap Value Fund and the Russell 2000Value Index from June 30, 2010 to June 30, 2020. The performance of the Fundassumes reinvestment of all dividends and capital gain distributions, if any, anddoes not include a sales charge. The performance of the Russell 2000 Value
Index does not reflect the deduction of expenses or a sales charge associatedwith a mutual fund and has been adjusted to reflect reinvestment of all divi-dends and capital gain distributions of the securities included in the benchmark,if applicable. The Russell 2000 Value Index is an unmanaged index which meas-ures the performance of those Russell 2000 companies with lower price-to-bookratios and lower forecasted growth values. Investors cannot invest directly in anindex.
Class I Shares have a $1,000,000 minimum initial investment.
Fund performance may reflect the waiver of the Fund’s fees and reimburse-ment of expenses for certain periods. Without these waivers and reimburse-ments, performance would have been lower. Also, performance shown in thissection does not reflect the deduction of taxes that a shareholder would pay onFund distributions or on gains resulting from redemptions of Fund shares.
The returns shown are based on net asset values calculated for shareholdertransactions and may differ from the returns shown in the financial highlights,which reflect adjustments made to the net asset values in accordance withaccounting principles generally accepted in the United States of America.
12 J.P. MORGAN SMALL CAP FUNDS JUNE 30, 2020

JPMorgan U.S. Small Company FundF U N D C O M M E N T A R YTWELVE MONTHS ENDED JUNE 30 , 2 020 (Unaud i ted )
REPORTING PERIOD RETURN:
Fund (Class L Shares)* . . . . . . . . . . . . . . . . . . . . . . . . . . . . . . . . . . . . . . . . . . . . . . . . . . . . . . . . . . . . . . . . . . . . . . . . . . . . . (6.37)%Russell 2000 Index . . . . . . . . . . . . . . . . . . . . . . . . . . . . . . . . . . . . . . . . . . . . . . . . . . . . . . . . . . . . . . . . . . . . . . . . . . . . . . . (6.63)%
Net Assets as of 6/30/2020 (In Thousands) . . . . . . . . . . . . . . . . . . . . . . . . . . . . . . . . . . . . . . . . . . . . . . . . . . . . . . . . . . . . $900,036
INVESTMENT OBJECTIVE**The JPMorgan U.S. Small Company Fund (the “Fund”) seeks toprovide high total return from a portfolio of small companystocks.
WHAT WERE THE MAIN DRIVERS OF THE FUND’SPERFORMANCE?The Fund’s Class L Shares outperformed the Russell 2000 Index(the “Benchmark”) for the twelve months ended June 30, 2020.The Fund’s security selection in the consumer discretionary andfinancials sectors was a leading contributor to performancerelative to the Benchmark, while the Fund’s security selectionin the health care and information technology sectors was aleading detractor from relative performance.
Leading individual contributors to relative performanceincluded the Fund’s overweight positions in Stamps.com Inc.,Forty Seven Inc. and Mersana Therapeutics Inc. Shares ofStamps.com, an internet provider of postal services, rose afterthe company reported better-than-expected earnings for thefourth quarter of 2019 and issued an upbeat earnings forecastfor 2020. Shares of Forty Seven, a drug development company,rose ahead of its March 2020 acquisition by Gilead Sciences Inc.Shares of Mersana Therapeutics, a cancer treatment develop-ment company, rose on better-than-expected earnings for thefirst quarter of 2020 and positive results from trials of itstreatment for ovarian cancer.
Leading individual detractors from relative performance includedthe Fund’s overweight positions in Allscripts Healthcare SolutionsInc. and Varex Imaging Corp., and its underweight position inTeladoc Health Inc. Shares of Allscripts Healthcare Solutions, ahealth care information technology provider, fell after consec-utive quarters of lower-than-expected earnings during thereporting period. Shares of Varex Imaging, a manufacturer ofx-ray imaging components, fell after the company reportedlower-than-expected earnings and revenue for its fiscal secondquarter. Shares of Teladoc Health, a provider of online healthcare services that was not held in the Fund, rose amid investorexpectations that the company would benefit from at-homequarantines in response to the COVID-19 pandemic.
HOW WAS THE FUND POSITIONED?In accordance with its investment process, the Fund’s portfoliomanagers take limited sector bets and construct the Fund sothat stock selection is typically the primary driver of the Fund’s
performance relative to the Benchmark. The Fund’s portfoliomanagers use a quantitative ranking methodology to identifystocks in each sector that, in their view, trade at attractive lev-els. Through bottom-up fundamental research, they seekcompanies that they believe have attractive valuations, exhibithigh earnings quality and have management teams that makeeffective capital deployment decisions. During the reportingperiod, the Fund was managed and positioned in accordancewith this investment process.
TOP TEN EQUITY HOLDINGS OF THE PORTFOLIO***
1. TRI Pointe Group, Inc. . . . . . . . . . . . . . . . . . . . . . . . 1.1%2. EMCOR Group, Inc. . . . . . . . . . . . . . . . . . . . . . . . . . . 1.03. Xperi Holding Corp. . . . . . . . . . . . . . . . . . . . . . . . . . 1.04. Avaya Holdings Corp. . . . . . . . . . . . . . . . . . . . . . . . . 1.05. Wabash National Corp. . . . . . . . . . . . . . . . . . . . . . . . 0.86. Trustmark Corp. . . . . . . . . . . . . . . . . . . . . . . . . . . . . 0.87. Allscripts Healthcare Solutions, Inc. . . . . . . . . . . . . . 0.88. Rambus, Inc. . . . . . . . . . . . . . . . . . . . . . . . . . . . . . . 0.89. Washington Federal, Inc. . . . . . . . . . . . . . . . . . . . . . 0.8
10. Perficient, Inc. . . . . . . . . . . . . . . . . . . . . . . . . . . . . . 0.8
PORTFOLIO COMPOSITION BY SECTOR***
Health Care . . . . . . . . . . . . . . . . . . . . . . . . . . . . . . . . . . . 19.2%Industrials . . . . . . . . . . . . . . . . . . . . . . . . . . . . . . . . . . . . 14.6Financials . . . . . . . . . . . . . . . . . . . . . . . . . . . . . . . . . . . . 13.9Information Technology . . . . . . . . . . . . . . . . . . . . . . . . . 12.6Consumer Discretionary . . . . . . . . . . . . . . . . . . . . . . . . . 10.2Real Estate . . . . . . . . . . . . . . . . . . . . . . . . . . . . . . . . . . . 5.5Materials . . . . . . . . . . . . . . . . . . . . . . . . . . . . . . . . . . . . . 3.9Consumer Staples . . . . . . . . . . . . . . . . . . . . . . . . . . . . . . 2.7Utilities . . . . . . . . . . . . . . . . . . . . . . . . . . . . . . . . . . . . . . 2.7Communication Services . . . . . . . . . . . . . . . . . . . . . . . . . 2.4Energy . . . . . . . . . . . . . . . . . . . . . . . . . . . . . . . . . . . . . . . 1.6Short-Term Investments . . . . . . . . . . . . . . . . . . . . . . . . . 10.7
* The return shown is based on net asset values calculated forshareholder transactions and may differ from the return shown inthe financial highlights, which reflects adjustments made to thenet asset values in accordance with accounting principles gen-erally accepted in the United States of America.
** The adviser seeks to achieve the Fund’s objective. There can beno guarantee it will be achieved.
*** Percentages indicated are based on total investments as ofJune 30, 2020. The Fund’s portfolio composition is subject tochange.
JUNE 30, 2020 J.P. MORGAN SMALL CAP FUNDS 13

JPMorgan U.S. Small Company FundF U N D C O M M E N T A R YTWELVE MONTHS ENDED JUNE 30 , 2 020 (Unaud i ted ) ( con t inued )
AVERAGE ANNUAL TOTAL RETURNS AS OF JUNE 30, 2020
INCEPTION DATE OFCLASS 1 YEAR 5 YEAR 10 YEAR
CLASS A SHARES November 1, 2007With Sales Charge* (11.63)% 0.79% 9.21%Without Sales Charge (6.76) 1.88 9.80
CLASS C SHARES November 1, 2007With CDSC** (8.25) 1.36 9.25Without CDSC (7.25) 1.36 9.25
CLASS I SHARES September 10, 2001 (6.51) 2.15 10.09CLASS L SHARES November 4, 1993 (6.37) 2.30 10.27CLASS R2 SHARES November 1, 2011 (7.01) 1.63 9.57CLASS R3 SHARES September 9, 2016 (6.78) 1.88 9.80CLASS R4 SHARES September 9, 2016 (6.55) 2.13 10.08CLASS R5 SHARES September 9, 2016 (6.36) 2.29 10.27CLASS R6 SHARES November 1, 2011 (6.27) 2.41 10.36
* Sales Charge for Class A Shares is 5.25%.** Assumes a 1% CDSC (contingent deferred sales charge) for the one year period and 0% CDSC thereafter.
TEN YEAR PERFORMANCE (6/30/10 TO 6/30/20)
1,000,000
3,000,000
5,000,000
7,000,000
9,000,000
$11,000,000
$7,976,152
$8,142,587
JPMorgan U.S. Small Company Fund - Class L Shares Russell 2000 Index
6/10 6/176/11 6/12 6/13 6/14 6/15 6/16 6/206/196/18
The performance quoted is past performance and is not a guarantee offuture results. Mutual funds are subject to certain market risks. Investmentreturns and principal value of an investment will fluctuate so that an invest-or’s shares, when redeemed, may be worth more or less than their originalcost. Current performance may be higher or lower than the performancedata shown. For up-to-date month-end performance information please call1-800-480-4111.
Returns for Class R4 Shares prior to their inception date are based on the per-formance of the Class I Shares. The actual returns for Class R4 Shares wouldhave been similar to those shown because Class R4 Shares have similarexpenses to Class I Shares.
Returns for Class R2 and Class R3 shares prior to their inception dates arebased on the performance of the Class A Shares. The actual returns of Class R2Shares would have been lower than those shown because Class R2 Shares havehigher expenses than Class A Shares. The actual returns for Class R3 Shareswould have been similar to those shown because Class R3 Shares have similarexpenses to Class A Shares.
Returns for Class R5 and Class R6 Shares prior to their inception dates arebased on the performance of the Class L Shares. The actual returns of Class R5Shares would have been similar to those shown because Class R5 Shares havesimilar expenses to Class L Shares. The actual returns of Class R6 Shares wouldhave been different than these shown because Class R6 Shares have differentexpenses than Class L Shares.
The graph illustrates comparative performance for $3,000,000 invested in Class LShares of the JPMorgan U.S. Small Company Fund and the Russell 2000 Index fromJune 30, 2010 to June 30, 2020. The performance of the Fund assumesreinvestment of all dividends and capital gain distributions, if any, and does notinclude a sales charge. The performance of the Russell 2000 Index does not reflectthe deduction of expenses associated with a mutual fund and has been adjusted toreflect reinvestment of all dividends and capital gain distributions of the securitiesincluded in the benchmark, if applicable. The Russell 2000 Index is an unmanagedindex which measures the performance of the 2000 smallest stocks (on the basis ofcapitalization) in the Russell 3000 Index. Investors cannot invest directly in anindex.
Class L Shares have a $3,000,000 minimum initial investment.
Fund performance may reflect the waiver of the Fund’s fees and reimburse-ment of expenses for certain periods. Without these waivers and reimburse-ments, performance would have been lower. Also, performance shown in thissection does not reflect the deduction of taxes that a shareholder would pay onFund distributions or on gains resulting from redemptions of Fund shares.
The returns shown are based on net asset values calculated for shareholdertransactions and may differ from the returns shown in the financial highlights,which reflect adjustments made to the net asset values in accordance withaccounting principles generally accepted in the United States of America.
14 J.P. MORGAN SMALL CAP FUNDS JUNE 30, 2020

JPMorgan Small Cap Blend FundS C H E D U L E O F P O R T F O L I O I N V E S T M E N T SAS OF JUNE 30 , 2 020
INVESTMENTSSHARES
(000)VALUE($000)
Common Stocks — 96.4%
Aerospace & Defense — 0.7%
Curtiss-Wright Corp. 24 2,159
National Presto Industries, Inc. 15 1,301
3,460
Auto Components — 0.7%
Fox Factory Holding Corp. * 27 2,202
LCI Industries (a) 11 1,229
3,431
Automobiles — 0.5%
Winnebago Industries, Inc. (a) 38 2,531
Banks — 9.8%
BancFirst Corp. 67 2,720
Camden National Corp. 92 3,189
City Holding Co. 25 1,603
Columbia Banking System, Inc. 115 3,271
Community Trust Bancorp, Inc. 57 1,861
Cullen/Frost Bankers, Inc. (a) 20 1,481
First Busey Corp. 155 2,890
First Commonwealth Financial Corp. 243 2,016
First Financial Bancorp 132 1,838
First Financial Bankshares, Inc. 48 1,388
First Hawaiian, Inc. 85 1,465
First Merchants Corp. 97 2,667
Great Western Bancorp, Inc. 147 2,023
Heritage Commerce Corp. 270 2,030
Heritage Financial Corp. 33 661
Independent Bank Corp. 167 2,481
Independent Bank Corp. 49 3,298
Lakeland Bancorp, Inc. 240 2,739
S&T Bancorp, Inc. 39 903
Signature Bank 8 828
Simmons First National Corp., Class A 162 2,772
Trustmark Corp. 61 1,507
45,631
Biotechnology — 8.5%
ACADIA Pharmaceuticals, Inc. * (a) 32 1,570
ADC Therapeutics SA (Switzerland) * (a) 40 1,877
Alector, Inc. * 32 772
Allogene Therapeutics, Inc. * (a) 21 880
Amicus Therapeutics, Inc. * 171 2,580
Atara Biotherapeutics, Inc. * 97 1,407
Avrobio, Inc. * 66 1,148
Biohaven Pharmaceutical Holding Co. Ltd. * 35 2,575
Blueprint Medicines Corp. * 27 2,069
INVESTMENTSSHARES
(000)VALUE($000)
Biotechnology — continued
Bridgebio Pharma, Inc. * (a) 30 979
Coherus Biosciences, Inc. * (a) 106 1,899
FibroGen, Inc. * 43 1,731
G1 Therapeutics, Inc. * 51 1,232
Generation Bio Co. * 16 343
Global Blood Therapeutics, Inc. * (a) 20 1,232
Halozyme Therapeutics, Inc. * 114 3,055
Heron Therapeutics, Inc. * (a) 86 1,267
Homology Medicines, Inc. * 57 862
Immunomedics, Inc. * 25 878
Intercept Pharmaceuticals, Inc. * (a) 20 941
Natera, Inc. * 70 3,489
Orchard Therapeutics plc, ADR (United Kingdom) * 44 261
REGENXBIO, Inc. * (a) 30 1,090
REVOLUTION Medicines, Inc. * 24 758
Rubius Therapeutics, Inc. * (a) 68 408
Sage Therapeutics, Inc. * (a) 25 1,056
Twist Bioscience Corp. * (a) 62 2,828
Viela Bio, Inc. * (a) 28 1,226
40,413
Building Products — 3.8%
Advanced Drainage Systems, Inc. 69 3,388
AZEK Co., Inc. (The) * 26 839
CSW Industrials, Inc. 35 2,431
Fortune Brands Home & Security, Inc. 17 1,118
Simpson Manufacturing Co., Inc. 57 4,780
Trex Co., Inc. * (a) 19 2,520
UFP Industries, Inc. 56 2,754
17,830
Capital Markets — 1.3%
Evercore, Inc., Class A 29 1,730
Focus Financial Partners, Inc., Class A * 41 1,365
LPL Financial Holdings, Inc. 41 3,180
6,275
Chemicals — 1.6%
Innospec, Inc. 32 2,462
Stepan Co. 23 2,221
Valvoline, Inc. 137 2,656
7,339
Commercial Services & Supplies — 2.5%
Brady Corp., Class A 53 2,463
Brink’s Co. (The) 25 1,160
Cimpress plc (Ireland) * 23 1,756
SEE NOTES TO FINANCIAL STATEMENTS.
JUNE 30, 2020 J.P. MORGAN SMALL CAP FUNDS 15

JPMorgan Small Cap Blend FundS C H E D U L E O F P O R T F O L I O I N V E S T M E N T SAS OF JUNE 30 , 2 020 (con t inued )
INVESTMENTSSHARES
(000)VALUE($000)
Common Stocks — continued
Commercial Services & Supplies — continued
Deluxe Corp. 51 1,205
Kimball International, Inc., Class B 126 1,462
MSA Safety, Inc. 20 2,289
UniFirst Corp. 8 1,470
11,805
Communications Equipment — 1.2%
Ciena Corp. * 34 1,868
EchoStar Corp., Class A * 69 1,937
Viavi Solutions, Inc. * (a) 133 1,693
5,498
Construction & Engineering — 0.5%
Comfort Systems USA, Inc. 64 2,598
Containers & Packaging — 0.7%
Graphic Packaging Holding Co. 154 2,153
Silgan Holdings, Inc. 43 1,390
3,543
Distributors — 0.5%
Pool Corp. 9 2,380
Diversified Consumer Services — 0.3%
Bright Horizons Family Solutions, Inc. * 9 1,077
OneSpaWorld Holdings Ltd. (Bahamas) (a) 44 212
1,289
Diversified Telecommunication Services — 0.7%
Bandwidth, Inc., Class A * (a) 14 1,757
Liberty Latin America Ltd., Class C (Chile) * 187 1,768
3,525
Electric Utilities — 0.3%
Portland General Electric Co. 37 1,548
Electrical Equipment — 0.7%
Generac Holdings, Inc. * 18 2,246
nVent Electric plc 55 1,030
3,276
Electronic Equipment, Instruments & Components — 3.2%
CTS Corp. (a) 93 1,873
ePlus, Inc. * 24 1,694
Fabrinet (Thailand) * 40 2,470
Littelfuse, Inc. 24 4,171
Plexus Corp. * (a) 29 2,018
SYNNEX Corp. 23 2,811
15,037
INVESTMENTSSHARES
(000)VALUE($000)
Equity Real Estate Investment Trusts (REITs) — 6.8%
American Campus Communities, Inc. 65 2,279
American Homes 4 Rent, Class A 120 3,238
Brixmor Property Group, Inc. 166 2,126
CubeSmart 38 1,020
EastGroup Properties, Inc. 13 1,518
Equity Commonwealth 78 2,519
Highwoods Properties, Inc. 54 2,024
JBG SMITH Properties 68 2,011
National Health Investors, Inc. 15 913
Rayonier, Inc. 82 2,041
Rexford Industrial Realty, Inc. 73 3,024
RLJ Lodging Trust 167 1,578
Sunstone Hotel Investors, Inc. 290 2,364
Terreno Realty Corp. (a) 69 3,648
Washington 78 1,741
32,044
Food & Staples Retailing — 0.9%
Grocery Outlet Holding Corp. * 51 2,071
Performance Food Group Co. * 74 2,147
4,218
Food Products — 1.1%
Flowers Foods, Inc. 100 2,243
Freshpet, Inc. * 35 2,901
5,144
Gas Utilities — 1.6%
Chesapeake Utilities Corp. 21 1,774
ONE Gas, Inc. 42 3,254
Southwest Gas Holdings, Inc. (a) 39 2,690
7,718
Health Care Equipment & Supplies — 1.9%
iRhythm Technologies, Inc. * 21 2,407
Nevro Corp. * 22 2,660
Shockwave Medical, Inc. * 40 1,884
Utah Medical Products, Inc. 21 1,825
8,776
Health Care Providers & Services — 2.1%
Acadia Healthcare Co., Inc. * (a) 45 1,131
Amedisys, Inc. * 13 2,590
Encompass Health Corp. 41 2,533
Ensign Group, Inc. (The) 44 1,835
Providence Service Corp. (The) * 22 1,735
9,824
SEE NOTES TO FINANCIAL STATEMENTS.
16 J.P. MORGAN SMALL CAP FUNDS JUNE 30, 2020

INVESTMENTSSHARES
(000)VALUE($000)
Common Stocks — continued
Health Care Technology — 0.1%
Evolent Health, Inc., Class A * (a) 97 690
Hotels, Restaurants & Leisure — 2.2%
Boyd Gaming Corp. 84 1,764
Cheesecake Factory, Inc. (The) (a) 38 860
Cracker Barrel Old Country Store, Inc. 14 1,553
Planet Fitness, Inc., Class A * 30 1,802
Texas Roadhouse, Inc. 83 4,345
10,324
Household Durables — 1.4%
Helen of Troy Ltd. * 22 4,080
La-Z-Boy, Inc. 36 964
TRI Pointe Group, Inc. * 96 1,414
6,458
Industrial Conglomerates — 0.2%
Carlisle Cos., Inc. 10 1,172
Insurance — 2.4%
Argo Group International Holdings Ltd. 10 366
eHealth, Inc. * 16 1,532
James River Group Holdings Ltd. 24 1,088
Old Republic International Corp. 116 1,891
Safety Insurance Group, Inc. 23 1,768
Selective Insurance Group, Inc. (a) 44 2,322
Selectquote, Inc. * 42 1,061
Third Point Reinsurance Ltd. (Bermuda) * 180 1,348
11,376
Interactive Media & Services — 0.2%
Cars.com, Inc. * 139 801
Internet & Direct Marketing Retail — 0.5%
Farfetch Ltd., Class A (United Kingdom) * 79 1,371
RealReal, Inc. (The) * (a) 76 968
2,339
IT Services — 1.7%
CSG Systems International, Inc. 57 2,349
I3 Verticals, Inc., Class A * 40 1,224
ManTech International Corp., Class A 37 2,528
Science Applications International Corp. 26 2,022
8,123
Leisure Products — 0.3%
Callaway Golf Co. (a) 88 1,541
Life Sciences Tools & Services — 0.4%
10X Genomics, Inc., Class A * 9 759
INVESTMENTSSHARES
(000)VALUE($000)
Life Sciences Tools & Services — continued
Adaptive Biotechnologies Corp. * 12 595
Personalis, Inc. * 45 579
1,933
Machinery — 6.0%
Alamo Group, Inc. (a) 23 2,330
Allison Transmission Holdings, Inc. 54 1,981
Blue Bird Corp. * 181 2,719
Graco, Inc. 32 1,550
Hillenbrand, Inc. 86 2,338
ITT, Inc. 84 4,953
John Bean Technologies Corp. 36 3,070
Kadant, Inc. 25 2,520
Lincoln Electric Holdings, Inc. 33 2,762
Mueller Industries, Inc. 75 2,006
Watts Water Technologies, Inc., Class A 27 2,226
28,455
Marine — 0.2%
Kirby Corp. * 14 761
Media — 1.4%
Hemisphere Media Group, Inc. * 156 1,535
New York Times Co. (The), Class A (a) 68 2,840
Nexstar Media Group, Inc., Class A (a) 25 2,111
6,486
Multiline Retail — 0.5%
Ollie’s Bargain Outlet Holdings, Inc. * (a) 23 2,259
Multi-Utilities — 0.4%
Unitil Corp. 43 1,922
Oil, Gas & Consumable Fuels — 2.2%
CNX Resources Corp. * (a) 183 1,583
Delek US Holdings, Inc. (a) 72 1,252
EQT Corp. (a) 134 1,596
Equitrans Midstream Corp. 174 1,446
Matador Resources Co. * (a) 257 2,185
PDC Energy, Inc. * 175 2,177
10,239
Personal Products — 0.3%
Inter Parfums, Inc. 34 1,640
Pharmaceuticals — 1.6%
Arvinas, Inc. * (a) 13 440
Horizon Therapeutics plc * 53 2,957
MyoKardia, Inc. * 6 563
Revance Therapeutics, Inc. * 90 2,188
SEE NOTES TO FINANCIAL STATEMENTS.
JUNE 30, 2020 J.P. MORGAN SMALL CAP FUNDS 17

JPMorgan Small Cap Blend FundS C H E D U L E O F P O R T F O L I O I N V E S T M E N T SAS OF JUNE 30 , 2 020 (con t inued )
INVESTMENTSSHARES
(000)VALUE($000)
Common Stocks — continued
Pharmaceuticals — continued
TherapeuticsMD, Inc. * 307 384
Tricida, Inc. * (a) 42 1,146
7,678
Professional Services — 0.3%
FTI Consulting, Inc. * 14 1,568
Road & Rail — 1.0%
Marten Transport Ltd. 89 2,236
Saia, Inc. * (a) 24 2,673
4,909
Semiconductors & Semiconductor Equipment — 4.5%
Cabot Microelectronics Corp. 17 2,345
Cree, Inc. * (a) 26 1,556
Enphase Energy, Inc. * 41 1,963
Entegris, Inc. 47 2,799
FormFactor, Inc. * 34 1,001
Inphi Corp. * (a) 31 3,683
MKS Instruments, Inc. 26 2,937
Monolithic Power Systems, Inc. 7 1,711
Semtech Corp. * 38 1,964
SolarEdge Technologies, Inc. * (a) 11 1,495
21,454
Software — 7.3%
Anaplan, Inc. * 40 1,810
Avalara, Inc. * 15 2,051
Bill.Com Holdings, Inc. * 18 1,615
Blackline, Inc. * 21 1,740
CyberArk Software Ltd. * 17 1,722
Dynatrace, Inc. * 20 801
Elastic NV * 27 2,531
Envestnet, Inc. * 40 2,917
Everbridge, Inc. * 13 1,767
Globant SA (Argentina) * (a) 12 1,848
HubSpot, Inc. * 12 2,800
Medallia, Inc. * (a) 46 1,152
Nuance Communications, Inc. * (a) 120 3,033
Progress Software Corp. 22 853
Proofpoint, Inc. * 15 1,637
Smartsheet, Inc., Class A * 48 2,441
Upland Software, Inc. * (a) 63 2,178
Zendesk, Inc. * 19 1,666
34,562
Specialty Retail — 2.8%
Aaron’s, Inc. 14 638
INVESTMENTSSHARES
(000)VALUE($000)
Specialty Retail — continued
Floor & Decor Holdings, Inc., Class A * 23 1,318
Hudson Ltd., Class A * 118 573
Lithia Motors, Inc., Class A 32 4,777
National Vision Holdings, Inc. * 102 3,113
Vroom, Inc. * 19 996
Williams-Sonoma, Inc. (a) 21 1,713
13,128
Textiles, Apparel & Luxury Goods — 2.0%
Carter’s, Inc. 32 2,572
Columbia Sportswear Co. (a) 20 1,595
Kontoor Brands, Inc. 77 1,380
Oxford Industries, Inc. (a) 44 1,916
Steven Madden Ltd. (a) 73 1,802
9,265
Thrifts & Mortgage Finance — 1.8%
Premier Financial Corp. 187 3,301
Radian Group, Inc. 112 1,737
WSFS Financial Corp. 113 3,249
8,287
Trading Companies & Distributors — 1.9%
Applied Industrial Technologies, Inc. 70 4,370
Rush Enterprises, Inc., Class A 42 1,752
SiteOne Landscape Supply, Inc. * (a) 25 2,853
8,975
Water Utilities — 0.9%
American States Water Co. 24 1,902
Middlesex Water Co. 35 2,364
4,266
Total Common Stocks(Cost $407,786) 455,744
NO. OFRIGHTS
(000)
Rights — 0.0% (b)
Biotechnology — 0.0% (b)
Clementia Pharmaceuticals, Inc. (Canada) * ‡(Cost $—) 51 —(c)
SEE NOTES TO FINANCIAL STATEMENTS.
18 J.P. MORGAN SMALL CAP FUNDS JUNE 30, 2020

INVESTMENTSSHARES
(000)VALUE($000)
Short-Term Investments — 10.9%
Investment Companies — 3.6%
JPMorgan Prime Money Market Fund Class IMShares, 0.47% (d) (e)(Cost $17,247) 17,239 17,254
Investment of Cash Collateral from Securities Loaned — 7.3%
JPMorgan Securities Lending Money Market FundAgency SL Class Shares, 0.51% (d) (e) 28,004 28,015
JPMorgan U.S. Government Money Market FundClass IM Shares, 0.14% (d) (e) 6,247 6,247
Total Investment of Cash Collateral fromSecurities Loaned(Cost $34,260) 34,262
Total Short-Term Investments(Cost $51,507) 51,516
Total Investments — 107.3%(Cost $459,293) 507,260
Liabilities in Excess ofOther Assets — (7.3)% (34,401)
NET ASSETS — 100.0% 472,859
Percentages indicated are based on net assets.
Abbreviations
ADR American Depositary Receipt
(a) The security or a portion of this security is on loan at June 30,2020. The total value of securities on loan at June 30, 2020 isapproximately $33,465,000.
(b) Amount rounds to less than 0.1% of net assets.(c) Amount rounds to less than one thousand.(d) Investment in an affiliated fund, which is registered under the
Investment Company Act of 1940, as amended, and is advised byJ.P. Morgan Investment Management Inc.
(e) The rate shown is the current yield as of June 30, 2020.* Non-income producing security.‡ Value determined using significant unobservable inputs.
SEE NOTES TO FINANCIAL STATEMENTS.
JUNE 30, 2020 J.P. MORGAN SMALL CAP FUNDS 19

JPMorgan Small Cap Core FundS C H E D U L E O F P O R T F O L I O I N V E S T M E N T SAS OF JUNE 30 , 2 020
INVESTMENTSSHARES
(000)VALUE($000)
Common Stocks — 97.6%
Aerospace & Defense — 0.8%
AAR Corp. 46 951
Aerojet Rocketdyne Holdings, Inc. * 5 202
Moog, Inc., Class A 5 257
Park Aerospace Corp. 47 527
Vectrus, Inc. * 21 1,013
2,950
Air Freight & Logistics — 0.9%
Echo Global Logistics, Inc. * 10 221
Hub Group, Inc., Class A * 61 2,909
3,130
Airlines — 0.3%
Hawaiian Holdings, Inc. 78 1,101
Auto Components — 1.2%
Adient plc * 85 1,401
American Axle & Manufacturing Holdings, Inc. * 55 420
Cooper Tire & Rubber Co. 29 790
Dana, Inc. 111 1,349
Goodyear Tire & Rubber Co. (The) 39 349
Modine Manufacturing Co. * 8 42
4,351
Banks — 7.9%
Ameris Bancorp 16 367
Associated Banc-Corp. 24 327
Bancorp, Inc. (The) * 67 661
Bank of NT Butterfield & Son Ltd. (The) (Bermuda) 66 1,602
Bar Harbor Bankshares 18 407
Business First Bancshares, Inc. 14 210
California Bancorp, Inc. * 4 64
Capital Bancorp, Inc. * 5 56
Capstar Financial Holdings, Inc. 12 138
Cathay General Bancorp 11 298
CB Financial Services, Inc. 3 61
Central Valley Community Bancorp 4 68
Citizens Holding Co. 3 65
Community Trust Bancorp, Inc. 2 62
ConnectOne Bancorp, Inc. 110 1,765
Customers Bancorp, Inc. * 50 604
Enterprise Financial Services Corp. 2 65
Financial Institutions, Inc. 26 477
First BanCorp (Puerto Rico) 251 1,401
First Bank 6 41
First Business Financial Services, Inc. 6 106
First Choice Bancorp 2 31
INVESTMENTSSHARES
(000)VALUE($000)
Banks — continued
First Community Bankshares, Inc. 5 109
First Hawaiian, Inc. 12 203
First Horizon National Corp. 186 1,851
First Internet Bancorp 8 136
Great Southern Bancorp, Inc. 9 379
Hancock Whitney Corp. 34 719
Hanmi Financial Corp. 48 461
Hilltop Holdings, Inc. 38 708
IBERIABANK Corp. 22 999
Investar Holding Corp. 13 184
Investors Bancorp, Inc. 305 2,592
Macatawa Bank Corp. 13 102
Meridian Corp. * 4 65
Metropolitan Bank Holding Corp. * 5 167
Mid Penn Bancorp, Inc. (a) 4 81
Northeast Bank 6 99
OceanFirst Financial Corp. 116 2,049
PacWest Bancorp 34 678
Popular, Inc. (Puerto Rico) 43 1,610
RBB Bancorp 7 91
Select Bancorp, Inc. * 51 419
Shore Bancshares, Inc. 9 97
Sierra Bancorp 4 79
Signature Bank 4 380
Sterling Bancorp 36 421
Synovus Financial Corp. 32 651
Umpqua Holdings Corp. 111 1,179
United Community Banks, Inc. 25 502
Wintrust Financial Corp. 11 492
Zions Bancorp NA 43 1,459
27,838
Biotechnology — 8.8%
Aduro Biotech, Inc. * 248 572
Akebia Therapeutics, Inc. * 46 623
Alector, Inc. * 39 941
Allogene Therapeutics, Inc. * 37 1,584
Amicus Therapeutics, Inc. * 77 1,166
AnaptysBio, Inc. * 66 1,471
Arrowhead Pharmaceuticals, Inc. * (a) 41 1,758
Assembly Biosciences, Inc. * 35 821
Atara Biotherapeutics, Inc. * 7 101
Bluebird Bio, Inc. * 6 337
Blueprint Medicines Corp. * 16 1,279
Bridgebio Pharma, Inc. * (a) 19 634
SEE NOTES TO FINANCIAL STATEMENTS.
20 J.P. MORGAN SMALL CAP FUNDS JUNE 30, 2020

INVESTMENTSSHARES
(000)VALUE($000)
Common Stocks — continued
Biotechnology — continued
Catalyst Pharmaceuticals, Inc. * 162 749
Coherus Biosciences, Inc. * (a) 50 890
Concert Pharmaceuticals, Inc. * (a) 25 253
Dicerna Pharmaceuticals, Inc. * (a) 58 1,466
Esperion Therapeutics, Inc. * (a) 19 983
FibroGen, Inc. * 16 667
Gritstone Oncology, Inc. * 11 74
Heron Therapeutics, Inc. * (a) 82 1,205
Homology Medicines, Inc. * 30 454
Immunomedics, Inc. * 64 2,258
Insmed, Inc. * (a) 35 967
Jounce Therapeutics, Inc. * 31 216
Kura Oncology, Inc. * 5 79
MeiraGTx Holdings plc * (a) 27 336
Mustang Bio, Inc. * 466 1,483
Principia Biopharma, Inc. * 1 78
Radius Health, Inc. * 4 57
REVOLUTION Medicines, Inc. * 12 366
Rhythm Pharmaceuticals, Inc. * 20 439
Sage Therapeutics, Inc. * 16 682
Sarepta Therapeutics, Inc. * 7 1,170
Sutro Biopharma, Inc. * (a) 9 72
Syros Pharmaceuticals, Inc. * 189 2,015
TCR2 Therapeutics, Inc. * (a) 19 288
Viela Bio, Inc. * (a) 24 1,027
Vir Biotechnology, Inc. * (a) 26 1,053
Xencor, Inc. * 15 481
Y-mAbs Therapeutics, Inc. * 3 126
31,221
Building Products — 1.1%
Builders FirstSource, Inc. * 35 717
Caesarstone Ltd. 45 537
Cornerstone Building Brands, Inc. * 34 207
JELD-WEN Holding, Inc. * 12 190
Masonite International Corp. * 14 1,073
PGT Innovations, Inc. * 10 160
Quanex Building Products Corp. 34 476
UFP Industries, Inc. 7 323
3,683
Capital Markets — 1.7%
Blucora, Inc. * 58 660
Cowen, Inc., Class A (a) 79 1,273
Federated Hermes, Inc., Class B 70 1,656
Focus Financial Partners, Inc., Class A * 5 175
INVESTMENTSSHARES
(000)VALUE($000)
Capital Markets — continued
Houlihan Lokey, Inc. 9 477
Piper Sandler Cos. 4 231
Stifel Financial Corp. 19 887
Virtus Investment Partners, Inc. 6 709
6,068
Chemicals — 1.7%
FutureFuel Corp. 25 305
Koppers Holdings, Inc. * 54 1,019
Kraton Corp. * 29 509
Minerals Technologies, Inc. 10 479
Orion Engineered Carbons SA (Luxembourg) 70 740
PolyOne Corp. 51 1,343
Trinseo SA 33 726
Tronox Holdings plc, Class A (a) 105 758
5,879
Commercial Services & Supplies — 2.4%
ABM Industries, Inc. 34 1,227
ACCO Brands Corp. 183 1,298
Brink’s Co. (The) 13 610
Herman Miller, Inc. 23 539
HNI Corp. 42 1,283
KAR Auction Services, Inc. 23 315
Kimball International, Inc., Class B 68 791
Knoll, Inc. 84 1,022
Quad/Graphics, Inc. 91 297
Steelcase, Inc., Class A 82 993
8,375
Communications Equipment — 0.8%
Cambium Networks Corp. * 93 682
Ciena Corp. * 9 460
Extreme Networks, Inc. * 203 881
KVH Industries, Inc. * 42 373
PCTEL, Inc. * 53 352
2,748
Construction & Engineering — 3.1%
Argan, Inc. 66 3,114
Comfort Systems USA, Inc. 19 779
EMCOR Group, Inc. 22 1,443
Great Lakes Dredge & Dock Corp. * 109 1,009
MasTec, Inc. * 50 2,231
Primoris Services Corp. 50 892
Sterling Construction Co., Inc. * 68 712
Tutor Perini Corp. * 46 557
10,737
SEE NOTES TO FINANCIAL STATEMENTS.
JUNE 30, 2020 J.P. MORGAN SMALL CAP FUNDS 21
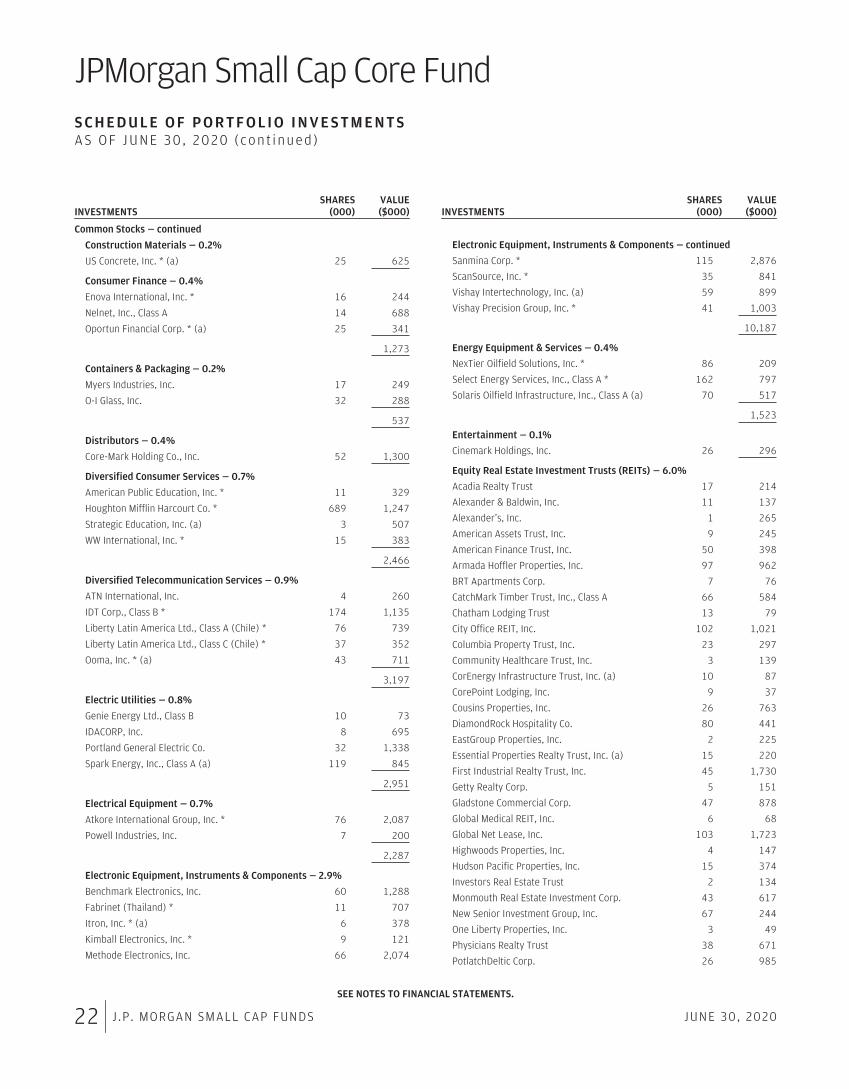
JPMorgan Small Cap Core FundS C H E D U L E O F P O R T F O L I O I N V E S T M E N T SAS OF JUNE 30 , 2 020 (con t inued )
INVESTMENTSSHARES
(000)VALUE($000)
Common Stocks — continued
Construction Materials — 0.2%
US Concrete, Inc. * (a) 25 625
Consumer Finance — 0.4%
Enova International, Inc. * 16 244
Nelnet, Inc., Class A 14 688
Oportun Financial Corp. * (a) 25 341
1,273
Containers & Packaging — 0.2%
Myers Industries, Inc. 17 249
O-I Glass, Inc. 32 288
537
Distributors — 0.4%
Core-Mark Holding Co., Inc. 52 1,300
Diversified Consumer Services — 0.7%
American Public Education, Inc. * 11 329
Houghton Mifflin Harcourt Co. * 689 1,247
Strategic Education, Inc. (a) 3 507
WW International, Inc. * 15 383
2,466
Diversified Telecommunication Services — 0.9%
ATN International, Inc. 4 260
IDT Corp., Class B * 174 1,135
Liberty Latin America Ltd., Class A (Chile) * 76 739
Liberty Latin America Ltd., Class C (Chile) * 37 352
Ooma, Inc. * (a) 43 711
3,197
Electric Utilities — 0.8%
Genie Energy Ltd., Class B 10 73
IDACORP, Inc. 8 695
Portland General Electric Co. 32 1,338
Spark Energy, Inc., Class A (a) 119 845
2,951
Electrical Equipment — 0.7%
Atkore International Group, Inc. * 76 2,087
Powell Industries, Inc. 7 200
2,287
Electronic Equipment, Instruments & Components — 2.9%
Benchmark Electronics, Inc. 60 1,288
Fabrinet (Thailand) * 11 707
Itron, Inc. * (a) 6 378
Kimball Electronics, Inc. * 9 121
Methode Electronics, Inc. 66 2,074
INVESTMENTSSHARES
(000)VALUE($000)
Electronic Equipment, Instruments & Components — continued
Sanmina Corp. * 115 2,876
ScanSource, Inc. * 35 841
Vishay Intertechnology, Inc. (a) 59 899
Vishay Precision Group, Inc. * 41 1,003
10,187
Energy Equipment & Services — 0.4%
NexTier Oilfield Solutions, Inc. * 86 209
Select Energy Services, Inc., Class A * 162 797
Solaris Oilfield Infrastructure, Inc., Class A (a) 70 517
1,523
Entertainment — 0.1%
Cinemark Holdings, Inc. 26 296
Equity Real Estate Investment Trusts (REITs) — 6.0%
Acadia Realty Trust 17 214
Alexander & Baldwin, Inc. 11 137
Alexander’s, Inc. 1 265
American Assets Trust, Inc. 9 245
American Finance Trust, Inc. 50 398
Armada Hoffler Properties, Inc. 97 962
BRT Apartments Corp. 7 76
CatchMark Timber Trust, Inc., Class A 66 584
Chatham Lodging Trust 13 79
City Office REIT, Inc. 102 1,021
Columbia Property Trust, Inc. 23 297
Community Healthcare Trust, Inc. 3 139
CorEnergy Infrastructure Trust, Inc. (a) 10 87
CorePoint Lodging, Inc. 9 37
Cousins Properties, Inc. 26 763
DiamondRock Hospitality Co. 80 441
EastGroup Properties, Inc. 2 225
Essential Properties Realty Trust, Inc. (a) 15 220
First Industrial Realty Trust, Inc. 45 1,730
Getty Realty Corp. 5 151
Gladstone Commercial Corp. 47 878
Global Medical REIT, Inc. 6 68
Global Net Lease, Inc. 103 1,723
Highwoods Properties, Inc. 4 147
Hudson Pacific Properties, Inc. 15 374
Investors Real Estate Trust 2 134
Monmouth Real Estate Investment Corp. 43 617
New Senior Investment Group, Inc. 67 244
One Liberty Properties, Inc. 3 49
Physicians Realty Trust 38 671
PotlatchDeltic Corp. 26 985
SEE NOTES TO FINANCIAL STATEMENTS.
22 J.P. MORGAN SMALL CAP FUNDS JUNE 30, 2020

INVESTMENTSSHARES
(000)VALUE($000)
Common Stocks — continued
Equity Real Estate Investment Trusts (REITs) — continued
Retail Properties of America, Inc., Class A 127 929
Retail Value, Inc. 16 193
Rexford Industrial Realty, Inc. 7 289
Ryman Hospitality Properties, Inc. 1 38
Sabra Health Care REIT, Inc. 22 320
STAG Industrial, Inc. (a) 90 2,644
Sunstone Hotel Investors, Inc. 139 1,131
Urban Edge Properties 37 433
Xenia Hotels & Resorts, Inc. 123 1,144
21,082
Food & Staples Retailing — 1.4%
BJ’s Wholesale Club Holdings, Inc. * 23 857
Performance Food Group Co. * 53 1,536
PriceSmart, Inc. 28 1,689
Rite Aid Corp. * (a) 39 672
4,754
Food Products — 0.6%
Sanderson Farms, Inc. 17 1,918
TreeHouse Foods, Inc. * 4 160
2,078
Gas Utilities — 1.0%
Chesapeake Utilities Corp. 8 697
New Jersey Resources Corp. 16 534
Southwest Gas Holdings, Inc. 18 1,233
Spire, Inc. 14 907
3,371
Health Care Equipment & Supplies — 3.3%
Accuray, Inc. * (a) 254 516
Alphatec Holdings, Inc. * (a) 102 478
Apyx Medical Corp. * 105 581
Axogen, Inc. * 32 293
CONMED Corp. (a) 5 351
Cutera, Inc. * 75 916
Inogen, Inc. * (a) 16 561
Integer Holdings Corp. * 6 431
Invacare Corp. 116 739
Natus Medical, Inc. * 36 792
NuVasive, Inc. * 16 896
OraSure Technologies, Inc. * 62 725
Orthofix Medical, Inc. * 64 2,062
SI-BONE, Inc. * 49 775
Sientra, Inc. * (a) 71 275
Utah Medical Products, Inc. 6 496
INVESTMENTSSHARES
(000)VALUE($000)
Health Care Equipment & Supplies — continued
ViewRay, Inc. * (a) 280 628
11,515
Health Care Providers & Services — 4.4%
American Renal Associates Holdings, Inc. * (a) 69 451
AMN Healthcare Services, Inc. * 45 2,031
Apollo Medical Holdings, Inc. * 10 170
Cross Country Healthcare, Inc. * 122 750
Hanger, Inc. * 36 596
Magellan Health, Inc. * 50 3,614
MEDNAX, Inc. * (a) 96 1,648
National HealthCare Corp. 18 1,155
Owens & Minor, Inc. (a) 156 1,191
Select Medical Holdings Corp. * 93 1,374
Surgery Partners, Inc. * 114 1,324
Tenet Healthcare Corp. * 67 1,219
15,523
Health Care Technology — 0.3%
NextGen Healthcare, Inc. * 57 622
Omnicell, Inc. * 5 367
989
Hotels, Restaurants & Leisure — 1.0%
Bloomin’ Brands, Inc. (a) 68 729
Boyd Gaming Corp. 12 253
Brinker International, Inc. 22 538
Dine Brands Global, Inc. (a) 15 648
International Game Technology plc 73 650
Penn National Gaming, Inc. * (a) 21 631
3,449
Household Durables — 2.7%
Cavco Industries, Inc. * 2 424
Hamilton Beach Brands Holding Co., Class A 5 59
Helen of Troy Ltd. * 7 1,298
KB Home 45 1,377
Lifetime Brands, Inc. 12 81
Meritage Homes Corp. * 32 2,429
Sonos, Inc. * 128 1,865
Taylor Morrison Home Corp. * 25 484
Universal Electronics, Inc. * 28 1,297
9,314
Household Products — 0.2%
Central Garden & Pet Co. * 10 360
Central Garden & Pet Co., Class A * 14 465
825
SEE NOTES TO FINANCIAL STATEMENTS.
JUNE 30, 2020 J.P. MORGAN SMALL CAP FUNDS 23

JPMorgan Small Cap Core FundS C H E D U L E O F P O R T F O L I O I N V E S T M E N T SAS OF JUNE 30 , 2 020 (con t inued )
INVESTMENTSSHARES
(000)VALUE($000)
Common Stocks — continued
Independent Power and Renewable Electricity Producers — 1.3%
Atlantic Power Corp. * 65 130
Clearway Energy, Inc. 63 1,329
Clearway Energy, Inc., Class C 57 1,308
TerraForm Power, Inc., Class A 82 1,518
Vistra Energy Corp. 13 251
4,536
Insurance — 1.0%
Ambac Financial Group, Inc. * 20 292
American Equity Investment Life Holding Co. 25 623
Argo Group International Holdings Ltd. 6 199
CNO Financial Group, Inc. 40 626
FedNat Holding Co. 45 498
National General Holdings Corp. 22 474
ProSight Global, Inc. * 28 251
Selective Insurance Group, Inc. 5 289
Stewart Information Services Corp. 2 68
Third Point Reinsurance Ltd. (Bermuda) * 13 100
United Insurance Holdings Corp. 8 63
Watford Holdings Ltd. (Bermuda) * 4 65
3,548
Interactive Media & Services — 0.4%
Cars.com, Inc. * 126 725
Yelp, Inc. * 25 578
1,303
Internet & Direct Marketing Retail — 0.3%
Groupon, Inc. * (a) 24 431
Quotient Technology, Inc. * 88 647
1,078
IT Services — 2.0%
KBR, Inc. 92 2,073
NIC, Inc. 36 827
Perspecta, Inc. 14 330
Science Applications International Corp. 19 1,468
StarTek, Inc. * 209 1,063
Unisys Corp. * (a) 104 1,130
6,891
Leisure Products — 0.3%
Acushnet Holdings Corp. (a) 31 1,078
Life Sciences Tools & Services — 0.5%
Adaptive Biotechnologies Corp. * 14 653
Personalis, Inc. * 72 935
1,588
INVESTMENTSSHARES
(000)VALUE($000)
Machinery — 1.3%
Altra Industrial Motion Corp. 12 392
Columbus McKinnon Corp. 27 899
Gencor Industries, Inc. * 8 101
Meritor, Inc. * 38 751
Mueller Industries, Inc. 11 292
Park-Ohio Holdings Corp. 6 92
Terex Corp. 95 1,790
TriMas Corp. * 14 326
4,643
Marine — 0.2%
Costamare, Inc. (Monaco) 125 697
Media — 1.2%
AMC Networks, Inc., Class A * (a) 23 538
Fluent, Inc. * 99 177
Gray Television, Inc. * 54 749
Meredith Corp. (a) 58 850
Nexstar Media Group, Inc., Class A (a) 12 975
Sinclair Broadcast Group, Inc., Class A (a) 41 751
4,040
Metals & Mining — 1.2%
Commercial Metals Co. 127 2,594
Ryerson Holding Corp. * 20 110
SunCoke Energy, Inc. 66 194
Warrior Met Coal, Inc. (a) 61 932
Worthington Industries, Inc. 12 459
4,289
Mortgage Real Estate Investment Trusts (REITs) — 1.3%
Apollo Commercial Real Estate Finance, Inc. 57 560
ARMOUR Residential REIT, Inc. 11 102
Capstead Mortgage Corp. 38 207
Colony Credit Real Estate, Inc. 16 110
Dynex Capital, Inc. (a) 13 180
Ellington Financial, Inc. 3 35
Great Ajax Corp. 4 35
Ladder Capital Corp. 42 343
PennyMac Mortgage Investment Trust 98 1,719
Redwood Trust, Inc. (a) 129 905
TPG RE Finance Trust, Inc. (a) 13 108
Two Harbors Investment Corp. 19 97
4,401
Multiline Retail — 0.4%
Big Lots, Inc. 20 852
Dillard’s, Inc., Class A (a) 9 235
SEE NOTES TO FINANCIAL STATEMENTS.
24 J.P. MORGAN SMALL CAP FUNDS JUNE 30, 2020

INVESTMENTSSHARES
(000)VALUE($000)
Common Stocks — continued
Multiline Retail — continued
Macy’s, Inc. 48 332
1,419
Multi-Utilities — 0.2%
Black Hills Corp. 11 622
Oil, Gas & Consumable Fuels — 1.6%
Arch Resources, Inc. (a) 13 365
Berry Corp. 111 534
CVR Energy, Inc. 29 578
Delek US Holdings, Inc. (a) 62 1,079
Dorian LPG Ltd. * 55 426
Falcon Minerals Corp. (a) 44 142
Magnolia Oil & Gas Corp., Class A * 30 182
Par Pacific Holdings, Inc. * (a) 42 376
PDC Energy, Inc. * 13 165
Renewable Energy Group, Inc. * (a) 72 1,778
REX American Resources Corp. * 1 53
5,678
Paper & Forest Products — 1.5%
Boise Cascade Co. 45 1,692
Louisiana-Pacific Corp. 28 726
PH Glatfelter Co. 9 144
Schweitzer-Mauduit International, Inc. (a) 72 2,414
Verso Corp., Class A 30 355
5,331
Personal Products — 0.5%
Edgewell Personal Care Co. * 51 1,595
Pharmaceuticals — 3.4%
AMAG Pharmaceuticals, Inc. * (a) 9 72
Arvinas, Inc. * (a) 1 32
Cara Therapeutics, Inc. * (a) 22 384
Endo International plc * 379 1,300
Horizon Therapeutics plc * 56 3,125
Intersect ENT, Inc. * 73 991
Lannett Co., Inc. * (a) 232 1,684
Menlo Therapeutics, Inc. * (a) 70 121
NGM Biopharmaceuticals, Inc. * (a) 51 1,009
Phibro Animal Health Corp., Class A 14 355
Revance Therapeutics, Inc. * 7 163
TherapeuticsMD, Inc. * (a) 131 164
WaVe Life Sciences Ltd. * (a) 126 1,314
Zogenix, Inc. * 31 840
Zynerba Pharmaceuticals, Inc. * (a) 56 187
11,741
INVESTMENTSSHARES
(000)VALUE($000)
Professional Services — 2.5%
Barrett Business Services, Inc. 36 1,904
CBIZ, Inc. * (a) 46 1,100
Heidrick & Struggles International, Inc. 32 697
ICF International, Inc. 13 869
Insperity, Inc. 3 201
Kelly Services, Inc., Class A 16 260
Korn Ferry (a) 58 1,789
TriNet Group, Inc. * 22 1,328
TrueBlue, Inc. * 39 595
8,743
Real Estate Management & Development — 0.5%
Jones Lang LaSalle, Inc. 2 230
Realogy Holdings Corp. 177 1,312
RMR Group, Inc. (The), Class A 5 141
1,683
Road & Rail — 0.9%
ArcBest Corp. 116 3,081
Semiconductors & Semiconductor Equipment — 2.5%
Advanced Energy Industries, Inc. * 18 1,233
Alpha & Omega Semiconductor Ltd. * 66 721
GSI Technology, Inc. * 64 461
Ichor Holdings Ltd. * 29 781
NVE Corp. 7 427
Onto Innovation, Inc. * (a) 22 749
PDF Solutions, Inc. * 20 397
Photronics, Inc. * 164 1,820
Rambus, Inc. * (a) 16 242
SMART Global Holdings, Inc. * (a) 43 1,174
Ultra Clean Holdings, Inc. * 39 885
8,890
Software — 4.1%
ACI Worldwide, Inc. * 6 172
American Software, Inc., Class A 39 618
Avaya Holdings Corp. * (a) 97 1,197
Cornerstone OnDemand, Inc. * 68 2,625
Domo, Inc., Class B * 27 875
eGain Corp. * 161 1,792
Envestnet, Inc. * 7 500
j2 Global, Inc. * 21 1,308
Majesco * 57 451
MicroStrategy, Inc., Class A * 11 1,283
Model N, Inc. * 7 254
Rimini Street, Inc. * 88 453
SEE NOTES TO FINANCIAL STATEMENTS.
JUNE 30, 2020 J.P. MORGAN SMALL CAP FUNDS 25

JPMorgan Small Cap Core FundS C H E D U L E O F P O R T F O L I O I N V E S T M E N T SAS OF JUNE 30 , 2 020 (con t inued )
INVESTMENTSSHARES
(000)VALUE($000)
Common Stocks — continued
Software — continued
Rosetta Stone, Inc. * 17 288
SVMK, Inc. * 23 543
Verint Systems, Inc. * 30 1,351
Zuora, Inc., Class A * 62 789
14,499
Specialty Retail — 2.3%
Bed Bath & Beyond, Inc. (a) 70 745
Genesco, Inc. * 25 537
Guess?, Inc. 68 658
Hibbett Sports, Inc. * (a) 54 1,133
Office Depot, Inc. 387 910
Rent-A-Center, Inc. 84 2,333
Signet Jewelers Ltd. (a) 13 136
Zumiez, Inc. * 55 1,514
7,966
Technology Hardware, Storage & Peripherals — 0.2%
Diebold Nixdorf, Inc. * (a) 123 743
Textiles, Apparel & Luxury Goods — 1.4%
Deckers Outdoor Corp. * 21 4,065
Wolverine World Wide, Inc. 32 769
4,834
Thrifts & Mortgage Finance — 3.7%
ESSA Bancorp, Inc. 4 49
Essent Group Ltd. 62 2,262
Flagstar Bancorp, Inc. 64 1,871
FS Bancorp, Inc. 2 86
HomeStreet, Inc. 13 330
Luther Burbank Corp. 17 174
MGIC Investment Corp. 92 753
MMA Capital Holdings, Inc. * 2 51
Mr Cooper Group, Inc. * 137 1,702
NMI Holdings, Inc., Class A * 22 354
OP Bancorp 19 132
PennyMac Financial Services, Inc. 19 804
Provident Bancorp, Inc. 36 286
Provident Financial Services, Inc. 111 1,600
Radian Group, Inc. 76 1,171
Standard AVB Financial Corp. 3 65
Walker & Dunlop, Inc. 26 1,328
13,018
Tobacco — 0.1%
Vector Group Ltd. 44 442
INVESTMENTSSHARES
(000)VALUE($000)
Trading Companies & Distributors — 1.3%
Beacon Roofing Supply, Inc. * 25 651
BMC Stock Holdings, Inc. * 81 2,042
GMS, Inc. * 58 1,424
Triton International Ltd. (Bermuda) 10 290
Veritiv Corp. * (a) 18 302
4,709
Water Utilities — 0.0% (b)
Consolidated Water Co. Ltd. (Cayman Islands) 3 48
Wireless Telecommunication Services — 0.2%
Spok Holdings, Inc. 68 633
Total Common Stocks(Cost $326,363) 341,390
Short-Term Investments — 9.7%
Investment Companies — 2.6%
JPMorgan Prime Money Market Fund Class IMShares, 0.47% (c) (d)(Cost $9,176) 9,169 9,177
Investment of Cash Collateral from Securities Loaned — 7.1%
JPMorgan Securities Lending Money Market FundAgency SL Class Shares, 0.51% (c) (d) 20,998 21,006
JPMorgan U.S. Government Money Market FundClass IM Shares, 0.14% (c) (d) 3,876 3,876
Total Investment of Cash Collateral fromSecurities Loaned(Cost $24,876) 24,882
Total Short-Term Investments(Cost $34,052) 34,059
Total Investments — 107.3%(Cost $360,415) 375,449
Liabilities in Excess ofOther Assets — (7.3)% (25,588)
NET ASSETS — 100.0% 349,861
Percentages indicated are based on net assets.
Abbreviations
REIT Real Estate Investment Trust
(a) The security or a portion of this security is on loan at June 30, 2020.The total value of securities on loan at June 30, 2020 is approximately$23,895,000.
(b) Amount rounds to less than 0.1% of net assets.(c) Investment in an affiliated fund, which is registered under the
Investment Company Act of 1940, as amended, and is advised byJ.P. Morgan Investment Management Inc.
(d) The rate shown is the current yield as of June 30, 2020.* Non-income producing security.
SEE NOTES TO FINANCIAL STATEMENTS.
26 J.P. MORGAN SMALL CAP FUNDS JUNE 30, 2020

Futures contracts outstanding as of June 30, 2020 (amounts in thousands, except number of contracts):
DESCRIPTIONNUMBER OFCONTRACTS
EXPIRATIONDATE
TRADINGCURRENCY
NOTIONALAMOUNT ($)
VALUE ANDUNREALIZED
APPRECIATION(DEPRECIATION) ($)
Long ContractsRussell 2000 E-Mini Index 63 09/2020 USD 4,524 94
AbbreviationsUSD United States Dollar
SEE NOTES TO FINANCIAL STATEMENTS.
JUNE 30, 2020 J.P. MORGAN SMALL CAP FUNDS 27

JPMorgan Small Cap Equity FundS C H E D U L E O F P O R T F O L I O I N V E S T M E N T SAS OF JUNE 30 , 2 020
INVESTMENTSSHARES
(000)VALUE($000)
Common Stocks — 94.8%
Auto Components — 1.6%
LCI Industries (a) 920 105,785
Automobiles — 0.9%
Thor Industries, Inc. (a) 574 61,183
Banks — 8.2%
BankUnited, Inc. 2,554 51,714
Commerce Bancshares, Inc. (a) 1,244 74,003
Cullen/Frost Bankers, Inc. (a) 666 49,790
First Financial Bancorp 2,778 38,590
First Hawaiian, Inc. 3,288 56,687
First Horizon National Corp. (a) 5,131 51,105
IBERIABANK Corp. 750 34,139
Signature Bank 533 56,997
Western Alliance Bancorp 1,835 69,483
Wintrust Financial Corp. (a) 1,227 53,508
536,016
Beverages — 0.9%
Primo Water Corp. (a) 4,181 57,495
Building Products — 1.0%
Fortune Brands Home & Security, Inc. 1,057 67,555
Capital Markets — 5.9%
Assetmark Financial Holdings, Inc. * (a) 811 22,130
Eaton Vance Corp. 1,333 51,463
FactSet Research Systems, Inc. (a) 184 60,313
Focus Financial Partners, Inc., Class A * 1,925 63,636
Lazard Ltd., Class A 2,157 61,747
Moelis & Co., Class A (a) 1,875 58,439
Morningstar, Inc. 513 72,323
390,051
Chemicals — 2.9%
GCP Applied Technologies, Inc. * 2,632 48,896
PQ Group Holdings, Inc. * 3,534 46,791
Quaker Chemical Corp. (a) 520 96,490
192,177
Commercial Services & Supplies — 3.7%
Brady Corp., Class A 1,502 70,340
BrightView Holdings, Inc. * (a) 152 1,702
Casella Waste Systems, Inc., Class A * 31 1,616
IAA, Inc. * (a) 1,889 72,875
KAR Auction Services, Inc. 500 6,875
MSA Safety, Inc. (a) 813 93,017
246,425
INVESTMENTSSHARES
(000)VALUE($000)
Construction & Engineering — 0.9%
WillScot Corp. * (a) 5,043 61,983
Containers & Packaging — 3.4%
AptarGroup, Inc. 1,437 160,870
Crown Holdings, Inc. * 978 63,679
224,549
Distributors — 2.8%
Pool Corp. (a) 691 187,958
Diversified Consumer Services — 0.7%
Bright Horizons Family Solutions, Inc. * 394 46,126
Electric Utilities — 1.1%
Portland General Electric Co. 1,751 73,200
Electrical Equipment — 1.2%
Generac Holdings, Inc. * 631 76,932
Electronic Equipment, Instruments & Components — 1.1%
nLight, Inc. * (a) 2,119 47,158
Novanta, Inc. * 260 27,770
74,928
Equity Real Estate Investment Trusts (REITs) — 5.1%
American Campus Communities, Inc. (a) 581 20,304
CubeSmart 2,962 79,936
EastGroup Properties, Inc. 853 101,183
National Retail Properties, Inc. 2,016 71,522
Outfront Media, Inc. 2,365 33,515
RLJ Lodging Trust 1,078 10,172
Ryman Hospitality Properties, Inc. 500 17,300
333,932
Food & Staples Retailing — 4.0%
BJ’s Wholesale Club Holdings, Inc. * (a) 3,033 113,051
Casey’s General Stores, Inc. 307 45,860
Performance Food Group Co. * (a) 3,573 104,110
263,021
Health Care Equipment & Supplies — 3.3%
Envista Holdings Corp. * (a) 1,552 32,734
ICU Medical, Inc. * (a) 380 69,972
West Pharmaceutical Services, Inc. 507 115,098
217,804
Health Care Providers & Services — 5.6%
Chemed Corp. 100 45,278
Encompass Health Corp. (a) 1,676 103,795
HealthEquity, Inc. * (a) 823 48,264
Molina Healthcare, Inc. * 663 117,982
SEE NOTES TO FINANCIAL STATEMENTS.
28 J.P. MORGAN SMALL CAP FUNDS JUNE 30, 2020

INVESTMENTSSHARES
(000)VALUE($000)
Common Stocks — continued
Health Care Providers & Services — continued
Premier, Inc., Class A * (a) 1,635 56,039
371,358
Health Care Technology — 0.2%
HMS Holdings Corp. * 432 13,979
Hotels, Restaurants & Leisure — 2.1%
Dunkin’ Brands Group, Inc. 524 34,151
Monarch Casino & Resort, Inc. * (a) 509 17,364
Planet Fitness, Inc., Class A * (a) 671 40,665
Wendy’s Co. (The) 2,270 49,438
141,618
Insurance — 3.2%
Kinsale Capital Group, Inc. (a) 633 98,174
RLI Corp. (a) 1,168 95,893
Selectquote, Inc. * 564 14,282
208,349
IT Services — 1.0%
WEX, Inc. * (a) 409 67,512
Leisure Products — 2.5%
Acushnet Holdings Corp. (a) 1,675 58,290
Brunswick Corp. 1,646 105,346
163,636
Life Sciences Tools & Services — 1.1%
Syneos Health, Inc. * (a) 1,219 71,003
Machinery — 9.4%
Altra Industrial Motion Corp. (a) 1,740 55,449
Douglas Dynamics, Inc. 996 34,975
Gates Industrial Corp. plc * (a) 3,260 33,510
Lincoln Electric Holdings, Inc. (a) 1,205 101,545
Nordson Corp. 266 50,470
RBC Bearings, Inc. * 672 90,138
Toro Co. (The) 2,348 155,754
Welbilt, Inc. * 3,055 18,604
Woodward, Inc. (a) 969 75,156
615,601
Media — 0.2%
EW Scripps Co. (The), Class A (a) 1,452 12,702
Multi-Utilities — 1.2%
NorthWestern Corp. 1,401 76,402
Pharmaceuticals — 2.7%
Catalent, Inc. * 2,057 150,807
Prestige Consumer Healthcare, Inc. * (a) 692 26,002
176,809
INVESTMENTSSHARES
(000)VALUE($000)
Professional Services — 1.0%
CoreLogic, Inc. (a) 1,004 67,516
Real Estate Management & Development — 0.9%
Cushman & Wakefield plc * (a) 4,819 60,046
Road & Rail — 2.0%
Knight-Swift Transportation Holdings, Inc. (a) 1,605 66,932
Landstar System, Inc. (a) 576 64,647
131,579
Semiconductors & Semiconductor Equipment — 3.2%
Cabot Microelectronics Corp. 702 97,955
Monolithic Power Systems, Inc. 164 38,981
Power Integrations, Inc. 601 71,037
207,973
Software — 7.7%
Aspen Technology, Inc. * (a) 743 76,934
Bill.Com Holdings, Inc. * 640 57,745
Envestnet, Inc. * 735 54,053
Guidewire Software, Inc. * (a) 659 73,002
Medallia, Inc. * (a) 1,594 40,232
Q2 Holdings, Inc. * (a) 1,084 93,033
RealPage, Inc. * (a) 733 47,637
Tyler Technologies, Inc. * 189 65,550
508,186
Specialty Retail — 0.4%
National Vision Holdings, Inc. * 921 28,099
Textiles, Apparel & Luxury Goods — 0.7%
Carter’s, Inc. 607 49,019
Trading Companies & Distributors — 1.0%
Applied Industrial Technologies, Inc. (a) 1,016 63,402
Total Common Stocks(Cost $4,549,256) 6,251,909
Exchange-Traded Funds — 0.7%
U.S. Equity — 0.7%
iShares Russell 2000 ETF (a)(Cost $48,119) 338 48,342
Short-Term Investments — 8.5%
Investment Companies — 4.2%
JPMorgan Prime Money Market Fund Class IMShares, 0.47% (b) (c)(Cost $276,293) 276,154 276,403
Investment of Cash Collateral from Securities Loaned — 4.3%
JPMorgan Securities Lending Money Market FundAgency SL Class Shares, 0.51% (b) (c) 252,994 253,095
SEE NOTES TO FINANCIAL STATEMENTS.
JUNE 30, 2020 J.P. MORGAN SMALL CAP FUNDS 29
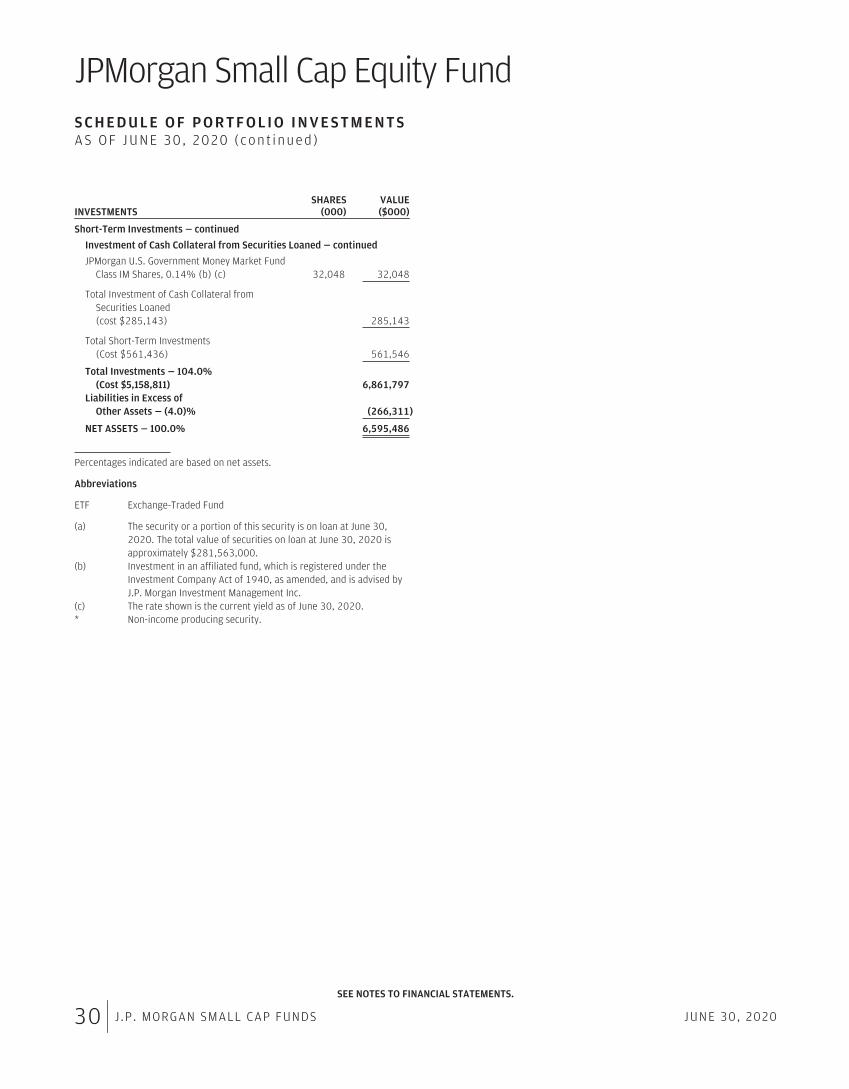
JPMorgan Small Cap Equity FundS C H E D U L E O F P O R T F O L I O I N V E S T M E N T SAS OF JUNE 30 , 2 020 (con t inued )
INVESTMENTSSHARES
(000)VALUE($000)
Short-Term Investments — continued
Investment of Cash Collateral from Securities Loaned — continued
JPMorgan U.S. Government Money Market FundClass IM Shares, 0.14% (b) (c) 32,048 32,048
Total Investment of Cash Collateral fromSecurities Loaned(cost $285,143) 285,143
Total Short-Term Investments(Cost $561,436) 561,546
Total Investments — 104.0%(Cost $5,158,811) 6,861,797
Liabilities in Excess ofOther Assets — (4.0)% (266,311)
NET ASSETS — 100.0% 6,595,486
Percentages indicated are based on net assets.
Abbreviations
ETF Exchange-Traded Fund
(a) The security or a portion of this security is on loan at June 30,2020. The total value of securities on loan at June 30, 2020 isapproximately $281,563,000.
(b) Investment in an affiliated fund, which is registered under theInvestment Company Act of 1940, as amended, and is advised byJ.P. Morgan Investment Management Inc.
(c) The rate shown is the current yield as of June 30, 2020.* Non-income producing security.
SEE NOTES TO FINANCIAL STATEMENTS.
30 J.P. MORGAN SMALL CAP FUNDS JUNE 30, 2020

JPMorgan Small Cap Growth FundS C H E D U L E O F P O R T F O L I O I N V E S T M E N T SAS OF JUNE 30 , 2 020
INVESTMENTSSHARES
(000)VALUE($000)
Common Stocks — 97.3%
Auto Components — 1.0%
Fox Factory Holding Corp. * (a) 494 40,826
Automobiles — 1.2%
Winnebago Industries, Inc. (a) 705 46,937
Banks — 1.0%
First Financial Bankshares, Inc. 891 25,744
Signature Bank 144 15,368
41,112
Biotechnology — 19.0%
ACADIA Pharmaceuticals, Inc. * (a) 601 29,126
ADC Therapeutics SA (Switzerland) * (a) 740 34,624
Alector, Inc. * (a) 586 14,327
Allogene Therapeutics, Inc. * (a) 381 16,325
Amicus Therapeutics, Inc. * 3,173 47,855
Atara Biotherapeutics, Inc. * 1,791 26,092
Avrobio, Inc. * (a) 1,220 21,298
Biohaven Pharmaceutical Holding Co. Ltd. * (a) 653 47,754
Blueprint Medicines Corp. * 492 38,373
Bridgebio Pharma, Inc. * (a) 557 18,166
Coherus Biosciences, Inc. * (a) 1,973 35,229
FibroGen, Inc. * (a) 792 32,109
G1 Therapeutics, Inc. * 942 22,844
Generation Bio Co. * 303 6,364
Global Blood Therapeutics, Inc. * (a) 362 22,856
Halozyme Therapeutics, Inc. * 2,113 56,637
Heron Therapeutics, Inc. * (a) 1,598 23,507
Homology Medicines, Inc. * 1,052 15,985
Immunomedics, Inc. * (a) 459 16,261
Intercept Pharmaceuticals, Inc. * (a) 364 17,447
Natera, Inc. * 1,298 64,699
Orchard Therapeutics plc, ADR (United Kingdom) * 808 4,851
REGENXBIO, Inc. * (a) 549 20,214
REVOLUTION Medicines, Inc. * (a) 446 14,069
Rubius Therapeutics, Inc. * (a) 1,266 7,568
Sage Therapeutics, Inc. * (a) 471 19,582
Twist Bioscience Corp. * (a) 1,158 52,453
Viela Bio, Inc. * (a) 525 22,737
749,352
Building Products — 5.0%
Advanced Drainage Systems, Inc. 1,272 62,838
AZEK Co., Inc. (The) * 488 15,563
Fortune Brands Home & Security, Inc. 324 20,706
Simpson Manufacturing Co., Inc. (a) 616 51,927
Trex Co., Inc. * (a) 359 46,708
197,742
INVESTMENTSSHARES
(000)VALUE($000)
Capital Markets — 1.4%
Evercore, Inc., Class A 545 32,087
Focus Financial Partners, Inc., Class A * 766 25,325
57,412
Commercial Services & Supplies — 1.6%
Brink’s Co. (The) 473 21,508
MSA Safety, Inc. 371 42,461
63,969
Communications Equipment — 0.9%
Ciena Corp. * 639 34,595
Distributors — 1.1%
Pool Corp. 162 44,072
Diversified Consumer Services — 0.6%
Bright Horizons Family Solutions, Inc.* 170 19,982
OneSpaWorld Holdings Ltd. (Bahamas) (a) 825 3,937
23,919
Diversified Telecommunication Services — 0.8%
Bandwidth, Inc., Class A * (a) 257 32,587
Electrical Equipment — 1.1%
Generac Holdings, Inc. * 342 41,645
Electronic Equipment, Instruments & Components — 0.8%
Littelfuse, Inc. 178 30,394
Equity Real Estate Investment Trusts (REITs) — 2.3%
CubeSmart 701 18,925
EastGroup Properties, Inc. 237 28,152
National Health Investors, Inc. 279 16,941
Terreno Realty Corp. (a) 525 27,653
91,671
Food & Staples Retailing — 2.0%
Grocery Outlet Holding Corp. * (a) 941 38,404
Performance Food Group Co. * (a) 1,367 39,831
78,235
Food Products — 1.4%
Freshpet, Inc. * 643 53,815
Health Care Equipment & Supplies — 3.3%
iRhythm Technologies, Inc. * (a) 384 44,448
Nevro Corp. * (a) 413 49,345
Shockwave Medical, Inc. * 738 34,938
128,731
Health Care Providers & Services — 1.7%
Acadia Healthcare Co., Inc. * (a) 835 20,975
Amedisys, Inc. * 242 48,006
68,981
SEE NOTES TO FINANCIAL STATEMENTS.
JUNE 30, 2020 J.P. MORGAN SMALL CAP FUNDS 31

JPMorgan Small Cap Growth FundS C H E D U L E O F P O R T F O L I O I N V E S T M E N T SAS OF JUNE 30 , 2 020 (con t inued )
INVESTMENTSSHARES
(000)VALUE($000)
Common Stocks — continued
Health Care Technology — 0.3%
Evolent Health, Inc., Class A * (a) 1,797 12,792
Hotels, Restaurants & Leisure — 3.0%
Boyd Gaming Corp. 1,565 32,714
Planet Fitness, Inc., Class A * 552 33,429
Texas Roadhouse, Inc. (a) 1,023 53,801
119,944
Household Durables — 1.6%
Helen of Troy Ltd. * 197 37,209
TRI Pointe Group, Inc. * 1,785 26,225
63,434
Industrial Conglomerates — 0.5%
Carlisle Cos., Inc. 182 21,736
Insurance — 1.2%
eHealth, Inc. * (a) 289 28,407
Selectquote, Inc. * 777 19,674
48,081
Internet & Direct Marketing Retail — 1.1%
Farfetch Ltd., Class A (United Kingdom) * (a) 1,472 25,421
RealReal, Inc. (The) * (a) 1,404 17,961
43,382
IT Services — 1.8%
I3 Verticals, Inc., Class A * (a) 751 22,708
ManTech International Corp., Class A 685 46,883
69,591
Life Sciences Tools & Services — 0.9%
10X Genomics, Inc., Class A * 158 14,073
Adaptive Biotechnologies Corp. * (a) 228 11,041
Personalis, Inc. * 828 10,733
35,847
Machinery — 3.0%
Graco, Inc. 599 28,743
ITT, Inc. 590 34,672
John Bean Technologies Corp. 662 56,943
120,358
Marine — 0.4%
Kirby Corp. * 264 14,122
Media — 1.3%
New York Times Co. (The), Class A (a) 1,253 52,663
Multiline Retail — 1.1%
Ollie’s Bargain Outlet Holdings, Inc. * (a) 429 41,891
INVESTMENTSSHARES
(000)VALUE($000)
Pharmaceuticals — 3.6%
Arvinas, Inc. * (a) 244 8,167
Horizon Therapeutics plc * (a) 986 54,793
MyoKardia, Inc. * 108 10,453
Revance Therapeutics, Inc. * (a) 1,662 40,583
TherapeuticsMD, Inc. * 5,698 7,122
Tricida, Inc. * (a) 774 21,259
142,377
Professional Services — 0.7%
FTI Consulting, Inc. * 254 29,091
Road & Rail — 1.3%
Saia, Inc. * (a) 446 49,560
Semiconductors & Semiconductor Equipment — 8.5%
Cree, Inc. * (a) 488 28,867
Enphase Energy, Inc. * 765 36,402
Entegris, Inc. (a) 879 51,915
Inphi Corp. * 581 68,308
MKS Instruments, Inc. (a) 481 54,469
Monolithic Power Systems, Inc. 134 31,680
Semtech Corp. * (a) 698 36,424
SolarEdge Technologies, Inc. * (a) 200 27,720
335,785
Software — 13.4%
Anaplan, Inc. * 741 33,566
Avalara, Inc. * (a) 286 38,038
Bill.Com Holdings, Inc. * (a) 332 29,949
Blackline, Inc. * (a) 389 32,281
CyberArk Software Ltd. * 322 31,943
Dynatrace, Inc. * 365 14,839
Elastic NV * (a) 509 46,944
Envestnet, Inc. * 736 54,109
Everbridge, Inc. * (a) 237 32,777
Globant SA (Argentina) * (a) 229 34,277
HubSpot, Inc. * 231 51,848
Medallia, Inc. * (a) 847 21,375
Proofpoint, Inc.* 273 30,366
Smartsheet, Inc., Class A * (a) 889 45,266
Zendesk, Inc. * (a) 349 30,857
528,435
Specialty Retail — 4.5%
Aaron’s, Inc. 261 11,842
Floor & Decor Holdings, Inc., Class A * 424 24,446
Hudson Ltd., Class A * 2,182 10,628
Lithia Motors, Inc., Class A (a) 373 56,465
SEE NOTES TO FINANCIAL STATEMENTS.
32 J.P. MORGAN SMALL CAP FUNDS JUNE 30, 2020

INVESTMENTSSHARES
(000)VALUE($000)
Common Stocks — continued
Specialty Retail — continued
National Vision Holdings, Inc. * 1,892 57,742
Vroom, Inc. * 354 18,468
179,591
Trading Companies & Distributors — 2.9%
Applied Industrial Technologies, Inc. 489 30,494
Rush Enterprises, Inc., Class A 784 32,491
SiteOne Landscape Supply, Inc. * (a) 464 52,922
115,907
Total Common Stocks(Cost $2,885,532) 3,850,582
NO. OFRIGHTS
(000)
Rights — 0.0% (b)
Biotechnology — 0.0% (b)
Clementia Pharmaceuticals, Inc. (Canada) * ‡(Cost $ — ) 927 —(c)
SHARES(000)
Short-Term Investments — 11.1%
Investment Companies — 3.1%
JPMorgan Prime Money Market Fund Class IMShares, 0.47% (d) (e)(Cost $123,393) 123,317 123,428
INVESTMENTSSHARES
(000)VALUE($000)
Investment of Cash Collateral from Securities Loaned — 8.0%
JPMorgan Securities Lending Money Market FundAgency SL Class Shares, 0.51% (d) (e) 283,992 284,105
JPMorgan U.S. Government Money Market FundClass IM Shares, 0.14% (d) (e) 32,903 32,903
Total Investment of Cash Collateral from Securities Loaned(cost $317,005) 317,008
Total Short-Term Investments(Cost $440,398) 440,436
Total Investments — 108.4%(Cost $3,325,930) 4,291,018
Liabilities in Excess ofOther Assets — (8.4)% (330,865)
NET ASSETS — 100.0% 3,960,153
Percentages indicated are based on net assets.
Abbreviations
ADR American Depositary Receipt
(a) The security or a portion of this security is on loan at June 30,2020. The total value of securities on loan at June 30, 2020 isapproximately $305,026,000.
(b) Amount rounds to less than 0.1% of net assets.(c) Amount rounds to less than one thousand.(d) Investment in an affiliated fund, which is registered under the
Investment Company Act of 1940, as amended, and is advised byJ.P. Morgan Investment Management Inc.
(e) The rate shown is the current yield as of June 30, 2020.* Non-income producing security.‡ Value determined using significant unobservable inputs.
SEE NOTES TO FINANCIAL STATEMENTS.
JUNE 30, 2020 J.P. MORGAN SMALL CAP FUNDS 33

JPMorgan Small Cap Value FundS C H E D U L E O F P O R T F O L I O I N V E S T M E N T SAS OF JUNE 30 , 2 020
INVESTMENTSSHARES
(000)VALUE($000)
Common Stocks — 99.1%
Aerospace & Defense — 0.6%
AAR Corp. 70 1,449
Maxar Technologies, Inc. (a) 142 2,545
Moog, Inc., Class A 27 1,446
5,440
Air Freight & Logistics — 1.1%
Echo Global Logistics, Inc. * 261 5,639
Hub Group, Inc., Class A * 99 4,757
10,396
Airlines — 0.4%
Hawaiian Holdings, Inc. 108 1,514
SkyWest, Inc. 57 1,862
3,376
Auto Components — 1.4%
Adient plc * 188 3,085
American Axle & Manufacturing Holdings, Inc. * 62 474
Cooper Tire & Rubber Co. 62 1,709
Cooper-Standard Holdings, Inc. * (a) 6 73
Gentherm, Inc. * 90 3,481
Goodyear Tire & Rubber Co. (The) 320 2,862
Stoneridge, Inc. * 82 1,686
13,370
Banks — 16.4%
1st Source Corp. 76 2,718
American National Bankshares, Inc. 5 113
Atlantic Capital Bancshares, Inc. * 54 658
Atlantic Union Bankshares Corp. 6 137
BancFirst Corp. 89 3,611
BancorpSouth Bank 55 1,251
BankFinancial Corp. 159 1,337
Bankwell Financial Group, Inc. 17 269
Banner Corp. 30 1,132
Brookline Bancorp, Inc. 164 1,651
Bryn Mawr Bank Corp. 22 603
Cadence BanCorp 326 2,890
Cathay General Bancorp 146 3,837
Central Pacific Financial Corp. 317 5,078
Central Valley Community Bancorp 17 265
Century Bancorp, Inc., Class A (a) 3 218
CIT Group, Inc. 230 4,768
Citizens & Northern Corp. 10 200
City Holding Co. (a) 45 2,959
Codorus Valley Bancorp, Inc. 12 163
Columbia Banking System, Inc. 141 3,982
INVESTMENTSSHARES
(000)VALUE($000)
Banks — continued
Community Bank System, Inc. 89 5,092
Community Trust Bancorp, Inc. 86 2,829
Customers Bancorp, Inc. * 80 957
East West Bancorp, Inc. 9 317
Enterprise Financial Services Corp. 150 4,665
Equity Bancshares, Inc., Class A * 69 1,202
Farmers National Banc Corp. 78 927
Financial Institutions, Inc. 49 914
First Bancorp 22 539
First BanCorp (Puerto Rico) 857 4,788
First Citizens BancShares, Inc., Class A (a) 6 2,349
First Commonwealth Financial Corp. 682 5,644
First Community Bankshares, Inc. (a) 43 959
First Financial Corp. 15 538
First Hawaiian, Inc. 67 1,153
First Interstate BancSystem, Inc., Class A 25 770
First Midwest Bancorp, Inc. 129 1,725
First Northwest Bancorp 16 195
Flushing Financial Corp. 103 1,191
Glacier Bancorp, Inc. (a) 42 1,475
Great Southern Bancorp, Inc. 26 1,049
Great Western Bancorp, Inc. 275 3,780
Hancock Whitney Corp. 18 386
Hilltop Holdings, Inc. 170 3,129
Home BancShares, Inc. 272 4,185
HomeTrust Bancshares, Inc. 80 1,278
Hope Bancorp, Inc. 607 5,598
Independent Bank Corp. 39 576
Investors Bancorp, Inc. 688 5,851
Mackinac Financial Corp. 17 176
Mercantile Bank Corp. 14 307
OFG Bancorp (Puerto Rico) 74 985
Pacific Premier Bancorp, Inc. 72 1,552
People’s United Financial, Inc. 60 692
Preferred Bank (a) 12 531
Renasant Corp. 10 256
Republic Bancorp, Inc., Class A 14 451
S&T Bancorp, Inc. 16 380
Select Bancorp, Inc. * 152 1,240
South State Corp. 117 5,569
Tompkins Financial Corp. 16 1,030
TriState Capital Holdings, Inc. * 18 283
Trustmark Corp. (a) 366 8,965
UMB Financial Corp. 158 8,124
Umpqua Holdings Corp. 417 4,440
United Bankshares, Inc. 371 10,249
SEE NOTES TO FINANCIAL STATEMENTS.
34 J.P. MORGAN SMALL CAP FUNDS JUNE 30, 2020

INVESTMENTSSHARES
(000)VALUE($000)
Common Stocks — continued
Banks — continued
Valley National Bancorp 32 254
Washington Trust Bancorp, Inc. 27 874
Webster Financial Corp. 79 2,257
West BanCorp, Inc. 9 162
Westamerica BanCorp (a) 116 6,678
157,356
Biotechnology — 2.5%
89bio, Inc. * (a) 95 1,897
Arcus Biosciences, Inc. * (a) 192 4,746
Enanta Pharmaceuticals, Inc. * (a) 20 1,019
Epizyme, Inc. * 136 2,189
Fate Therapeutics, Inc. * (a) 101 3,452
Five Prime Therapeutics, Inc. * 93 569
Iovance Biotherapeutics, Inc. * (a) 138 3,796
Myriad Genetics, Inc. * 57 641
Protagonist Therapeutics, Inc. * 330 5,832
24,141
Building Products — 1.3%
Builders FirstSource, Inc. * 434 8,990
Caesarstone Ltd. 43 507
Masonite International Corp. * 6 482
Quanex Building Products Corp. 119 1,654
Resideo Technologies, Inc. * 23 265
UFP Industries, Inc. 9 446
12,344
Capital Markets — 1.5%
Blucora, Inc. * 96 1,091
Cowen, Inc., Class A (a) 157 2,537
Donnelley Financial Solutions, Inc. * (a) 128 1,073
Oppenheimer Holdings, Inc., Class A 10 224
Piper Sandler Cos. 20 1,207
Stifel Financial Corp. 153 7,270
Virtus Investment Partners, Inc. 12 1,349
14,751
Chemicals — 1.4%
FutureFuel Corp. 156 1,868
HB Fuller Co. 7 312
Koppers Holdings, Inc. * 34 646
Kraton Corp. * 64 1,097
Minerals Technologies, Inc. 87 4,070
PolyOne Corp. 80 2,098
Trinseo SA 104 2,302
Tronox Holdings plc, Class A (a) 122 883
13,276
INVESTMENTSSHARES
(000)VALUE($000)
Commercial Services & Supplies — 2.3%
ABM Industries, Inc. 232 8,429
ACCO Brands Corp. 796 5,654
Deluxe Corp. (a) 82 1,928
Ennis, Inc. 59 1,070
HNI Corp. 46 1,418
Pitney Bowes, Inc. (a) 156 405
Quad/Graphics, Inc. 473 1,537
Steelcase, Inc., Class A 154 1,860
22,301
Communications Equipment — 0.9%
ADTRAN, Inc. 233 2,551
Cambium Networks Corp. * 99 726
Comtech Telecommunications Corp. (a) 25 424
Infinera Corp. * (a) 518 3,064
NetScout Systems, Inc. * 88 2,239
9,004
Construction & Engineering — 3.8%
Aegion Corp. * 31 498
Arcosa, Inc. 124 5,224
Argan, Inc. 77 3,668
Dycom Industries, Inc. * 25 1,035
EMCOR Group, Inc. (a) 129 8,512
Fluor Corp. 96 1,160
MasTec, Inc. * (a) 115 5,169
MYR Group, Inc. * 123 3,909
Tutor Perini Corp. * 574 6,989
36,164
Consumer Finance — 0.6%
EZCORP, Inc., Class A * (a) 147 928
Navient Corp. 309 2,172
Nelnet, Inc., Class A 64 3,064
6,164
Containers & Packaging — 0.1%
Myers Industries, Inc. 39 562
Distributors — 0.4%
Core-Mark Holding Co., Inc. (a) 153 3,818
Diversified Consumer Services — 0.8%
American Public Education, Inc. * 75 2,229
Houghton Mifflin Harcourt Co. * 388 702
K12, Inc. * (a) 163 4,451
7,382
SEE NOTES TO FINANCIAL STATEMENTS.
JUNE 30, 2020 J.P. MORGAN SMALL CAP FUNDS 35

JPMorgan Small Cap Value FundS C H E D U L E O F P O R T F O L I O I N V E S T M E N T SAS OF JUNE 30 , 2 020 (con t inued )
INVESTMENTSSHARES
(000)VALUE($000)
Common Stocks — continued
Diversified Financial Services — 0.1%
Banco Latinoamericano de Comercio Exterior SA,Class E (Panama) 79 903
Marlin Business Services Corp. 23 192
1,095
Diversified Telecommunication Services — 0.7%
Consolidated Communications Holdings, Inc. * (a) 550 3,726
Liberty Latin America Ltd., Class A (Chile) * (a) 137 1,327
Liberty Latin America Ltd., Class C (Chile) * 178 1,677
6,730
Electric Utilities — 0.9%
IDACORP, Inc. 11 961
Portland General Electric Co. 183 7,643
Spark Energy, Inc., Class A (a) 66 469
9,073
Electrical Equipment — 0.3%
Bloom Energy Corp., Class A * (a) 10 106
LSI Industries, Inc. 41 268
Powell Industries, Inc. 105 2,873
3,247
Electronic Equipment, Instruments & Components — 2.4%
Bel Fuse, Inc., Class B 167 1,796
Benchmark Electronics, Inc. 313 6,762
OSI Systems, Inc. * (a) 8 597
Sanmina Corp. * 145 3,621
ScanSource, Inc. * 253 6,083
TTM Technologies, Inc. * (a) 349 4,136
22,995
Energy Equipment & Services — 1.1%
Bristow Group, Inc. * 20 274
Dril-Quip, Inc. * (a) 29 876
Matrix Service Co. * 404 3,922
NexTier Oilfield Solutions, Inc. * (a) 1,105 2,708
Patterson-UTI Energy, Inc. 67 232
SEACOR Holdings, Inc. * 82 2,331
Select Energy Services, Inc., Class A * 74 363
10,706
Entertainment — 0.6%
Cinemark Holdings, Inc. (a) 175 2,020
Eros International plc (India) * (a) 1,068 3,374
5,394
INVESTMENTSSHARES
(000)VALUE($000)
Equity Real Estate Investment Trusts (REITs) — 9.1%
Acadia Realty Trust (a) 118 1,536
Agree Realty Corp. (a) 31 2,030
Alexander & Baldwin, Inc. 141 1,716
American Assets Trust, Inc. 163 4,524
American Finance Trust, Inc. (a) 122 971
City Office REIT, Inc. 125 1,260
CoreCivic, Inc. 55 519
CorEnergy Infrastructure Trust, Inc. (a) 29 264
CoreSite Realty Corp. 20 2,445
DiamondRock Hospitality Co. 772 4,271
Easterly Government Properties, Inc. (a) 165 3,822
Essential Properties Realty Trust, Inc. 64 947
First Industrial Realty Trust, Inc. 105 4,025
Franklin Street Properties Corp. 42 213
GEO Group, Inc. (The) 84 991
Getty Realty Corp. 145 4,314
Gladstone Commercial Corp. 162 3,034
Hersha Hospitality Trust 18 105
Highwoods Properties, Inc. 21 788
Kite Realty Group Trust 63 729
Lexington Realty Trust (a) 326 3,435
Mack-Cali Realty Corp. 188 2,875
Monmouth Real Estate Investment Corp. 16 227
New Senior Investment Group, Inc. 136 494
Pebblebrook Hotel Trust 75 1,024
Physicians Realty Trust 216 3,783
Piedmont Office Realty Trust, Inc., Class A 188 3,126
PotlatchDeltic Corp. 138 5,228
PS Business Parks, Inc. 17 2,224
Retail Opportunity Investments Corp. 261 2,957
Retail Properties of America, Inc., Class A (a) 179 1,310
RLJ Lodging Trust 154 1,452
Saul Centers, Inc. 8 271
Service Properties Trust 22 159
SITE Centers Corp. 174 1,412
STAG Industrial, Inc. 152 4,451
Summit Hotel Properties, Inc. 51 300
Sunstone Hotel Investors, Inc. 943 7,685
Terreno Realty Corp. (a) 27 1,400
UMH Properties, Inc. 25 318
Urban Edge Properties 58 687
Urstadt Biddle Properties, Inc., Class A 55 651
Xenia Hotels & Resorts, Inc. 275 2,567
86,540
SEE NOTES TO FINANCIAL STATEMENTS.
36 J.P. MORGAN SMALL CAP FUNDS JUNE 30, 2020

INVESTMENTSSHARES
(000)VALUE($000)
Common Stocks — continued
Food & Staples Retailing — 0.6%
Rite Aid Corp. * (a) 41 705
SpartanNash Co. 222 4,707
5,412
Food Products — 1.0%
Darling Ingredients, Inc. * 75 1,844
Farmer Bros Co. * 105 768
Fresh Del Monte Produce, Inc. 126 3,092
Sanderson Farms, Inc. (a) 31 3,628
9,332
Gas Utilities — 1.7%
Northwest Natural Holding Co. 22 1,227
ONE Gas, Inc. (a) 70 5,417
Southwest Gas Holdings, Inc. 106 7,334
Spire, Inc. 36 2,352
16,330
Health Care Equipment & Supplies — 0.3%
Invacare Corp. 183 1,168
LivaNova plc * 20 953
Varex Imaging Corp. * (a) 80 1,206
3,327
Health Care Providers & Services — 1.8%
Community Health Systems, Inc. * (a) 422 1,270
Cross Country Healthcare, Inc. * 268 1,648
Magellan Health, Inc. * 62 4,517
Owens & Minor, Inc. (a) 554 4,219
Patterson Cos., Inc. (a) 50 1,109
Tenet Healthcare Corp. * 134 2,427
Tivity Health, Inc. * (a) 187 2,120
17,310
Health Care Technology — 0.8%
Allscripts Healthcare Solutions, Inc. * (a) 1,060 7,176
Computer Programs and Systems, Inc. (a) 22 495
7,671
Hotels, Restaurants & Leisure — 0.6%
Boyd Gaming Corp. 61 1,281
Brinker International, Inc. 66 1,574
International Game Technology plc 99 884
Marriott Vacations Worldwide Corp. 23 1,908
5,647
Household Durables — 2.2%
Helen of Troy Ltd. * 5 924
KB Home 79 2,418
INVESTMENTSSHARES
(000)VALUE($000)
Household Durables — continued
Meritage Homes Corp. * 44 3,357
Purple Innovation, Inc. * 233 4,192
Sonos, Inc. * 35 505
Taylor Morrison Home Corp. * 32 617
TRI Pointe Group, Inc. * 584 8,582
20,595
Household Products — 0.3%
Central Garden & Pet Co., Class A * 75 2,517
Independent Power and Renewable Electricity Producers — 1.1%
Atlantic Power Corp. * 1,458 2,915
Clearway Energy, Inc. 182 3,817
Clearway Energy, Inc., Class C 181 4,183
10,915
Insurance — 2.2%
Ambac Financial Group, Inc. * 118 1,683
American Equity Investment Life Holding Co. 221 5,456
AMERISAFE, Inc. 4 245
Argo Group International Holdings Ltd. 26 889
CNO Financial Group, Inc. 508 7,905
FedNat Holding Co. 16 176
Heritage Insurance Holdings, Inc. 71 923
Horace Mann Educators Corp. 8 309
MBIA, Inc. * (a) 174 1,262
National General Holdings Corp. 32 692
ProSight Global, Inc. * 31 279
Third Point Reinsurance Ltd. (Bermuda) * 91 685
United Insurance Holdings Corp. 80 627
21,131
Interactive Media & Services — 0.4%
Cars.com, Inc. * 451 2,596
Yelp, Inc. * 63 1,462
4,058
IT Services — 1.0%
KBR, Inc. (a) 168 3,777
Perficient, Inc. * 9 318
Perspecta, Inc. 166 3,854
Unisys Corp. * (a) 121 1,318
9,267
Machinery — 2.5%
AGCO Corp. 67 3,727
Astec Industries, Inc. (a) 95 4,390
CIRCOR International, Inc. * 21 540
SEE NOTES TO FINANCIAL STATEMENTS.
JUNE 30, 2020 J.P. MORGAN SMALL CAP FUNDS 37

JPMorgan Small Cap Value FundS C H E D U L E O F P O R T F O L I O I N V E S T M E N T SAS OF JUNE 30 , 2 020 (con t inued )
INVESTMENTSSHARES
(000)VALUE($000)
Common Stocks — continued
Machinery — continued
Douglas Dynamics, Inc. 29 1,033
EnPro Industries, Inc. 5 261
Graham Corp. 18 229
Hurco Cos., Inc. 12 330
LB Foster Co., Class A * 24 300
Manitowoc Co., Inc. (The) * 35 378
Meritor, Inc. * 61 1,202
Navistar International Corp. * 17 485
Terex Corp. 120 2,252
Wabash National Corp. 784 8,327
23,454
Media — 1.0%
AMC Networks, Inc., Class A * 2 37
comScore, Inc. * 828 2,568
Gannett Co., Inc. (a) 651 898
Hemisphere Media Group, Inc. * 212 2,084
Sinclair Broadcast Group, Inc., Class A (a) 133 2,450
WideOpenWest, Inc. * 283 1,493
9,530
Metals & Mining — 2.1%
Arconic Corp. * 24 329
Century Aluminum Co. * 229 1,634
Commercial Metals Co. 248 5,057
Kaiser Aluminum Corp. 23 1,679
SunCoke Energy, Inc. 50 148
Warrior Met Coal, Inc. 232 3,577
Worthington Industries, Inc. 213 7,937
20,361
Mortgage Real Estate Investment Trusts (REITs) — 2.5%
ARMOUR Residential REIT, Inc. 168 1,573
Blackstone Mortgage Trust, Inc., Class A (a) 282 6,791
Cherry Hill Mortgage Investment Corp. 20 183
Dynex Capital, Inc. (a) 24 342
Ellington Financial, Inc. 26 310
Invesco Mortgage Capital, Inc. (a) 117 436
KKR Real Estate Finance Trust, Inc. (a) 139 2,296
Ladder Capital Corp. 325 2,636
PennyMac Mortgage Investment Trust 163 2,850
Redwood Trust, Inc. (a) 239 1,674
TPG RE Finance Trust, Inc. (a) 176 1,516
Two Harbors Investment Corp. (a) 563 2,835
23,442
INVESTMENTSSHARES
(000)VALUE($000)
Multiline Retail — 0.8%
Big Lots, Inc. 118 4,935
Dillard’s, Inc., Class A (a) 108 2,785
7,720
Multi-Utilities — 1.2%
Avista Corp. 95 3,457
Black Hills Corp. 100 5,666
Unitil Corp. 44 1,986
11,109
Oil, Gas & Consumable Fuels — 2.5%
Arch Resources, Inc. (a) 68 1,921
Berry Corp. 240 1,157
CVR Energy, Inc. 155 3,123
Delek US Holdings, Inc. (a) 204 3,548
Dorian LPG Ltd. * 106 817
Green Plains, Inc. * (a) 208 2,125
Kosmos Energy Ltd. (Ghana) 240 398
Magnolia Oil & Gas Corp., Class A * (a) 260 1,577
PDC Energy, Inc. * 158 1,963
Peabody Energy Corp. 74 212
Range Resources Corp. 113 635
Renewable Energy Group, Inc. * (a) 65 1,606
REX American Resources Corp. * 41 2,844
Southwestern Energy Co. * 207 531
Talos Energy, Inc. * 65 602
W&T Offshore, Inc. * (a) 389 886
23,945
Paper & Forest Products — 2.1%
Boise Cascade Co. 146 5,494
Domtar Corp. (a) 103 2,181
Louisiana-Pacific Corp. (a) 164 4,196
PH Glatfelter Co. 51 817
Schweitzer-Mauduit International, Inc. (a) 159 5,326
Verso Corp., Class A 185 2,208
20,222
Personal Products — 0.2%
Edgewell Personal Care Co. * 62 1,926
Pharmaceuticals — 1.4%
Endo International plc * (a) 948 3,250
Intra-Cellular Therapies, Inc. * 77 1,971
Lannett Co., Inc. * 477 3,460
Prestige Consumer Healthcare, Inc. * 53 1,998
Xeris Pharmaceuticals, Inc. * (a) 910 2,421
13,100
SEE NOTES TO FINANCIAL STATEMENTS.
38 J.P. MORGAN SMALL CAP FUNDS JUNE 30, 2020

INVESTMENTSSHARES
(000)VALUE($000)
Common Stocks — continued
Professional Services — 2.4%
Barrett Business Services, Inc. 98 5,213
GP Strategies Corp. * 183 1,568
Heidrick & Struggles International, Inc. 98 2,114
Huron Consulting Group, Inc. * 88 3,907
Kelly Services, Inc., Class A 244 3,853
TrueBlue, Inc. * 423 6,454
23,109
Real Estate Management & Development — 0.2%
Realogy Holdings Corp. 286 2,117
Road & Rail — 0.9%
ArcBest Corp. 307 8,144
Covenant Transportation Group, Inc., Class A * 31 440
8,584
Semiconductors & Semiconductor Equipment — 1.9%
Amkor Technology, Inc. * 568 6,987
Cohu, Inc. 170 2,950
NeoPhotonics Corp. * 77 680
SunPower Corp. * (a) 522 4,000
Veeco Instruments, Inc. * 252 3,401
18,018
Software — 2.2%
ACI Worldwide, Inc. * 79 2,140
Avaya Holdings Corp. * (a) 284 3,513
MicroStrategy, Inc., Class A * 7 781
SecureWorks Corp., Class A * 79 908
Synchronoss Technologies, Inc. * (a) 863 3,046
Xperi Holding Corp. 738 10,898
21,286
Specialty Retail — 2.9%
Aaron’s, Inc. 32 1,457
Abercrombie & Fitch Co., Class A (a) 185 1,973
Bed Bath & Beyond, Inc. (a) 226 2,397
Cato Corp. (The), Class A 171 1,396
Express, Inc. * (a) 389 600
Genesco, Inc. * 18 399
Haverty Furniture Cos., Inc. 94 1,507
Hibbett Sports, Inc. * (a) 164 3,426
Lithia Motors, Inc., Class A 8 1,271
Murphy USA, Inc. * 24 2,657
Office Depot, Inc. 1,943 4,565
Sleep Number Corp. * 35 1,462
Sonic Automotive, Inc., Class A 46 1,468
INVESTMENTSSHARES
(000)VALUE($000)
Specialty Retail — continued
Winmark Corp. 6 942
Zumiez, Inc. * 97 2,661
28,181
Technology Hardware, Storage & Peripherals — 0.1%
Diebold Nixdorf, Inc. * 118 715
Textiles, Apparel & Luxury Goods — 0.7%
Fossil Group, Inc. * (a) 68 315
G-III Apparel Group Ltd. * (a) 239 3,174
Movado Group, Inc. 19 205
Wolverine World Wide, Inc. 121 2,869
6,563
Thrifts & Mortgage Finance — 4.0%
ESSA Bancorp, Inc. 14 195
Essent Group Ltd. 166 6,032
Luther Burbank Corp. 44 437
Meridian Bancorp, Inc. 219 2,542
MGIC Investment Corp. 358 2,931
Mr Cooper Group, Inc. * 35 439
Northfield Bancorp, Inc. 440 5,068
Premier Financial Corp. 59 1,050
Radian Group, Inc. 438 6,796
Territorial Bancorp, Inc. 11 264
Washington Federal, Inc. (a) 349 9,366
Waterstone Financial, Inc. 63 927
Western New England Bancorp, Inc. 46 265
WSFS Financial Corp. 60 1,709
38,021
Tobacco — 0.1%
Vector Group Ltd. 76 769
Trading Companies & Distributors — 2.5%
BMC Stock Holdings, Inc. * 177 4,445
DXP Enterprises, Inc. * 81 1,619
Foundation Building Materials, Inc. * (a) 84 1,313
MRC Global, Inc. * 354 2,093
NOW, Inc. * (a) 926 7,987
Titan Machinery, Inc. * 136 1,475
Veritiv Corp. * (a) 85 1,443
WESCO International, Inc. * 91 3,195
23,570
Wireless Telecommunication Services — 0.2%
Gogo, Inc. * (a) 507 1,602
Total Common Stocks(Cost $967,296) 946,481
SEE NOTES TO FINANCIAL STATEMENTS.
JUNE 30, 2020 J.P. MORGAN SMALL CAP FUNDS 39

JPMorgan Small Cap Value FundS C H E D U L E O F P O R T F O L I O I N V E S T M E N T SAS OF JUNE 30 , 2 020 (con t inued )
INVESTMENTSSHARES
(000)VALUE($000)
Short-Term Investments — 8.8%
Investment Companies — 1.5%
JPMorgan Prime Money Market Fund Class IMShares, 0.47% (b) (c)(Cost $14,793) 14,785 14,798
Investment of Cash Collateral from Securities Loaned — 7.3%
JPMorgan Securities Lending Money Market FundAgency SL Class Shares, 0.51% (b) (c) 64,006 64,032
JPMorgan U.S. Government Money Market FundClass IM Shares, 0.14% (b) (c) 5,596 5,596
Total Investment of Cash Collateral from Securities Loaned(Cost $69,620) 69,628
Total Short-Term Investments(Cost $84,413) 84,426
Total Investments — 107.9%(Cost $1,051,709) 1,030,907
Liabilities in Excess ofOther Assets — (7.9)% (75,334)
NET ASSETS — 100.0% 955,573
Percentages indicated are based on net assets.
Abbreviations
REIT Real Estate Investment Trust
(a) The security or a portion of this security is on loan at June 30,2020. The total value of securities on loan at June 30, 2020 isapproximately $67,671,000.
(b) Investment in an affiliated fund, which is registered under theInvestment Company Act of 1940, as amended, and is advised byJ.P. Morgan Investment Management Inc.
(c) The rate shown is the current yield as of June 30, 2020.* Non-income producing security.
Futures contracts outstanding as of June 30, 2020 (amounts in thousands, except number of contracts):
DESCRIPTIONNUMBER OFCONTRACTS
EXPIRATIONDATE
TRADINGCURRENCY
NOTIONALAMOUNT ($)
VALUE ANDUNREALIZED
APPRECIATION(DEPRECIATION) ($)
Long Contracts
Russell 2000 E-Mini Index 132 09/2020 USD 9,480 279
AbbreviationsUSD United States Dollar
SEE NOTES TO FINANCIAL STATEMENTS.
40 J.P. MORGAN SMALL CAP FUNDS JUNE 30, 2020

JPMorgan U.S. Small Company FundS C H E D U L E O F P O R T F O L I O I N V E S T M E N T SAS OF JUNE 30 , 2 020
INVESTMENTSSHARES
(000)VALUE($000)
Common Stocks — 98.7%
Aerospace & Defense — 0.8%
AAR Corp. 125 2,584
Maxar Technologies, Inc. (a) 204 3,664
Moog, Inc., Class A 20 1,041
7,289
Air Freight & Logistics — 0.5%
Echo Global Logistics, Inc. * (a) 115 2,483
Hub Group, Inc., Class A * 43 2,068
4,551
Auto Components — 1.2%
Adient plc * 68 1,118
Gentherm, Inc. * 106 4,139
Goodyear Tire & Rubber Co. (The) 101 904
Stoneridge, Inc. * 209 4,309
10,470
Banks — 7.8%
1st Source Corp. 34 1,192
Atlantic Union Bankshares Corp. 27 624
BancFirst Corp. (a) 102 4,150
BancorpSouth Bank 137 3,123
BankFinancial Corp. 50 422
Banner Corp. 106 4,042
Brookline Bancorp, Inc. 136 1,375
Cadence BanCorp 189 1,674
Cathay General Bancorp 54 1,409
Central Pacific Financial Corp. 167 2,672
Central Valley Community Bancorp 12 192
CIT Group, Inc. 99 2,054
Columbia Banking System, Inc. 133 3,778
CVB Financial Corp. 222 4,155
Enterprise Financial Services Corp. 31 977
Equity Bancshares, Inc., Class A * 63 1,099
First Commonwealth Financial Corp. 224 1,857
First Community Bankshares, Inc. 15 332
First Hawaiian, Inc. 47 816
Flushing Financial Corp. 45 524
Great Western Bancorp, Inc. 101 1,391
Hope Bancorp, Inc. 233 2,152
IBERIABANK Corp. 20 888
Independent Bank Corp. 64 947
Investors Bancorp, Inc. 151 1,280
National Bank Holdings Corp., Class A 13 340
Old National Bancorp 258 3,549
PacWest Bancorp 37 720
People’s United Financial, Inc. (a) 75 863
INVESTMENTSSHARES
(000)VALUE($000)
Banks — continued
South State Corp. 8 372
Trustmark Corp. (a) 336 8,241
UMB Financial Corp. (a) 33 1,708
United Bankshares, Inc. 98 2,720
Webster Financial Corp. 32 916
West BanCorp, Inc. 22 383
Westamerica BanCorp (a) 117 6,702
69,639
Biotechnology — 9.7%
ACADIA Pharmaceuticals, Inc. * 104 5,026
Aimmune Therapeutics, Inc. * (a) 67 1,111
Alector, Inc. * 27 654
Amicus Therapeutics, Inc. * 216 3,264
Arena Pharmaceuticals, Inc. * (a) 66 4,147
Atara Biotherapeutics, Inc. * 167 2,438
Athenex, Inc. * (a) 163 2,239
Biohaven Pharmaceutical Holding Co. Ltd. * (a) 67 4,906
Black Diamond Therapeutics, Inc. * (a) 61 2,576
Bluebird Bio, Inc. * (a) 12 705
Bridgebio Pharma, Inc. * (a) 54 1,751
Clovis Oncology, Inc. * (a) 213 1,441
CytomX Therapeutics, Inc. * 74 614
Eagle Pharmaceuticals, Inc. * 18 884
Eiger BioPharmaceuticals, Inc. * (a) 175 1,680
Esperion Therapeutics, Inc. * (a) 23 1,180
Flexion Therapeutics, Inc. * (a) 230 3,023
Global Blood Therapeutics, Inc. * (a) 56 3,510
Gritstone Oncology, Inc. * (a) 30 197
Homology Medicines, Inc. * 45 681
Intercept Pharmaceuticals, Inc. * 32 1,514
La Jolla Pharmaceutical Co. * 65 276
LogicBio Therapeutics, Inc. * (a) 297 2,512
Mersana Therapeutics, Inc. * 184 4,297
Myriad Genetics, Inc. * (a) 129 1,459
Principia Biopharma, Inc. * (a) 52 3,127
Protagonist Therapeutics, Inc. * 171 3,023
Puma Biotechnology, Inc. * (a) 231 2,408
REGENXBIO, Inc. * (a) 73 2,674
REVOLUTION Medicines, Inc. * (a) 31 969
Sarepta Therapeutics, Inc. * 20 3,215
Seres Therapeutics, Inc. * (a) 777 3,700
Solid Biosciences, Inc. * 69 201
Sutro Biopharma, Inc. * (a) 27 209
TCR2 Therapeutics, Inc. * (a) 55 847
TG Therapeutics, Inc. * 132 2,577
SEE NOTES TO FINANCIAL STATEMENTS.
JUNE 30, 2020 J.P. MORGAN SMALL CAP FUNDS 41

JPMorgan U.S. Small Company FundS C H E D U L E O F P O R T F O L I O I N V E S T M E N T SAS OF JUNE 30 , 2 020 (con t inued )
INVESTMENTSSHARES
(000)VALUE($000)
Common Stocks — continued
Biotechnology — continued
UroGen Pharma Ltd. * (a) 93 2,437
Vanda Pharmaceuticals, Inc. * 110 1,256
Viela Bio, Inc. * (a) 65 2,794
Voyager Therapeutics, Inc. * 117 1,477
Xencor, Inc. * 84 2,709
Y-mAbs Therapeutics, Inc. * 8 337
86,045
Building Products — 1.3%
Builders FirstSource, Inc. * 247 5,109
Masonite International Corp. * 56 4,387
Quanex Building Products Corp. 89 1,228
UFP Industries, Inc. 19 921
11,645
Capital Markets — 1.5%
Cowen, Inc., Class A (a) 106 1,711
Donnelley Financial Solutions, Inc. * (a) 74 623
Focus Financial Partners, Inc., Class A * (a) 68 2,254
Houlihan Lokey, Inc. 69 3,840
Moelis & Co., Class A 7 215
Piper Sandler Cos. 12 680
Stifel Financial Corp. 71 3,375
Virtus Investment Partners, Inc. 8 954
13,652
Chemicals — 1.3%
FutureFuel Corp. 168 2,008
Koppers Holdings, Inc. * 34 631
Minerals Technologies, Inc. 61 2,843
PolyOne Corp. 116 3,053
Stepan Co. 10 1,010
Trinseo SA 70 1,550
Tronox Holdings plc, Class A (a) 88 638
11,733
Commercial Services & Supplies — 2.2%
ABM Industries, Inc. 115 4,186
ACCO Brands Corp. (a) 606 4,302
Deluxe Corp. 66 1,561
Ennis, Inc. 188 3,403
HNI Corp. (a) 128 3,898
Quad/Graphics, Inc. (a) 256 832
Steelcase, Inc., Class A 133 1,600
19,782
INVESTMENTSSHARES
(000)VALUE($000)
Communications Equipment — 0.7%
ADTRAN, Inc. 356 3,890
Extreme Networks, Inc. * 180 782
KVH Industries, Inc. * 39 347
PCTEL, Inc. * 79 528
Plantronics, Inc. 77 1,136
6,683
Construction & Engineering — 3.5%
Arcosa, Inc. 78 3,283
Argan, Inc. 60 2,843
Comfort Systems USA, Inc. 70 2,836
EMCOR Group, Inc. 149 9,822
MasTec, Inc. * (a) 128 5,743
MYR Group, Inc. * 66 2,113
Tutor Perini Corp. * 411 5,005
31,645
Construction Materials — 0.0% (b)
US Concrete, Inc. * 17 417
Consumer Finance — 1.1%
Credit Acceptance Corp. * (a) 6 2,504
EZCORP, Inc., Class A * 71 449
FirstCash, Inc. (a) 34 2,316
Green Dot Corp., Class A * (a) 29 1,401
Navient Corp. 410 2,883
Nelnet, Inc., Class A 8 391
9,944
Containers & Packaging — 0.2%
Graphic Packaging Holding Co. 73 1,020
Myers Industries, Inc. 67 981
2,001
Distributors — 0.6%
Core-Mark Holding Co., Inc. (a) 221 5,503
Diversified Consumer Services — 0.8%
American Public Education, Inc. * 69 2,040
Houghton Mifflin Harcourt Co. * 924 1,673
K12, Inc. * (a) 139 3,792
7,505
Diversified Telecommunication Services — 0.6%
Consolidated Communications Holdings, Inc. * (a) 793 5,367
Electric Utilities — 0.9%
IDACORP, Inc. 10 865
PNM Resources, Inc. (a) 48 1,837
SEE NOTES TO FINANCIAL STATEMENTS.
42 J.P. MORGAN SMALL CAP FUNDS JUNE 30, 2020

INVESTMENTSSHARES
(000)VALUE($000)
Common Stocks — continued
Electric Utilities — continued
Portland General Electric Co. 105 4,383
Spark Energy, Inc., Class A (a) 169 1,194
8,279
Electrical Equipment — 0.6%
Bloom Energy Corp., Class A * (a) 7 74
Generac Holdings, Inc. * 17 2,122
LSI Industries, Inc. 52 339
Powell Industries, Inc. 90 2,460
4,995
Electronic Equipment, Instruments & Components — 2.4%
Bel Fuse, Inc., Class B 128 1,373
Benchmark Electronics, Inc. 155 3,346
Fabrinet (Thailand) * 26 1,653
Insight Enterprises, Inc. * (a) 32 1,555
OSI Systems, Inc. * (a) 36 2,715
Sanmina Corp. * 124 3,097
ScanSource, Inc. * 218 5,262
TTM Technologies, Inc. * (a) 205 2,430
21,431
Energy Equipment & Services — 0.6%
Matrix Service Co. * 316 3,071
NexTier Oilfield Solutions, Inc. * 807 1,976
5,047
Entertainment — 0.1%
Cinemark Holdings, Inc. 67 777
Eros International plc (India) * 78 247
1,024
Equity Real Estate Investment Trusts (REITs) — 5.9%
Acadia Realty Trust (a) 62 798
Agree Realty Corp. (a) 16 1,038
Alexander & Baldwin, Inc. 36 438
American Assets Trust, Inc. 172 4,802
American Finance Trust, Inc. (a) 22 176
Americold Realty Trust 135 4,886
CorEnergy Infrastructure Trust, Inc. (a) 18 168
CoreSite Realty Corp. 29 3,496
DiamondRock Hospitality Co. 464 2,565
Easterly Government Properties, Inc. 38 881
EastGroup Properties, Inc. 15 1,761
Equity LifeStyle Properties, Inc. 33 2,043
Essential Properties Realty Trust, Inc. 22 325
First Industrial Realty Trust, Inc. 111 4,282
INVESTMENTSSHARES
(000)VALUE($000)
Equity Real Estate Investment Trusts (REITs) — continued
Four Corners Property Trust, Inc. 18 447
GEO Group, Inc. (The) 56 660
Getty Realty Corp. 64 1,894
Gladstone Commercial Corp. 39 723
Hersha Hospitality Trust 14 82
Highwoods Properties, Inc. 24 885
Innovative Industrial Properties, Inc. 4 326
Lexington Realty Trust (a) 123 1,294
Mack-Cali Realty Corp. 57 873
New Senior Investment Group, Inc. 125 454
Pebblebrook Hotel Trust 35 477
Physicians Realty Trust 95 1,659
Piedmont Office Realty Trust, Inc., Class A 105 1,741
PotlatchDeltic Corp. (a) 83 3,149
PS Business Parks, Inc. 3 401
QTS Realty Trust, Inc., Class A 8 538
Retail Opportunity Investments Corp. 117 1,323
RLJ Lodging Trust (a) 72 681
Ryman Hospitality Properties, Inc. 23 782
Saul Centers, Inc. 31 1,000
STAG Industrial, Inc. 34 985
Summit Hotel Properties, Inc. 48 282
Sunstone Hotel Investors, Inc. 427 3,482
UMH Properties, Inc. 22 283
Xenia Hotels & Resorts, Inc. 137 1,274
53,354
Food & Staples Retailing — 0.5%
SpartanNash Co. (a) 202 4,284
Food Products — 1.9%
Darling Ingredients, Inc. * 307 7,553
Farmer Bros Co. * 101 739
Fresh Del Monte Produce, Inc. 99 2,447
John B Sanfilippo & Son, Inc. 36 3,038
Sanderson Farms, Inc. (a) 25 2,839
Seneca Foods Corp., Class A * (a) 13 431
17,047
Gas Utilities — 0.8%
New Jersey Resources Corp. (a) 22 731
Northwest Natural Holding Co. 16 904
ONE Gas, Inc. (a) 47 3,630
Southwest Gas Holdings, Inc. 32 2,230
7,495
SEE NOTES TO FINANCIAL STATEMENTS.
JUNE 30, 2020 J.P. MORGAN SMALL CAP FUNDS 43

JPMorgan U.S. Small Company FundS C H E D U L E O F P O R T F O L I O I N V E S T M E N T SAS OF JUNE 30 , 2 020 (con t inued )
INVESTMENTSSHARES
(000)VALUE($000)
Common Stocks — continued
Health Care Equipment & Supplies — 4.2%
Accuray, Inc. * (a) 819 1,662
AngioDynamics, Inc. * 190 1,933
Cutera, Inc. * (a) 331 4,023
Integer Holdings Corp. * 88 6,411
Invacare Corp. 191 1,213
Lantheus Holdings, Inc. * 50 718
LivaNova plc * 60 2,897
Natus Medical, Inc. * (a) 162 3,535
NuVasive, Inc. * (a) 71 3,945
Orthofix Medical, Inc. * (a) 62 1,971
SeaSpine Holdings Corp. * 231 2,416
Sientra, Inc. * (a) 1,067 4,129
Varex Imaging Corp. * (a) 224 3,397
38,250
Health Care Providers & Services — 2.2%
Community Health Systems, Inc. * (a) 747 2,248
Cross Country Healthcare, Inc. * 643 3,959
Owens & Minor, Inc. (a) 596 4,543
Patterson Cos., Inc. (a) 189 4,154
Tenet Healthcare Corp. * 178 3,218
Triple-S Management Corp., Class B(Puerto Rico) * (a) 109 2,064
20,186
Health Care Technology — 1.2%
Allscripts Healthcare Solutions, Inc. * (a) 1,203 8,143
Evolent Health, Inc., Class A * (a) 355 2,530
10,673
Hotels, Restaurants & Leisure — 1.2%
Bloomin’ Brands, Inc. (a) 334 3,559
Boyd Gaming Corp. 90 1,875
Brinker International, Inc. (a) 86 2,057
Eldorado Resorts, Inc. * 11 429
Marriott Vacations Worldwide Corp. 21 1,751
Penn National Gaming, Inc. * 28 855
10,526
Household Durables — 2.3%
Hamilton Beach Brands Holding Co., Class A 26 311
KB Home (a) 236 7,245
Meritage Homes Corp. * 18 1,340
Sonos, Inc. * 34 501
TRI Pointe Group, Inc. * 753 11,064
20,461
INVESTMENTSSHARES
(000)VALUE($000)
Household Products — 0.2%
Central Garden & Pet Co., Class A * 42 1,419
Independent Power and Renewable Electricity Producers — 0.5%
Atlantic Power Corp. * 1,506 3,011
Clearway Energy, Inc. (a) 59 1,247
Clearway Energy, Inc., Class C 15 346
4,604
Insurance — 1.0%
Ambac Financial Group, Inc. * 26 378
American Equity Investment Life Holding Co. 48 1,187
Argo Group International Holdings Ltd. 17 578
CNO Financial Group, Inc. 220 3,427
First American Financial Corp. 22 1,036
MBIA, Inc. * 38 276
Primerica, Inc. (a) 16 1,813
ProSight Global, Inc. * 29 257
8,952
Interactive Media & Services — 0.6%
Cars.com, Inc. * 235 1,352
Yelp, Inc. * (a) 184 4,266
5,618
Internet & Direct Marketing Retail — 0.6%
Groupon, Inc. * 16 296
Stamps.com, Inc. * 27 4,886
5,182
IT Services — 2.5%
CACI International, Inc., Class A * 17 3,741
Euronet Worldwide, Inc. * 7 656
Evo Payments, Inc., Class A * 170 3,883
KBR, Inc. 51 1,141
NIC, Inc. 52 1,184
Perficient, Inc. * 211 7,562
Perspecta, Inc. 186 4,328
22,495
Life Sciences Tools & Services — 1.0%
Adaptive Biotechnologies Corp. * (a) 38 1,848
Fluidigm Corp. * 822 3,297
Medpace Holdings, Inc. * (a) 31 2,853
Personalis, Inc. * 43 562
8,560
Machinery — 2.5%
Astec Industries, Inc. (a) 97 4,478
Douglas Dynamics, Inc. 86 3,033
SEE NOTES TO FINANCIAL STATEMENTS.
44 J.P. MORGAN SMALL CAP FUNDS JUNE 30, 2020

INVESTMENTSSHARES
(000)VALUE($000)
Common Stocks — continued
Machinery — continued
Enerpac Tool Group Corp. 10 170
EnPro Industries, Inc. 31 1,543
Kadant, Inc. 23 2,330
LB Foster Co., Class A * 14 185
Meritor, Inc. * 111 2,190
Wabash National Corp. (a) 787 8,362
22,291
Media — 1.1%
AMC Networks, Inc., Class A * 5 117
Central European Media Enterprises Ltd., Class A(Czech Republic) * 473 1,675
comScore, Inc. * 359 1,113
Gannett Co., Inc. (a) 80 110
Hemisphere Media Group, Inc. * 182 1,785
National CineMedia, Inc. (a) 576 1,709
Sinclair Broadcast Group, Inc., Class A (a) 116 2,135
WideOpenWest, Inc. * 282 1,485
10,129
Metals & Mining — 1.4%
Century Aluminum Co. * 27 195
Commercial Metals Co. 133 2,711
Kaiser Aluminum Corp. 14 1,060
SunCoke Energy, Inc. 23 67
Warrior Met Coal, Inc. (a) 200 3,075
Worthington Industries, Inc. 157 5,871
12,979
Mortgage Real Estate Investment Trusts (REITs) — 1.1%
Blackstone Mortgage Trust, Inc., Class A (a) 180 4,345
Ellington Financial, Inc. 8 97
Invesco Mortgage Capital, Inc. (a) 31 116
KKR Real Estate Finance Trust, Inc. 84 1,386
Ladder Capital Corp. 52 420
PennyMac Mortgage Investment Trust 93 1,627
Redwood Trust, Inc. (a) 159 1,110
TPG RE Finance Trust, Inc. (a) 39 333
Two Harbors Investment Corp. (a) 134 674
10,108
Multiline Retail — 0.8%
Big Lots, Inc. 117 4,914
Dillard’s, Inc., Class A (a) 73 1,885
6,799
Multi-Utilities — 0.1%
Black Hills Corp. 22 1,241
INVESTMENTSSHARES
(000)VALUE($000)
Oil, Gas & Consumable Fuels — 1.2%
Arch Resources, Inc. (a) 34 970
CVR Energy, Inc. 12 241
Delek US Holdings, Inc. (a) 174 3,029
Dorian LPG Ltd. * 3 27
Green Plains, Inc. * (a) 42 424
Magnolia Oil & Gas Corp., Class A * (a) 81 493
PDC Energy, Inc. * 58 725
Peabody Energy Corp. 40 115
Range Resources Corp. 46 258
Renewable Energy Group, Inc. * (a) 58 1,433
REX American Resources Corp. * 39 2,676
W&T Offshore, Inc. * (a) 363 827
11,218
Paper & Forest Products — 1.3%
Boise Cascade Co. (a) 123 4,625
Domtar Corp. 70 1,482
Louisiana-Pacific Corp. (a) 137 3,504
PH Glatfelter Co. 24 390
Verso Corp., Class A (a) 157 1,883
11,884
Personal Products — 0.4%
Edgewell Personal Care Co. * (a) 29 918
Herbalife Nutrition Ltd. * (a) 23 1,015
Medifast, Inc. (a) 8 1,152
USANA Health Sciences, Inc. * (a) 13 944
4,029
Pharmaceuticals — 3.0%
AMAG Pharmaceuticals, Inc. * (a) 15 112
Arvinas, Inc. * (a) 2 78
Endo International plc * 532 1,823
Horizon Therapeutics plc * 79 4,405
Lannett Co., Inc. * 390 2,834
Marinus Pharmaceuticals, Inc. * (a) 738 1,874
Menlo Therapeutics, Inc. * (a) 54 94
MyoKardia, Inc. * 76 7,354
Prestige Consumer Healthcare, Inc. * 24 894
Reata Pharmaceuticals, Inc., Class A * (a) 36 5,542
Xeris Pharmaceuticals, Inc. * (a) 791 2,105
27,115
Professional Services — 2.7%
Barrett Business Services, Inc. 120 6,370
GP Strategies Corp. * 132 1,129
SEE NOTES TO FINANCIAL STATEMENTS.
JUNE 30, 2020 J.P. MORGAN SMALL CAP FUNDS 45

JPMorgan U.S. Small Company FundS C H E D U L E O F P O R T F O L I O I N V E S T M E N T SAS OF JUNE 30 , 2 020 (con t inued )
INVESTMENTSSHARES
(000)VALUE($000)
Common Stocks — continued
Professional Services — continued
Heidrick & Struggles International, Inc. 15 318
Huron Consulting Group, Inc. * (a) 118 5,207
Insperity, Inc. 19 1,243
Kforce, Inc. 88 2,574
Korn Ferry (a) 61 1,862
TrueBlue, Inc. * 368 5,624
24,327
Real Estate Management & Development — 0.1%
Realogy Holdings Corp. 117 868
Road & Rail — 0.7%
ArcBest Corp. 204 5,414
Schneider National, Inc., Class B 32 797
6,211
Semiconductors & Semiconductor Equipment — 3.7%
Amkor Technology, Inc. * (a) 505 6,218
Cirrus Logic, Inc. * 30 1,832
Cohu, Inc. 109 1,888
MACOM Technology Solutions Holdings, Inc. * (a) 131 4,507
Rambus, Inc. * (a) 527 8,011
SunPower Corp. * (a) 529 4,055
Synaptics, Inc. * (a) 76 4,562
Veeco Instruments, Inc. * (a) 167 2,259
33,332
Software — 4.5%
ACI Worldwide, Inc. * 139 3,750
Avaya Holdings Corp. * (a) 771 9,527
CommVault Systems, Inc. * (a) 104 4,031
Cornerstone OnDemand, Inc. * 84 3,235
eGain Corp. * 122 1,354
MicroStrategy, Inc., Class A * 11 1,283
Proofpoint, Inc. * 14 1,600
Qualys, Inc. * 9 892
Synchronoss Technologies, Inc. * (a) 1,182 4,172
Telenav, Inc. * 104 569
Xperi Holding Corp. (a) 654 9,653
40,066
Specialty Retail — 2.9%
Bed Bath & Beyond, Inc. 133 1,406
Guess?, Inc. 133 1,281
Haverty Furniture Cos., Inc. (a) 54 858
Hibbett Sports, Inc. * (a) 146 3,066
Murphy USA, Inc. * 37 4,135
Office Depot, Inc. 1,874 4,403
INVESTMENTSSHARES
(000)VALUE($000)
Specialty Retail — continued
Rent-A-Center, Inc. 44 1,219
Sleep Number Corp. * (a) 89 3,685
Sonic Automotive, Inc., Class A (a) 15 463
Winmark Corp. 8 1,284
Zumiez, Inc. * 150 4,098
25,898
Technology Hardware, Storage & Peripherals — 0.1%
Avid Technology, Inc. * 181 1,316
Textiles, Apparel & Luxury Goods — 1.0%
Deckers Outdoor Corp. * 23 4,522
Fossil Group, Inc. * (a) 61 286
G-III Apparel Group Ltd. * (a) 317 4,206
9,014
Thrifts & Mortgage Finance — 2.9%
Capitol Federal Financial, Inc. 12 129
Essent Group Ltd. 129 4,668
Meridian Bancorp, Inc. 329 3,815
MGIC Investment Corp. (a) 246 2,013
NMI Holdings, Inc., Class A * 33 531
Northfield Bancorp, Inc. 310 3,569
Premier Financial Corp. 24 428
Radian Group, Inc. 218 3,389
Washington Federal, Inc. 283 7,606
26,148
Trading Companies & Distributors — 1.4%
BMC Stock Holdings, Inc. * (a) 122 3,077
DXP Enterprises, Inc. * 74 1,468
MRC Global, Inc. * 226 1,338
NOW, Inc. * (a) 703 6,070
Veritiv Corp. * (a) 45 768
12,721
Water Utilities — 0.6%
American States Water Co. 65 5,146
Wireless Telecommunication Services — 0.2%
Gogo, Inc. * (a) 529 1,672
Total Common Stocks(Cost $827,445) 888,265
NO. OFRIGHTS
(000)
Rights — 0.0% (b)
Biotechnology — 0.0% (b)
Alder Biopharmaceuticals, Inc. * ‡(Cost $— ) 187 165
SEE NOTES TO FINANCIAL STATEMENTS.
46 J.P. MORGAN SMALL CAP FUNDS JUNE 30, 2020

INVESTMENTSSHARES
(000)VALUE($000)
Short-Term Investments — 11.8%
Investment Companies — 1.6%
JPMorgan Prime Money Market Fund Class IMShares, 0.47% (c) (d)(Cost $14,419) 14,407 14,420
Investment of Cash Collateral from Securities Loaned — 10.2%
JPMorgan Securities Lending Money Market FundAgency SL Class Shares, 0.51% (c) (d) 82,004 82,037
JPMorgan U.S. Government Money Market FundClass IM Shares, 0.14% (c) (d) 9,849 9,849
Total Investment of Cash Collateral from Securities Loaned(Cost $91,876) 91,886
Total Short-Term Investments(Cost $106,295) 106,306
Total Investments — 110.5%(Cost $933,740) 994,736
Liabilities in Excess ofOther Assets — (10.5)% (94,700)
NET ASSETS — 100.0% 900,036
Percentages indicated are based on net assets.
(a) The security or a portion of this security is on loan at June 30,2020. The total value of securities on loan at June 30, 2020 isapproximately $89,671,000.
(b) Amount rounds to less than 0.1% of net assets.(c) Investment in an affiliated fund, which is registered under the
Investment Company Act of 1940, as amended, and is advised byJ.P. Morgan Investment Management Inc.
(d) The rate shown is the current yield as of June 30, 2020.* Non-income producing security.‡ Value determined using significant unobservable inputs.
Futures contracts outstanding as of June 30, 2020 (amounts in thousands, except number of contracts):
DESCRIPTIONNUMBER OFCONTRACTS
EXPIRATIONDATE
TRADINGCURRENCY
NOTIONALAMOUNT ($)
VALUE ANDUNREALIZED
APPRECIATION(DEPRECIATION) ($)
Long Contracts
Russell 2000 E-Mini Index 77 09/2020 USD 5,530 53
AbbreviationsUSD United States Dollar
SEE NOTES TO FINANCIAL STATEMENTS.
JUNE 30, 2020 J.P. MORGAN SMALL CAP FUNDS 47

S T A T E M E N T S O F A S S E T S A N D L I A B I L I T I E SAS OF JUNE 30 , 2 020(Amounts in thousands, except per share amounts)
JPMorganSmall Cap
Blend Fund
JPMorganSmall CapCore Fund
JPMorganSmall Cap
Equity Fund
ASSETS:Investments in non-affiliates, at value $455,744 $341,390 $6,300,251Investments in affiliates, at value 17,254 9,177 276,403Investment of cash collateral received from securities loaned, at value (See Note 2.B.) 34,262 24,882 285,143Cash 6 — 121Deposits at broker for futures contracts — 490 —Receivables:
Investment securities sold 908 555 24,664Fund shares sold 1,526 253 2,695Dividends from non-affiliates 310 247 5,395Dividends from affiliates —(a) —(a) 4Securities lending income (See Note 2.B.) 38 14 150Variation margin on futures contracts — 48 —
Total Assets 510,048 377,056 6,894,826
LIABILITIES:Payables:
Due to custodian — 47 —Investment securities purchased 1,670 1,700 4,790Collateral received on securities loaned (See Note 2.B.) 34,262 24,882 285,143Fund shares redeemed 792 210 4,094
Accrued liabilities:Investment advisory fees 216 178 3,457Administration fees 9 17 402Distribution fees 42 3 198Service fees 56 10 798Custodian and accounting fees 18 12 59Trustees’ and Chief Compliance Officer’s fees 1 —(a) 1Other 123 136 398
Total Liabilities 37,189 27,195 299,340
Net Assets $472,859 $349,861 $6,595,486
(a) Amount rounds to less than one thousand.
SEE NOTES TO FINANCIAL STATEMENTS.
48 J.P. MORGAN SMALL CAP FUNDS JUNE 30, 2020

JPMorganSmall Cap
Blend Fund
JPMorganSmall CapCore Fund
JPMorganSmall Cap
Equity Fund
NET ASSETS:Paid-in-Capital $436,653 $372,657 $5,136,301Total distributable earnings (loss) 36,206 (22,796) 1,459,185
Total Net Assets $472,859 $349,861 $6,595,486
Net Assets:Class A $132,674 $ 4,127 $ 653,887Class C 24,323 1,690 80,258Class I 148,443 13,264 3,240,725Class R2 — 180 6,746Class R3 — 3,692 2,948Class R4 — 2,125 449Class R5 — 148,185 984,863Class R6 167,419 176,598 1,625,610
Total $472,859 $349,861 $6,595,486
Outstanding units of beneficial interest (shares)($0.0001 par value; unlimited number of shares authorized):
Class A 6,943 98 14,311Class C 1,995 41 2,476Class I 6,428 313 60,346Class R2 — 4 151Class R3 — 88 65Class R4 — 50 8Class R5 — 3,486 18,278Class R6 7,226 4,160 30,175
Net Asset Value (a):Class A — Redemption price per share $ 19.11 $ 42.12 $ 45.69Class C — Offering price per share (b) 12.19 41.41 32.42Class I — Offering and redemption price per share 23.09 42.35 53.70Class R2 — Offering and redemption price per share — 42.07 44.70Class R3 — Offering and redemption price per share — 42.23 45.38Class R4 — Offering and redemption price per share — 42.37 53.63Class R5 — Offering and redemption price per share — 42.51 53.88Class R6 — Offering and redemption price per share 23.17 42.45 53.87Class A maximum sales charge 5.25% 5.25% 5.25%Class A maximum public offering price per share
[net asset value per share/(100% — maximum sales charge)] $ 20.17 $ 44.45 $ 48.22
Cost of investments in non-affiliates $407,786 $326,363 $4,597,375Cost of investments in affiliates 17,247 9,176 276,293Investment securities on loan, at value (See Note 2.B.) 33,465 23,895 281,563Cost of investment of cash collateral (See Note 2.B.) 34,260 24,876 285,143
(a) Per share amounts may not recalculate due to rounding of net assets and/or shares outstanding.(b) Redemption price for Class C Shares varies based upon length of time the shares are held.
SEE NOTES TO FINANCIAL STATEMENTS.
JUNE 30, 2020 J.P. MORGAN SMALL CAP FUNDS 49

S T A T E M E N T S O F A S S E T S A N D L I A B I L I T I E SAS OF JUNE 30 , 2 020 (con t inued )(Amounts in thousands, except per share amounts)
JPMorganSmall Cap
Growth Fund
JPMorganSmall Cap
Value Fund
JPMorganU.S. Small
Company Fund
ASSETS:Investments in non-affiliates, at value $3,850,582 $ 946,481 $888,430Investments in affiliates, at value 123,428 14,798 14,420Investment of cash collateral received from securities loaned, at value
(See Note 2.B.) 317,008 69,628 91,886Cash 23 116 48Deposits at broker for futures contracts — 1,296 503Receivables:
Due from custodian — 4,176 1,082Investment securities sold 1,986 194 262Fund shares sold 8,848 488 344Dividends from non-affiliates 1,219 1,321 653Dividends from affiliates 2 —(a) —(a)Securities lending income (See Note 2.B.) 568 53 82Variation margin on futures contracts — 136 50
Total Assets 4,303,664 1,038,687 997,760
LIABILITIES:Payables:
Investment securities purchased 16,508 4,645 2,601Collateral received on securities loaned (See Note 2.B.) 317,008 69,628 91,886Fund shares redeemed 7,225 8,023 2,449
Accrued liabilities:Investment advisory fees 1,940 518 454Administration fees 173 60 57Distribution fees 149 44 48Service fees 265 59 97Custodian and accounting fees 31 25 21Trustees’ and Chief Compliance Officer’s fees 1 —(a) —(a)Other 211 112 111
Total Liabilities 343,511 83,114 97,724
Net Assets $3,960,153 $ 955,573 $900,036
(a) Amount rounds to less than one thousand.
SEE NOTES TO FINANCIAL STATEMENTS.
50 J.P. MORGAN SMALL CAP FUNDS JUNE 30, 2020
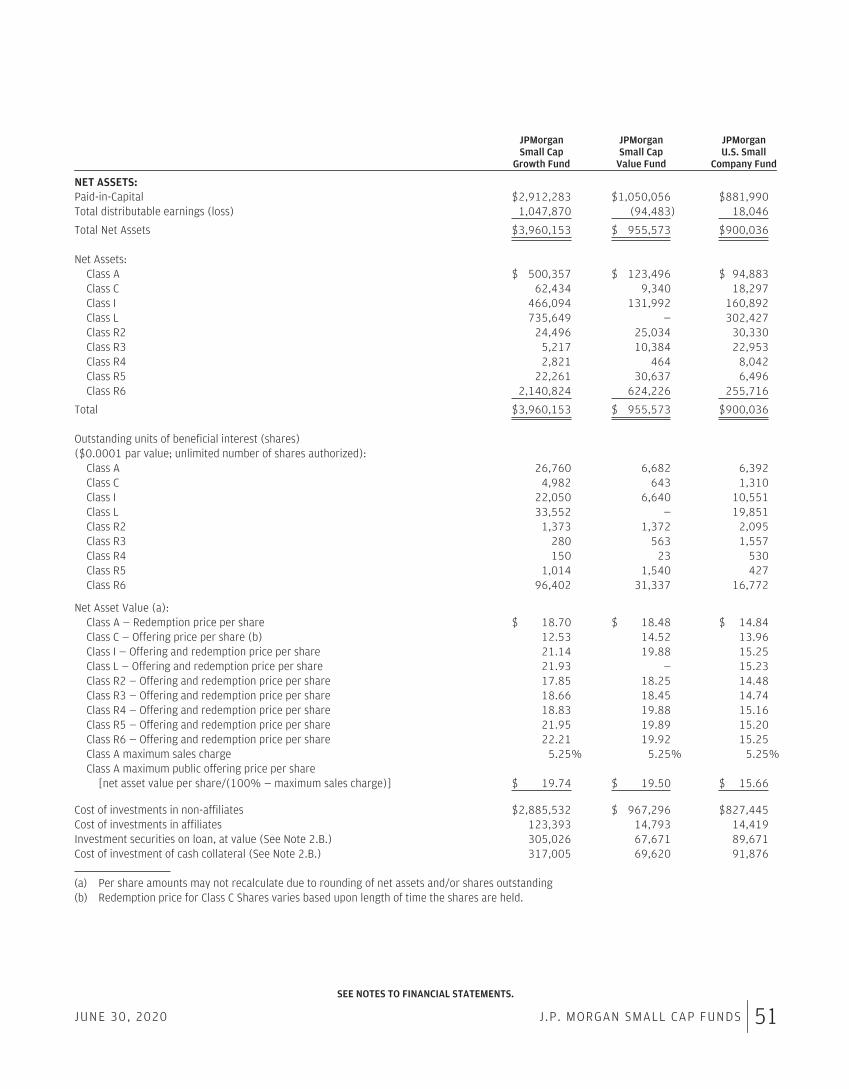
JPMorganSmall Cap
Growth Fund
JPMorganSmall Cap
Value Fund
JPMorganU.S. Small
Company Fund
NET ASSETS:Paid-in-Capital $2,912,283 $1,050,056 $881,990Total distributable earnings (loss) 1,047,870 (94,483) 18,046
Total Net Assets $3,960,153 $ 955,573 $900,036
Net Assets:Class A $ 500,357 $ 123,496 $ 94,883Class C 62,434 9,340 18,297Class I 466,094 131,992 160,892Class L 735,649 — 302,427Class R2 24,496 25,034 30,330Class R3 5,217 10,384 22,953Class R4 2,821 464 8,042Class R5 22,261 30,637 6,496Class R6 2,140,824 624,226 255,716
Total $3,960,153 $ 955,573 $900,036
Outstanding units of beneficial interest (shares)($0.0001 par value; unlimited number of shares authorized):
Class A 26,760 6,682 6,392Class C 4,982 643 1,310Class I 22,050 6,640 10,551Class L 33,552 — 19,851Class R2 1,373 1,372 2,095Class R3 280 563 1,557Class R4 150 23 530Class R5 1,014 1,540 427Class R6 96,402 31,337 16,772
Net Asset Value (a):Class A — Redemption price per share $ 18.70 $ 18.48 $ 14.84Class C — Offering price per share (b) 12.53 14.52 13.96Class I — Offering and redemption price per share 21.14 19.88 15.25Class L — Offering and redemption price per share 21.93 — 15.23Class R2 — Offering and redemption price per share 17.85 18.25 14.48Class R3 — Offering and redemption price per share 18.66 18.45 14.74Class R4 — Offering and redemption price per share 18.83 19.88 15.16Class R5 — Offering and redemption price per share 21.95 19.89 15.20Class R6 — Offering and redemption price per share 22.21 19.92 15.25Class A maximum sales charge 5.25% 5.25% 5.25%Class A maximum public offering price per share
[net asset value per share/(100% — maximum sales charge)] $ 19.74 $ 19.50 $ 15.66
Cost of investments in non-affiliates $2,885,532 $ 967,296 $827,445Cost of investments in affiliates 123,393 14,793 14,419Investment securities on loan, at value (See Note 2.B.) 305,026 67,671 89,671Cost of investment of cash collateral (See Note 2.B.) 317,005 69,620 91,876
(a) Per share amounts may not recalculate due to rounding of net assets and/or shares outstanding(b) Redemption price for Class C Shares varies based upon length of time the shares are held.
SEE NOTES TO FINANCIAL STATEMENTS.
JUNE 30, 2020 J.P. MORGAN SMALL CAP FUNDS 51

S T A T E M E N T S O F O P E R A T I O N SFOR THE YEAR ENDED JUNE 30 , 2 020(Amounts in thousands)
JPMorganSmall Cap
Blend Fund
JPMorganSmall CapCore Fund
JPMorganSmall Cap
Equity Fund
INVESTMENT INCOME:Interest income from non-affiliates $ — $ 9 $ —Interest income from affiliates —(a) —(a) —(a)Dividend income from non-affiliates 5,315 5,976 91,352Dividend income from affiliates 169 217 4,684Income from securities lending (net) (See Note 2.B.) 227 324 3,244
Total investment income 5,711 6,526 99,280
EXPENSES:Investment advisory fees 2,603 2,692 42,620Administration fees 300 311 4,918Distribution fees:
Class A 312 12 1,885Class C 237 16 726Class R2 — 1 42Class R3 — 11 7
Service fees:Class A 312 12 1,885Class C 79 5 242Class I 315 40 7,669Class R2 — —(a) 21Class R3 — 11 7Class R4 — 5 1Class R5 — 187 1,108
Custodian and accounting fees 59 57 198Interest expense to affiliates —(a) —(a) 5Professional fees 56 58 129Trustees’ and Chief Compliance Officer’s fees 27 27 50Printing and mailing costs 52 4 425Registration and filing fees 75 135 42Transfer agency fees (See Note 2.F.) 29 17 357Other 13 16 97
Total expenses 4,469 3,617 62,434
Less fees waived (266) (340) (1,001)Less expense reimbursements — (3) —
Net expenses 4,203 3,274 61,433
Net investment income (loss) 1,508 3,252 37,847
REALIZED/UNREALIZED GAINS (LOSSES):Net realized gain (loss) on transactions from:
Investments in non-affiliates (639) (28,019) (144,489)Investments in affiliates 5 1 23Futures contracts — (835) —
Net realized gain (loss) (634) (28,853) (144,466)
Change in net unrealized appreciation/depreciation on:Investments in non-affiliates (2,123) (31,170) (137,380)Investments in affiliates 5 4 69Futures contracts — (147) —
Change in net unrealized appreciation/depreciation (2,118) (31,313) (137,311)
Net realized/unrealized gains (losses) (2,752) (60,166) (281,777)
Change in net assets resulting from operations $(1,244) $(56,914) $(243,930)
(a) Amount rounds to less than one thousand.
SEE NOTES TO FINANCIAL STATEMENTS.
52 J.P. MORGAN SMALL CAP FUNDS JUNE 30, 2020

JPMorganSmall Cap
Growth Fund
JPMorganSmall Cap
Value Fund
JPMorganU.S. Small
Company Fund
INVESTMENT INCOME:Interest income from non-affiliates $ — $ 17 $ 15Interest income from affiliates —(a) —(a) —(a)Dividend income from non-affiliates 15,469 23,896 15,360Dividend income from affiliates 869 472 423Income from securities lending (net) (See Note 2.B.) 3,087 425 958
Total investment income 19,425 24,810 16,756
EXPENSES:Investment advisory fees 20,574 8,124 7,205Administration fees 2,374 937 901Distribution fees:
Class A 1,058 391 287Class C 429 101 174Class R2 123 157 180Class R3 8 35 58
Service fees:Class A 1,058 391 287Class C 143 34 58Class I 846 522 584Class L 605 — 392Class R2 62 78 90Class R3 8 35 58Class R4 5 1 19
Class R5 16 45 8Custodian and accounting fees 114 72 62Interest expense to affiliates 2 —(a) 1Professional fees 90 70 69Trustees’ and Chief Compliance Officer’s fees 37 30 30Printing and mailing costs 377 88 109Registration and filing fees 307 113 91Transfer agency fees (See Note 2.F.) 135 84 78Other 51 28 29
Total expenses 28,422 11,336 10,770
Less fees waived (653) (205) (36)Less expense reimbursements (50) (8) —
Net expenses 27,719 11,123 10,734
Net investment income (loss) (8,294) 13,687 6,022
REALIZED/UNREALIZED GAINS (LOSSES):Net realized gain (loss) on transactions from:
Investments in non-affiliates 185,447 (12,154) (3,687)Investments in affiliates (31) 4 9Futures contracts — 57 1,268
Net realized gain (loss) 185,416 (12,093) (2,410)
Change in net unrealized appreciation/depreciation on:Investments in non-affiliates 386,770 (199,738) (105,389)Investments in affiliates 5 3 (2)Futures contracts — (303) (666)
Change in net unrealized appreciation/depreciation 386,775 (200,038) (106,057)
Net realized/unrealized gains (losses) 572,191 (212,131) (108,467)
Change in net assets resulting from operations $563,897 $(198,444) $(102,445)
(a) Amount rounds to less than one thousand.
SEE NOTES TO FINANCIAL STATEMENTS.
JUNE 30, 2020 J.P. MORGAN SMALL CAP FUNDS 53

S T A T E M E N T S O F C H A N G E S I N N E T A S S E T SFOR THE PER IODS IND ICATED(Amounts in thousands)
JPMorgan Small Cap Blend Fund JPMorgan Small Cap Core Fund
Year EndedJune 30, 2020
Year EndedJune 30, 2019
Year EndedJune 30, 2020
Year EndedJune 30, 2019
CHANGE IN NET ASSETS RESULTING FROM OPERATIONS:Net investment income (loss) $ 1,508 $ 197 $ 3,252 $ 2,136Net realized gain (loss) (634) 14,852 (28,853) 16,926Change in net unrealized appreciation/depreciation (2,118) (8,858) (31,313) (32,543)
Change in net assets resulting from operations (1,244) 6,191 (56,914) (13,481)
DISTRIBUTIONS TO SHAREHOLDERS:Class A (4,206) (22,374) (207) (352)Class C (1,643) (12,520) (85) (172)Class I (3,897) (24,328) (765) (1,269)Class R2 — — (7) (3)Class R3 — — (227) (2)Class R4 — — (104) (114)Class R5 — — (9,535) (16,043)Class R6 (a) (3,543) (4) (9,154) (6,241)
Total distributions to shareholders (13,289) (59,226) (20,084) (24,196)
CAPITAL TRANSACTIONS:Change in net assets resulting from capital transactions 139,135 182,535 (22,685) 173,401
NET ASSETS:Change in net assets 124,602 129,500 (99,683) 135,724Beginning of period 348,257 218,757 449,544 313,820
End of period $472,859 $348,257 $349,861 $449,544
(a) Commencement of offering of class of shares effective July 2, 2018 for JPMorgan Small Cap Blend Fund.
SEE NOTES TO FINANCIAL STATEMENTS.
54 J.P. MORGAN SMALL CAP FUNDS JUNE 30, 2020

JPMorgan Small Cap Equity Fund JPMorgan Small Cap Growth Fund
Year EndedJune 30, 2020
Year EndedJune 30, 2019
Year EndedJune 30, 2020
Year EndedJune 30, 2019
CHANGE IN NET ASSETS RESULTING FROM OPERATIONS:Net investment income (loss) $ 37,847 $ 35,326 $ (8,294) $ (7,955)Net realized gain (loss) (144,466) 378,486 185,416 206,505Change in net unrealized appreciation/depreciation (137,311) (267,309) 386,775 (56,778)
Change in net assets resulting from operations (243,930) 146,503 563,897 141,772
DISTRIBUTIONS TO SHAREHOLDERS:Class A (40,838) (61,854) (25,608) (37,004)Class C (6,716) (11,312) (5,161) (8,359)Class I (145,648) (172,497) (17,200) (25,203)Class L — — (32,083) (48,328)Class R2 (416) (723) (1,612) (3,487)Class R3 (144) (155) (220) (93)Class R4 (23) (50) (139) (91)Class R5 (54,434) (79,273) (807) (3,229)Class R6 (73,447) (85,443) (90,416) (122,202)
Total distributions to shareholders (321,666) (411,307) (173,246) (247,996)
CAPITAL TRANSACTIONS:Change in net assets resulting from capital transactions 885,158 (287,511) 692,836 792,978
NET ASSETS:Change in net assets 319,562 (552,315) 1,083,487 686,754Beginning of period 6,275,924 6,828,239 2,876,666 2,189,912
End of period $6,595,486 $6,275,924 $3,960,153 $2,876,666
SEE NOTES TO FINANCIAL STATEMENTS.
JUNE 30, 2020 J.P. MORGAN SMALL CAP FUNDS 55

S T A T E M E N T S O F C H A N G E S I N N E T A S S E T SFOR THE PER IODS IND ICATED (con t inued )(Amounts in thousands)
JPMorgan Small Cap Value Fund JPMorgan U.S. Small Company Fund
Year EndedJune 30, 2020
Year EndedJune 30, 2019
Year EndedJune 30, 2020
Year EndedJune 30, 2019
CHANGE IN NET ASSETS RESULTING FROM OPERATIONS:Net investment income (loss) $ 13,687 $ 20,233 $ 6,022 $ 7,591Net realized gain (loss) (12,093) 128,031 (2,410) 28,971Change in net unrealized appreciation/depreciation (200,038) (325,551) (106,057) (191,152)
Change in net assets resulting from operations (198,444) (177,287) (102,445) (154,590)
DISTRIBUTIONS TO SHAREHOLDERS:Class A (10,797) (33,379) (357) (17,753)Class C (1,133) (3,600) (14) (3,937)Class I (14,242) (37,990) (1,438) (34,817)Class L — — (3,033) (50,872)Class R2 (2,111) (5,236) (20) (5,054)Class R3 (926) (1,914) (95) (2,105)Class R4 (6) (53) (52) (678)Class R5 (2,678) (15,233) (50) (1,146)Class R6 (51,882) (121,650) (3,261) (45,521)
Total distributions to shareholders (83,775) (219,055) (8,320) (161,883)
CAPITAL TRANSACTIONS:Change in net assets resulting from capital transactions (315,490) 21,342 (382,146) (69,426)
NET ASSETS:Change in net assets (597,709) (375,000) (492,911) (385,899)Beginning of period 1,553,282 1,928,282 1,392,947 1,778,846
End of period $ 955,573 $1,553,282 $ 900,036 $1,392,947
SEE NOTES TO FINANCIAL STATEMENTS.
56 J.P. MORGAN SMALL CAP FUNDS JUNE 30, 2020

JPMorgan Small Cap Blend Fund JPMorgan Small Cap Core Fund
Year EndedJune 30, 2020
Year EndedJune 30, 2019
Year EndedJune 30, 2020
Year EndedJune 30, 2019
CAPITAL TRANSACTIONS:Class A
Proceeds from shares issued $ 54,866 $ 56,422 $ 1,151 $ 3,052Distributions reinvested 3,607 17,078 207 351Cost of shares redeemed (37,184) (21,654) (2,401) (1,451)
Change in net assets resulting from Class A capital transactions $ 21,289 $ 51,846 $ (1,043) $ 1,952
Class CProceeds from shares issued $ 10,538 $ 24,795 $ 545 $ 1,749Distributions reinvested 347 1,178 85 172Cost of shares redeemed (22,645) (15,655) (813) (1,065)
Change in net assets resulting from Class C capital transactions $ (11,760) $ 10,318 $ (183) $ 856
Class IProceeds from shares issued $102,711 $ 122,678 $ 13,956 $ 14,346Distributions reinvested 3,883 24,212 750 1,269Cost of shares redeemed (62,751) (105,365) (11,751) (15,564)
Change in net assets resulting from Class I capital transactions $ 43,843 $ 41,525 $ 2,955 $ 51
Class R2Proceeds from shares issued $ — $ — $ 43 $ 164Distributions reinvested — — 7 3Cost of shares redeemed — — (7) (31)
Change in net assets resulting from Class R2 capital transactions $ — $ — $ 43 $ 136
Class R3Proceeds from shares issued $ — $ — $ 2,958 $ 4,058Distributions reinvested — — 226 2Cost of shares redeemed — — (2,501) (369)
Change in net assets resulting from Class R3 capital transactions $ — $ — $ 683 $ 3,691
Class R4Proceeds from shares issued $ — $ — $ 1,260 $ 825Distributions reinvested — — 104 114Cost of shares redeemed — — (780) (337)
Change in net assets resulting from Class R4 capital transactions $ — $ — $ 584 $ 602
Class R5Proceeds from shares issued $ — $ — $ 34,515 $ 53,375Distributions reinvested — — 9,135 15,379Cost of shares redeemed — — (80,632) (50,254)
Change in net assets resulting from Class R5 capital transactions $ — $ — $(36,982) $ 18,500
Class R6 (a)Proceeds from shares issued $115,599 $ 84,215 $ 79,125 $159,605Distributions reinvested 3,542 4 9,153 6,240Cost of shares redeemed (33,378) (5,373) (77,020) (18,232)
Change in net assets resulting from Class R6 capital transactions $ 85,763 $ 78,846 $ 11,258 $147,613
Total change in net assets resulting from capital transactions $139,135 $ 182,535 $(22,685) $173,401
(a) Commencement of offering of class of shares effective July 2, 2018 for JPMorgan Small Cap Blend Fund.
SEE NOTES TO FINANCIAL STATEMENTS.
JUNE 30, 2020 J.P. MORGAN SMALL CAP FUNDS 57

S T A T E M E N T S O F C H A N G E S I N N E T A S S E T SFOR THE PER IODS IND ICATED (con t inued )(Amounts in thousands)
JPMorgan Small Cap Blend Fund JPMorgan Small Cap Core Fund
Year EndedJune 30, 2020
Year EndedJune 30, 2019
Year EndedJune 30, 2020
Year EndedJune 30, 2019
SHARE TRANSACTIONS:Class A
Issued 2,893 2,757 28 58Reinvested 177 976 4 7Redeemed (2,029) (1,042) (52) (28)
Change in Class A Shares 1,041 2,691 (20) 37
Class CIssued 854 1,952 11 33Reinvested 27 103 2 4Redeemed (1,881) (1,095) (19) (22)
Change in Class C Shares (1,000) 960 (6) 15
Class IIssued 4,514 4,930 317 277Reinvested 157 1,154 15 27Redeemed (2,879) (4,485) (282) (312)
Change in Class I Shares 1,792 1,599 50 (8)
Class R2Issued — — 1 4Reinvested — — —(a) —(a)Redeemed — — —(a) (1)
Change in Class R2 Shares — — 1 3
Class R3Issued — — 63 82Reinvested — — 4 —(a)Redeemed — — (54) (7)
Change in Class R3 Shares — — 13 75
Class R4Issued — — 28 16Reinvested — — 2 2Redeemed — — (19) (6)
Change in Class R4 Shares — — 11 12
Class R5Issued — — 762 1,028Reinvested — — 177 329Redeemed — — (1,730) (966)
Change in Class R5 Shares — — (791) 391
Class R6 (b)Issued 5,128 3,705 1,648 3,183Reinvested 143 —(a) 177 134Redeemed (1,520) (230) (1,769) (365)
Change in Class R6 Shares 3,751 3,475 56 2,952
(a) Amount rounds to less than one thousand.(b) Commencement of offering of class of shares effective July 2, 2018 for JPMorgan Small Cap Blend Fund.
SEE NOTES TO FINANCIAL STATEMENTS.
58 J.P. MORGAN SMALL CAP FUNDS JUNE 30, 2020
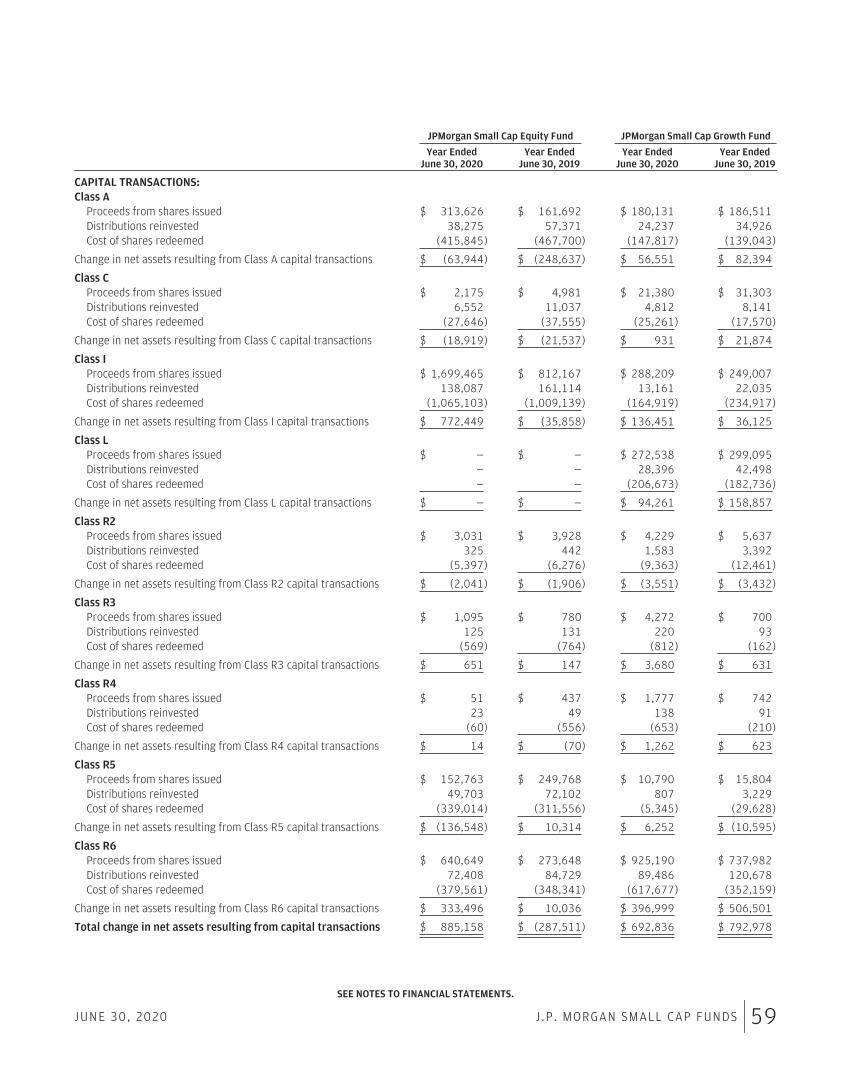
JPMorgan Small Cap Equity Fund JPMorgan Small Cap Growth Fund
Year EndedJune 30, 2020
Year EndedJune 30, 2019
Year EndedJune 30, 2020
Year EndedJune 30, 2019
CAPITAL TRANSACTIONS:Class A
Proceeds from shares issued $ 313,626 $ 161,692 $ 180,131 $ 186,511Distributions reinvested 38,275 57,371 24,237 34,926Cost of shares redeemed (415,845) (467,700) (147,817) (139,043)
Change in net assets resulting from Class A capital transactions $ (63,944) $ (248,637) $ 56,551 $ 82,394
Class CProceeds from shares issued $ 2,175 $ 4,981 $ 21,380 $ 31,303Distributions reinvested 6,552 11,037 4,812 8,141Cost of shares redeemed (27,646) (37,555) (25,261) (17,570)
Change in net assets resulting from Class C capital transactions $ (18,919) $ (21,537) $ 931 $ 21,874
Class IProceeds from shares issued $ 1,699,465 $ 812,167 $ 288,209 $ 249,007Distributions reinvested 138,087 161,114 13,161 22,035Cost of shares redeemed (1,065,103) (1,009,139) (164,919) (234,917)
Change in net assets resulting from Class I capital transactions $ 772,449 $ (35,858) $ 136,451 $ 36,125
Class LProceeds from shares issued $ — $ — $ 272,538 $ 299,095Distributions reinvested — — 28,396 42,498Cost of shares redeemed — — (206,673) (182,736)
Change in net assets resulting from Class L capital transactions $ — $ — $ 94,261 $ 158,857
Class R2Proceeds from shares issued $ 3,031 $ 3,928 $ 4,229 $ 5,637Distributions reinvested 325 442 1,583 3,392Cost of shares redeemed (5,397) (6,276) (9,363) (12,461)
Change in net assets resulting from Class R2 capital transactions $ (2,041) $ (1,906) $ (3,551) $ (3,432)
Class R3Proceeds from shares issued $ 1,095 $ 780 $ 4,272 $ 700Distributions reinvested 125 131 220 93Cost of shares redeemed (569) (764) (812) (162)
Change in net assets resulting from Class R3 capital transactions $ 651 $ 147 $ 3,680 $ 631
Class R4Proceeds from shares issued $ 51 $ 437 $ 1,777 $ 742Distributions reinvested 23 49 138 91Cost of shares redeemed (60) (556) (653) (210)
Change in net assets resulting from Class R4 capital transactions $ 14 $ (70) $ 1,262 $ 623
Class R5Proceeds from shares issued $ 152,763 $ 249,768 $ 10,790 $ 15,804Distributions reinvested 49,703 72,102 807 3,229Cost of shares redeemed (339,014) (311,556) (5,345) (29,628)
Change in net assets resulting from Class R5 capital transactions $ (136,548) $ 10,314 $ 6,252 $ (10,595)
Class R6Proceeds from shares issued $ 640,649 $ 273,648 $ 925,190 $ 737,982Distributions reinvested 72,408 84,729 89,486 120,678Cost of shares redeemed (379,561) (348,341) (617,677) (352,159)
Change in net assets resulting from Class R6 capital transactions $ 333,496 $ 10,036 $ 396,999 $ 506,501
Total change in net assets resulting from capital transactions $ 885,158 $ (287,511) $ 692,836 $ 792,978
SEE NOTES TO FINANCIAL STATEMENTS.
JUNE 30, 2020 J.P. MORGAN SMALL CAP FUNDS 59

S T A T E M E N T S O F C H A N G E S I N N E T A S S E T SFOR THE PER IODS IND ICATED (con t inued )(Amounts in thousands)
JPMorgan Small Cap Equity Fund JPMorgan Small Cap Growth Fund
Year EndedJune 30, 2020
Year EndedJune 30, 2019
Year EndedJune 30, 2020
Year EndedJune 30, 2019
SHARE TRANSACTIONS:Class A
Issued 6,782 3,220 10,856 11,086Reinvested 760 1,280 1,419 2,442Redeemed (9,053) (9,569) (9,052) (8,306)
Change in Class A Shares (1,511) (5,069) 3,223 5,222
Class CIssued 64 137 1,896 2,555Reinvested 184 339 419 819Redeemed (847) (1,057) (2,281) (1,609)
Change in Class C Shares (599) (581) 34 1,765
Class IIssued 31,752 14,200 15,402 13,101Reinvested 2,334 3,089 682 1,377Redeemed (20,362) (18,069) (9,213) (12,472)
Change in Class I Shares 13,724 (780) 6,871 2,006
Class LIssued — — 14,183 15,406Reinvested — — 1,419 2,570Redeemed — — (10,894) (9,858)
Change in Class L Shares — — 4,708 8,118
Class R2Issued 65 81 269 352Reinvested 7 10 97 247Redeemed (120) (128) (588) (774)
Change in Class R2 Shares (48) (37) (222) (175)
Class R3Issued 25 15 253 42Reinvested 2 3 13 7Redeemed (14) (15) (49) (10)
Change in Class R3 Shares 13 3 217 39
Class R4Issued 1 7 102 45Reinvested —(a) 1 8 6Redeemed (1) (10) (38) (12)
Change in Class R4 Shares —(a) (2) 72 39
Class R5Issued 2,800 4,320 551 779Reinvested 837 1,380 41 195Redeemed (6,109) (5,632) (279) (1,640)
Change in Class R5 Shares (2,472) 68 313 (666)
Class R6Issued 11,645 4,903 47,492 37,658Reinvested 1,219 1,623 4,411 7,213Redeemed (7,061) (6,057) (31,625) (18,147)
Change in Class R6 Shares 5,803 469 20,278 26,724
(a) Amount rounds to less than one thousand.
SEE NOTES TO FINANCIAL STATEMENTS.
60 J.P. MORGAN SMALL CAP FUNDS JUNE 30, 2020

JPMorgan Small Cap Value Fund JPMorgan U.S. Small Company Fund
Year EndedJune 30, 2020
Year EndedJune 30, 2019
Year EndedJune 30, 2020
Year EndedJune 30, 2019
CAPITAL TRANSACTIONS:Class A
Proceeds from shares issued $ 24,245 $ 39,092 $ 19,360 $ 31,276Distributions reinvested 10,115 30,915 328 16,222Cost of shares redeemed (67,548) (150,367) (53,824) (84,556)
Change in net assets resulting from Class A capital transactions $ (33,188) $ (80,360) $ (34,136) $ (37,058)
Class CProceeds from shares issued $ 527 $ 1,412 $ 1,325 $ 4,264Distributions reinvested 1,043 3,378 13 3,767Cost of shares redeemed (6,896) (6,345) (9,632) (17,367)
Change in net assets resulting from Class C capital transactions $ (5,326) $ (1,555) $ (8,294) $ (9,336)
Class IProceeds from shares issued $ 61,608 $ 111,050 $ 54,409 $ 93,832Distributions reinvested 14,229 37,950 1,403 33,313Cost of shares redeemed (175,602) (129,351) (148,125) (216,008)
Change in net assets resulting from Class I capital transactions $ (99,765) $ 19,649 $ (92,313) $ (88,863)
Class LProceeds from shares issued $ — $ — $ 180,077 $ 138,828Distributions reinvested — — 2,129 43,991Cost of shares redeemed — — (262,774) (204,856)
Change in net assets resulting from Class L capital transactions $ — $ — $ (80,568) $ (22,037)
Class R2Proceeds from shares issued $ 8,711 $ 11,408 $ 7,181 $ 18,232Distributions reinvested 2,053 4,865 18 3,913Cost of shares redeemed (14,418) (15,716) (18,727) (17,683)
Change in net assets resulting from Class R2 capital transactions $ (3,654) $ 557 $ (11,528) $ 4,462
Class R3Proceeds from shares issued $ 5,318 $ 6,293 $ 7,420 $ 13,013Distributions reinvested 926 1,910 85 2,049Cost of shares redeemed (7,200) (2,872) (6,924) (5,163)
Change in net assets resulting from Class R3 capital transactions $ (956) $ 5,331 $ 581 $ 9,899
Class R4Proceeds from shares issued $ 767 $ 514 $ 3,577 $ 3,626Distributions reinvested 6 53 52 678Cost of shares redeemed (740) (142) (1,334) (2,627)
Change in net assets resulting from Class R4 capital transactions $ 33 $ 425 $ 2,295 $ 1,677
Class R5Proceeds from shares issued $ 9,383 $ 23,910 $ 2,217 $ 8,102Distributions reinvested 2,524 14,495 33 958Cost of shares redeemed (41,707) (70,249) (7,177) (1,751)
Change in net assets resulting from Class R5 capital transactions $ (29,800) $ (31,844) $ (4,927) $ 7,309
Class R6Proceeds from shares issued $ 151,215 $ 212,292 $ 69,664 $ 117,831Subscriptions in-kind (See Note 8) — — — 13,799Distributions reinvested 51,882 121,650 3,215 45,073Cost of shares redeemed (345,931) (224,803) (226,135) (112,182)
Change in net assets resulting from Class R6 capital transactions $(142,834) $ 109,139 $(153,256) $ 64,521
Total change in net assets resulting from capital transactions $(315,490) $ 21,342 $(382,146) $ (69,426)
SEE NOTES TO FINANCIAL STATEMENTS.
JUNE 30, 2020 J.P. MORGAN SMALL CAP FUNDS 61

S T A T E M E N T S O F C H A N G E S I N N E T A S S E T SFOR THE PER IODS IND ICATED (con t inued )(Amounts in thousands)
JPMorgan Small Cap Value Fund JPMorgan U.S. Small Company Fund
Year EndedJune 30, 2020
Year EndedJune 30, 2019
Year EndedJune 30, 2020
Year EndedJune 30, 2019
SHARE TRANSACTIONS:Class A
Issued 1,212 1,538 1,287 1,816Reinvested 431 1,333 19 1,049Redeemed (3,143) (5,737) (3,461) (5,034)
Change in Class A Shares (1,500) (2,866) (2,155) (2,169)
Class CIssued 34 68 93 258Reinvested 56 182 1 257Redeemed (404) (320) (673) (1,066)
Change in Class C Shares (314) (70) (579) (551)
Class IIssued 2,798 4,075 3,533 5,437Reinvested 565 1,528 79 2,098Redeemed (8,060) (4,698) (9,733) (12,470)
Change in Class I Shares (4,697) 905 (6,121) (4,935)
Class LIssued — — 11,011 8,225Reinvested — — 120 2,772Redeemed — — (17,742) (12,189)
Change in Class L Shares — — (6,611) (1,192)
Class R2Issued 442 456 493 1,048Reinvested 88 212 1 259Redeemed (711) (619) (1,228) (1,064)
Change in Class R2 Shares (181) 49 (734) 243
Class R3Issued 258 233 507 778Reinvested 40 83 5 133Redeemed (364) (113) (460) (312)
Change in Class R3 Shares (66) 203 52 599
Class R4Issued 39 17 226 208Reinvested —(a) 2 3 43Redeemed (33) (5) (86) (153)
Change in Class R4 Shares 6 14 143 98
Class R5Issued 416 838 137 437Reinvested 101 582 2 61Redeemed (1,734) (2,739) (432) (102)
Change in Class R5 Shares (1,217) (1,319) (293) 396
Class R6Issued 7,059 8,015 4,527 6,749Subscriptions in-kind (See Note 8) — — — 828Reinvested 2,072 4,881 181 2,839Redeemed (14,571) (8,321) (14,475) (6,595)
Change in Class R6 Shares (5,440) 4,575 (9,767) 3,821
(a) Amount rounds to less than one thousand.
SEE NOTES TO FINANCIAL STATEMENTS.
62 J.P. MORGAN SMALL CAP FUNDS JUNE 30, 2020

THIS PAGE IS INTENTIONALLY LEFT BLANK
JUNE 30, 2020 J.P. MORGAN SMALL CAP FUNDS 63

F I N A N C I A L H I G H L I G H T SFOR THE PER IODS IND ICATED
Per share operating performance
Investment operations Distributions
Net assetvalue,
beginningof period
Netinvestment
income(loss) (b)
Net realizedand unrealized
gains(losses) on
investments
Total frominvestmentoperations
Netinvestment
income
Netrealized
gainTotal
distributions
JPMorgan Small Cap Blend FundClass AYear Ended June 30, 2020 $19.78 $ 0.04 $(0.04) $ —(f) $(0.02) $(0.65) $(0.67)Year Ended June 30, 2019 26.65 —(f) (0.63) (0.63) — (6.24) (6.24)Year Ended June 30, 2018 22.03 (0.20) 7.54 7.34 — (2.72) (2.72)Year Ended June 30, 2017 19.14 (0.16) 6.24 6.08 — (3.19) (3.19)Year Ended June 30, 2016 26.04 (0.16) (3.52) (3.68) — (3.22) (3.22)
Class CYear Ended June 30, 2020 12.90 (0.04) (0.02) (0.06) — (0.65) (0.65)Year Ended June 30, 2019 19.89 (0.08) (0.67) (0.75) — (6.24) (6.24)Year Ended June 30, 2018 17.12 (0.24) 5.73 5.49 — (2.72) (2.72)Year Ended June 30, 2017 15.58 (0.21) 4.94 4.73 — (3.19) (3.19)Year Ended June 30, 2016 21.97 (0.22) (2.95) (3.17) — (3.22) (3.22)
Class IYear Ended June 30, 2020 23.75 0.10 (0.06) 0.04 (0.05) (0.65) (0.70)Year Ended June 30, 2019 30.53 0.05 (0.59) (0.54) — (6.24) (6.24)Year Ended June 30, 2018 24.83 (0.15) 8.57 8.42 — (2.72) (2.72)Year Ended June 30, 2017 21.17 (0.12) 6.97 6.85 — (3.19) (3.19)Year Ended June 30, 2016 28.34 (0.14) (3.81) (3.95) — (3.22) (3.22)
Class R6Year Ended June 30, 2020 23.82 0.16 (0.06) 0.10 (0.10) (0.65) (0.75)July 2, 2018 (g) through June 30, 2019 30.73 0.18 (0.85) (0.67) — (6.24) (6.24)
(a) Annualized for periods less than one year, unless otherwise noted.(b) Calculated based upon average shares outstanding.(c) Not annualized for periods less than one year.(d) Includes adjustments in accordance with accounting principles generally accepted in the United States of America and as such, the net asset values for financial
reporting purposes and the returns based upon those net asset values may differ from the net asset values and returns for shareholder transactions.(e) Includes earnings credits and interest expense, if applicable, each of which is less than 0.005% unless otherwise noted.(f) Amount rounds to less than $0.005.(g) Commencement of offering of class of shares.
SEE NOTES TO FINANCIAL STATEMENTS.
64 J.P. MORGAN SMALL CAP FUNDS JUNE 30, 2020
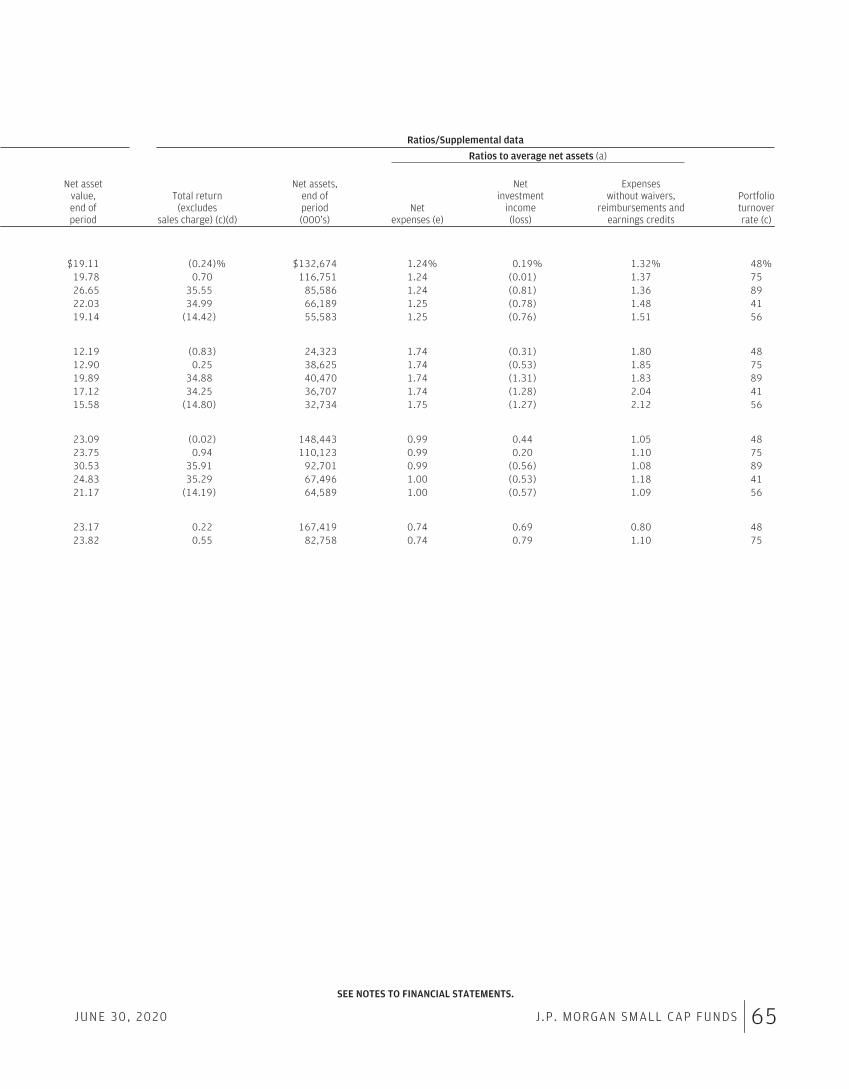
Ratios/Supplemental data
Ratios to average net assets (a)
Net assetvalue,end ofperiod
Total return(excludes
sales charge) (c)(d)
Net assets,end ofperiod(000’s)
Netexpenses (e)
Netinvestment
income(loss)
Expenseswithout waivers,
reimbursements andearnings credits
Portfolioturnoverrate (c)
$19.11 (0.24)% $132,674 1.24% 0.19% 1.32% 48%19.78 0.70 116,751 1.24 (0.01) 1.37 7526.65 35.55 85,586 1.24 (0.81) 1.36 8922.03 34.99 66,189 1.25 (0.78) 1.48 4119.14 (14.42) 55,583 1.25 (0.76) 1.51 56
12.19 (0.83) 24,323 1.74 (0.31) 1.80 4812.90 0.25 38,625 1.74 (0.53) 1.85 7519.89 34.88 40,470 1.74 (1.31) 1.83 8917.12 34.25 36,707 1.74 (1.28) 2.04 4115.58 (14.80) 32,734 1.75 (1.27) 2.12 56
23.09 (0.02) 148,443 0.99 0.44 1.05 4823.75 0.94 110,123 0.99 0.20 1.10 7530.53 35.91 92,701 0.99 (0.56) 1.08 8924.83 35.29 67,496 1.00 (0.53) 1.18 4121.17 (14.19) 64,589 1.00 (0.57) 1.09 56
23.17 0.22 167,419 0.74 0.69 0.80 4823.82 0.55 82,758 0.74 0.79 1.10 75
SEE NOTES TO FINANCIAL STATEMENTS.
JUNE 30, 2020 J.P. MORGAN SMALL CAP FUNDS 65

F I N A N C I A L H I G H L I G H T SFOR THE PER IODS IND ICATED (con t inued )
Per share operating performance
Investment operations Distributions
Net assetvalue,
beginningof period
Netinvestment
income(loss) (b)
Net realizedand unrealized
gains(losses) on
investments
Total frominvestmentoperations
Netinvestment
income
Netrealized
gainTotal
distributions
JPMorgan Small Cap Core FundClass AYear Ended June 30, 2020 $49.98 $ 0.15 $ (6.00) $ (5.85) $(0.15) $(1.86) $(2.01)Year Ended June 30, 2019 57.16 0.11 (3.52) (3.41) (0.02) (3.75) (3.77)Year Ended June 30, 2018 52.32 0.04(f) 9.19 9.23 (0.01) (4.38) (4.39)Year Ended June 30, 2017 45.88 (0.04) 11.81 11.77 (0.20) (5.13) (5.33)May 31, 2016 (g) through June 30, 2016 45.81 0.02(f) 0.05 0.07 — — —
Class CYear Ended June 30, 2020 49.27 (0.07) (5.93) (6.00) — (1.86) (1.86)Year Ended June 30, 2019 56.67 (0.15) (3.50) (3.65) — (3.75) (3.75)Year Ended June 30, 2018 52.14 (0.24)(f) 9.15 8.91 — (4.38) (4.38)Year Ended June 30, 2017 45.86 (0.24) 11.74 11.50 (0.09) (5.13) (5.22)May 31, 2016 (g) through June 30, 2016 45.81 —(f)(h) 0.05 0.05 — — —
Class IYear Ended June 30, 2020 50.25 0.28 (6.03) (5.75) (0.29) (1.86) (2.15)Year Ended June 30, 2019 57.44 0.23 (3.55) (3.32) (0.12) (3.75) (3.87)Year Ended June 30, 2018 52.58 0.17(f) 9.24 9.41 (0.17) (4.38) (4.55)January 3, 2017 (g) through June 30, 2017 50.44 0.07 2.07 2.14 — — —
Class R2Year Ended June 30, 2020 50.01 0.05 (6.02) (5.97) (0.11) (1.86) (1.97)Year Ended June 30, 2019 57.32 0.04 (3.60) (3.56) — (3.75) (3.75)July 31, 2017 (g) through June 30, 2018 53.24 (0.08)(f) 8.58 8.50 (0.04) (4.38) (4.42)
Class R3Year Ended June 30, 2020 50.18 0.16 (6.02) (5.86) (0.23) (1.86) (2.09)Year Ended June 30, 2019 57.40 0.26 (3.71) (3.45) (0.02) (3.75) (3.77)July 31, 2017 (g) through June 30, 2018 53.24 0.05(f) 8.58 8.63 (0.09) (4.38) (4.47)
Class R4Year Ended June 30, 2020 50.28 0.28 (6.03) (5.75) (0.30) (1.86) (2.16)Year Ended June 30, 2019 57.48 0.23 (3.56) (3.33) (0.12) (3.75) (3.87)July 31, 2017 (g) through June 30, 2018 53.24 0.18(f) 8.58 8.76 (0.14) (4.38) (4.52)
Class R5Year Ended June 30, 2020 50.42 0.36 (6.04) (5.68) (0.37) (1.86) (2.23)Year Ended June 30, 2019 57.63 0.33 (3.58) (3.25) (0.21) (3.75) (3.96)Year Ended June 30, 2018 52.64 0.26(f) 9.28 9.54 (0.17) (4.38) (4.55)Year Ended June 30, 2017 45.90 0.20 11.83 12.03 (0.16) (5.13) (5.29)Year Ended June 30, 2016 56.18 0.15(f) (5.25) (5.10) (0.32) (4.86) (5.18)
Class R6Year Ended June 30, 2020 50.34 0.39 (6.02) (5.63) (0.40) (1.86) (2.26)Year Ended June 30, 2019 57.55 0.39 (3.61) (3.22) (0.24) (3.75) (3.99)Year Ended June 30, 2018 52.57 0.33(f) 9.23 9.56 (0.20) (4.38) (4.58)Year Ended June 30, 2017 45.90 0.29 11.76 12.05 (0.25) (5.13) (5.38)May 31, 2016 (g) through June 30, 2016 45.81 0.04(f) 0.05 0.09 — — —
(a) Annualized for periods less than one year, unless otherwise noted.(b) Calculated based upon average shares outstanding.(c) Not annualized for periods less than one year.(d) Includes adjustments in accordance with accounting principles generally accepted in the United States of America and as such, the net asset values for financial
reporting purposes and the returns based upon those net asset values may differ from the net asset values and returns for shareholder transactions.(e) Includes earnings credits and interest expense, if applicable, each of which is less than 0.005% unless otherwise noted.(f) Net investment income (loss) may appear disproportionate among the classes due to the timing of recognition of income and changes in the relative size of the
classes.(g) Commencement of offering of class of shares.(h) Amount rounds to less than $0.005.
SEE NOTES TO FINANCIAL STATEMENTS.
66 J.P. MORGAN SMALL CAP FUNDS JUNE 30, 2020

Ratios/Supplemental data
Ratios to average net assets (a)
Net assetvalue,end ofperiod
Total return(excludes
sales charge) (c)(d)
Net assets,end ofperiod(000’s)
Netexpenses (e)
Netinvestment
income(loss)
Expenseswithout waivers,
reimbursements andearnings credits
Portfolioturnoverrate (c)
$42.12 (12.40)% $ 4,127 1.24% 0.33% 1.38% 102%49.98 (5.48) 5,896 1.23 0.21 1.36 7457.16 18.37 4,624 1.24 0.07(f) 1.41 3952.32 26.29 2,203 1.24 (0.07) 1.45 6145.88 0.15 23 1.25 0.56(f) 1.39 58
41.41 (12.84) 1,690 1.74 (0.16) 1.82 10249.27 (5.97) 2,307 1.73 (0.30) 1.86 7456.67 17.79 1,816 1.74 (0.45)(f) 1.90 3952.14 25.68 1,017 1.74 (0.47) 1.96 6145.86 0.11 20 1.74 0.06(f) 1.89 58
42.35 (12.18) 13,264 0.99 0.61 1.06 10250.25 (5.24) 13,211 0.98 0.45 1.09 7457.44 18.64 15,557 0.99 0.32(f) 1.12 3952.58 4.24 3,545 0.99 0.26 1.21 61
42.07 (12.62) 180 1.49 0.11 1.69 10250.01 (5.73) 166 1.48 0.08 2.08 7457.32 16.67 24 1.49 (0.15)(f) 1.72 39
42.23 (12.40) 3,692 1.24 0.36 1.30 10250.18 (5.51) 3,768 1.23 0.53 1.59 7457.40 16.94 24 1.24 0.10(f) 1.46 39
42.37 (12.17) 2,125 0.99 0.61 1.06 10250.28 (5.26) 1,941 0.98 0.45 1.10 7457.48 17.21 1,536 0.99 0.36(f) 1.11 39
42.51 (12.02) 148,185 0.80 0.78 0.90 10250.42 (5.07) 215,630 0.79 0.63 0.93 7457.63 18.88 223,933 0.79 0.48(f) 0.97 3952.64 26.87 187,198 0.79 0.40 1.11 6145.90 (8.97) 164,573 0.80 0.30(f) 1.16 58
42.45 (11.95) 176,598 0.74 0.84 0.80 10250.34 (5.02) 206,625 0.73 0.75 0.83 7457.55 18.95 66,306 0.74 0.59(f) 0.86 3952.57 26.94 16,782 0.74 0.56 0.98 6145.90 0.20 20 0.74 1.06(f) 0.88 58
SEE NOTES TO FINANCIAL STATEMENTS.
JUNE 30, 2020 J.P. MORGAN SMALL CAP FUNDS 67

F I N A N C I A L H I G H L I G H T SFOR THE PER IODS IND ICATED (con t inued )
Per share operating performance
Investment operations Distributions
Net assetvalue,
beginningof period
Netinvestment
income(loss) (b)
Net realizedand unrealized
gains(losses) on
investments
Total frominvestmentoperations
Netinvestment
income
Netrealized
gainTotal
distributions
JPMorgan Small Cap Equity FundClass AYear Ended June 30, 2020 $50.05 $ 0.12 $(1.95) $(1.83) $(0.15) $(2.38) $(2.53)Year Ended June 30, 2019 52.43 0.12 0.95 1.07 (0.06) (3.39) (3.45)Year Ended June 30, 2018 48.63 0.10 6.67 6.77 (0.10) (2.87) (2.97)Year Ended June 30, 2017 41.68 0.11 8.21 8.32 (0.12) (1.25) (1.37)Year Ended June 30, 2016 44.68 0.13(f) 0.08 0.21 (0.14) (3.07) (3.21)
Class CYear Ended June 30, 2020 36.25 (0.08) (1.35) (1.43) (0.02) (2.38) (2.40)Year Ended June 30, 2019 39.12 (0.09) 0.61 0.52 — (3.39) (3.39)Year Ended June 30, 2018 37.07 (0.12) 5.04 4.92 — (2.87) (2.87)Year Ended June 30, 2017 32.21 (0.09) 6.31 6.22 (0.11) (1.25) (1.36)Year Ended June 30, 2016 35.32 (0.06)(f) 0.02 (0.04) — (3.07) (3.07)
Class IYear Ended June 30, 2020 58.34 0.30 (2.30) (2.00) (0.26) (2.38) (2.64)Year Ended June 30, 2019 60.52 0.29 1.12 1.41 (0.20) (3.39) (3.59)Year Ended June 30, 2018 55.69 0.26 7.67 7.93 (0.23) (2.87) (3.10)Year Ended June 30, 2017 47.50 0.28 9.37 9.65 (0.21) (1.25) (1.46)Year Ended June 30, 2016 50.31 0.25(f) 0.17 0.42 (0.16) (3.07) (3.23)
Class R2Year Ended June 30, 2020 48.98 0.01 (1.91) (1.90) — (2.38) (2.38)Year Ended June 30, 2019 51.44 —(g) 0.93 0.93 — (3.39) (3.39)Year Ended June 30, 2018 47.81 (0.03) 6.55 6.52 (0.02) (2.87) (2.89)Year Ended June 30, 2017 41.08 —(g) 8.08 8.08 (0.10) (1.25) (1.35)Year Ended June 30, 2016 44.04 0.01(f) 0.10 0.11 — (3.07) (3.07)
Class R3Year Ended June 30, 2020 49.73 0.13 (1.93) (1.80) (0.17) (2.38) (2.55)Year Ended June 30, 2019 52.13 0.13 0.92 1.05 (0.06) (3.39) (3.45)Year Ended June 30, 2018 48.54 0.12 6.63 6.75 (0.29) (2.87) (3.16)September 9, 2016 (i) through June 30, 2017 43.22 0.12 6.68 6.80 (0.23) (1.25) (1.48)
Class R4Year Ended June 30, 2020 58.26 0.29 (2.29) (2.00) (0.25) (2.38) (2.63)Year Ended June 30, 2019 60.42 0.29 1.12 1.41 (0.18) (3.39) (3.57)Year Ended June 30, 2018 55.64 0.33 7.59 7.92 (0.27) (2.87) (3.14)September 9, 2016 (i) through June 30, 2017 49.28 0.23 7.63 7.86 (0.25) (1.25) (1.50)
(a) Annualized for periods less than one year, unless otherwise noted.(b) Calculated based upon average shares outstanding.(c) Not annualized for periods less than one year.(d) Includes adjustments in accordance with accounting principles generally accepted in the United States of America and as such, the net asset values for financial
reporting purposes and the returns based upon those net asset values may differ from the net asset values and returns for shareholder transactions.(e) Includes earnings credits and interest expense, if applicable, each of which is less than 0.005% unless otherwise noted.(f) Net investment income (loss) may appear disproportionate among the classes due to the timing of recognition of income and changes in the relative size of the
classes.(g) Amount rounds to less than $0.005.(h) Amount rounds to less than 0.005%.(i) Commencement of offering of class of shares.
SEE NOTES TO FINANCIAL STATEMENTS.
68 J.P. MORGAN SMALL CAP FUNDS JUNE 30, 2020
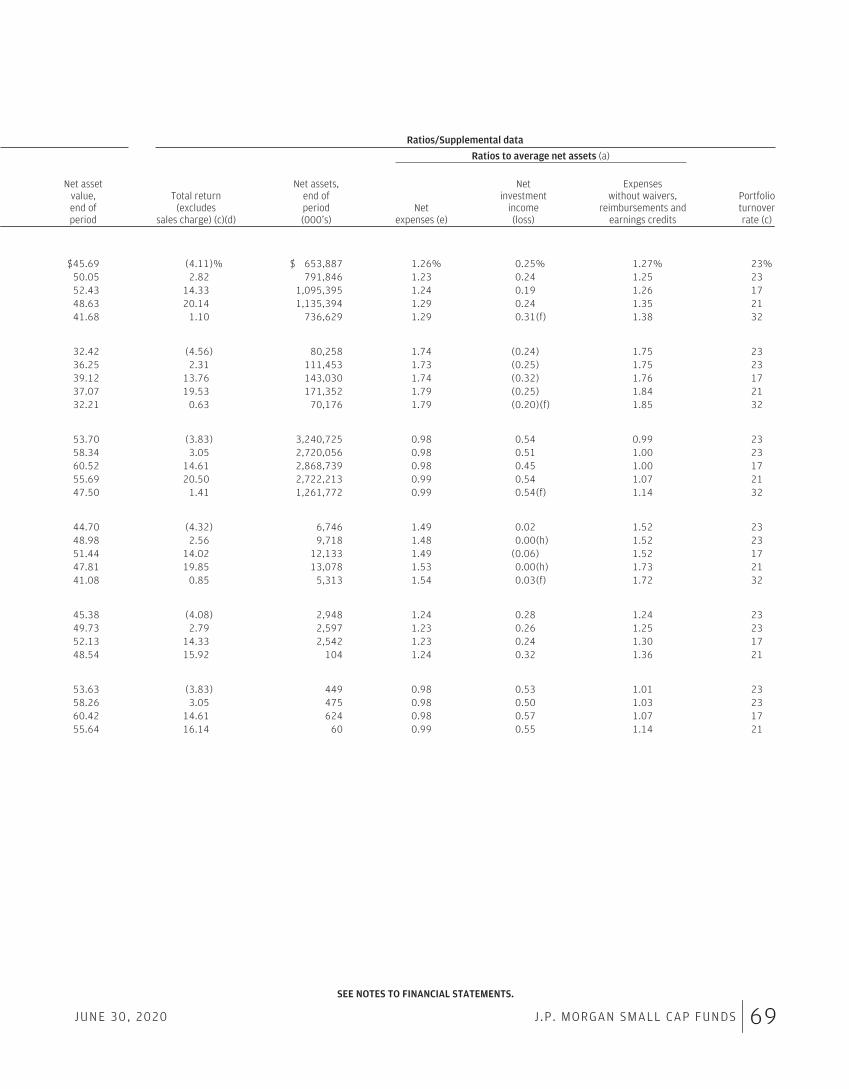
Ratios/Supplemental data
Ratios to average net assets (a)
Net assetvalue,end ofperiod
Total return(excludes
sales charge) (c)(d)
Net assets,end ofperiod(000’s)
Netexpenses (e)
Netinvestment
income(loss)
Expenseswithout waivers,
reimbursements andearnings credits
Portfolioturnoverrate (c)
$45.69 (4.11)% $ 653,887 1.26% 0.25% 1.27% 23%50.05 2.82 791,846 1.23 0.24 1.25 2352.43 14.33 1,095,395 1.24 0.19 1.26 1748.63 20.14 1,135,394 1.29 0.24 1.35 2141.68 1.10 736,629 1.29 0.31(f) 1.38 32
32.42 (4.56) 80,258 1.74 (0.24) 1.75 2336.25 2.31 111,453 1.73 (0.25) 1.75 2339.12 13.76 143,030 1.74 (0.32) 1.76 1737.07 19.53 171,352 1.79 (0.25) 1.84 2132.21 0.63 70,176 1.79 (0.20)(f) 1.85 32
53.70 (3.83) 3,240,725 0.98 0.54 0.99 2358.34 3.05 2,720,056 0.98 0.51 1.00 2360.52 14.61 2,868,739 0.98 0.45 1.00 1755.69 20.50 2,722,213 0.99 0.54 1.07 2147.50 1.41 1,261,772 0.99 0.54(f) 1.14 32
44.70 (4.32) 6,746 1.49 0.02 1.52 2348.98 2.56 9,718 1.48 0.00(h) 1.52 2351.44 14.02 12,133 1.49 (0.06) 1.52 1747.81 19.85 13,078 1.53 0.00(h) 1.73 2141.08 0.85 5,313 1.54 0.03(f) 1.72 32
45.38 (4.08) 2,948 1.24 0.28 1.24 2349.73 2.79 2,597 1.23 0.26 1.25 2352.13 14.33 2,542 1.23 0.24 1.30 1748.54 15.92 104 1.24 0.32 1.36 21
53.63 (3.83) 449 0.98 0.53 1.01 2358.26 3.05 475 0.98 0.50 1.03 2360.42 14.61 624 0.98 0.57 1.07 1755.64 16.14 60 0.99 0.55 1.14 21
SEE NOTES TO FINANCIAL STATEMENTS.
JUNE 30, 2020 J.P. MORGAN SMALL CAP FUNDS 69

F I N A N C I A L H I G H L I G H T SFOR THE PER IODS IND ICATED (con t inued )
Per share operating performance
Investment operations Distributions
Net assetvalue,
beginningof period
Netinvestment
income(loss) (b)
Net realizedand unrealized
gains(losses) on
investments
Total frominvestmentoperations
Netinvestment
income
Netrealized
gainTotal
distributions
JPMorgan Small Cap Equity Fund (continued)Class R5Year Ended June 30, 2020 $58.51 $0.40 $(2.30) $(1.90) $(0.35) $(2.38) $(2.73)Year Ended June 30, 2019 60.69 0.41 1.11 1.52 (0.31) (3.39) (3.70)Year Ended June 30, 2018 55.84 0.37 7.70 8.07 (0.35) (2.87) (3.22)Year Ended June 30, 2017 47.57 0.36 9.42 9.78 (0.26) (1.25) (1.51)Year Ended June 30, 2016 50.43 0.36(f) 0.15 0.51 (0.30) (3.07) (3.37)
Class R6Year Ended June 30, 2020 58.50 0.44 (2.30) (1.86) (0.39) (2.38) (2.77)Year Ended June 30, 2019 60.68 0.44 1.11 1.55 (0.34) (3.39) (3.73)Year Ended June 30, 2018 55.83 0.41 7.69 8.10 (0.38) (2.87) (3.25)Year Ended June 30, 2017 47.57 0.46 9.34 9.80 (0.29) (1.25) (1.54)May 31, 2016 (i) through June 30, 2016 47.04 0.06(f) 0.47 0.53 — — —
(a) Annualized for periods less than one year, unless otherwise noted.(b) Calculated based upon average shares outstanding.(c) Not annualized for periods less than one year.(d) Includes adjustments in accordance with accounting principles generally accepted in the United States of America and as such, the net asset values for financial
reporting purposes and the returns based upon those net asset values may differ from the net asset values and returns for shareholder transactions.(e) Includes earnings credits and interest expense, if applicable, each of which is less than 0.005% unless otherwise noted.(f) Net investment income (loss) may appear disproportionate among the classes due to the timing of recognition of income and changes in the relative size of the
classes.(g) Amount rounds to less than $0.005.(h) Amount rounds to less than 0.005%.(i) Commencement of offering of class of shares.
SEE NOTES TO FINANCIAL STATEMENTS.
70 J.P. MORGAN SMALL CAP FUNDS JUNE 30, 2020

Ratios/Supplemental data
Ratios to average net assets (a)
Net assetvalue,end ofperiod
Total return(excludes
sales charge) (c)(d)
Net assets,end ofperiod(000’s)
Netexpenses (e)
Netinvestment
income(loss)
Expenseswithout waivers,
reimbursements andearnings credits
Portfolioturnoverrate (c)
$53.88 (3.65)% $ 984,863 0.80% 0.71% 0.84% 23%58.51 3.26 1,214,075 0.79 0.70 0.85 2360.69 14.83 1,255,251 0.79 0.64 0.85 1755.84 20.74 1,267,593 0.79 0.68 0.86 2147.57 1.62 1,349,107 0.79 0.78(f) 0.86 32
53.87 (3.60) 1,625,610 0.74 0.78 0.74 2358.50 3.33 1,425,704 0.73 0.76 0.75 2360.68 14.89 1,450,525 0.73 0.71 0.75 1755.83 20.80 978,649 0.74 0.85 0.76 2147.57 1.13 25,933 0.73 1.60(f) 0.75 32
SEE NOTES TO FINANCIAL STATEMENTS.
JUNE 30, 2020 J.P. MORGAN SMALL CAP FUNDS 71

F I N A N C I A L H I G H L I G H T SFOR THE PER IODS IND ICATED (con t inued )
Per share operating performance
Investment operations Distributions
Net assetvalue,
beginningof period
Netinvestment
income(loss) (b)
Net realizedand unrealized
gains(losses) on
investments
Total frominvestmentoperations
Netinvestment
income
Netrealized
gainTotal
distributions
JPMorgan Small Cap Growth FundClass AYear Ended June 30, 2020 $17.00 $(0.11) $ 2.88 $ 2.77 $ — $(1.07) $(1.07)Year Ended June 30, 2019 18.45 (0.11) 0.67 0.56 — (2.01) (2.01)Year Ended June 30, 2018 14.81 (0.14)(f) 5.11 4.97 — (1.33) (1.33)Year Ended June 30, 2017 11.43 (0.10) 3.94 3.84 — (0.46) (0.46)Year Ended June 30, 2016 14.50 (0.09) (1.94) (2.03) — (1.04) (1.04)
Class CYear Ended June 30, 2020 11.78 (0.13) 1.95 1.82 — (1.07) (1.07)Year Ended June 30, 2019 13.55 (0.14) 0.38 0.24 — (2.01) (2.01)Year Ended June 30, 2018 11.23 (0.16)(f) 3.81 3.65 — (1.33) (1.33)Year Ended June 30, 2017 8.82 (0.13) 3.00 2.87 — (0.46) (0.46)Year Ended June 30, 2016 11.50 (0.12) (1.52) (1.64) — (1.04) (1.04)
Class IYear Ended June 30, 2020 19.05 (0.07) 3.24 3.17 (0.01) (1.07) (1.08)Year Ended June 30, 2019 20.35 (0.08) 0.79 0.71 — (2.01) (2.01)Year Ended June 30, 2018 16.18 (0.11)(f) 5.61 5.50 — (1.33) (1.33)Year Ended June 30, 2017 12.42 (0.07) 4.29 4.22 — (0.46) (0.46)Year Ended June 30, 2016 15.61 (0.07) (2.08) (2.15) — (1.04) (1.04)
Class LYear Ended June 30, 2020 19.71 (0.04) 3.36 3.32 (0.03) (1.07) (1.10)Year Ended June 30, 2019 20.95 (0.05) 0.82 0.77 — (2.01) (2.01)Year Ended June 30, 2018 16.60 (0.08)(f) 5.76 5.68 — (1.33) (1.33)Year Ended June 30, 2017 12.72 (0.05) 4.39 4.34 — (0.46) (0.46)Year Ended June 30, 2016 15.93 (0.05) (2.12) (2.17) — (1.04) (1.04)
Class R2Year Ended June 30, 2020 16.31 (0.14) 2.75 2.61 — (1.07) (1.07)Year Ended June 30, 2019 17.84 (0.15) 0.63 0.48 — (2.01) (2.01)Year Ended June 30, 2018 14.39 (0.17)(f) 4.95 4.78 — (1.33) (1.33)Year Ended June 30, 2017 11.15 (0.13) 3.83 3.70 — (0.46) (0.46)Year Ended June 30, 2016 14.20 (0.12) (1.89) (2.01) — (1.04) (1.04)
Class R3Year Ended June 30, 2020 17.00 (0.11) 2.87 2.76 (0.03) (1.07) (1.10)Year Ended June 30, 2019 18.45 (0.10) 0.66 0.56 — (2.01) (2.01)July 31, 2017 (g) through June 30, 2018 15.17 (0.13)(f) 4.74 4.61 — (1.33) (1.33)
Class R4Year Ended June 30, 2020 17.09 (0.06) 2.90 2.84 (0.03) (1.07) (1.10)Year Ended June 30, 2019 18.50 (0.07) 0.67 0.60 — (2.01) (2.01)July 31, 2017 (g) through June 30, 2018 15.17 (0.09)(f) 4.75 4.66 — (1.33) (1.33)
(a) Annualized for periods less than one year, unless otherwise noted.(b) Calculated based upon average shares outstanding.(c) Not annualized for periods less than one year.(d) Includes adjustments in accordance with accounting principles generally accepted in the United States of America and as such, the net asset values for financial
reporting purposes and the returns based upon those net asset values may differ from the net asset values and returns for shareholder transactions.(e) Includes earnings credits and interest expense, if applicable, each of which is less than 0.005% unless otherwise noted.(f) Net investment income (loss) may appear disproportionate among the classes due to the timing of recognition of income and changes in the relative size of the
classes.(g) Commencement of offering of class of shares.
SEE NOTES TO FINANCIAL STATEMENTS.
72 J.P. MORGAN SMALL CAP FUNDS JUNE 30, 2020

Ratios/Supplemental data
Ratios to average net assets (a)
Net assetvalue,end ofperiod
Total return(excludes
sales charge) (c)(d)
Net assets,end ofperiod(000’s)
Netexpenses (e)
Netinvestment
income(loss)
Expenseswithout waivers,
reimbursements andearnings credits
Portfolioturnoverrate (c)
$18.70 16.92% $500,357 1.24% (0.63)% 1.27% 51%17.00 5.08 400,127 1.24 (0.68) 1.27 5818.45 35.14 337,933 1.24 (0.83)(f) 1.29 5814.81 34.36 196,403 1.24 (0.75) 1.40 4211.43 (14.17) 179,093 1.25 (0.77) 1.50 47
12.53 16.32 62,434 1.74 (1.13) 1.77 5111.78 4.51 58,288 1.74 (1.17) 1.77 5813.55 34.56 43,116 1.74 (1.32)(f) 1.77 5811.23 33.51 20,352 1.74 (1.25) 1.85 42
8.82 (14.50) 18,218 1.75 (1.27) 1.91 47
21.14 17.19 466,094 0.99 (0.37) 1.01 5119.05 5.36 289,094 0.99 (0.43) 1.02 5820.35 35.45 268,082 0.99 (0.57)(f) 1.02 5816.18 34.69 110,644 1.00 (0.50) 1.12 4212.42 (13.92) 102,174 1.00 (0.52) 1.18 47
21.93 17.40 735,649 0.84 (0.23) 0.86 5119.71 5.51 568,539 0.84 (0.27) 0.86 5820.95 35.65 434,286 0.84 (0.43)(f) 0.86 5816.60 34.82 360,044 0.85 (0.35) 0.93 4212.72 (13.76) 271,369 0.85 (0.35) 0.96 47
17.85 16.64 24,496 1.49 (0.88) 1.52 5116.31 4.79 26,011 1.49 (0.94) 1.52 5817.84 34.83 31,569 1.49 (1.08)(f) 1.52 5814.39 33.96 23,569 1.49 (1.00) 1.70 4211.15 (14.34) 21,276 1.50 (1.01) 1.85 47
18.66 16.86 5,217 1.24 (0.63) 1.29 5117.00 5.08 1,072 1.24 (0.63) 1.37 5818.45 31.93 446 1.23 (0.80)(f) 1.28 58
18.83 17.25 2,821 0.99 (0.38) 1.04 5117.09 5.30 1,336 0.99 (0.39) 1.01 5818.50 32.28 726 0.99 (0.53)(f) 1.17 58
SEE NOTES TO FINANCIAL STATEMENTS.
JUNE 30, 2020 J.P. MORGAN SMALL CAP FUNDS 73
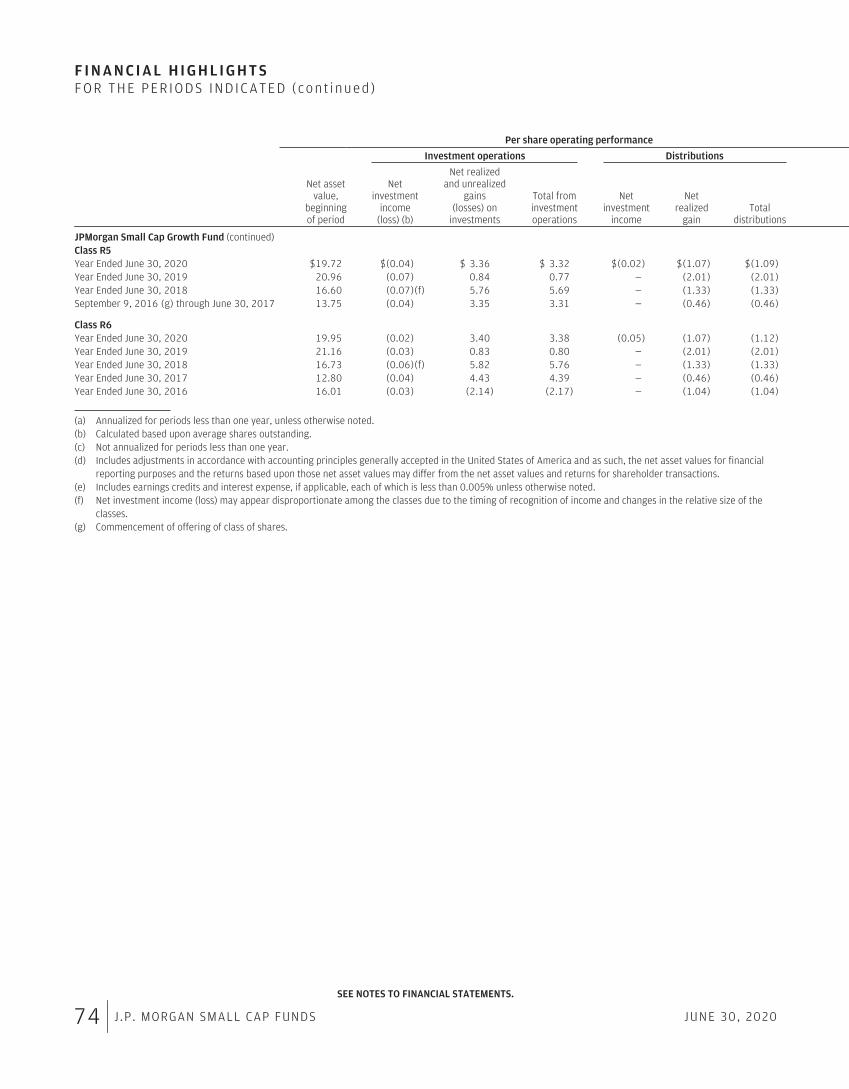
F I N A N C I A L H I G H L I G H T SFOR THE PER IODS IND ICATED (con t inued )
Per share operating performance
Investment operations Distributions
Net assetvalue,
beginningof period
Netinvestment
income(loss) (b)
Net realizedand unrealized
gains(losses) on
investments
Total frominvestmentoperations
Netinvestment
income
Netrealized
gainTotal
distributions
JPMorgan Small Cap Growth Fund (continued)Class R5Year Ended June 30, 2020 $19.72 $(0.04) $ 3.36 $ 3.32 $(0.02) $(1.07) $(1.09)Year Ended June 30, 2019 20.96 (0.07) 0.84 0.77 — (2.01) (2.01)Year Ended June 30, 2018 16.60 (0.07)(f) 5.76 5.69 — (1.33) (1.33)September 9, 2016 (g) through June 30, 2017 13.75 (0.04) 3.35 3.31 — (0.46) (0.46)
Class R6Year Ended June 30, 2020 19.95 (0.02) 3.40 3.38 (0.05) (1.07) (1.12)Year Ended June 30, 2019 21.16 (0.03) 0.83 0.80 — (2.01) (2.01)Year Ended June 30, 2018 16.73 (0.06)(f) 5.82 5.76 — (1.33) (1.33)Year Ended June 30, 2017 12.80 (0.04) 4.43 4.39 — (0.46) (0.46)Year Ended June 30, 2016 16.01 (0.03) (2.14) (2.17) — (1.04) (1.04)
(a) Annualized for periods less than one year, unless otherwise noted.(b) Calculated based upon average shares outstanding.(c) Not annualized for periods less than one year.(d) Includes adjustments in accordance with accounting principles generally accepted in the United States of America and as such, the net asset values for financial
reporting purposes and the returns based upon those net asset values may differ from the net asset values and returns for shareholder transactions.(e) Includes earnings credits and interest expense, if applicable, each of which is less than 0.005% unless otherwise noted.(f) Net investment income (loss) may appear disproportionate among the classes due to the timing of recognition of income and changes in the relative size of the
classes.(g) Commencement of offering of class of shares.
SEE NOTES TO FINANCIAL STATEMENTS.
74 J.P. MORGAN SMALL CAP FUNDS JUNE 30, 2020

Ratios/Supplemental data
Ratios to average net assets (a)
Net assetvalue,end ofperiod
Total return(excludes
sales charge) (c)(d)
Net assets,end ofperiod(000’s)
Netexpenses (e)
Netinvestment
income(loss)
Expenseswithout waivers,
reimbursements andearnings credits
Portfolioturnoverrate (c)
$21.95 17.37% $ 22,261 0.84% (0.23)% 0.86% 51%19.72 5.50 13,817 0.84 (0.34) 0.86 5820.96 35.71 28,656 0.84 (0.37)(f) 0.88 5816.60 24.72 1,186 0.82 (0.31) 0.84 42
22.21 17.49 2,140,824 0.74 (0.12) 0.76 5119.95 5.60 1,518,382 0.74 (0.16) 0.76 5821.16 35.86 1,045,098 0.74 (0.32)(f) 0.76 5816.73 34.99 603,730 0.75 (0.25) 0.76 4212.80 (13.69) 445,008 0.75 (0.25) 0.77 47
SEE NOTES TO FINANCIAL STATEMENTS.
JUNE 30, 2020 J.P. MORGAN SMALL CAP FUNDS 75

F I N A N C I A L H I G H L I G H T SFOR THE PER IODS IND ICATED (con t inued )
Per share operating performance
Investment operations Distributions
Net assetvalue,
beginningof period
Netinvestment
income(loss) (b)
Net realizedand unrealized
gains(losses) on
investments
Total frominvestmentoperations
Netinvestment
income
Netrealized
gainTotal
distributions
JPMorgan Small Cap Value FundClass AYear Ended June 30, 2020 $23.65 $ 0.16 $(3.82) $(3.66) $(0.18) $(1.33) $(1.51)Year Ended June 30, 2019 30.42 0.21 (3.28) (3.07) (0.24) (3.46) (3.70)Year Ended June 30, 2018 29.18 0.20(f) 3.01 3.21 (0.23) (1.74) (1.97)Year Ended June 30, 2017 24.64 0.11(f) 4.58 4.69 (0.13) (0.02) (0.15)Year Ended June 30, 2016 26.65 0.17 (0.94) (0.77) (0.15) (1.09) (1.24)
Class CYear Ended June 30, 2020 18.90 0.04 (2.97) (2.93) (0.12) (1.33) (1.45)Year Ended June 30, 2019 25.21 0.07 (2.73) (2.66) (0.19) (3.46) (3.65)Year Ended June 30, 2018 24.55 0.04(f) 2.50 2.54 (0.14) (1.74) (1.88)Year Ended June 30, 2017 20.82 (0.05)(f) 3.87 3.82 (0.07) (0.02) (0.09)Year Ended June 30, 2016 22.77 0.02 (0.82) (0.80) (0.06) (1.09) (1.15)
Class IYear Ended June 30, 2020 25.32 0.23 (4.11) (3.88) (0.23) (1.33) (1.56)Year Ended June 30, 2019 32.25 0.31 (3.48) (3.17) (0.30) (3.46) (3.76)Year Ended June 30, 2018 30.80 0.30(f) 3.18 3.48 (0.29) (1.74) (2.03)Year Ended June 30, 2017 25.97 0.20(f) 4.81 5.01 (0.16) (0.02) (0.18)Year Ended June 30, 2016 28.00 0.23 (0.97) (0.74) (0.20) (1.09) (1.29)
Class R2Year Ended June 30, 2020 23.37 0.11 (3.77) (3.66) (0.13) (1.33) (1.46)Year Ended June 30, 2019 30.13 0.15 (3.25) (3.10) (0.20) (3.46) (3.66)Year Ended June 30, 2018 28.94 0.12(f) 2.98 3.10 (0.17) (1.74) (1.91)Year Ended June 30, 2017 24.48 0.04(f) 4.53 4.57 (0.09) (0.02) (0.11)Year Ended June 30, 2016 26.49 0.11 (0.94) (0.83) (0.09) (1.09) (1.18)
Class R3Year Ended June 30, 2020 23.61 0.16 (3.81) (3.65) (0.18) (1.33) (1.51)Year Ended June 30, 2019 30.38 0.23 (3.29) (3.06) (0.25) (3.46) (3.71)Year Ended June 30, 2018 29.14 0.20(f) 3.01 3.21 (0.23) (1.74) (1.97)September 9, 2016 (g) through June 30, 2017 25.89 0.12(f) 3.31 3.43 (0.16) (0.02) (0.18)
Class R4Year Ended June 30, 2020 25.28 0.19 (4.06) (3.87) (0.20) (1.33) (1.53)Year Ended June 30, 2019 32.21 0.30 (3.47) (3.17) (0.30) (3.46) (3.76)Year Ended June 30, 2018 30.77 0.32(f) 3.14 3.46 (0.28) (1.74) (2.02)September 9, 2016 (g) through June 30, 2017 27.30 0.18(f) 3.49 3.67 (0.18) (0.02) (0.20)
Class R5Year Ended June 30, 2020 25.34 0.26 (4.11) (3.85) (0.27) (1.33) (1.60)Year Ended June 30, 2019 32.26 0.34 (3.47) (3.13) (0.33) (3.46) (3.79)Year Ended June 30, 2018 30.80 0.35(f) 3.17 3.52 (0.32) (1.74) (2.06)Year Ended June 30, 2017 25.97 0.23(f) 4.81 5.04 (0.19) (0.02) (0.21)Year Ended June 30, 2016 28.01 0.26 (0.98) (0.72) (0.23) (1.09) (1.32)
Class R6Year Ended June 30, 2020 25.38 0.29 (4.13) (3.84) (0.29) (1.33) (1.62)Year Ended June 30, 2019 32.30 0.38 (3.49) (3.11) (0.35) (3.46) (3.81)Year Ended June 30, 2018 30.83 0.38(f) 3.18 3.56 (0.35) (1.74) (2.09)Year Ended June 30, 2017 25.99 0.27(f) 4.82 5.09 (0.23) (0.02) (0.25)Year Ended June 30, 2016 28.03 0.31 (1.00) (0.69) (0.26) (1.09) (1.35)
(a) Annualized for periods less than one year, unless otherwise noted.(b) Calculated based upon average shares outstanding.(c) Not annualized for periods less than one year.(d) Includes adjustments in accordance with accounting principles generally accepted in the United States of America and as such, the net asset values for financial
reporting purposes and the returns based upon those net asset values may differ from the net asset values and returns for shareholder transactions.(e) Includes earnings credits and interest expense, if applicable, each of which is less than 0.005% unless otherwise noted.(f) Net investment income (loss) may appear disproportionate among the classes due to the timing of recognition of income and changes in the relative size of the
classes.(g) Commencement of offering of class of shares.
SEE NOTES TO FINANCIAL STATEMENTS.
76 J.P. MORGAN SMALL CAP FUNDS JUNE 30, 2020
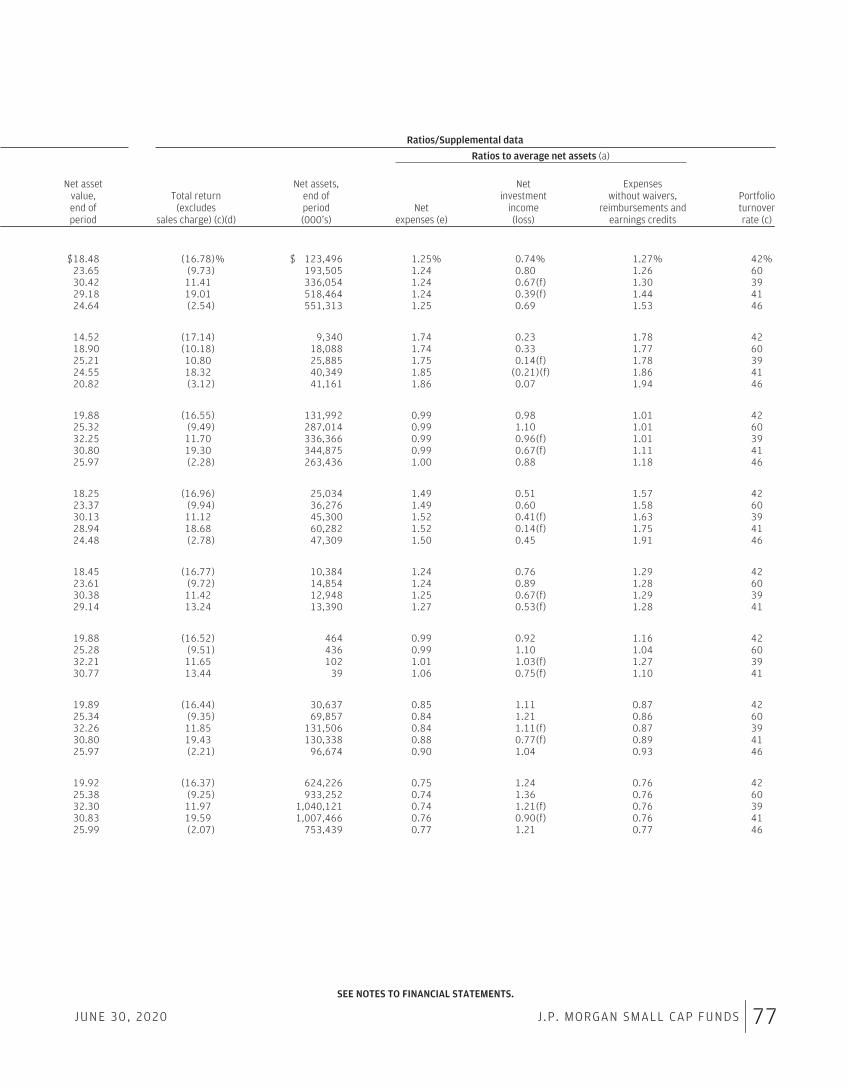
Ratios/Supplemental data
Ratios to average net assets (a)
Net assetvalue,end ofperiod
Total return(excludes
sales charge) (c)(d)
Net assets,end ofperiod(000’s)
Netexpenses (e)
Netinvestment
income(loss)
Expenseswithout waivers,
reimbursements andearnings credits
Portfolioturnoverrate (c)
$18.48 (16.78)% $ 123,496 1.25% 0.74% 1.27% 42%23.65 (9.73) 193,505 1.24 0.80 1.26 6030.42 11.41 336,054 1.24 0.67(f) 1.30 3929.18 19.01 518,464 1.24 0.39(f) 1.44 4124.64 (2.54) 551,313 1.25 0.69 1.53 46
14.52 (17.14) 9,340 1.74 0.23 1.78 4218.90 (10.18) 18,088 1.74 0.33 1.77 6025.21 10.80 25,885 1.75 0.14(f) 1.78 3924.55 18.32 40,349 1.85 (0.21)(f) 1.86 4120.82 (3.12) 41,161 1.86 0.07 1.94 46
19.88 (16.55) 131,992 0.99 0.98 1.01 4225.32 (9.49) 287,014 0.99 1.10 1.01 6032.25 11.70 336,366 0.99 0.96(f) 1.01 3930.80 19.30 344,875 0.99 0.67(f) 1.11 4125.97 (2.28) 263,436 1.00 0.88 1.18 46
18.25 (16.96) 25,034 1.49 0.51 1.57 4223.37 (9.94) 36,276 1.49 0.60 1.58 6030.13 11.12 45,300 1.52 0.41(f) 1.63 3928.94 18.68 60,282 1.52 0.14(f) 1.75 4124.48 (2.78) 47,309 1.50 0.45 1.91 46
18.45 (16.77) 10,384 1.24 0.76 1.29 4223.61 (9.72) 14,854 1.24 0.89 1.28 6030.38 11.42 12,948 1.25 0.67(f) 1.29 3929.14 13.24 13,390 1.27 0.53(f) 1.28 41
19.88 (16.52) 464 0.99 0.92 1.16 4225.28 (9.51) 436 0.99 1.10 1.04 6032.21 11.65 102 1.01 1.03(f) 1.27 3930.77 13.44 39 1.06 0.75(f) 1.10 41
19.89 (16.44) 30,637 0.85 1.11 0.87 4225.34 (9.35) 69,857 0.84 1.21 0.86 6032.26 11.85 131,506 0.84 1.11(f) 0.87 3930.80 19.43 130,338 0.88 0.77(f) 0.89 4125.97 (2.21) 96,674 0.90 1.04 0.93 46
19.92 (16.37) 624,226 0.75 1.24 0.76 4225.38 (9.25) 933,252 0.74 1.36 0.76 6032.30 11.97 1,040,121 0.74 1.21(f) 0.76 3930.83 19.59 1,007,466 0.76 0.90(f) 0.76 4125.99 (2.07) 753,439 0.77 1.21 0.77 46
SEE NOTES TO FINANCIAL STATEMENTS.
JUNE 30, 2020 J.P. MORGAN SMALL CAP FUNDS 77

F I N A N C I A L H I G H L I G H T SFOR THE PER IODS IND ICATED (con t inued )
Per share operating performance
Investment operations Distributions
Net assetvalue,
beginningof period
Netinvestment
income(loss) (b)
Net realizedand unrealized
gains(losses) on
investments
Total frominvestmentoperations
Netinvestment
income
Netrealized
gainTotal
distributions
JPMorgan U.S. Small Company FundClass AYear Ended June 30, 2020 $15.96 $ 0.03 $(1.10) $(1.07) $(0.04) $(0.01) $(0.05)Year Ended June 30, 2019 19.60 0.03 (1.81) (1.78) — (1.86) (1.86)Year Ended June 30, 2018 18.10 —(f)(g) 2.69 2.69 — (1.19) (1.19)Year Ended June 30, 2017 15.09 —(f)(g) 3.02 3.02 (0.01) —(f) (0.01)Year Ended June 30, 2016 16.96 0.02 (1.20) (1.18) (0.02) (0.67) (0.69)
Class CYear Ended June 30, 2020 15.06 (0.05) (1.04) (1.09) — (0.01) (0.01)Year Ended June 30, 2019 18.70 (0.06) (1.72) (1.78) — (1.86) (1.86)Year Ended June 30, 2018 17.40 (0.09)(g) 2.58 2.49 — (1.19) (1.19)Year Ended June 30, 2017 14.57 (0.08)(g) 2.91 2.83 — —(f) —(f)Year Ended June 30, 2016 16.46 (0.05) (1.17) (1.22) — (0.67) (0.67)
Class IYear Ended June 30, 2020 16.40 0.07 (1.12) (1.05) (0.09) (0.01) (0.10)Year Ended June 30, 2019 20.05 0.07 (1.84) (1.77) (0.02) (1.86) (1.88)Year Ended June 30, 2018 18.47 0.05(g) 2.75 2.80 (0.03) (1.19) (1.22)Year Ended June 30, 2017 15.40 0.04(g) 3.08 3.12 (0.05) —(f) (0.05)Year Ended June 30, 2016 17.29 0.06 (1.22) (1.16) (0.06) (0.67) (0.73)
Class LYear Ended June 30, 2020 16.38 0.10 (1.12) (1.02) (0.12) (0.01) (0.13)Year Ended June 30, 2019 20.05 0.10 (1.86) (1.76) (0.05) (1.86) (1.91)Year Ended June 30, 2018 18.46 0.08(g) 2.76 2.84 (0.06) (1.19) (1.25)Year Ended June 30, 2017 15.39 0.08(g) 3.08 3.16 (0.09) —(f) (0.09)Year Ended June 30, 2016 17.28 0.10 (1.24) (1.14) (0.08) (0.67) (0.75)
Class R2Year Ended June 30, 2020 15.58 (0.01) (1.08) (1.09) — (0.01) (0.01)Year Ended June 30, 2019 19.22 (0.01) (1.77) (1.78) — (1.86) (1.86)Year Ended June 30, 2018 17.81 (0.05)(g) 2.65 2.60 — (1.19) (1.19)Year Ended June 30, 2017 14.88 (0.04)(g) 2.97 2.93 — —(f) —(f)Year Ended June 30, 2016 16.77 (0.01) (1.19) (1.20) (0.02) (0.67) (0.69)
Class R3Year Ended June 30, 2020 15.87 0.03 (1.10) (1.07) (0.05) (0.01) (0.06)Year Ended June 30, 2019 19.50 0.04 (1.81) (1.77) —(f) (1.86) (1.86)Year Ended June 30, 2018 18.03 0.01(g) 2.68 2.69 (0.03) (1.19) (1.22)September 9, 2016 (i) through June 30, 2017 16.02 0.04(g) 2.04 2.08 (0.07) —(f) (0.07)
(a) Annualized for periods less than one year, unless otherwise noted.(b) Calculated based upon average shares outstanding.(c) Not annualized for periods less than one year.(d) Includes adjustments in accordance with accounting principles generally accepted in the United States of America and as such, the net asset values for financial
reporting purposes and the returns based upon those net asset values may differ from the net asset values and returns for shareholder transactions.(e) Includes earnings credits and interest expense, if applicable, each of which is less than 0.005% unless otherwise noted.(f) Amount rounds to less than $0.005.(g) Net investment income (loss) may appear disproportionate among the classes due to the timing of recognition of income and changes in the relative size of the
classes.(h) Amount rounds to less than 0.005%.(i) Commencement of offering of class of shares.
SEE NOTES TO FINANCIAL STATEMENTS.
78 J.P. MORGAN SMALL CAP FUNDS JUNE 30, 2020
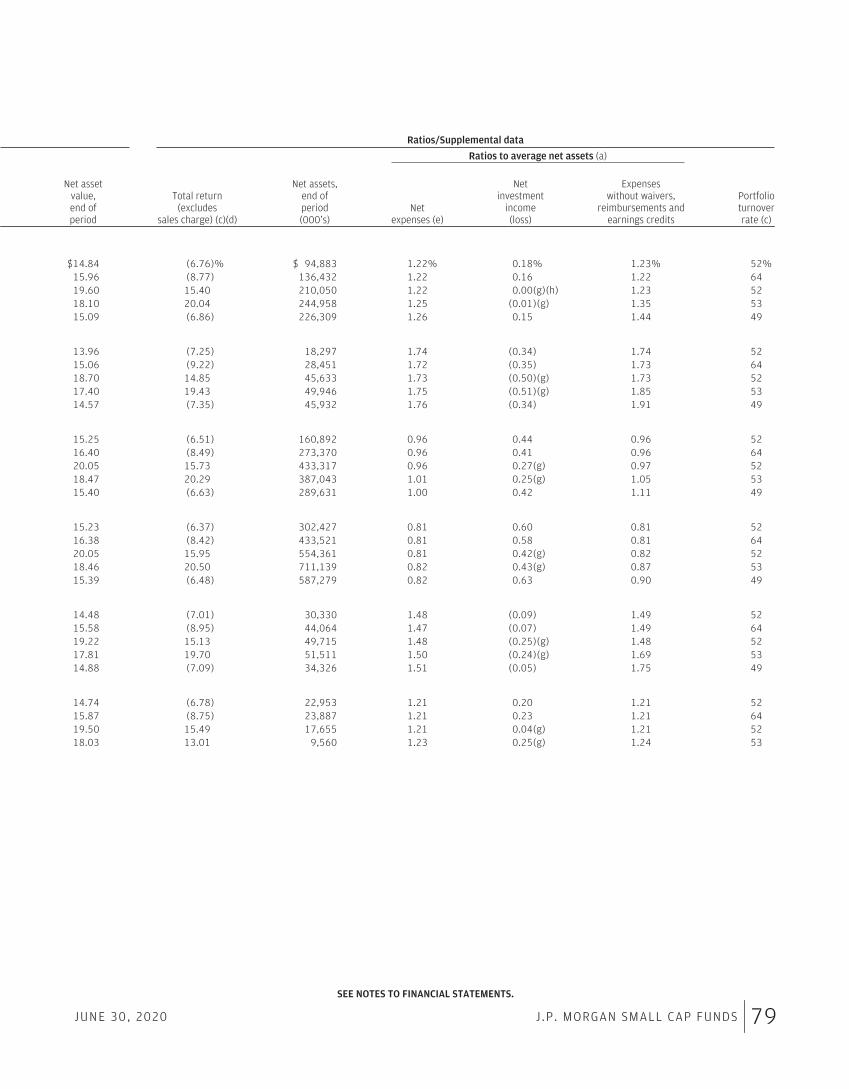
Ratios/Supplemental data
Ratios to average net assets (a)
Net assetvalue,end ofperiod
Total return(excludes
sales charge) (c)(d)
Net assets,end ofperiod(000’s)
Netexpenses (e)
Netinvestment
income(loss)
Expenseswithout waivers,
reimbursements andearnings credits
Portfolioturnoverrate (c)
$14.84 (6.76)% $ 94,883 1.22% 0.18% 1.23% 52%15.96 (8.77) 136,432 1.22 0.16 1.22 6419.60 15.40 210,050 1.22 0.00(g)(h) 1.23 5218.10 20.04 244,958 1.25 (0.01)(g) 1.35 5315.09 (6.86) 226,309 1.26 0.15 1.44 49
13.96 (7.25) 18,297 1.74 (0.34) 1.74 5215.06 (9.22) 28,451 1.72 (0.35) 1.73 6418.70 14.85 45,633 1.73 (0.50)(g) 1.73 5217.40 19.43 49,946 1.75 (0.51)(g) 1.85 5314.57 (7.35) 45,932 1.76 (0.34) 1.91 49
15.25 (6.51) 160,892 0.96 0.44 0.96 5216.40 (8.49) 273,370 0.96 0.41 0.96 6420.05 15.73 433,317 0.96 0.27(g) 0.97 5218.47 20.29 387,043 1.01 0.25(g) 1.05 5315.40 (6.63) 289,631 1.00 0.42 1.11 49
15.23 (6.37) 302,427 0.81 0.60 0.81 5216.38 (8.42) 433,521 0.81 0.58 0.81 6420.05 15.95 554,361 0.81 0.42(g) 0.82 5218.46 20.50 711,139 0.82 0.43(g) 0.87 5315.39 (6.48) 587,279 0.82 0.63 0.90 49
14.48 (7.01) 30,330 1.48 (0.09) 1.49 5215.58 (8.95) 44,064 1.47 (0.07) 1.49 6419.22 15.13 49,715 1.48 (0.25)(g) 1.48 5217.81 19.70 51,511 1.50 (0.24)(g) 1.69 5314.88 (7.09) 34,326 1.51 (0.05) 1.75 49
14.74 (6.78) 22,953 1.21 0.20 1.21 5215.87 (8.75) 23,887 1.21 0.23 1.21 6419.50 15.49 17,655 1.21 0.04(g) 1.21 5218.03 13.01 9,560 1.23 0.25(g) 1.24 53
SEE NOTES TO FINANCIAL STATEMENTS.
JUNE 30, 2020 J.P. MORGAN SMALL CAP FUNDS 79
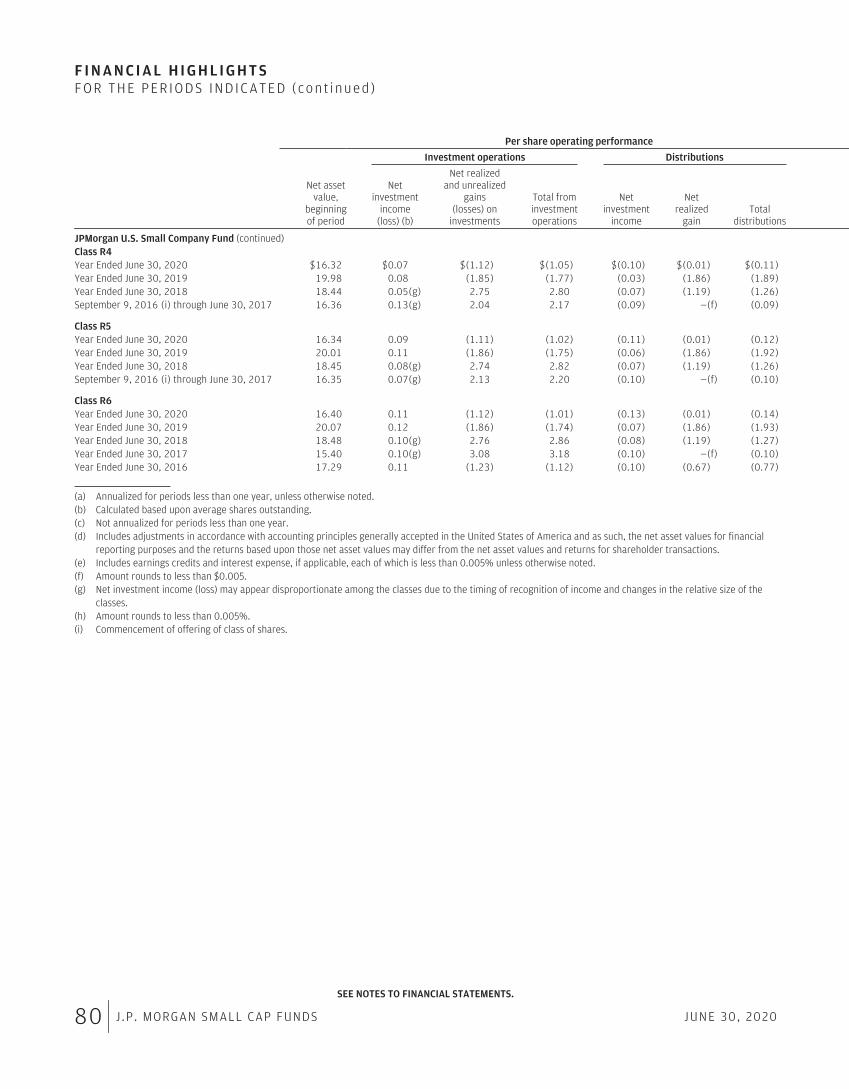
F I N A N C I A L H I G H L I G H T SFOR THE PER IODS IND ICATED (con t inued )
Per share operating performance
Investment operations Distributions
Net assetvalue,
beginningof period
Netinvestment
income(loss) (b)
Net realizedand unrealized
gains(losses) on
investments
Total frominvestmentoperations
Netinvestment
income
Netrealized
gainTotal
distributions
JPMorgan U.S. Small Company Fund (continued)Class R4Year Ended June 30, 2020 $16.32 $0.07 $(1.12) $(1.05) $(0.10) $(0.01) $(0.11)Year Ended June 30, 2019 19.98 0.08 (1.85) (1.77) (0.03) (1.86) (1.89)Year Ended June 30, 2018 18.44 0.05(g) 2.75 2.80 (0.07) (1.19) (1.26)September 9, 2016 (i) through June 30, 2017 16.36 0.13(g) 2.04 2.17 (0.09) —(f) (0.09)
Class R5Year Ended June 30, 2020 16.34 0.09 (1.11) (1.02) (0.11) (0.01) (0.12)Year Ended June 30, 2019 20.01 0.11 (1.86) (1.75) (0.06) (1.86) (1.92)Year Ended June 30, 2018 18.45 0.08(g) 2.74 2.82 (0.07) (1.19) (1.26)September 9, 2016 (i) through June 30, 2017 16.35 0.07(g) 2.13 2.20 (0.10) —(f) (0.10)
Class R6Year Ended June 30, 2020 16.40 0.11 (1.12) (1.01) (0.13) (0.01) (0.14)Year Ended June 30, 2019 20.07 0.12 (1.86) (1.74) (0.07) (1.86) (1.93)Year Ended June 30, 2018 18.48 0.10(g) 2.76 2.86 (0.08) (1.19) (1.27)Year Ended June 30, 2017 15.40 0.10(g) 3.08 3.18 (0.10) —(f) (0.10)Year Ended June 30, 2016 17.29 0.11 (1.23) (1.12) (0.10) (0.67) (0.77)
(a) Annualized for periods less than one year, unless otherwise noted.(b) Calculated based upon average shares outstanding.(c) Not annualized for periods less than one year.(d) Includes adjustments in accordance with accounting principles generally accepted in the United States of America and as such, the net asset values for financial
reporting purposes and the returns based upon those net asset values may differ from the net asset values and returns for shareholder transactions.(e) Includes earnings credits and interest expense, if applicable, each of which is less than 0.005% unless otherwise noted.(f) Amount rounds to less than $0.005.(g) Net investment income (loss) may appear disproportionate among the classes due to the timing of recognition of income and changes in the relative size of the
classes.(h) Amount rounds to less than 0.005%.(i) Commencement of offering of class of shares.
SEE NOTES TO FINANCIAL STATEMENTS.
80 J.P. MORGAN SMALL CAP FUNDS JUNE 30, 2020
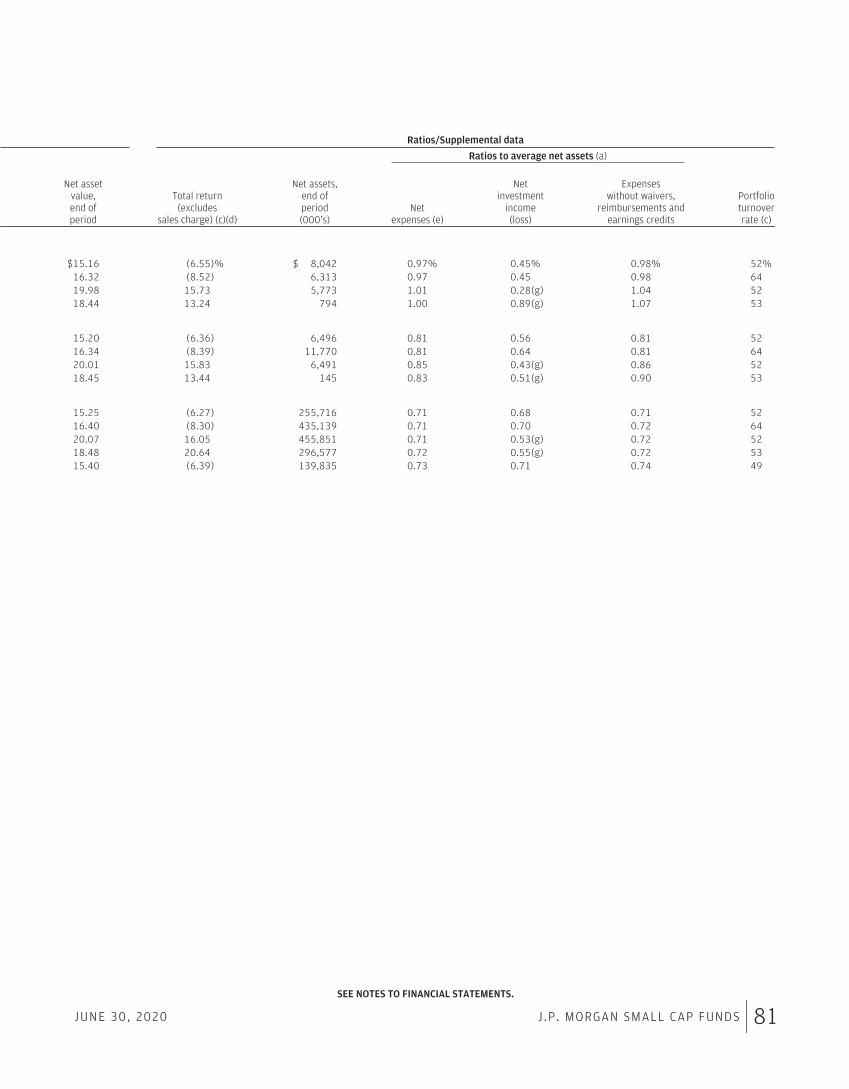
Ratios/Supplemental data
Ratios to average net assets (a)
Net assetvalue,end ofperiod
Total return(excludes
sales charge) (c)(d)
Net assets,end ofperiod(000’s)
Netexpenses (e)
Netinvestment
income(loss)
Expenseswithout waivers,
reimbursements andearnings credits
Portfolioturnoverrate (c)
$15.16 (6.55)% $ 8,042 0.97% 0.45% 0.98% 52%16.32 (8.52) 6,313 0.97 0.45 0.98 6419.98 15.73 5,773 1.01 0.28(g) 1.04 5218.44 13.24 794 1.00 0.89(g) 1.07 53
15.20 (6.36) 6,496 0.81 0.56 0.81 5216.34 (8.39) 11,770 0.81 0.64 0.81 6420.01 15.83 6,491 0.85 0.43(g) 0.86 5218.45 13.44 145 0.83 0.51(g) 0.90 53
15.25 (6.27) 255,716 0.71 0.68 0.71 5216.40 (8.30) 435,139 0.71 0.70 0.72 6420.07 16.05 455,851 0.71 0.53(g) 0.72 5218.48 20.64 296,577 0.72 0.55(g) 0.72 5315.40 (6.39) 139,835 0.73 0.71 0.74 49
SEE NOTES TO FINANCIAL STATEMENTS.
JUNE 30, 2020 J.P. MORGAN SMALL CAP FUNDS 81

N O T E S T O F I N A N C I A L S T A T E M E N T SAS OF JUNE 30 , 2 020
1. OrganizationJPMorgan Trust I (“JPM I”) and JPMorgan Trust II (“JPM II”) (collectively, the “Trusts”) were formed on November 12, 2004, as Delaware statutorytrusts, pursuant to Declarations of Trust dated November 5, 2004 and are registered under the Investment Company Act of 1940, as amended (the“1940 Act”), as open-end management investment companies.
The following are 6 separate funds of the Trusts (each, a “Fund” and collectively, the “Funds”) covered by this report:
Classes Offered Trust Diversification Classification
JPMorgan Small Cap Blend Fund Class A, Class C, Class I and Class R6(1) JPM I DiversifiedJPMorgan Small Cap Core Fund Class A, Class C, Class I, Class R2, Class R3, Class R4, Class R5 and Class R6 JPM I DiversifiedJPMorgan Small Cap Equity Fund Class A, Class C, Class I, Class R2, Class R3, Class R4, Class R5 and Class R6 JPM I DiversifiedJPMorgan Small Cap Growth Fund Class A, Class C, Class I, Class L, Class R2, Class R3, Class R4, Class R5 and
Class R6 JPM II DiversifiedJPMorgan Small Cap Value Fund Class A, Class C, Class I, Class R2, Class R3, Class R4, Class R5 and Class R6 JPM II DiversifiedJPMorgan U.S. Small Company Fund Class A, Class C, Class I, Class L, Class R2, Class R3, Class R4, Class R5 and
Class R6 JPM I Diversified
(1) Class R6 commenced operations on July 2, 2018 for JPMorgan Small Cap Blend Fund.
The investment objectives of JPMorgan Small Cap Blend Fund (“Small Cap Blend Fund”), JPMorgan Small Cap Core Fund (“Small Cap Core Fund”) andJPMorgan Small Cap Equity Fund (“Small Cap Equity Fund”) are to seek capital growth over the long term.
The investment objective of JPMorgan Small Cap Growth Fund (“Small Cap Growth Fund”) is to seek long-term capital growth primarily by investingin a portfolio of equity securities of small-capitalization and emerging growth companies.
The investment objective of JPMorgan Small Cap Value Fund (“Small Cap Value Fund”) is to seek long-term capital growth primarily by investing inequity securities of small-capitalization companies.
The investment objective of JPMorgan U.S. Small Company Fund (“U.S. Small Company Fund”) is to seek to provide high total return from a portfolioof small company stocks.
Class L Shares for the Small Cap Growth Fund and U.S. Small Company Fund are publicly offered on a limited basis. Investors are not eligible topurchase Class L shares of the Funds unless they meet certain requirements as described in the Funds’ prospectuses.
All share classes of the Small Cap Equity Fund are publicly offered only on a limited basis. Investors are not eligible to purchase shares of the Fundunless they meet certain requirements as described in the Fund’s prospectuses.
Class A Shares generally provide for a front-end sales charge while Class C Shares provide for a contingent deferred sales charge (“CDSC”). No salescharges are assessed with respect to Class I, Class L, Class R2, Class R3, Class R4, Class R5 and Class R6 Shares. Certain Class A Shares, for whichfront-end sales charges have been waived, may be subject to a CDSC as described in the Funds’ prospectus. Class C Shares automatically convert toClass A Shares after ten years. All classes of shares have equal rights as to earnings, assets and voting privileges, except that each class may beardifferent transfer agency, distribution and service fees and each class has exclusive voting rights with respect to its distribution plan and share-holder servicing agreements.
J.P. Morgan Investment Management Inc. (“JPMIM”), an indirect, wholly-owned subsidiary of JPMorgan Chase & Co. (“JPMorgan”), acts as Adviser(the “Adviser”) and Administrator (the “Administrator”) to the Funds.
2. Significant Accounting PoliciesThe following is a summary of significant accounting policies followed by the Funds in the preparation of their financial statements. The Funds areinvestment companies and, accordingly, follow the investment company accounting and reporting guidance of the Financial Accounting StandardsBoard (“FASB”) Accounting Standards Codification Topic 946 — Investment Companies, which is part of U.S. generally accepted accounting principles(“GAAP”). The preparation of financial statements in conformity with GAAP requires management to make estimates and assumptions that affect(i) the reported amounts of assets and liabilities, (ii) disclosure of contingent assets and liabilities at the date of the financial statements, and (iii) thereported amounts of increases and decreases in net assets from operations during the reporting period. Actual results could differ from thoseestimates.
A. Valuation of Investments — Investments are valued in accordance with GAAP and the Funds’ valuation policies set forth by, and under thesupervision and responsibility of, the Boards of Trustees of the Trusts (the “Boards”), which established the following approach to valuation, asdescribed more fully below: (i) investments for which market quotations are readily available shall be valued at their market value and (ii) all otherinvestments for which market quotations are not readily available shall be valued at their fair value as determined in good faith by the Boards.
The Administrator has established the J.P. Morgan Asset Management Americas Valuation Committee (“AVC”) to assist the Boards with the oversightand monitoring of the valuation of the Funds’ investments. The Administrator implements the valuation policies of the Funds’ investments, asdirected by the Boards. The AVC oversees and carries out the policies for the valuation of investments held in the Funds. This includes monitoringthe appropriateness of fair values based on results of ongoing valuation oversight including, but not limited to, consideration of macro or security
82 J.P. MORGAN SMALL CAP FUNDS JUNE 30, 2020

specific events, market events, and pricing vendor and broker due diligence. The Administrator is responsible for discussing and assessing the poten-tial impacts to the fair values on an ongoing basis, and, at least on a quarterly basis, with the AVC and the Boards.
A market-based approach is primarily used to value the Funds’ investments. Investments for which market quotations are not readily available arefair valued by approved affiliated and/or unaffiliated pricing vendors or third party broker-dealers (collectively referred to as “Pricing Services”) ormay be internally fair valued using methods set forth by the valuation policies approved by the Boards. This may include the use of related or com-parable assets or liabilities, recent transactions, market multiples, book values and other relevant information for the investment. An income-basedvaluation approach may be used in which the anticipated future cash flows of the investment are discounted to calculate the fair value. Discountsmay also be applied due to the nature or duration of any restrictions on the disposition of the investments. Valuations may be based upon currentmarket prices of securities that are comparable in coupon, rating, maturity and industry. It is possible that the estimated values may differ sig-nificantly from the values that would have been used had a ready market for the investments existed, and such differences could be material.
Equities and other exchange-traded instruments are valued at the last sale price or official market closing price on the primary exchange on whichthe instrument is traded before the net asset values (“NAV”) of the Funds are calculated on a valuation date.
Investments in open-end investment companies (“Underlying Funds”) are valued at each Underlying Fund’s NAV per share as of the report date.
Futures contracts are generally valued on the basis of available market quotations.
Valuations reflected in this report are as of the report date. As a result, changes in valuation due to market events and/or issuer-related events afterthe report date and prior to issuance of the report are not reflected herein.
The various inputs that are used in determining the valuation of the Funds’ investments are summarized into the three broad levels listed below.
‰ Level 1 — Unadjusted inputs using quoted prices in active markets for identical investments.‰ Level 2 — Other significant observable inputs including, but not limited to, quoted prices for similar investments, inputs other than quoted prices
that are observable for investments (such as interest rates, prepayment speeds, credit risk, etc.) or other market corroborated inputs.‰ Level 3 — Significant inputs based on the best information available in the circumstances, to the extent observable inputs are not available
(including the Funds’ assumptions in determining the fair value of investments).
A financial instrument’s level within the fair value hierarchy is based on the lowest level of any input, both individually and in the aggregate, that issignificant to the fair value measurement. The inputs or methodology used for valuing instruments are not necessarily an indication of the risk asso-ciated with investing in those instruments.
The following tables represent each valuation input as presented on the Schedules of Portfolio Investments (“SOIs”) (amounts in thousands):
Small Cap Blend Fund
Level 1Quoted prices
Level 2Other significant
observable inputs
Level 3Significant
unobservable inputs Total
Investments in SecuritiesCommon Stocks $ 455,744 $— $ — $ 455,744Rights — — —(a) —(a)Short-Term Investments
Investment Companies 17,254 — — 17,254Investment of cash collateral from securities loaned 34,262 — — 34,262
Total Short-Term Investments 51,516 — — 51,516
Total Investments in Securities $ 507,260 $— $ —(a) $ 507,260
Small Cap Core Fund
Level 1Quoted prices
Level 2Other significant
observable inputs
Level 3Significant
unobservable inputs Total
Total Investments in Securities (b) $ 375,449 $— $ — $ 375,449
Appreciation in Other Financial InstrumentsFutures Contracts (b) $ 94 $— $ — $ 94
Small Cap Equity Fund
Level 1Quoted prices
Level 2Other significant
observable inputs
Level 3Significant
unobservable inputs Total
Total Investments in Securities (b) $6,861,797 $— $ — $6,861,797
JUNE 30, 2020 J.P. MORGAN SMALL CAP FUNDS 83

N O T E S T O F I N A N C I A L S T A T E M E N T SAS OF JUNE 30 , 2 020 (con t inued )
Small Cap Growth Fund
Level 1Quoted prices
Level 2Other significant
observable inputs
Level 3Significant
unobservable inputs Total
Investments in SecuritiesCommon Stocks $3,850,582 $— $ — $3,850,582Rights — — —(a) —(a)Short-Term Investments
Investment Companies 123,428 — — 123,428Investment of cash collateral from securities loaned 317,008 — — 317,008
Total Short-Term Investments 440,436 — — 440,436
Total Investments in Securities $4,291,018 $— $ —(a) $4,291,018
Small Cap Value Fund
Level 1Quoted prices
Level 2Other significant
observable inputs
Level 3Significant
unobservable inputs Total
Total Investments in Securities (b) $1,030,907 $— $ — $1,030,907
Appreciation in Other Financial InstrumentsFutures Contracts (b) $ 279 $— $ — $ 279
U.S. Small Company Fund
Level 1Quoted prices
Level 2Other significant
observable inputs
Level 3Significant
unobservable inputs Total
Investments in SecuritiesCommon Stocks $ 888,265 $— $ — $ 888,265Rights — — 165 165Short-Term Investments
Investment Companies 14,420 — — 14,420Investment of cash collateral from securities loaned 91,886 — — 91,886
Total Short-Term Investments 106,306 — — 106,306
Total Investments in Securities $ 994,571 $— $165 $ 994,736
Appreciation in Other Financial InstrumentsFutures Contracts $ 53 $— $ — $ 53
(a) Amount rounds to less than one thousand.(b) Please refer to the SOIs for specifics of portfolio holdings.
B. Securities Lending — The Funds are authorized to engage in securities lending in order to generate additional income. The Funds are able to lendto approved borrowers. Citibank N.A. (“Citibank”) serves as lending agent for the Funds, pursuant to a Securities Lending Agency Agreement (the“Securities Lending Agency Agreement”). Securities loaned are collateralized by cash equal to at least 100% of the market value plus accrued inter-est on the securities lent, which is invested in the Class IM Shares of the JPMorgan U.S. Government Money Market Fund and the Agency SLClass Shares of the JPMorgan Securities Lending Money Market Fund. The Funds retain loan fees and the interest on cash collateral investments butare required to pay the borrower a rebate for the use of cash collateral. In cases where the lent security is of high value to borrowers, there may bea negative rebate (i.e., a net payment from the borrower to the Funds). Upon termination of a loan, the Funds are required to return to the borroweran amount equal to the cash collateral, plus any rebate owed to the borrowers. The remaining maturities of the securities lending transactions areconsidered overnight and continuous. Loans are subject to termination by the Funds or the borrower at any time.
The net income earned on the securities lending (after payment of rebates and Citibank’s fee) is included on the Statements of Operations as Incomefrom securities lending (net). The Funds also receive payments from the borrower during the period of the loan, equivalent to dividends and interestearned on the securities loaned, which are recorded as Dividend or Interest income, respectively, on the Statements of Operations.
Under the Securities Lending Agency Agreement, Citibank marks to market the loaned securities on a daily basis. In the event the cash receivedfrom the borrower is less than 102% of the value of the loaned securities (105% for loans of non-U.S. securities), Citibank requests additional cashfrom the borrower so as to maintain a collateralization level of at least 102% of the value of the loaned securities plus accrued interest (105% forloans of non-U.S. securities), subject to certain de minimis amounts.
84 J.P. MORGAN SMALL CAP FUNDS JUNE 30, 2020

The value of securities out on loan is recorded as an asset on the Statements of Assets and Liabilities. The value of the cash collateral received isrecorded as a liability on the Statements of Assets and Liabilities and details of collateral investments are disclosed on the SOIs.
The Funds bear the risk of loss associated with the collateral investments and are not entitled to additional collateral from the borrower to cover anysuch losses. To the extent that the value of the collateral investments declines below the amount owed to a borrower, the Funds may incur lossesthat exceed the amount they earned on lending the security. Upon termination of a loan, the Funds may use leverage (borrow money) to repay theborrower for cash collateral posted if the Adviser does not believe that it is prudent to sell the collateral investments to fund the payment of thisliability. Securities lending activity is subject to master netting arrangements.
The following table presents for each lending Fund, the value of the securities on loan with Citibank, net of amounts available for offset under themaster netting arrangements and any related collateral received or posted by the Funds as of June 30, 2020 (amounts in thousands).
Investment Securitieson Loan, at value,Presented on the
Statements of Assetsand Liabilities
Cash CollateralPosted by Borrower*
Net Amount Dueto Counterparty
(not less than zero)
Small Cap Blend Fund $ 33,465 $ (33,465) $—Small Cap Core Fund 23,895 (23,895) —Small Cap Equity Fund 281,563 (281,563) —Small Cap Growth Fund 305,026 (305,026) —Small Cap Value Fund 67,671 (67,671) —U.S. Small Company Fund 89,671 (89,671) —
* Collateral posted reflects the value of securities on loan and does not include any additional amounts received from the borrower.
Securities lending also involves counterparty risks, including the risk that the loaned securities may not be returned in a timely manner or at all.Subject to certain conditions, Citibank has agreed to indemnify the Funds from losses resulting from a borrower’s failure to return a loaned security.
JPMIM voluntarily waived investment advisory fees charged to the Funds to reduce the impact of the cash collateral investment in the JPMorgan U.S.Government Money Market Fund from 0.15% to 0.06%. For the year ended June 30, 2020, JPMIM waived fees associated with the Funds’ investmentin the JPMorgan U.S. Government Money Market Fund as follows (amounts in thousands):
Small Cap Blend Fund $ 6Small Cap Core Fund 5Small Cap Equity Fund 29Small Cap Growth Fund 38Small Cap Value Fund 12U.S. Small Company Fund 15
The above waiver is included in the determination of earnings on cash collateral investment and in the calculation of Citibank’s compensation and isincluded on the Statements of Operations as Income from securities lending (net).
C. Investment Transactions with Affiliates — The Funds invested in Underlying Funds which are advised by the Adviser. An issuer which is undercommon control with a Fund may be considered an affiliate. For the purposes of the financial statements, the Funds assume the issuers listed in thetables below to be affiliated issuers. Underlying Funds’ distributions may be reinvested into the Underlying Funds. Reinvestment amounts areincluded in the purchase cost amounts in the tables below. Amounts in the tables below are in thousands.
Small Cap Blend Fund
For the year ended June 30, 2020
Security Description
Value atJune 30,
2019Purchases
at Cost
ProceedsfromSales
NetRealized
Gain (Loss)
Changein UnrealizedAppreciation/(Depreciation)
Value atJune 30,
2020
Shares atJune 30,
2020DividendIncome
Capital GainDistributions
JPMorgan Prime Money Market FundClass IM Shares, 0.47% (a)(b) $12,791 $175,960 $171,507 $ 5 $5 $17,254 17,239 $169 $—
JPMorgan Securities Lending MoneyMarket Fund Agency SLClass Shares, 0.51% (a)(b) 26,008 63,999 62,000 8* —(c) 28,015 28,004 378* —
JPMorgan U.S. Government MoneyMarket Fund Class IM Shares,0.14% (a)(b) 10,612 173,835 178,200 — — 6,247 6,247 111* —
Total $49,411 $413,794 $411,707 $13 $5 $51,516 $658 $—
JUNE 30, 2020 J.P. MORGAN SMALL CAP FUNDS 85

N O T E S T O F I N A N C I A L S T A T E M E N T SAS OF JUNE 30 , 2 020 (con t inued )
Small Cap Core Fund
For the year ended June 30, 2020
Security Description
Value atJune 30,
2019Purchases
at Cost
ProceedsfromSales
NetRealized
Gain (Loss)
Change inUnrealized
Appreciation/(Depreciation)
Value atJune 30,
2020
Shares atJune 30,
2020DividendIncome
Capital GainDistributions
JPMorgan Prime Money Market FundClass IM Shares, 0.47% (a)(b) $47,070 $154,081 $191,976 $ 1 $1 $ 9,177 9,169 $217 $—
JPMorgan Securities Lending MoneyMarket Fund Agency SLClass Shares, 0.51% (a)(b) 25,006 60,000 64,000 (3)* 3 21,006 20,998 381* —
JPMorgan U.S. Government MoneyMarket Fund Class IM Shares,0.14% (a)(b) 7,388 164,866 168,378 — — 3,876 3,876 91* —
Total $79,464 $378,947 $424,354 $(2) $4 $34,059 $689 $—
Small Cap Equity Fund
For the year ended June 30, 2020
Security Description
Value atJune 30,
2019Purchases
at CostProceeds
from Sales
NetRealized
Gain (Loss)
Change inUnrealized
Appreciation/(Depreciation)
Value atJune 30,
2020
Shares atJune 30,
2020DividendIncome
Capital GainDistributions
JPMorgan Prime Money MarketFund Class IM Shares,0.47% (a)(b) $254,743 $2,199,097 $2,177,545 $23 $ 85 $276,403 276,154 $4,684 $—
JPMorgan Securities LendingMoney Market Fund AgencySL Class Shares,0.51% (a)(b) 177,054 1,141,000 1,065,000 57* (16) 253,095 252,994 3,759* —
JPMorgan U.S. GovernmentMoney Market Fund Class IMShares, 0.14% (a)(b) 39,120 939,358 946,430 — — 32,048 32,048 521* —
Total $470,917 $4,279,455 $4,188,975 $80 $ 69 $561,546 $8,964 $—
Small Cap Growth Fund
For the year ended June 30, 2020
Security Description
Value atJune 30,
2019Purchases
at Cost
ProceedsfromSales
NetRealized
Gain (Loss)
Change inUnrealized
Appreciation/(Depreciation)
Value atJune 30,
2020
Shares atJune 30,
2020DividendIncome
Capital GainDistributions
JPMorgan Prime Money MarketFund Class IM Shares,0.47% (a)(b) $ 24,541 $1,575,737 $1,476,853 $(31) $ 34 $123,428 123,317 $ 869 $—
JPMorgan Securities LendingMoney Market Fund AgencySL Class Shares,0.51% (a)(b) 341,079 1,154,000 1,211,000 55* (29) 284,105 283,992 4,553* —
JPMorgan U.S. GovernmentMoney Market Fund Class IMShares, 0.14% (a)(b) 75,263 962,486 1,004,846 — — 32,903 32,903 638* —
Total $440,883 $3,692,223 $3,692,699 $ 24 $ 5 $440,436 $6,060 $—
86 J.P. MORGAN SMALL CAP FUNDS JUNE 30, 2020

Small Cap Value Fund
For the year ended June 30, 2020
Security Description
Value atJune 30,
2019Purchases
at Cost
ProceedsfromSales
NetRealized
Gain (Loss)
Change inUnrealized
Appreciation/(Depreciation)
Value atJune 30,
2020
Shares atJune 30,
2020DividendIncome
Capital GainDistributions
JPMorgan Prime Money MarketFund Class IM Shares,0.47% (a)(b) $ 35,272 $ 554,491 $ 574,971 $4 $2 $14,798 14,785 $ 472 $—
JPMorgan Securities LendingMoney Market Fund Agency SLClass Shares, 0.51% (a)(b) 70,028 171,000 177,000 3* 1 64,032 64,006 1,167* —
JPMorgan U.S. GovernmentMoney Market Fund Class IMShares, 0.14% (a)(b) 23,241 325,523 343,168 — — 5,596 5,596 222* —
Total $128,541 $1,051,014 $1,095,139 $7 $3 $84,426 $1,861 $—
U.S. Small Company Fund
For the year ended June 30, 2020
Security Description
Value atJune 30,
2019Purchases
at Cost
ProceedsfromSales
NetRealized
Gain (Loss)
Change inUnrealized
Appreciation/(Depreciation)
Value atJune 30,
2020
Shares atJune 30,
2020DividendIncome
Capital GainDistributions
JPMorgan Prime Money MarketFund Class IM Shares,0.47% (a)(b) $ 38,896 $ 578,067 $ 602,551 $ 9 $(1) $ 14,420 14,407 $ 423 $—
JPMorgan Securities LendingMoney Market Fund AgencySL Class Shares, 0.51%(a)(b) 106,032 212,001 236,000 5* (1) 82,037 82,004 1,387* —
JPMorgan U.S. GovernmentMoney Market Fund Class IMShares, 0.14% (a)(b) 25,260 377,153 392,564 — — 9,849 9,849 267* —
Total $170,188 $1,167,221 $1,231,115 $14 $(2) $106,306 $2,077 $—
(a) Investment in an affiliated fund, which is registered under the Investment Company Act of 1940, as amended, and is advised by J.P. MorganInvestment Management Inc.
(b) The rate shown is the current yield as of June 30, 2020.(c) Amount rounds to less than one thousand.* Amount is included on the Statements of Operations as Income from securities lending (net) (after payments of rebates and Citibank’s fee).
D. Futures Contracts — Small Cap Core Fund, Small Cap Value Fund and U.S. Small Company Fund used index futures contracts to gain or reduceexposure to the stock market, maintain liquidity or minimize transaction costs. The Funds buy futures contracts to invest incoming cash in the mar-ket or sell futures in response to cash outflows, thereby simulating an invested position in the underlying index while maintaining a cash balance forliquidity.
Futures contracts provide for the delayed delivery of the underlying instrument at a fixed price or are settled for a cash amount based on thechange in the value of the underlying instrument at a specific date in the future. Upon entering into a futures contract, the Funds are required todeposit with the broker, cash or securities in an amount equal to a certain percentage of the contract amount, which is referred to as the initialmargin deposit. Subsequent payments, referred to as variation margin, are made or received by the Funds periodically and are based on changes inthe market value of open futures contracts. Changes in the market value of open futures contracts are recorded as Change in net unrealizedappreciation/depreciation on the Statements of Operations. Realized gains or losses, representing the difference between the value of the contractat the time it was opened and the value at the time it was closed, are reported on the Statements of Operations at the closing or expiration of thefutures contract. Securities deposited as initial margin are designated on the SOIs, while cash deposited, which is considered restricted, is recordedon the Statements of Assets and Liabilities. A receivable from and/or a payable to brokers for the daily variation margin is also recorded on theStatements of Assets and Liabilities.
The use of futures contracts exposes the Funds to equity price risk. The Funds may be subject to the risk that the change in the value of the futurescontract may not correlate perfectly with the underlying instrument. Use of long futures contracts subjects the Funds to risk of loss in excess of theamounts shown on the Statements of Assets and Liabilities, up to the notional amount of the futures contracts. Use of short futures contracts
JUNE 30, 2020 J.P. MORGAN SMALL CAP FUNDS 87

N O T E S T O F I N A N C I A L S T A T E M E N T SAS OF JUNE 30 , 2 020 (con t inued )
subjects the Funds to unlimited risk of loss. The Funds may enter into futures contracts only on exchanges or boards of trade. The exchange orboard of trade acts as the counterparty to each futures transaction; therefore, the Funds’ credit risk is limited to failure of the exchange or board oftrade. Under some circumstances, futures exchanges may establish daily limits on the amount that the price of a futures contract can vary from theprevious day’s settlement price, which could effectively prevent liquidation of positions.
The table below discloses the volume of the Funds’ futures contracts activity during the year ended June 30, 2020 (amounts in thousands):
Small Cap CoreFund
Small CapValue Fund
U.S. SmallCompany Fund
Futures Contracts — Equity:Average Notional Balance Long $11,104 $24,518 $24,497Ending Notional Balance Long 4,524 9,480 5,530
The Funds’ futures contracts are not subject to master netting arrangements (the right to close out all transactions traded with a counterparty andnet amounts owed or due across transactions).
E. Security Transactions and Investment Income — Investment transactions are accounted for on the trade date (the date the order to buy or sellis executed). Securities gains and losses are calculated on a specifically identified cost basis. Interest income is determined on the basis of couponinterest accrued using the effective interest method, which adjusts for amortization of premiums and accretion of discounts. Dividend income net offoreign taxes withheld, if any, is recorded on the ex-dividend date or when a Fund first learns of the dividend.
To the extent such information is publicly available, the Funds record distributions received in excess of income earned from underlying investmentsas a reduction of cost of investments and/or realized gain. Such amounts are based on estimates if actual amounts are not available and actualamounts of income, realized gain and return of capital may differ from the estimated amounts. The Funds adjust the estimated amounts of thecomponents of distributions (and consequently their net investment income) as necessary once the issuers provide information about the actualcomposition of the distributions.
F. Allocation of Income and Expenses — Expenses directly attributable to a Fund are charged directly to that Fund, while the expenses attributableto more than one fund of the Trusts are allocated among the applicable funds. Investment income, realized and unrealized gains and losses andexpenses, other than class-specific expenses, are allocated daily to each class of shares based upon the proportion of net assets of each class at thebeginning of each day.
Transfer agency fees are class-specific expenses. The amount of the transfer agency fees charged to each share class of the Funds for the yearended June 30, 2020 are as follows (amounts in thousands):
Class A Class C Class I Class L Class R2 Class R3 Class R4 Class R5 Class R6 Total
Small Cap Blend FundTransfer agency fees $ 23 $1 $ 5 n/a n/a n/a n/a n/a $ —(a) $ 29
Small Cap Core FundTransfer agency fees 4 1 2 n/a $ —(a) $ —(a) $ —(a) $ 7 3 17
Small Cap Equity FundTransfer agency fees 248 7 65 n/a 2 —(a) —(a) 16 19 357
Small Cap Growth FundTransfer agency fees 45 7 19 $ 8 3 1 1 1 50 135
Small Cap Value FundTransfer agency fees 9 3 8 n/a 18 4 —(a) 5 37 84
U.S. Small Company FundTransfer agency fees 18 7 11 12 10 1 1 —(a) 18 78
(a) Amount rounds to less than one thousand.
G. Federal Income Taxes — Each Fund is treated as a separate taxable entity for Federal income tax purposes. Each Fund’s policy is to comply withthe provisions of the Internal Revenue Code (the “Code”) applicable to regulated investment companies and to distribute to shareholders all of itsdistributable net investment income and net realized capital gains on investments. Accordingly, no provision for Federal income tax is necessary.Management has reviewed the Funds’ tax positions for all open tax years and has determined that as of June 30, 2020, no liability for Federalincome tax is required in the Funds’ financial statements for net unrecognized tax benefits. However, management’s conclusions may be subject tofuture review based on changes in, or the interpretation of, the accounting standards or tax laws and regulations. Each Fund’s Federal tax returnsfor the prior three fiscal years remain subject to examination by the Internal Revenue Service.
H. Distributions to Shareholders — Distributions from net investment income, if any, are generally declared and paid at least annually, except forSmall Cap Value Fund, which are generally declared and paid quarterly. Distributions are declared separately for each class. No class has prefer-ential dividend rights; differences in per share rates are due to differences in separate class expenses. Net realized capital gains, if any, are dis-tributed by each Fund at least annually. The amount of distributions from net investment income and net realized capital gains is determined in
88 J.P. MORGAN SMALL CAP FUNDS JUNE 30, 2020

accordance with Federal income tax regulations, which may differ from GAAP. To the extent these “book/tax” differences are permanent in nature(i.e., that they result from other than timing of recognition — “temporary differences”), such amounts are reclassified within the capital accountsbased on their Federal tax basis treatment.
The following amounts were reclassified within the capital accounts (amounts in thousands):
Paid-in-Capital
Accumulatedundistributed(distributionsin excess of)
net investmentincome
Accumulatednet realized
gains (losses)
Small Cap Blend Fund $ (7) $ (135) $ 142Small Cap Core Fund — 812 (812)Small Cap Equity Fund — (4,820) 4,820Small Cap Growth Fund 25,587 (387) (25,200)Small Cap Value Fund — (530) 530U.S. Small Company Fund —(a) (288) 288
(a) Amount rounds to less than one thousand.
The reclassifications for the Funds relate primarily to investments in partnerships, investments in passive foreign investment companies (“PFICs”),non-taxable dividends, redesignation of distributions and tax equalization.
3. Fees and Other Transactions with Affiliates
A. Investment Advisory Fee — Pursuant to Investment Advisory Agreements, the Adviser manages the investments of each Fund and for such serv-ices is paid a fee. The investment advisory fee is accrued daily and paid monthly based on each Fund’s respective average daily net assets. Theannual rate for each Fund is as follows:
Small Cap Blend Fund 0.65%Small Cap Core Fund 0.65Small Cap Equity Fund 0.65Small Cap Growth Fund 0.65Small Cap Value Fund 0.65U.S. Small Company Fund 0.60
The Adviser waived investment advisory fees and/or reimbursed expenses as outlined in Note 3.F.
B. Administration Fee — Pursuant to Administration Agreements, the Administrator provides certain administration services to the Funds. Inconsideration of these services, the Administrator receives a fee accrued daily and paid monthly at an annual rate of 0.075% of the first $10 billionof each Fund’s respective average daily net assets, plus 0.050% of each Fund’s respective average daily net assets between $10 billion and$20 billion, plus 0.025% of each Fund’s respective average daily net assets between $20 billion and $25 billion, plus 0.01% of each Fund’s respectiveaverage daily net assets in excess of $25 billion. For the year ended June 30, 2020, the effective rate was 0.08% of each Fund’s average daily netassets, notwithstanding any fee waivers and/or expense reimbursements.
The Administrator waived administration fees as outlined in Note 3.F.
JPMorgan Chase Bank, N.A. (“JPMCB”), a wholly-owned subsidiary of JPMorgan, serves as the Funds’ sub-administrator (the “Sub-administrator”).For its services as Sub-administrator, JPMCB receives a portion of the fees payable to the Administrator.
C. Distribution Fees — Pursuant to a Distribution Agreement, JPMorgan Distribution Services, Inc. (“JPMDS”), an indirect, wholly-owned subsidiaryof JPMorgan, serves as each Fund’s principal underwriter and promotes and arranges for the sale of each Fund’s shares.
The Boards have adopted a Distribution Plan (the “Distribution Plan”) for Class A, Class C, Class R2 and Class R3 Shares of the Funds, as applicable,pursuant to Rule 12b-1 under the 1940 Act. Class I, Class L, Class R4, Class R5 and Class R6 Shares of the Funds do not charge a distribution fee. TheDistribution Plan provides that each Fund shall pay, with respect to the applicable share classes, distribution fees, including payments to JPMDS, atannual rates of the average daily net assets as shown in the table below:
Class A Class C Class R2 Class R3
Small Cap Blend Fund 0.25% 0.75% n/a n/aSmall Cap Core Fund 0.25 0.75 0.50% 0.25%Small Cap Equity Fund 0.25 0.75 0.50 0.25Small Cap Growth Fund 0.25 0.75 0.50 0.25Small Cap Value Fund 0.25 0.75 0.50 0.25U.S. Small Company Fund 0.25 0.75 0.50 0.25
JUNE 30, 2020 J.P. MORGAN SMALL CAP FUNDS 89
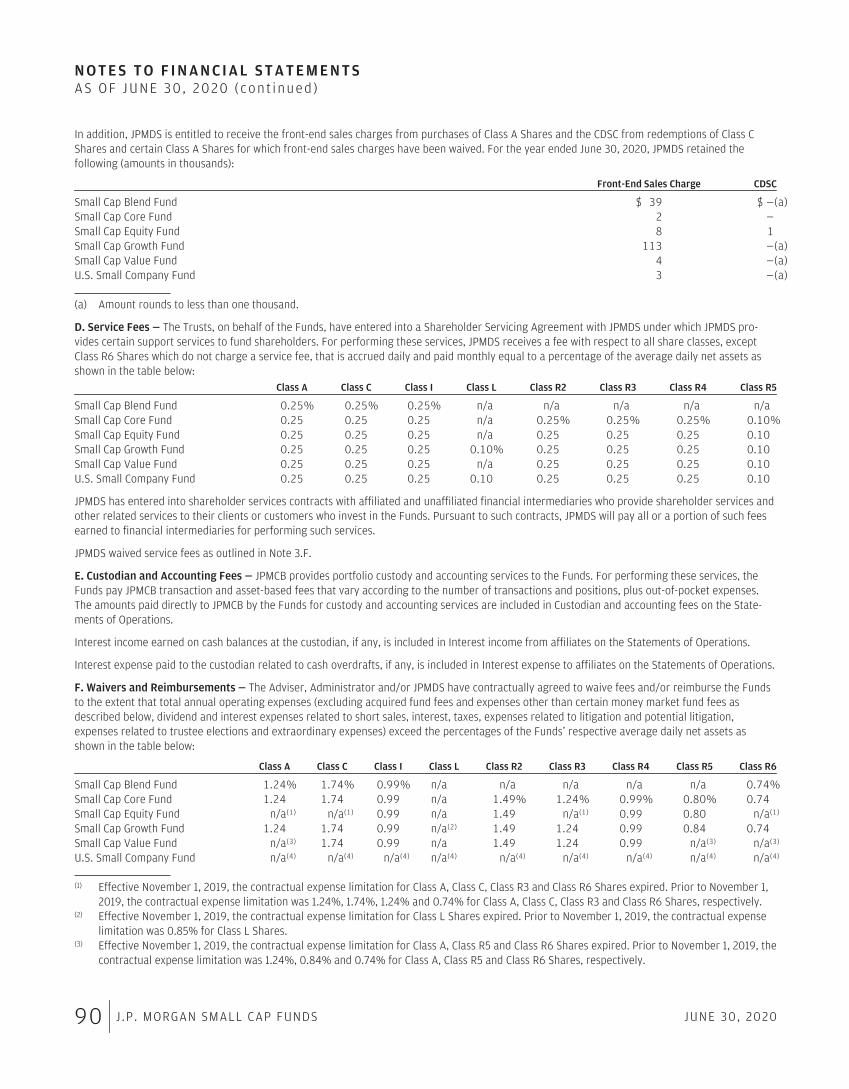
N O T E S T O F I N A N C I A L S T A T E M E N T SAS OF JUNE 30 , 2 020 (con t inued )
In addition, JPMDS is entitled to receive the front-end sales charges from purchases of Class A Shares and the CDSC from redemptions of Class CShares and certain Class A Shares for which front-end sales charges have been waived. For the year ended June 30, 2020, JPMDS retained thefollowing (amounts in thousands):
Front-End Sales Charge CDSC
Small Cap Blend Fund $ 39 $ —(a)Small Cap Core Fund 2 —Small Cap Equity Fund 8 1Small Cap Growth Fund 113 —(a)Small Cap Value Fund 4 —(a)U.S. Small Company Fund 3 —(a)
(a) Amount rounds to less than one thousand.
D. Service Fees — The Trusts, on behalf of the Funds, have entered into a Shareholder Servicing Agreement with JPMDS under which JPMDS pro-vides certain support services to fund shareholders. For performing these services, JPMDS receives a fee with respect to all share classes, exceptClass R6 Shares which do not charge a service fee, that is accrued daily and paid monthly equal to a percentage of the average daily net assets asshown in the table below:
Class A Class C Class I Class L Class R2 Class R3 Class R4 Class R5
Small Cap Blend Fund 0.25% 0.25% 0.25% n/a n/a n/a n/a n/aSmall Cap Core Fund 0.25 0.25 0.25 n/a 0.25% 0.25% 0.25% 0.10%Small Cap Equity Fund 0.25 0.25 0.25 n/a 0.25 0.25 0.25 0.10Small Cap Growth Fund 0.25 0.25 0.25 0.10% 0.25 0.25 0.25 0.10Small Cap Value Fund 0.25 0.25 0.25 n/a 0.25 0.25 0.25 0.10U.S. Small Company Fund 0.25 0.25 0.25 0.10 0.25 0.25 0.25 0.10
JPMDS has entered into shareholder services contracts with affiliated and unaffiliated financial intermediaries who provide shareholder services andother related services to their clients or customers who invest in the Funds. Pursuant to such contracts, JPMDS will pay all or a portion of such feesearned to financial intermediaries for performing such services.
JPMDS waived service fees as outlined in Note 3.F.
E. Custodian and Accounting Fees — JPMCB provides portfolio custody and accounting services to the Funds. For performing these services, theFunds pay JPMCB transaction and asset-based fees that vary according to the number of transactions and positions, plus out-of-pocket expenses.The amounts paid directly to JPMCB by the Funds for custody and accounting services are included in Custodian and accounting fees on the State-ments of Operations.
Interest income earned on cash balances at the custodian, if any, is included in Interest income from affiliates on the Statements of Operations.
Interest expense paid to the custodian related to cash overdrafts, if any, is included in Interest expense to affiliates on the Statements of Operations.
F. Waivers and Reimbursements — The Adviser, Administrator and/or JPMDS have contractually agreed to waive fees and/or reimburse the Fundsto the extent that total annual operating expenses (excluding acquired fund fees and expenses other than certain money market fund fees asdescribed below, dividend and interest expenses related to short sales, interest, taxes, expenses related to litigation and potential litigation,expenses related to trustee elections and extraordinary expenses) exceed the percentages of the Funds’ respective average daily net assets asshown in the table below:
Class A Class C Class I Class L Class R2 Class R3 Class R4 Class R5 Class R6
Small Cap Blend Fund 1.24% 1.74% 0.99% n/a n/a n/a n/a n/a 0.74%Small Cap Core Fund 1.24 1.74 0.99 n/a 1.49% 1.24% 0.99% 0.80% 0.74Small Cap Equity Fund n/a(1) n/a(1) 0.99 n/a 1.49 n/a(1) 0.99 0.80 n/a(1)
Small Cap Growth Fund 1.24 1.74 0.99 n/a(2) 1.49 1.24 0.99 0.84 0.74Small Cap Value Fund n/a(3) 1.74 0.99 n/a 1.49 1.24 0.99 n/a(3) n/a(3)
U.S. Small Company Fund n/a(4) n/a(4) n/a(4) n/a(4) n/a(4) n/a(4) n/a(4) n/a(4) n/a(4)
(1) Effective November 1, 2019, the contractual expense limitation for Class A, Class C, Class R3 and Class R6 Shares expired. Prior to November 1,2019, the contractual expense limitation was 1.24%, 1.74%, 1.24% and 0.74% for Class A, Class C, Class R3 and Class R6 Shares, respectively.
(2) Effective November 1, 2019, the contractual expense limitation for Class L Shares expired. Prior to November 1, 2019, the contractual expenselimitation was 0.85% for Class L Shares.
(3) Effective November 1, 2019, the contractual expense limitation for Class A, Class R5 and Class R6 Shares expired. Prior to November 1, 2019, thecontractual expense limitation was 1.24%, 0.84% and 0.74% for Class A, Class R5 and Class R6 Shares, respectively.
90 J.P. MORGAN SMALL CAP FUNDS JUNE 30, 2020

(4) Effective November 1, 2019, the contractual expense limitation for Class A, Class C, Class I, Class L, Class R2, Class R3, Class R4, Class R5 andClass R6 Shares expired. Prior to November 1, 2019, the contractual expense limitation was 1.26%, 1.76%, 1.01%, 0.83%, 1.51%, 1.26%, 1.01%,0.86% and 0.76% for Class A, Class C, Class I, Class L, Class R2, Class R3, Class R4, Class R5 and Class R6 Shares, respectively.
The expense limitation agreements were in effect for the year ended June 30, 2020. The contractual expense limitation percentages are in placeuntil at least October 31, 2020.
For the year ended June 30, 2020, the Funds’ service providers waived fees and/or reimbursed expenses for each of the Funds as follows (amountsin thousands). None of these parties expect the Funds to repay any such waived fees and reimbursed expenses in future years.
Contractual Waivers
InvestmentAdvisory Fees
AdministrationFees
ServiceFees Total
ContractualReimbursements
Small Cap Blend Fund $133 $ 89 $ 29 $251 $ —Small Cap Core Fund 141 94 87 322 3Small Cap Equity Fund 38 24 559 621 —Small Cap Growth Fund 303 199 77 579 50Small Cap Value Fund 59 38 68 165 8U.S. Small Company Fund — — 1 1 —
Additionally, the Funds may invest in one or more money market funds advised by the Adviser (affiliated money market funds). The Adviser, Admin-istrator and/or JPMDS, as shareholder servicing agent, have contractually agreed to waive fees and/or reimburse expenses in an amount sufficientto offset the respective net fees each collects from the affiliated money market fund on the applicable Fund’s investment in such affiliated moneymarket fund, except for investments of securities lending cash collateral. None of these parties expect the Funds to repay any such waived fees andreimbursed expenses in future years.
The amount of waivers resulting from investments in these money market funds for the year ended June 30, 2020 was as follows (amounts inthousands):
Small Cap Blend Fund $ 15Small Cap Core Fund 18Small Cap Equity Fund 380Small Cap Growth Fund 74Small Cap Value Fund 40U.S. Small Company Fund 35
G. Other — Certain officers of the Trusts are affiliated with the Adviser, the Administrator and JPMDS. Such officers, with the exception of the ChiefCompliance Officer, receive no compensation from the Funds for serving in their respective roles.
The Boards designated and appointed a Chief Compliance Officer to the Funds pursuant to Rule 38a-1 under the 1940 Act. Each Fund, along withaffiliated funds, makes reimbursement payments, on a pro-rata basis, to the Administrator for a portion of the fees associated with the office of theChief Compliance Officer. Such fees are included in Trustees’ and Chief Compliance Officer’s fees on the Statements of Operations.
The Trusts adopted a Trustee Deferred Compensation Plan (the “Plan”) which allows the independent Trustees to defer the receipt of all or a portionof compensation related to performance of their duties as Trustees. The deferred fees are invested in various J.P. Morgan Funds until distribution inaccordance with the Plan.
During the year ended June 30, 2020, the Small Cap Blend Fund, Small Cap Core Fund, Small Cap Equity Fund, Small Cap Growth Fund, and U.S.Small Company Fund purchased securities from an underwriting syndicate in which the principal underwriter or members of the syndicate wereaffiliated with the Adviser.
The Securities and Exchange Commission (“SEC”) has granted an exemptive order permitting the Funds to engage in principal transactions withJ.P. Morgan Securities, Inc., an affiliated broker, involving taxable money market instruments, subject to certain conditions.
JUNE 30, 2020 J.P. MORGAN SMALL CAP FUNDS 91

N O T E S T O F I N A N C I A L S T A T E M E N T SAS OF JUNE 30 , 2 020 (con t inued )
4. Investment TransactionsDuring the year ended June 30, 2020, purchases and sales of investments (excluding short-term investments and transfers in-kind) were as follows(amounts in thousands):
Purchases(excluding U.S.Government)
Sales(excluding U.S.Government)
Small Cap Blend Fund $ 308,432 $ 185,410Small Cap Core Fund 408,471 429,241Small Cap Equity Fund 2,002,726 1,413,843Small Cap Growth Fund 2,053,845 1,604,817Small Cap Value Fund 518,784 887,719U.S. Small Company Fund 607,592 932,150
During the year ended June 30, 2020, there were no purchases or sales of U.S. Government securities.
5. Federal Income Tax MattersFor Federal income tax purposes, the estimated cost and unrealized appreciation (depreciation) in value of investments held at June 30, 2020 wereas follows (amounts in thousands):
AggregateCost
GrossUnrealized
Appreciation
GrossUnrealized
Depreciation
Net UnrealizedAppreciation
(Depreciation)
Small Cap Blend Fund $ 472,490 $ 80,544 $ 45,774 $ 34,770Small Cap Core Fund 371,438 43,505 39,400 4,105Small Cap Equity Fund 5,155,091 2,037,348 330,642 1,706,706Small Cap Growth Fund 3,404,804 1,063,769 177,555 886,214Small Cap Value Fund 1,067,144 134,315 170,273 (35,958)U.S. Small Company Fund 962,841 156,867 124,920 31,947
For the Funds, the difference between book and tax basis appreciation (depreciation) on investments is primarily attributed to wash sale lossdeferrals, investments in passive foreign investment companies (“PFICs”) and non-taxable dividends.
The tax character of distributions paid during the year ended June 30, 2020 was as follows (amounts in thousands):
OrdinaryIncome*
NetLong-Term
Capital Gains
TotalDistributions
Paid
Small Cap Blend Fund $ 1,416 $ 11,873 $ 13,289Small Cap Core Fund 3,466 16,618 20,084Small Cap Equity Fund 35,363 286,303 321,666Small Cap Growth Fund 7,006 166,240 173,246Small Cap Value Fund 14,435 69,340 83,775U.S. Small Company Fund 7,802 518 8,320
* Short-term gain distributions are treated as ordinary income for income tax purposes.
The tax character of distributions paid during the year ended June 30, 2019 was as follows (amounts in thousands):
OrdinaryIncome*
NetLong-Term
Capital Gains
TotalDistributions
Paid
Small Cap Blend Fund $ 8,571 $ 50,655 $ 59,226Small Cap Core Fund 6,092 18,104 24,196Small Cap Equity Fund 36,602 374,705 411,307Small Cap Growth Fund 53,918 194,078 247,996Small Cap Value Fund 27,972 191,083 219,055U.S. Small Company Fund 59,623 102,260 161,883
* Short-term gain distributions are treated as ordinary income for income tax purposes.
92 J.P. MORGAN SMALL CAP FUNDS JUNE 30, 2020

As of June 30, 2020, the estimated components of net assets (excluding paid-in-capital) on a tax basis were as follows (amounts in thousands):
CurrentDistributable
OrdinaryIncome
CurrentDistributable
Long-TermCapital Gain
(Tax Basis CapitalLoss Carryover)
UnrealizedAppreciation
(Depreciation)
Small Cap Blend Fund $ 1,533 $ 3,481 $ 34,770Small Cap Core Fund 1,782 (2,830) 4,105Small Cap Equity Fund 11,059 376 1,706,706Small Cap Growth Fund 13,604 153,370 886,214Small Cap Value Fund 328 (31,857) (35,958)U.S. Small Company Fund 2,145 (251) 31,947
For the Funds, the cumulative timing differences primarily consist of wash sale loss deferrals, investments in passive foreign investment companies(“PFICs”), non-taxable dividends, post-October capital loss deferrals and late year ordinary loss deferrals.
As of June 30, 2020, the following Funds had the following net capital loss carryforwards (amounts in thousands):
Capital Loss Carryforward
Short-Term Long-Term
Small Cap Core Fund $ 2,830 $ —Small Cap Value Fund 31,857 —U.S. Small Company Fund 251 —
Late year ordinary losses incurred after December 31 as well as net capital losses incurred after October 31 and within the taxable year are deemedto arise on the first business day of Funds’ next taxable year. For the year ended June 30, 2020, the following Funds deferred to July 1, 2020 lateyear ordinary losses and post-October capital losses of (amounts in thousands):
Net Capital LossesLate Year Ordinary
Loss DeferralShort-Term Long-Term
Small Cap Blend Fund $ 3,542 $ — $ —Small Cap Core Fund 20,567 5,235 —Small Cap Equity Fund 63,340 195,533 —Small Cap Growth Fund — — 5,268Small Cap Value Fund 26,943 — —U.S. Small Company Fund 15,756 — —
6. BorrowingsThe Funds rely upon an exemptive order granted by the SEC (the “Order”) permitting the establishment and operation of an Interfund LendingFacility (the “Facility”). The Facility allows the Funds to directly lend and borrow money to or from any other fund relying upon the Order at ratesbeneficial to both the borrowing and lending funds. Advances under the Facility are taken primarily for temporary or emergency purposes, includingthe meeting of redemption requests that otherwise might require the untimely disposition of securities, and are subject to each Fund’s borrowingrestrictions. The Interfund loan rate is determined, as specified in the Order, by averaging the current repurchase agreement rate and the currentbank loan rate. The Order was granted to JPM II and may be relied upon by the Funds because the Funds and the series of JPM II are all investmentcompanies in the same “group of investment companies” (as defined in Section 12(d)(1)(G) of the 1940 Act).
The Funds had no borrowings outstanding from another fund at June 30, 2020. Average borrowings from the Facility during the year endedJune 30, 2020 were as follows (amounts in thousands, except number of days outstanding):
AverageBorrowings
AverageInterest
Rate Paid
Number ofDays
OutstandingInterest
Paid
U.S. Small Company Fund $2,818 0.79% 3 $—(a)
(a) Amount rounds to less than one thousand.
The Trusts and JPMCB have entered into a financing arrangement. Under this arrangement, JPMCB provides an unsecured, uncommitted creditfacility in the aggregate amount of $100 million to certain of the J.P. Morgan Funds, including the Funds. Advances under the arrangement are takenprimarily for temporary or emergency purposes, including the meeting of redemption requests that otherwise might require the untimely dis-position of securities, and are subject to each Fund’s borrowing restrictions. Interest on borrowings is payable at a rate determined by JPMCB at thetime of borrowing. This agreement has been extended until November 2, 2020.
JUNE 30, 2020 J.P. MORGAN SMALL CAP FUNDS 93

N O T E S T O F I N A N C I A L S T A T E M E N T SAS OF JUNE 30 , 2 020 (con t inued )
The Funds had no borrowings outstanding from the unsecured, uncommitted credit facility during the year ended June 30, 2020.
The Trusts, along with certain other trusts for J.P. Morgan Funds (“Borrowers”), have entered into a joint syndicated senior unsecured revolvingcredit facility totaling $1.5 billion (“Credit Facility”) with various lenders and The Bank of New York Mellon, as administrative agent for the lenders.This Credit Facility provides a source of funds to the Borrowers for temporary and emergency purposes, including the meeting of redemptionrequests that otherwise might require the untimely disposition of securities. Under the terms of the Credit Facility, a borrowing fund must have aminimum of $25,000,000 in adjusted net asset value and not exceed certain adjusted net asset coverage ratios prior to and during the time in whichany borrowings are outstanding. If a fund does not comply with the aforementioned requirements, the fund must remediate within three businessdays with respect to the $25,000,000 minimum adjusted net asset value or within one business day with respect to certain asset coverage ratios orthe administrative agent at the request of, or with the consent of, the lenders may terminate the Credit Facility and declare any outstanding borrow-ings to be due and payable immediately.
Interest associated with any borrowing under the Credit Facility is charged to the borrowing fund at a rate of interest equal to 1.00%, which hasincreased to 1.25% pursuant to the amendment referenced below, plus the greater of the federal funds effective rate or one month London Inter-Bank Offered Rate (“LIBOR”). The annual commitment fee to maintain the Credit Facility is 0.15% and is incurred on the unused portion of the CreditFacility and is allocated to all participating funds pro rata based on their respective net assets. Effective August 11, 2020, this agreement has beenamended and restated for a term of 364 days, unless extended, and to include the change to the interest rate charged for borrowing from the CreditFacility to 1.25%, as noted above, and an upfront fee of 0.075% of the Credit Facility to be charged and paid by all participating funds of the CreditFacility.
The Funds did not utilize the Credit Facility during the year ended June 30, 2020.
7. Risks, Concentrations and IndemnificationsIn the normal course of business, the Funds enter into contracts that contain a variety of representations which provide general indemnifications.Each Fund’s maximum exposure under these arrangements is unknown. The amount of exposure would depend on future claims that may bebrought against each Fund. However, based on experience, the Funds expect the risk of loss to be remote.
As of June 30, 2020, the Funds had individual shareholder and/or non-affiliated omnibus accounts which owned more than 10% of the respectiveFund’s outstanding shares as follows:
Number ofindividual shareholderand/or Non-Affiliated
Omnibus Accounts % of the Fund
Small Cap Blend Fund 2 63.3%Small Cap Core Fund 2 54.1Small Cap Equity Fund 3 44.7Small Cap Growth Fund 1 17.1U.S. Small Company Fund 2 32.3
Significant shareholder transactions by these shareholders may impact the Funds’ performance and liquidity.
As of June 30, 2020, J.P. Morgan Investor Funds and JPMorgan SmartRetirement Funds, which are affiliated funds of funds, owned in the aggregate,shares representing more than 10% of the net assets of the following Fund as follows:
J.P. MorganInvestor
Funds
JPMorganSmartRetirement
Funds
Small Cap Value Fund 17.9% 18.8%
Because the Funds may invest a significant portion of their assets in real estate investment trusts (“REITs”), the Funds may be subject to certain riskssimilar to those associated with direct investments in real estate. REITs may be affected by changes in the value of their underlying properties andby defaults by tenants. REITs depend generally on their ability to generate cash flow to make distributions to shareholders, and certain REITs haveself-liquidation provisions by which mortgages held may be paid in full and distributions of capital returns may be made at any time.
Derivatives may be riskier than other types of investments because they may be more sensitive to changes in economic and market conditions andcould result in losses that significantly exceed the Funds’ original investment. Derivatives also expose the Funds to counterparty risk (the risk thatthe derivative counterparty will not fulfill its contractual obligations), including credit risk of the derivative counterparty. The possible lack of a liquidsecondary market for derivatives and the resulting inability of the Funds to sell or otherwise close a derivatives position could expose the Funds tolosses.
LIBOR is intended to represent the rate at which contributing banks may obtain short-term borrowings from each other in the London interbankmarket. The regulatory authority that oversees financial services firms and financial markets in the U.K. has announced that, after the end of 2021, itwould no longer persuade or compel contributing banks to make rate submissions for purposes of determining the LIBOR rate. As a result, it is
94 J.P. MORGAN SMALL CAP FUNDS JUNE 30, 2020

possible that commencing in 2022, LIBOR may no longer be available or no longer deemed an appropriate reference rate upon which to determinethe interest rate on or impacting certain loans, notes, derivatives and other instruments or investments comprising some or all of a Fund’s portfolio.In light of this eventuality, public and private sector industry initiatives are currently underway to identify new or alternative reference rates to beused in place of LIBOR. There is no assurance that the composition or characteristics of any such alternative reference rate will be similar to orproduce the same value or economic equivalence as LIBOR or that it will have the same volume or liquidity as did LIBOR prior to its discontinuanceor unavailability, which may affect the value or liquidity or return on certain investments of a Fund and result in costs incurred in connection withclosing out positions and entering into new trades. These risks may also apply with respect to changes in connection with other interbank offeringrates (e.g., Euribor) and a wide range of other index levels, rates and values that are treated as “benchmarks” and are the subject of recent regu-latory reform.
The Funds are subject to infectious disease epidemics/pandemics risk. Recently, the worldwide outbreak of COVID-19, a novel coronavirus disease,has negatively affected economies, markets and individual companies throughout the world. The effects of this COVID-19 pandemic to public health,and business and market conditions, including exchange trading suspensions and closures may continue to have a significant negative impact on theperformance of a Fund’s investments, increase a Fund’s volatility, negatively impact a Fund’s arbitrage and pricing mechanisms, exacerbate otherpre-existing political, social and economic risks to the Funds and negatively impact broad segments of businesses and populations. The Funds’ oper-ations may be interrupted as a result, which may have a significant negative impact on investment performance. In addition, governments, theirregulatory agencies, or self-regulatory organizations may take actions in response to the pandemic that affect the instruments in which the Fundsinvest, or the issuers of such instruments, in ways that could also have a significant negative impact on a Fund’s investment performance. The fullimpact of this COVID-19 pandemic, or other future epidemics/pandemics, is currently unknown.
8. Subscription in-kindOn April 3, 2019, certain shareholders purchased Class R6 Shares of U.S. Small Company Fund. The portfolio securities were received primarily bymeans of a subscription in-kind in exchange for shares of the Fund. Portfolio securities were transferred as detailed below (amounts in thousands):
Value Type
$13,799 Subscription in-kind
9. Subsequent EventsOn August 11, 2020, the contractual expense limitations for the share classes shown below of the Funds were extended until at least October 31,2021.
Small Cap Blend Fund: Class A, Class C, Class I & Class R6Small Cap Core Fund: Class A, Class C, Class I, Class R2, Class R3, Class R4, Class R5 & Class R6Small Cap Equity Fund: Class I, Class R2, Class R4 & Class R5Small Cap Growth Fund: Class A, Class C, Class I, Class R2, Class R3, Class R4, Class R5 & Class R6Small Cap Value Fund: Class C, Class I, Class R2, Class R3 & Class R4
JUNE 30, 2020 J.P. MORGAN SMALL CAP FUNDS 95

R E P O R T O F I N D E P E N D E N T R E G I S T E R E D P U B L I C A C C O U N T I N G F I R M
To the Board of Trustees of JPMorgan Trust I and JPMorgan Trust II and Shareholders of JPMorgan Small Cap Blend Fund, JPMorganSmall Cap Core Fund, JPMorgan Small Cap Equity Fund, JPMorgan Small Cap Growth Fund, JPMorgan Small Cap Value Fund andJPMorgan U.S. Small Company Fund
Opinions on the Financial StatementsWe have audited the accompanying statements of assets and liabilities, including the schedules of portfolio investments, of JPMorganSmall Cap Blend Fund, JPMorgan Small Cap Core Fund, JPMorgan Small Cap Equity Fund and JPMorgan U.S. Small Company Fund(four of the funds constituting JPMorgan Trust I) and JPMorgan Small Cap Growth Fund and JPMorgan Small Cap Value Fund (two ofthe funds constituting JPMorgan Trust II) (hereafter collectively referred to as the “Funds”) as of June 30, 2020, the relatedstatements of operations for the year ended June 30, 2020, the statements of changes in net assets for each of the two years in theperiod ended June 30, 2020, including the related notes, and the financial highlights for each of the periods indicated therein(collectively referred to as the “financial statements”). In our opinion, the financial statements present fairly, in all material respects,the financial position of each of the Funds as of June 30, 2020, the results of each of their operations for the year then ended, thechanges in each of their net assets for each of the two years in the period ended June 30, 2020 and each of the financial highlightsfor each of the periods indicated therein in conformity with accounting principles generally accepted in the United States of America.
Basis for OpinionsThese financial statements are the responsibility of the Funds’ management. Our responsibility is to express an opinion on the Funds’financial statements based on our audits. We are a public accounting firm registered with the Public Company Accounting OversightBoard (United States) (PCAOB) and are required to be independent with respect to the Funds in accordance with the U.S. federalsecurities laws and the applicable rules and regulations of the Securities and Exchange Commission and the PCAOB.
We conducted our audits of these financial statements in accordance with the standards of the PCAOB. Those standards require thatwe plan and perform the audit to obtain reasonable assurance about whether the financial statements are free of materialmisstatement, whether due to error or fraud.
Our audits included performing procedures to assess the risks of material misstatement of the financial statements, whether due toerror or fraud, and performing procedures that respond to those risks. Such procedures included examining, on a test basis, evidenceregarding the amounts and disclosures in the financial statements. Our audits also included evaluating the accounting principles usedand significant estimates made by management, as well as evaluating the overall presentation of the financial statements. Ourprocedures included confirmation of securities owned as of June 30, 2020 by correspondence with the custodian, transfer agent andbrokers; when replies were not received from brokers, we performed other auditing procedures. We believe that our audits provide areasonable basis for our opinions.
/s/ PricewaterhouseCoopers LLPNew York, New YorkAugust 24, 2020
We have served as the auditor of one or more investment companies in the JPMorgan Funds complex since 1993.
96 J.P. MORGAN SMALL CAP FUNDS JUNE 30, 2020

T R U S T E E S(Unaud i ted )
The Funds’ Statement of Additional Information includes additional information about the Funds’ Trustees and is available, withoutcharge, upon request by calling 1-800-480-4111 or on the J.P. Morgan Funds’ website at www.jpmorganfunds.com.
Name (Year of Birth);Positions Withthe Funds (1)
Principal OccupationDuring Past 5 Years
Number ofFunds in FundComplex Overseenby Trustee (2)
Other Directorships HeldDuring the Past 5 Years
Independent Trustees
John F. Finn (1947); Chairmansince 2020; Trustee of Trustssince 2005; Trustee ofheritage One Group MutualFunds since 1998.
Chairman, Gardner, Inc. (supply chainmanagement company serving industrial andconsumer markets) (serving in various roles1974-present).
126 Director, Greif, Inc. (GEF) (industrialpackage products and services)(2007-present); Trustee, ColumbusAssociation for the Performing Arts(1988-present); Director, CardinalHealth, Inc. (CAH) (1994-2014).
Stephen P. Fisher (1959);Trustee of Trusts since 2018.
Retired; Chairman and Chief Executive Officer,NYLIFE Distributors LLC (registered broker-dealer) (serving in various roles 2008-2013);Chairman, NYLIM Service Company LLC(transfer agent) (2008-2017); New York LifeInvestment Management LLC (registeredinvestment adviser) (serving in various roles2005-2017); Chairman, IndexIQ Advisors LLC(registered investment adviser for ETFs)(2014-2017); President, MainStay VP FundsTrust (2007-2017), MainStay DefinedTermMunicipal Opportunities Fund (2011-2017) andMainStay Funds Trust (2007-2017) (registeredinvestment companies).
126 Honors Program Advisory BoardMember, The Zicklin School ofBusiness, Baruch College, The CityUniversity of New York (2017-present).
Kathleen M. Gallagher (1958);Trustee of the Trustssince 2018.
Retired; Chief Investment Officer — BenefitPlans, Ford Motor Company (serving in variousroles 1985-2016).
126 Non-Executive Director, Legal &General Investment Management(Holdings) (2018-present); Non-Executive Director, Legal & GeneralInvestment Management America(financial services and insurance)(2017-present); Advisory BoardMember, Fiduciary Solutions, StateStreet Global Advisors (2017-present);Member, Client Advisory Council,Financial Engines, LLC (registeredinvestment adviser) (2011-2016);Director, Ford Pension FundsInvestment Management Ltd.(2007-2016).
Dennis P. Harrington* (1950);Trustee of Trusts since 2017.
Retired; Partner, Deloitte LLP (accounting firm)(serving in various roles 1984-2012).
126 None
Frankie D. Hughes (1952);Trustee of Trusts since 2008.
President, Ashland Hughes Properties (propertymanagement) (2014-present); President andChief Investment Officer, Hughes CapitalManagement, Inc. (fixed income assetmanagement) (1993-2014).
126 None
JUNE 30, 2020 J.P. MORGAN SMALL CAP FUNDS 97

T R U S T E E S(Unaud i ted ) ( con t inued )
Name (Year of Birth);Positions Withthe Funds (1)
Principal OccupationDuring Past 5 Years
Number ofFunds in FundComplex Overseenby Trustee (2)
Other Directorships HeldDuring the Past 5 Years
Independent Trustees (continued)
Raymond Kanner** (1953);Trustee of Trusts since 2017.
Retired; Managing Director & Chief InvestmentOfficer, IBM Retirement Funds (2007-2016).
126 Advisory Board Member, PensoAdvisors LLC (2020-present); AdvisoryBoard Member, Los Angeles Capital(2018-present); Advisory BoardMember, State Street Global AdvisorsFiduciary Solutions Board (2017-present); Acting Executive Director,Committee on Investment of EmployeeBenefit Assets (CIEBA) (2016-2017);Advisory Board Member, Bettermentfor Business (robo advisor) (2016-2017); Advisory Board Member,BlueStar Indexes (index creator)(2013-2017); Director, EmergingMarkets Growth Fund (registeredinvestment company) (1997-2016);Member, Russell Index Client AdvisoryBoard (2001-2015).
Peter C. Marshall (1942);Trustee of Trusts since 2005;Trustee of heritage One GroupMutual Funds since 1985.
Self-employed business consultant(2002-present).
126 None
Mary E. Martinez (1960);Trustee of Trusts since 2013.
Associate, Special Properties, a Christie’sInternational Real Estate Affiliate(2010-present); Managing Director, Bank ofAmerica (Asset Management) (2007-2008);Chief Operating Officer, U.S. Trust AssetManagement, U.S. Trust Company (assetmanagement) (2003-2007); President, ExcelsiorFunds (registered investment companies)(2004-2005).
126 None
Marilyn McCoy (1948); Trusteeof Trusts since 2005; Trusteeof heritage One Group MutualFunds since 1999.
Vice President of Administration and Planning,Northwestern University (1985-present).
126 None
Mitchell M. Merin (1953);Trustee of Trusts since 2013.
Retired; President and Chief Operating Officer,Morgan Stanley Investment Management,Member Morgan Stanley & Co. ManagementCommittee (serving in various roles 1981-2006).
126 Director, Sun Life Financial (SLF)(financial services and insurance)(2007-2013).
Dr. Robert A. Oden, Jr. (1946);Trustee of Trusts since 2005;Trustee of heritage One GroupMutual Funds since 1997.
Retired; President, Carleton College(2002-2010); President, Kenyon College(1995-2002).
126 Trustee and Vice Chair, Trout Unlimited(2017-present); Trustee, AmericanMuseum of Fly Fishing (2013-present);Vice Chair, Dartmouth-HitchcockMedical Center (2011-present); Trustee,American University in Cairo (1999-2014).
Marian U. Pardo*** (1946);Trustee of Trusts since 2013.
Managing Director and Founder, Virtual CapitalManagement LLC (investment consulting)(2007-present); Managing Director, CreditSuisse Asset Management (portfolio manager)(2003-2006).
126 President and Member, Board ofGovernors, Columbus CitizensFoundation (not-for-profit supportingphilanthropic and cultural programs)(2006-present).
98 J.P. MORGAN SMALL CAP FUNDS JUNE 30, 2020
(1) The Trustees serve for an indefinite term, subject to the Trusts’ current retirement policy, which is age 78 for all Trustees.
(2) A Fund Complex means two or more registered investment companies that hold themselves out to investors as related companies for pur-poses of investment and investor services or have a common investment adviser or have an investment adviser that is an affiliated person ofthe investment adviser of any of the other registered investment companies. The J.P. Morgan Funds Complex for which the Boards of Trusteesserve currently includes ten registered investment companies (126 funds).
* Two family members of Mr. Harrington are partner and managing director, respectively, of the Funds’ independent registered public account-ing firm. Such firm has represented to the Boards that those family members are not involved in the audit of the Funds’ financial statementsand do not provide other services to the Funds. The Boards have concluded that such association does not interfere with Mr. Harrington’sexercise of independent judgment as an Independent Trustee.
** A family member of Mr. Kanner is employed by JPMorgan Chase Bank, which is affiliated with JPMIM and JPMDS. In that capacity, thisemployee provides services to various JPMorgan affiliates including JPMIM and JPMDS and for which JPMIM and JPMDS bear some portion ofthe expense thereof.
*** In connection with prior employment with JPMorgan Chase, Ms. Pardo was the recipient of non-qualified pension plan payments fromJPMorgan Chase in the amount of approximately $2,055 per month, which she irrevocably waived effective January 1, 2013, and deferredcompensation payments from JPMorgan Chase in the amount of approximately $7,294 per year, which ended in January 2013. In addition,Ms. Pardo receives payments from a fully-funded qualified plan, which is not an obligation of JPMorgan Chase.
The contact address for each of the Trustees is 277 Park Avenue, New York, NY 10172.
JUNE 30, 2020 J.P. MORGAN SMALL CAP FUNDS 99

O F F I C E R S(Unaud i ted )
Name (Year of Birth),Positions Held withthe Trusts (Since) Principal Occupations During Past 5 Years
Brian S. Shlissel (1964),President and Principal ExecutiveOfficer (2016)
Managing Director and Chief Administrative Officer for J.P. Morgan pooled vehicles, J.P. Morgan InvestmentManagement Inc. (formerly JPMorgan Funds Management, Inc.) (from 2014 to present); Managing Directorand Head of Mutual Fund Services, Allianz Global Investors; President and Chief Executive Officer, AllianzGlobal Investors Mutual Funds and PIMCO Closed-End Funds (from 1999 to 2014).
Timothy J. Clemens (1975),Treasurer and Principal FinancialOfficer (2018)*
Executive Director, J.P. Morgan Investment Management Inc. (formerly JPMorgan Funds Management, Inc.)since February 2016; Vice President, JPMorgan Funds Management, Inc. from October 2013 to January 2016.
Gregory S. Samuels (1980),Secretary (2019) (formerly AssistantSecretary since 2010)*
Executive Director and Assistant General Counsel, JPMorgan Chase since February 2014; formerly VicePresident and Assistant General Counsel, JPMorgan Chase from 2010 to February 2014.
Stephen M. Ungerman (1953),Chief Compliance Officer (2005)
Managing Director, JPMorgan Chase & Co.; Mr. Ungerman has been with JPMorgan Chase & Co. since 2000.
Elizabeth A. Davin (1964),Assistant Secretary (2005)**
Executive Director and Assistant General Counsel, JPMorgan Chase since February 2012; formerly VicePresident and Assistant General Counsel, JPMorgan Chase from 2005 to February 2012; Senior Counsel,JPMorgan Chase (formerly Bank One Corporation) from 2004 to 2005.
Jessica K. Ditullio (1962),Assistant Secretary (2005)**
Executive Director and Assistant General Counsel, JPMorgan Chase. Ms. Ditullio has been with JPMorganChase (formerly Bank One Corporation) since 1990.
Anthony Geron (1971),Assistant Secretary (2018)*
Vice President and Assistant General Counsel, JPMorgan Chase since September 2018; Lead Director andCounsel, AXA Equitable Life Insurance Company from 2015 to 2018 and Senior Director and Counsel, AXAEquitable Life Insurance Company from 2014 to 2015.
Carmine Lekstutis (1980),Assistant Secretary (2011)*
Executive Director and Assistant General Counsel, JPMorgan Chase since February 2015; formerly VicePresident and Assistant General Counsel, JPMorgan Chase from 2011 to February 2015.
Keri E. Riemer (1976),Assistant Secretary (2019)*
Executive Director and Assistant General Counsel, JPMorgan Chase since February 2019; Counsel, Seward &Kissel LLP (law firm) (2016-2019); Associate, Seward & Kissel LLP (2011-2016).
Zachary E. Vonnegut-Gabovitch(1986),Assistant Secretary (2017)*
Vice President and Assistant General Counsel, JPMorgan Chase since September 2016; Associate, Morgan,Lewis & Bockius (law firm) from 2012 to 2016.
Michael M. D’Ambrosio (1969),Assistant Treasurer (2012)
Managing Director, J.P. Morgan Investment Management Inc. (formerly JPMorgan Funds Management, Inc.)since May 2014; formerly Executive Director, JPMorgan Funds Management, Inc. from 2012 to May 2014.
Aleksandr Fleytekh (1972),Assistant Treasurer (2019)*
Vice President, J.P. Morgan Investment Management Inc. (formerly JPMorgan Funds Management, Inc.) sinceFebruary 2012.
Shannon Gaines (1977),Assistant Treasurer (2018)**
Vice President, J.P. Morgan Investment Management Inc. (formerly JPMorgan Funds Management, Inc.) sinceJanuary 2014.
Jeffrey D. House (1972),Assistant Treasurer (2017)**
Vice President, J.P. Morgan Investment Management Inc. (formerly JPMorgan Funds Management, Inc.) sinceJuly 2006.
Lauren A. Paino (1973),Assistant Treasurer (2014)*
Executive Director, J.P. Morgan Investment Management Inc. (formerly JPMorgan Funds Management, Inc.)since August 2013.
Joseph Parascondola (1963),Assistant Treasurer (2011)*
Executive Director, J.P. Morgan Investment Management, Inc. since February 2020, formerly Vice President,J.P. Morgan Investment Management Inc. (formerly JPMorgan Funds Management, Inc.) from August 2006to January 2020.
Gillian I. Sands (1969),Assistant Treasurer (2012)*
Vice President, J.P. Morgan Investment Management Inc. (formerly JPMorgan Funds Management, Inc.) sinceSeptember 2012.
The contact address for each of the officers, unless otherwise noted, is 277 Park Avenue, New York, NY 10172.
* The contact address for the officer is 4 New York Plaza, New York, NY 10004.
** The contact address for the officer is 1111 Polaris Parkway, Columbus, OH 43240.
100 J.P. MORGAN SMALL CAP FUNDS JUNE 30, 2020

S C H E D U L E O F S H A R E H O L D E R E X P E N S E S(Unaud i ted )Hypothetical $1,000 Investment
As a shareholder of the Funds, you incur two types of costs:(1) transaction costs, including sales charges (loads) on purchasepayments and (2) ongoing costs, including investment advisoryfees, administration fees, distribution fees and other Fundexpenses. The examples below are intended to help you under-stand your ongoing costs (in dollars) of investing in the Fundsand to compare these ongoing costs with the ongoing costs ofinvesting in other mutual funds. The examples assume that youhad a $1,000 investment in each Class at the beginning of thereporting period, January 1, 2020, and continued to hold yourshares at the end of the reporting period, June 30, 2020.
Actual ExpensesFor each Class of each Fund in the table below, the first lineprovides information about actual account values and actualexpenses. You may use the information in this line, togetherwith the amount you invested, to estimate the expenses thatyou paid over the period. Simply divide your account value by$1,000 (for example, an $8,600 account value divided by$1,000 = 8.6), then multiply the result by the number in thefirst line of each Class under the heading titled “Expenses PaidDuring the Period” to estimate the expenses you paid on youraccount during this period.
Hypothetical Example for Comparison PurposesThe second line of each Class in the table below providesinformation about hypothetical account values and hypotheticalexpenses based on the Class’ actual expense ratio and anassumed rate of return of 5% per year before expenses, whichis not the Class’ actual return. The hypothetical account valuesand expenses may not be used to estimate the actual endingaccount balance or expenses you paid for the period. You mayuse this information to compare the ongoing costs of investingin the Class of each Fund and other funds. To do so, comparethis 5% hypothetical example with the 5% hypothetical exam-ples that appear in the shareholder reports of the other funds.Please note that the expenses shown in the table are meant tohighlight your ongoing costs only and do not reflect any trans-action costs, such as sales charges (loads) or redemption fees.Therefore, the second line for each Class in the table is usefulin comparing ongoing costs only, and will not help youdetermine the relative total costs of owning different funds. Inaddition, if these transaction costs were included, your costswould have been higher. The examples also assume all divi-dends and distributions have been reinvested.
BeginningAccount Value
January 1, 2020
EndingAccount ValueJune 30, 2020
ExpensesPaid Duringthe Period*
AnnualizedExpense
Ratio
JPMorgan Small Cap Blend FundClass A
Actual $1,000.00 $ 922.70 $5.93 1.24%Hypothetical 1,000.00 1,018.70 6.22 1.24
Class CActual 1,000.00 920.00 8.31 1.74Hypothetical 1,000.00 1,016.21 8.72 1.74
Class IActual 1,000.00 923.60 4.73 0.99Hypothetical 1,000.00 1,019.94 4.97 0.99
Class R6Actual 1,000.00 924.60 3.54 0.74Hypothetical 1,000.00 1,021.18 3.72 0.74
JPMorgan Small Cap Core FundClass A
Actual 1,000.00 820.70 5.61 1.24Hypothetical 1,000.00 1,018.70 6.22 1.24
Class CActual 1,000.00 818.70 7.87 1.74Hypothetical 1,000.00 1,016.21 8.72 1.74
Class IActual 1,000.00 821.70 4.48 0.99Hypothetical 1,000.00 1,019.94 4.97 0.99
Class R2Actual 1,000.00 819.60 6.74 1.49Hypothetical 1,000.00 1,017.45 7.47 1.49
Class R3Actual 1,000.00 820.80 5.61 1.24Hypothetical 1,000.00 1,018.70 6.22 1.24
JUNE 30, 2020 J.P. MORGAN SMALL CAP FUNDS 101

S C H E D U L E O F S H A R E H O L D E R E X P E N S E S(Unaud i ted ) ( con t inued )Hypothetical $1,000 Investment
BeginningAccount Value
January 1, 2020
EndingAccount ValueJune 30, 2020
ExpensesPaid Duringthe Period*
AnnualizedExpense
Ratio
JPMorgan Small Cap Core Fund (continued)Class R4
Actual $1,000.00 $ 821.80 $4.48 0.99%Hypothetical 1,000.00 1,019.94 4.97 0.99
Class R5Actual 1,000.00 822.40 3.62 0.80Hypothetical 1,000.00 1,020.89 4.02 0.80
Class R6Actual 1,000.00 822.80 3.35 0.74Hypothetical 1,000.00 1,021.18 3.72 0.74
JPMorgan Small Cap Equity FundClass A
Actual 1,000.00 895.70 6.03 1.28Hypothetical 1,000.00 1,018.50 6.42 1.28
Class CActual 1,000.00 893.90 8.19 1.74Hypothetical 1,000.00 1,016.21 8.72 1.74
Class IActual 1,000.00 897.10 4.62 0.98Hypothetical 1,000.00 1,019.99 4.92 0.98
Class R2Actual 1,000.00 894.90 7.02 1.49Hypothetical 1,000.00 1,017.45 7.47 1.49
Class R3Actual 1,000.00 896.00 5.80 1.23Hypothetical 1,000.00 1,018.75 6.17 1.23
Class R4Actual 1,000.00 897.10 4.62 0.98Hypothetical 1,000.00 1,019.99 4.92 0.98
Class R5Actual 1,000.00 897.90 3.78 0.80Hypothetical 1,000.00 1,020.89 4.02 0.80
Class R6Actual 1,000.00 898.10 3.49 0.74Hypothetical 1,000.00 1,021.18 3.72 0.74
JPMorgan Small Cap Growth FundClass A
Actual 1,000.00 1,080.30 6.41 1.24Hypothetical 1,000.00 1,018.70 6.22 1.24
Class CActual 1,000.00 1,077.40 8.99 1.74Hypothetical 1,000.00 1,016.21 8.72 1.74
Class IActual 1,000.00 1,081.90 5.12 0.99Hypothetical 1,000.00 1,019.94 4.97 0.99
Class LActual 1,000.00 1,082.40 4.35 0.84Hypothetical 1,000.00 1,020.69 4.22 0.84
Class R2Actual 1,000.00 1,079.20 7.70 1.49Hypothetical 1,000.00 1,017.45 7.47 1.49
Class R3Actual 1,000.00 1,079.90 6.41 1.24Hypothetical 1,000.00 1,018.70 6.22 1.24
102 J.P. MORGAN SMALL CAP FUNDS JUNE 30, 2020

BeginningAccount Value
January 1, 2020
EndingAccount ValueJune 30, 2020
ExpensesPaid Duringthe Period*
AnnualizedExpense
Ratio
JPMorgan Small Cap Growth Fund (continued)Class R4
Actual $1,000.00 $1,081.60 $5.12 0.99%Hypothetical 1,000.00 1,019.94 4.97 0.99
Class R5Actual 1,000.00 1,082.30 4.35 0.84Hypothetical 1,000.00 1,020.69 4.22 0.84
Class R6Actual 1,000.00 1,082.90 3.83 0.74Hypothetical 1,000.00 1,021.18 3.72 0.74
JPMorgan Small Cap Value FundClass A
Actual 1,000.00 777.70 5.57 1.26Hypothetical 1,000.00 1,018.60 6.32 1.26
Class CActual 1,000.00 776.10 7.68 1.74Hypothetical 1,000.00 1,016.21 8.72 1.74
Class IActual 1,000.00 779.20 4.38 0.99Hypothetical 1,000.00 1,019.94 4.97 0.99
Class R2Actual 1,000.00 777.20 6.58 1.49Hypothetical 1,000.00 1,017.45 7.47 1.49
Class R3Actual 1,000.00 778.00 5.48 1.24Hypothetical 1,000.00 1,018.70 6.22 1.24
Class R4Actual 1,000.00 779.20 4.38 0.99Hypothetical 1,000.00 1,019.94 4.97 0.99
Class R5Actual 1,000.00 779.40 3.80 0.86Hypothetical 1,000.00 1,020.59 4.32 0.86
Class R6Actual 1,000.00 779.80 3.36 0.76Hypothetical 1,000.00 1,021.08 3.82 0.76
JPMorgan U.S. Small Company FundClass A
Actual 1,000.00 855.30 5.63 1.22Hypothetical 1,000.00 1,018.80 6.12 1.22
Class CActual 1,000.00 853.30 7.97 1.73Hypothetical 1,000.00 1,016.26 8.67 1.73
Class IActual 1,000.00 856.70 4.43 0.96Hypothetical 1,000.00 1,020.09 4.82 0.96
Class LActual 1,000.00 857.10 3.74 0.81Hypothetical 1,000.00 1,020.84 4.07 0.81
Class R2Actual 1,000.00 854.30 6.73 1.46Hypothetical 1,000.00 1,017.60 7.32 1.46
Class R3Actual 1,000.00 855.50 5.58 1.21Hypothetical 1,000.00 1,018.85 6.07 1.21
JUNE 30, 2020 J.P. MORGAN SMALL CAP FUNDS 103

S C H E D U L E O F S H A R E H O L D E R E X P E N S E S(Unaud i ted ) ( con t inued )Hypothetical $1,000 Investment
BeginningAccount Value
January 1, 2020
EndingAccount ValueJune 30, 2020
ExpensesPaid Duringthe Period*
AnnualizedExpense
Ratio
JPMorgan U.S. Small Company Fund (continued)Class R4
Actual $1,000.00 $ 856.50 $4.43 0.96%Hypothetical 1,000.00 1,020.09 4.82 0.96
Class R5Actual 1,000.00 857.30 3.69 0.80Hypothetical 1,000.00 1,020.89 4.02 0.80
Class R6Actual 1,000.00 858.20 3.28 0.71Hypothetical 1,000.00 1,021.33 3.57 0.71
* Expenses are equal to each Class’ respective annualized expense ratio, multiplied by the average account value over the period, multiplied by182/366 (to reflect the one-half year period).
104 J.P. MORGAN SMALL CAP FUNDS JUNE 30, 2020

L I Q U I D I T Y R I S K M A N A G E M E N T P R O G R A M(Unaud i ted )
Each of the Funds has adopted the J.P. Morgan Funds Liquidity RiskManagement Program (the “Program”) under Rule 22e-4 under the1940 Act (the “Liquidity Rule”). The Program seeks to assess, manageand review each Fund’s Liquidity Risk. “Liquidity Risk” is defined as therisk that a fund could not meet requests to redeem shares issued bythe fund without significant dilution of remaining investors’ interests inthe fund. Among other things, the Liquidity Rule requires that a writ-ten report be provided to the Boards of Trustees (the “Board”) on anannual basis that addresses the operation of the Program andassesses the adequacy and effectiveness of its implementation, includ-ing the operation of any Highly Liquidity Investment Minimum (“HLIM”)established for a Fund and any material changes to the Program.
The Board has appointed J.P. Morgan Asset Management’s LiquidityRisk Forum to be the program administrator for the Program (the“Program Administrator”). On February 11, 2020, the Board of Trust-ees reviewed the Program Administrator’s initial written report (the“Report”) concerning the operation of the Program for the period fromDecember 1, 2018 through December 31, 2019 (the “Program Report-ing Period”). The Report addressed the operation of the Program andassessed its adequacy and effectiveness of implementation, including,where applicable, the operation of a Fund’s HLIM. There were nomaterial changes to the Program during the Program ReportingPeriod.
The Report summarized the operation of the Program and theinformation and factors considered by the Program Administrator inassessing whether the Program has been adequately and effectivelyimplemented with respect to each Fund. Such information and factorsincluded, among other things: (1) the liquidity risk framework used toassess, manage, and periodically review each Fund’s Liquidity Risk andthe results of this assessment; (2) the methodology and inputs forclassifying each of the Fund’s investments into one of four liquiditycategories that reflect an estimate of their liquidity under currentmarket conditions; (3) whether a Fund invested primarily in “HighlyLiquid Investments” (as defined under the Liquidity Rule), whether anHLIM should be established for a Fund (and, for Funds that haveadopted an HLIM, whether the HLIM continues to be appropriate orwhether a Fund has invested below its HLIM) and the procedures formonitoring for this limit; (4) whether a Fund invested more than 15%of its assets in “Illiquid Investments” (as defined under the LiquidityRule) and the procedures for monitoring for this limit; and (5) specificliquidity events arising during the Program Reporting Period, includingthe impact on Fund liquidity caused by extended non-U.S. marketclosures.
Based on this review, the Report concluded that: (1) the Program con-tinues to be reasonably designed to effectively assess and manageeach Fund’s Liquidity Risk; and (2) the Program has been adequatelyand effectively implemented with respect to each Fund during theProgram Reporting Period.
JUNE 30, 2020 J.P. MORGAN SMALL CAP FUNDS 105

T A X L E T T E R(Unaud i ted )
Certain tax information for the J.P. Morgan Funds is required tobe provided to shareholders based upon the Funds’ income anddistributions for the taxable year ended June 30, 2020. Theinformation and distributions reported in this letter may differfrom the information and taxable distributions reported to theshareholders for the calendar year ending December 31, 2020.The information necessary to complete your income tax returnsfor the calendar year ending December 31, 2020 will be pro-vided under separate cover.
Dividends Received Deduction (DRD)Each Fund listed below had the following percentage, or maximumallowable percentage, of ordinary income distributions eligible for thedividends received deduction for corporate shareholders for the fiscalyear ended June 30, 2020:
DividendsReceived
Deduction
JPMorgan Small Cap Blend Fund 100.00%JPMorgan Small Cap Core Fund 100.00JPMorgan Small Cap Equity Fund 100.00JPMorgan Small Cap Growth Fund 100.00JPMorgan Small Cap Value Fund 100.00JPMorgan U.S. Small Company Fund 100.00
Long Term Capital GainEach Fund listed below distributed the following amount, ormaximum allowable amount, of long-term capital gain divi-dends for the fiscal year ended June 30, 2020 (amounts inthousands):
Long-TermCapital GainDistribution
JPMorgan Small Cap Blend Fund $ 11,889JPMorgan Small Cap Core Fund 16,618JPMorgan Small Cap Equity Fund 286,303JPMorgan Small Cap Growth Fund 191,811JPMorgan Small Cap Value Fund 69,340JPMorgan U.S. Small Company Fund 518
Qualified Dividend Income (QDI)Each Fund listed below had the following amount, or maximumallowable amount, of ordinary income distributions treated asqualified dividends for the fiscal year ended June 30, 2020(amounts in thousands):
QualifiedDividendIncome
JPMorgan Small Cap Blend Fund $ 1,416JPMorgan Small Cap Core Fund 3,466JPMorgan Small Cap Equity Fund 35,363JPMorgan Small Cap Growth Fund 7,006JPMorgan Small Cap Value Fund 14,435JPMorgan U.S. Small Company Fund 7,802
106 J.P. MORGAN SMALL CAP FUNDS JUNE 30, 2020

Rev. January 2011
FACTS WHAT DOES J.P. MORGAN FUNDS DO WITH YOUR PERSONAL INFORMATION?
Why? Financial companies choose how they share your personal information. Federal law givesconsumers the right to limit some but not all sharing. Federal law also requires us to tell you howwe collect, share, and protect your personal information. Please read this notice carefully tounderstand what we do.
What? The types of personal information we collect and share depend on the product or service you havewith us. This information can include:
▪ Social Security number and account balances
▪ transaction history and account transactions
▪ checking account information and wire transfer instructions
When you are no longer our customer, we continue to share your information as described in thisnotice.
How? All financial companies need to share customers’ personal information to run their everydaybusiness. In the section below, we list the reasons financial companies can share their customers’personal information; the reasons J.P. Morgan Funds chooses to share; and whether you can limitthis sharing.
Reasons we can share your personal information Does J.P. MorganFunds share?
Can you limit thissharing?
For our everyday business purposes —such as to process your transactions, maintain your account(s),respond to court orders and legal investigations, or report tocredit bureaus
Yes No
For marketing purposes —to offer our products and services to you
Yes No
For joint marketing with other financial companies No We don’t share
For our affiliates’ everyday business purposes —information about your transactions and experiences
No We don’t share
For our affiliates’ everyday business purposes —information about your creditworthiness
No We don’t share
For nonaffiliates to market to you No We don’t share
Questions? Call 1-800-480-4111 or go to www.jpmorganfunds.com

Page 2
Who we are
Who is providing this notice? J.P. Morgan Funds
What we do
How does J.P. Morgan Fundsprotect my personalinformation?
To protect your personal information from unauthorized access and use, we usesecurity measures that comply with federal law. These measures include computersafeguards and secured files and buildings. We authorize our employees to accessyour information only when they need it to do their work and we require companiesthat work for us to protect your information.
How does J.P. MorganFunds collect my personalinformation?
We collect your personal information, for example, when you:
▪ open an account or provide contact information
▪ give us your account information or pay us by check
▪ make a wire transfer
We also collect your personal information from others, such as credit bureaus,affiliates and other companies.
Why can’t I limit all sharing? Federal law gives you the right to limit only
▪ sharing for affiliates’ everyday business purposes – information about yourcreditworthiness
▪ affiliates from using your information to market to you
▪ sharing for nonaffiliates to market to you
State laws and individual companies may give you additional rights to limit sharing.
Definitions
Affiliates Companies related by common ownership or control. They can be financial andnonfinancial companies.
▪ J.P. Morgan Funds does not share with our affiliates.
Nonaffiliates Companies not related by common ownership or control. They can be financial andnonfinancial companies.
▪ J.P. Morgan Funds does not share with nonaffiliates so they can market to you.
Joint Marketing A formal agreement between nonaffiliated financial companies that together marketfinancial products or services to you.
▪ J.P. Morgan Funds doesn’t jointly market.

J.P. Morgan Funds are distributed by JPMorgan Distribution Services, Inc., which is an affiliate of JPMorgan Chase & Co. Affiliatesof JPMorgan Chase & Co. receive fees for providing various services to the funds.
Contact JPMorgan Distribution Services, Inc. at 1-800-480-4111 for a fund prospectus. You can also visit us atwww.jpmorganfunds.com. Investors should carefully consider the investment objectives and risk as well as charges andexpenses of the mutual fund before investing. The prospectus contains this and other information about the mutual fund.Read the prospectus carefully before investing.
Investors may obtain information about the Securities Investor Protection Corporation (SIPC), including the SIPC brochure, byvisiting www.sipc.org or by calling SIPC at 202-371-8300.
Each Fund files a complete schedule of its fund holdings for the first and third quarters of its fiscal year with the SEC as an exhibit to itsreport on Form N-PORT. The Funds’ Form N-PORT reports are available on the SEC’s website at http://www.sec.gov. Each Fund’squarterly holdings can be found by visiting the J.P. Morgan Funds’ website at www.jpmorganfunds.com.
A description of each Fund’s policies and procedures with respect to the disclosure of each Fund’s holdings is available in theprospectuses and Statement of Additional Information.
A copy of proxy policies and procedures is available without charge upon request by calling 1-800-480-4111 and on the Funds’website at www.jpmorganfunds.com. A description of such policies and procedures is on the SEC’s website at www.sec.gov. TheTrustees have delegated the authority to vote proxies for securities owned by the Funds to the Adviser. A copy of the Funds’voting record for the most recent 12-month period ended June 30 is available on the SEC’s website at www.sec.gov or at theFunds’ website at www.jpmorganfunds.com no later than August 31 of each year. The Funds’ proxy voting record will include,among other things, a brief description of the matter voted on for each fund security, and will state how each vote was cast, forexample, for or against the proposal.

Prefer electronic delivery? Sign up and you’ll receive an e-mail notification when your documents are available online. It’s secure, fast and convenient. Find out more information and enroll today at www.icsdelivery.com
*Option may not be available through all brokers or for all shareholders.
GET YOUR SHAREHOLDER DOCUMENTS ON LINE!
J.P. Morgan Asset Management is the brand name for the asset management business of JPMorgan Chase & Co. and itsaffiliates worldwide.
© JPMorgan Chase & Co., 2020. All rights reserved. June 2020. AN-SC-620