JP Morgan Securities Oil & Gas Conference Call Series Presentation
18
© 2013 Chevron U.S.A. Inc. All rights reserved. Shale/Tight Resources – Fueling Growth Bruce Niemeyer Vice President Appalachian/Michigan Strategic Business Unit June 27, 2013
Transcript of JP Morgan Securities Oil & Gas Conference Call Series Presentation
© 2013 Chevron U.S.A. Inc. All rights reserved.
Shale/Tight Resources – Fueling Growth
Bruce Niemeyer Vice President Appalachian/Michigan Strategic Business Unit
June 27, 2013
© 2013 Chevron U.S.A. Inc. All rights reserved.
Cautionary Statement
2
CAUTIONARY STATEMENTS RELEVANT TO FORWARD-LOOKING INFORMATION FOR THE PURPOSE OF “SAFE HARBOR” PROVISIONS OF THE PRIVATE SECURITIES LITIGATION REFORM ACT OF 1995
This presentation of Chevron Corporation contains forward-looking statements relating to Chevron’s operations that are based on management’s current expectations, estimates and projections about the petroleum, chemicals and other energy-related industries. Words such as “anticipates,” “expects,” “intends,” “plans,” “targets,” “forecasts,” “projects,” “believes,” “seeks,” “schedules,” “estimates,” “budgets,” “outlook” and similar expressions are intended to identify such forward-looking statements. These statements are not guarantees of future performance and are subject to certain risks, uncertainties and other factors, many of which are beyond the company’s control and are difficult to predict. Therefore, actual outcomes and results may differ materially from what is expressed or forecasted in such forward-looking statements. The reader should not place undue reliance on these forward-looking statements, which speak only as of the date of this presentation. Unless legally required, Chevron undertakes no obligation to update publicly any forward-looking statements, whether as a result of new information, future events or otherwise.
Among the important factors that could cause actual results to differ materially from those in the forward-looking statements are: changing crude oil and natural gas prices; changing refining, marketing and chemical margins; actions of competitors or regulators; timing of exploration expenses; timing of crude oil liftings; the competitiveness of alternate-energy sources or product substitutes; technological developments; the results of operations and financial condition of equity affiliates; the inability or failure of the company’s joint-venture partners to fund their share of operations and development activities; the potential failure to achieve expected net production from existing and future crude oil and natural gas development projects; potential delays in the development, construction or start-up of planned projects; the potential disruption or interruption of the company’s production or manufacturing facilities or delivery/transportation networks due to war, accidents, political events, civil unrest, severe weather or crude oil production quotas that might be imposed by the Organization of Petroleum Exporting Countries; the potential liability for remedial actions or assessments under existing or future environmental regulations and litigation; significant investment or product changes required by existing or future environmental statutes, regulations and litigation; the potential liability resulting from other pending or future litigation; the company’s future acquisition or disposition of assets and gains and losses from asset dispositions or impairments; government-mandated sales, divestitures, recapitalizations, industry-specific taxes, changes in fiscal terms or restrictions on scope of company operations; foreign currency movements compared with the U.S. dollar; the effects of changed accounting rules under generally accepted accounting principles promulgated by rule-setting bodies; and the factors set forth under the heading “Risk Factors” on pages 28 through 30 of the company’s 2012 Annual Report on Form 10-K. In addition, such results could be affected by general domestic and international economic and political conditions. Other unpredictable or unknown factors not discussed in this presentation could also have material adverse effects on forward-looking statements.
Certain terms, such as “unrisked resources,” “unrisked resource base,” “recoverable resources,” and “oil in place,” among others, may be used in this presentation to describe certain aspects of the company’s portfolio and oil and gas properties beyond the proved reserves. For definitions of, and further information regarding, these and other terms, see the “Glossary of Energy and Financial Terms” on pages 58 and 59 of the company’s 2012 Supplement to the Annual Report and available at Chevron.com.
As used in this report, the term “project” may describe new upstream development activity, including phases in a multiphase development, maintenance activities, certain existing assets, new investments in downstream and chemicals capacity, investment in emerging and sustainable energy activities, and certain other activities. All of these terms are used for convenience only and are not intended as a precise description of the term “project” as it relates to any specific government law or regulation.
© 2013 Chevron U.S.A. Inc. All rights reserved.
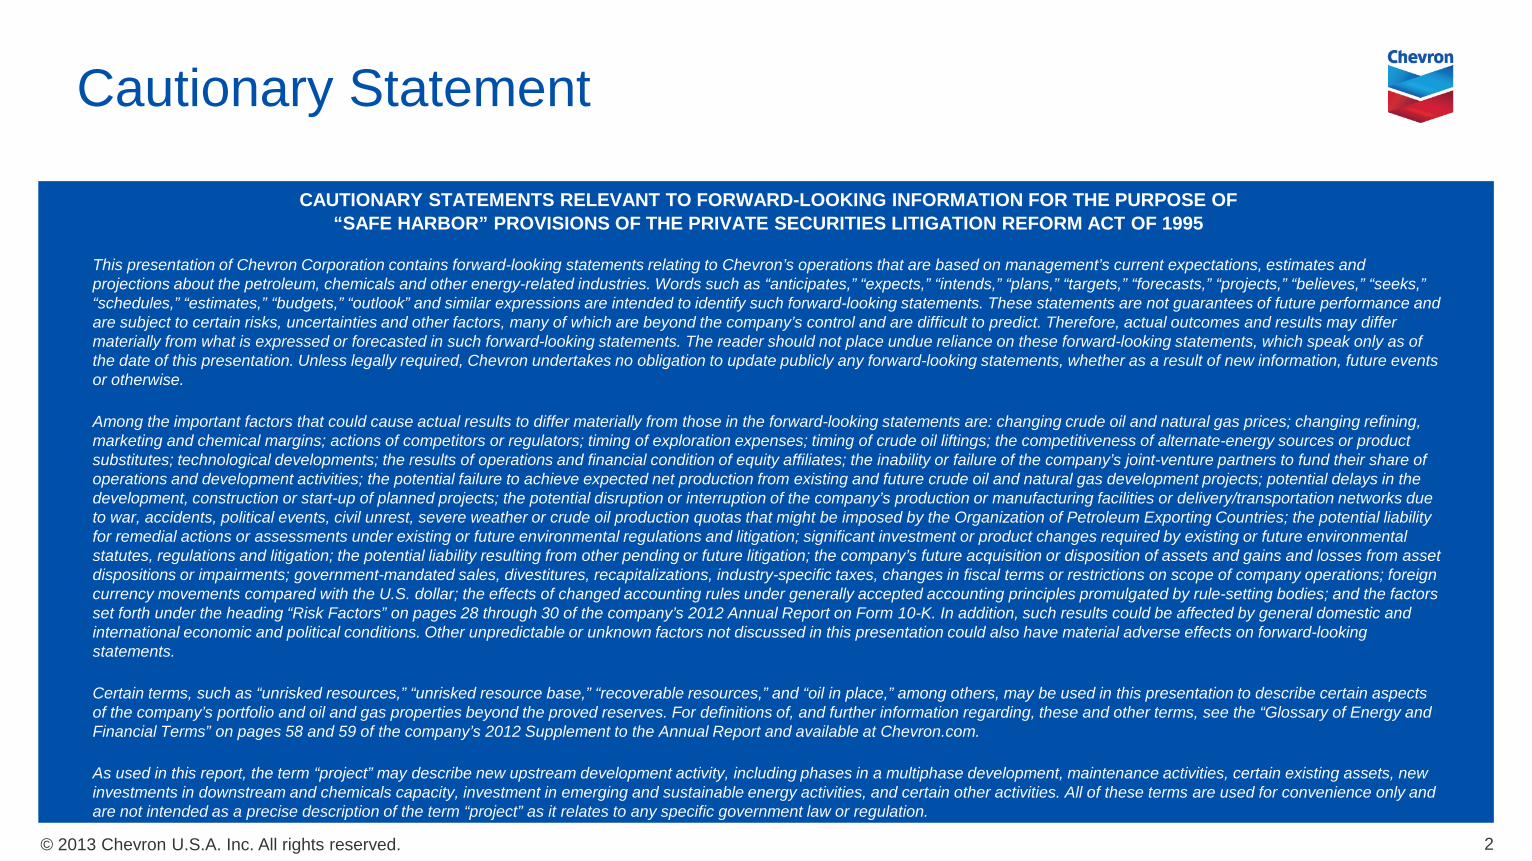
CVX Ranking Relative to Competitors 1 being the lowest rate
Competitor Range BP, RDS, XOM
Strong Safety Culture
3 Source: Data publicly available from annual company sustainability reports. XOM rates are Lost Time Incident Rates. RDS rates are Lost Time Incident Rates for injuries only.
Total Days Away From Work Rate
Do it safely or not at all.
There is always time to do it right.
0.00
0.05
0.10
0.15
0.20
2008 2009 2010 2011 2012
2 1 1
2
1
© 2013 Chevron U.S.A. Inc. All rights reserved.
What Is Shale?
4 4
© 2013 Chevron U.S.A. Inc. All rights reserved.
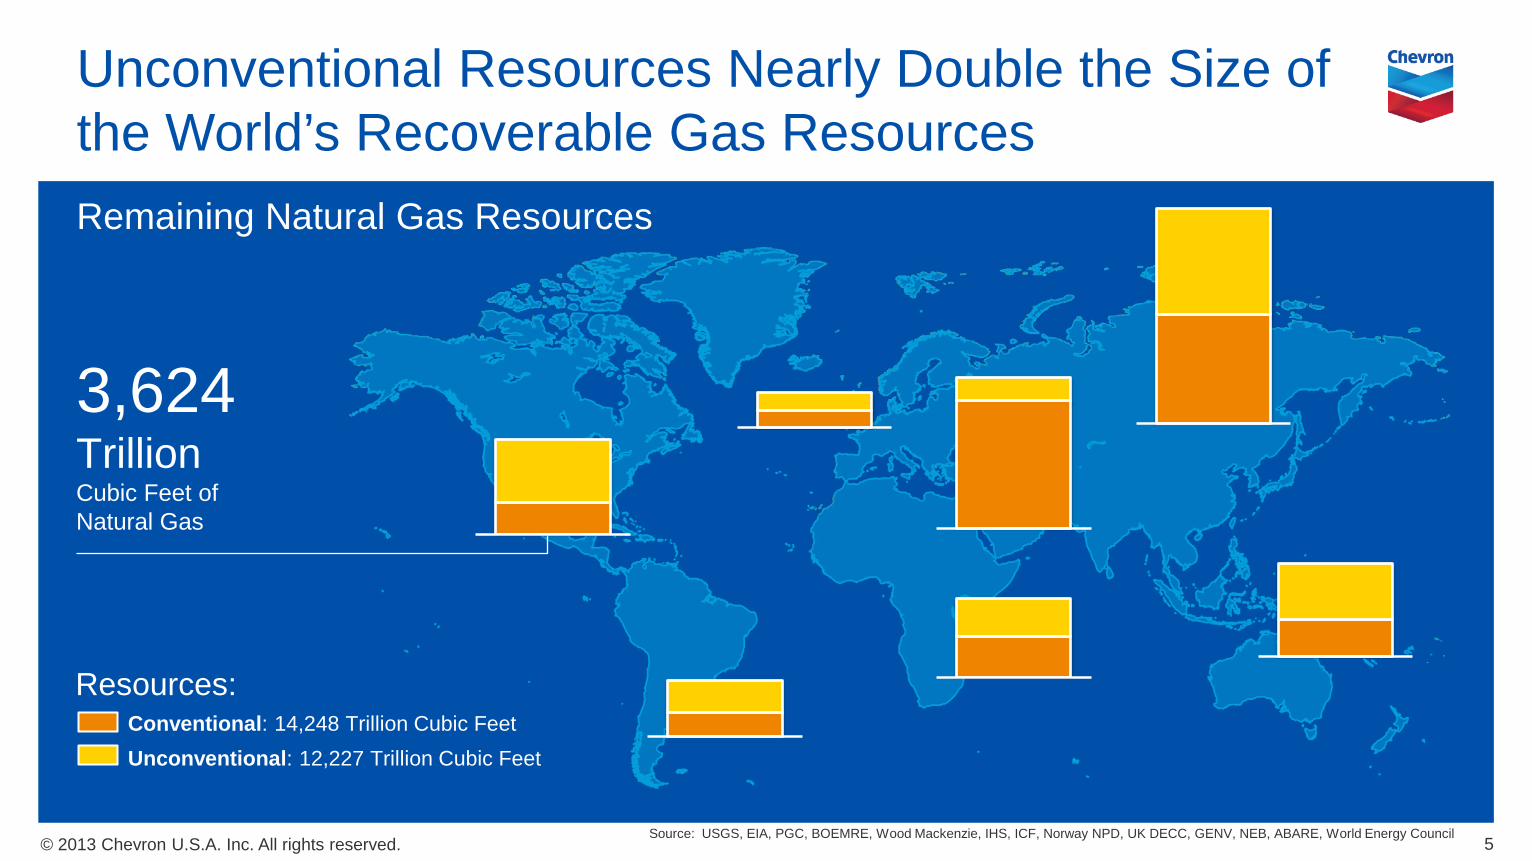
Unconventional Resources Nearly Double the Size of the World’s Recoverable Gas Resources Remaining Natural Gas Resources
Unconventional: 12,227 Trillion Cubic Feet
3,624 Trillion Cubic Feet of Natural Gas
Conventional: 14,248 Trillion Cubic Feet
Resources:
Source: USGS, EIA, PGC, BOEMRE, Wood Mackenzie, IHS, ICF, Norway NPD, UK DECC, GENV, NEB, ABARE, World Energy Council 5
© 2013 Chevron U.S.A. Inc. All rights reserved.
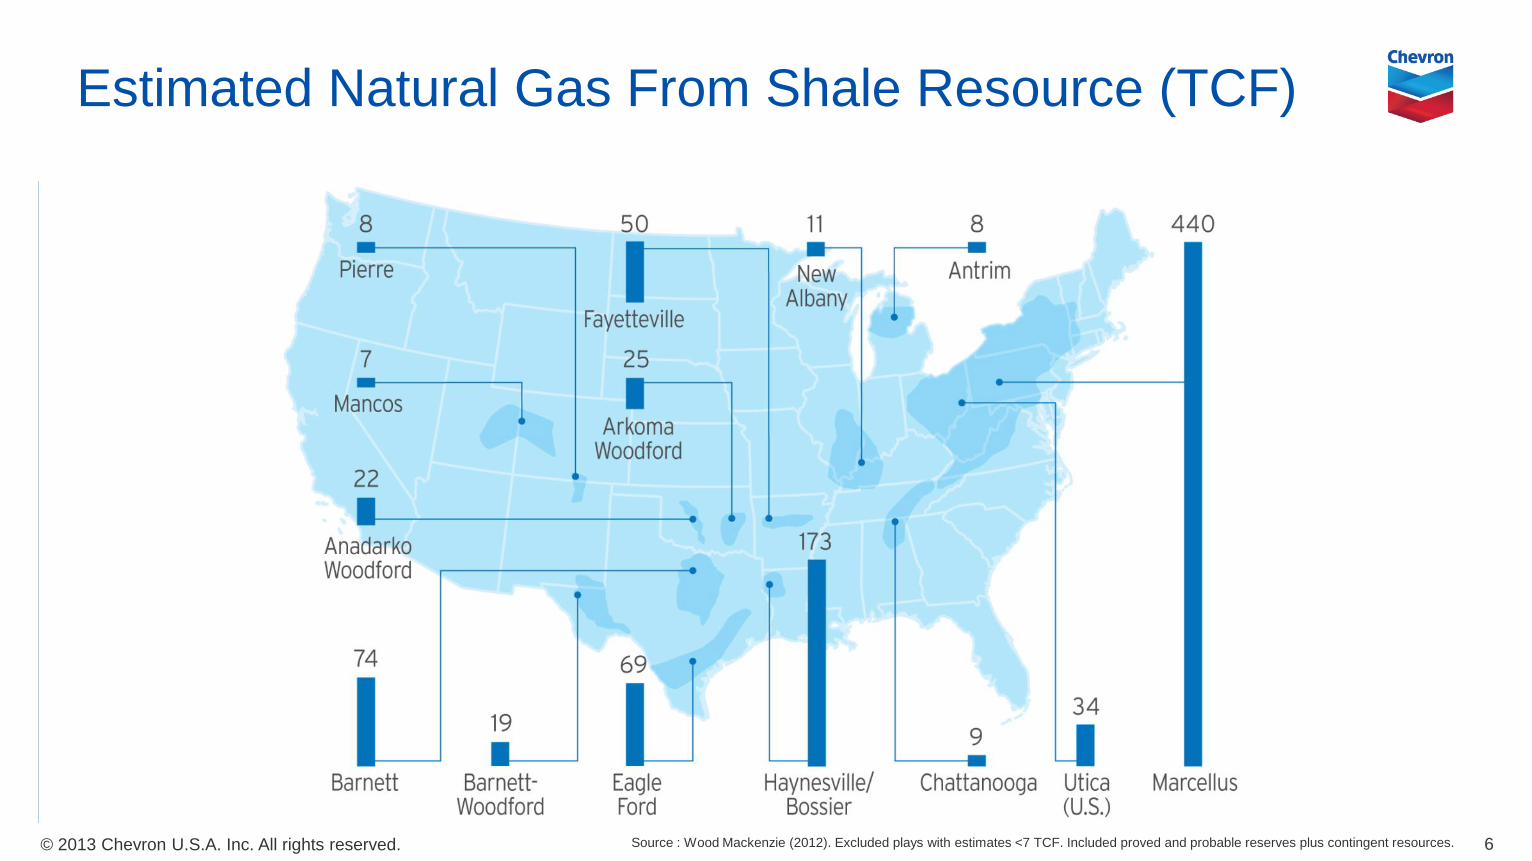
Estimated Natural Gas From Shale Resource (TCF)
6 Source : Wood Mackenzie (2012). Excluded plays with estimates <7 TCF. Included proved and probable reserves plus contingent resources.
© 2013 Chevron U.S.A. Inc. All rights reserved.
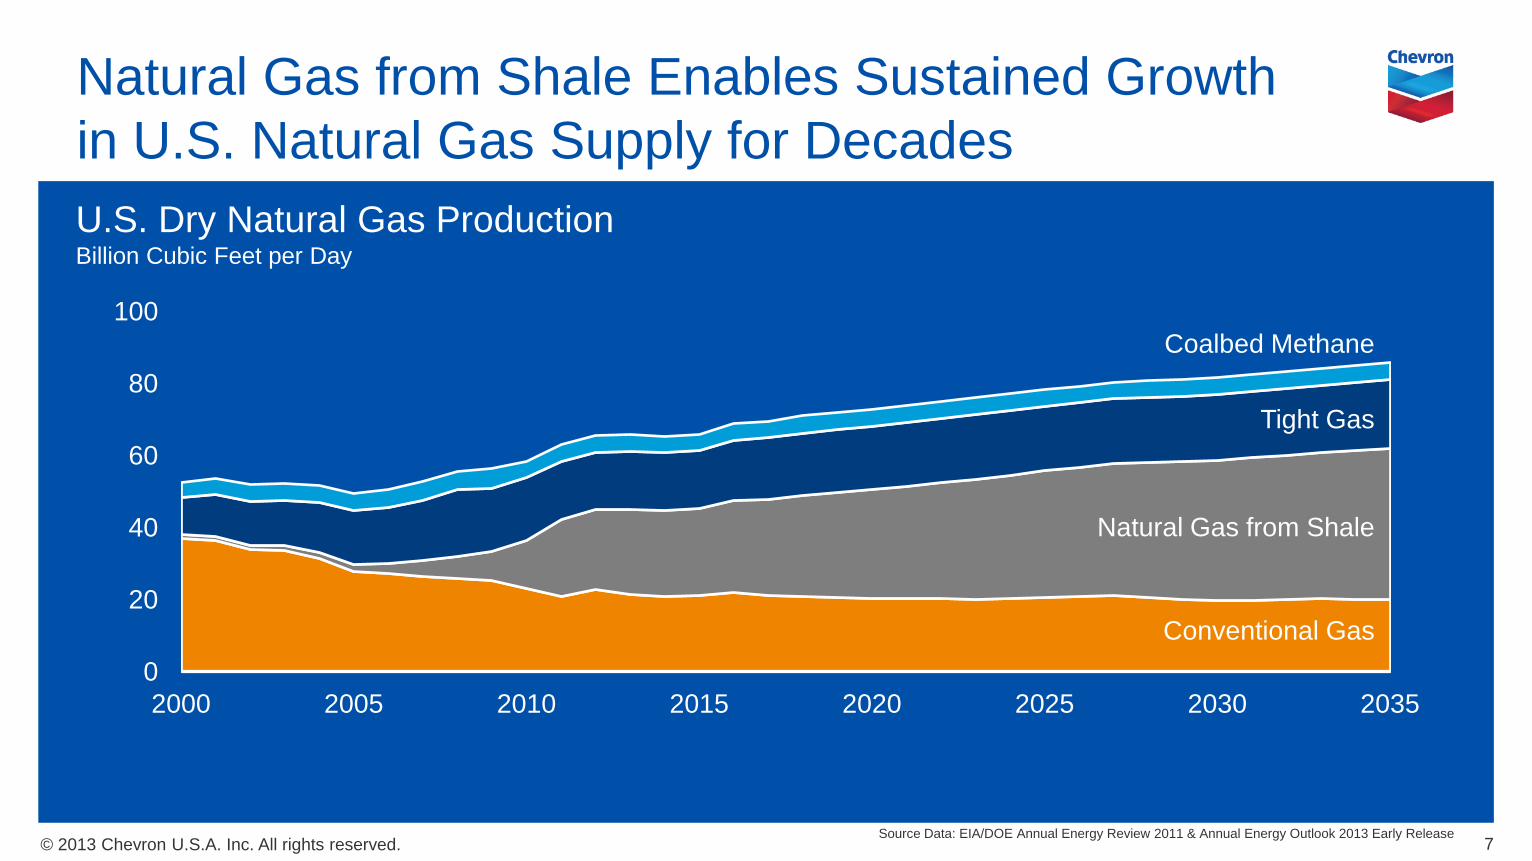
Natural Gas from Shale Enables Sustained Growth in U.S. Natural Gas Supply for Decades
0
20
40
60
80
100
2000 2005 2010 2015 2020 2025 2030 2035
7 Source Data: EIA/DOE Annual Energy Review 2011 & Annual Energy Outlook 2013 Early Release
U.S. Dry Natural Gas Production Billion Cubic Feet per Day
Conventional Gas
Tight Gas
Natural Gas from Shale
Coalbed Methane
© 2013 Chevron U.S.A. Inc. All rights reserved.
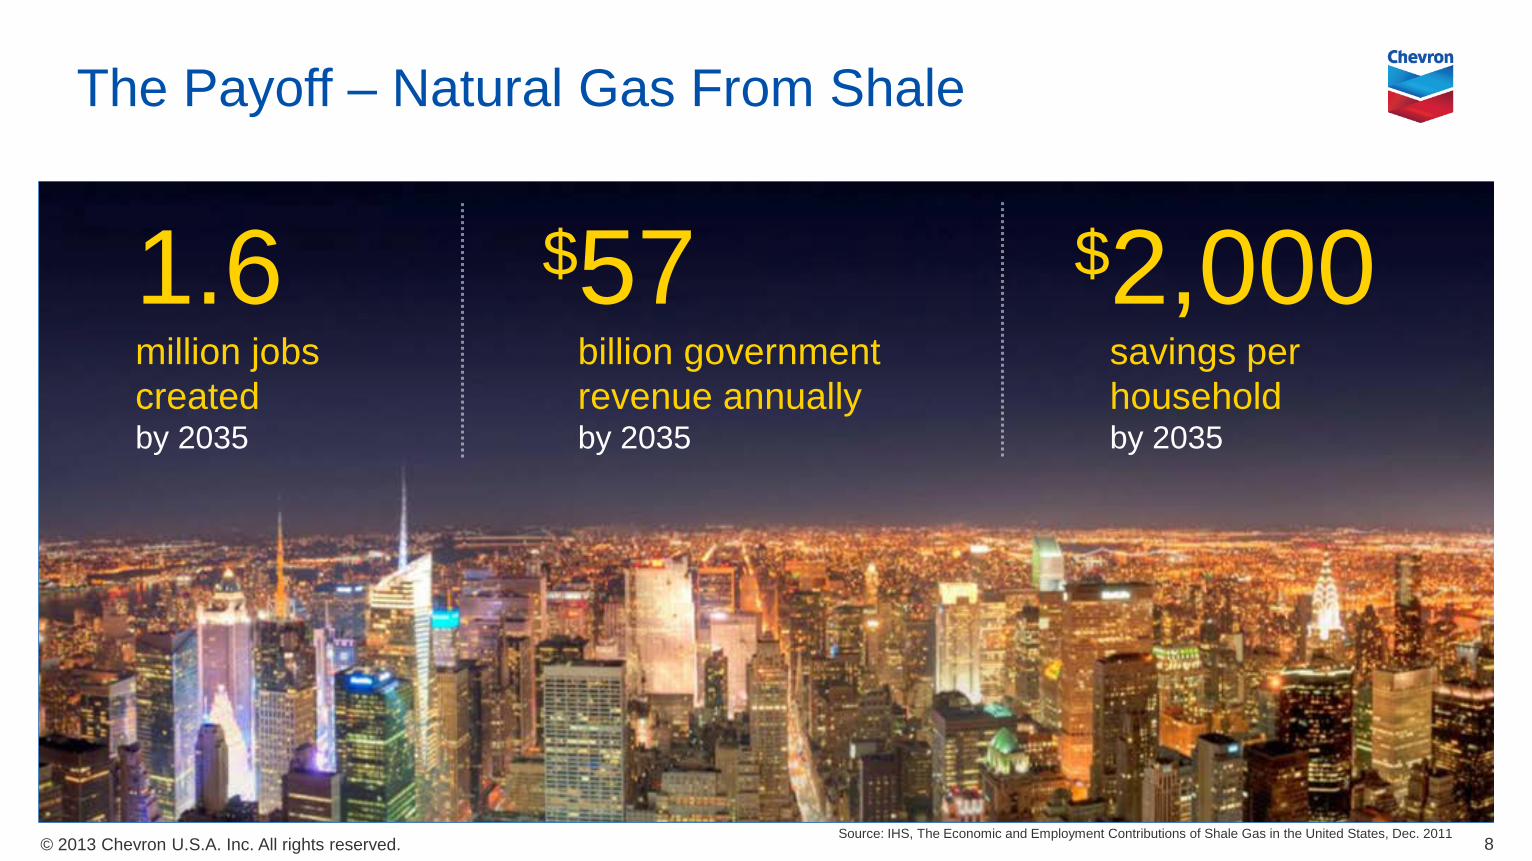
The Payoff – Natural Gas From Shale
8
1.6 million jobs created by 2035
$57 billion government revenue annually by 2035
$2,000 savings per household by 2035
Source: IHS, The Economic and Employment Contributions of Shale Gas in the United States, Dec. 2011
© 2013 Chevron U.S.A. Inc. All rights reserved.
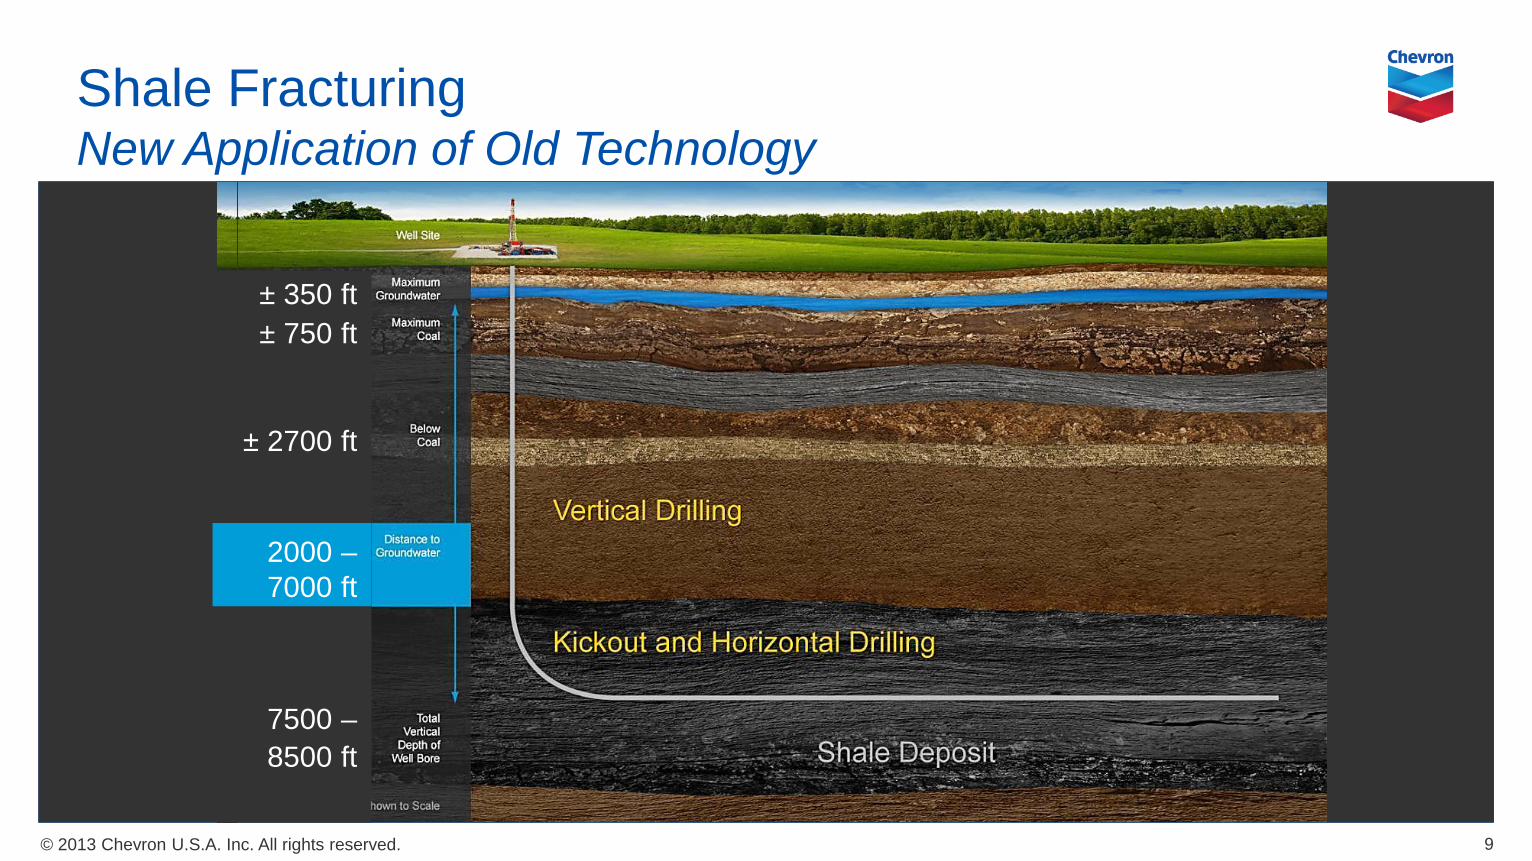
Shale Fracturing New Application of Old Technology
9
± 350 ft ± 750 ft
± 2700 ft 2000 – 7000 ft
7500 – 8500 ft
© 2013 Chevron U.S.A. Inc. All rights reserved.
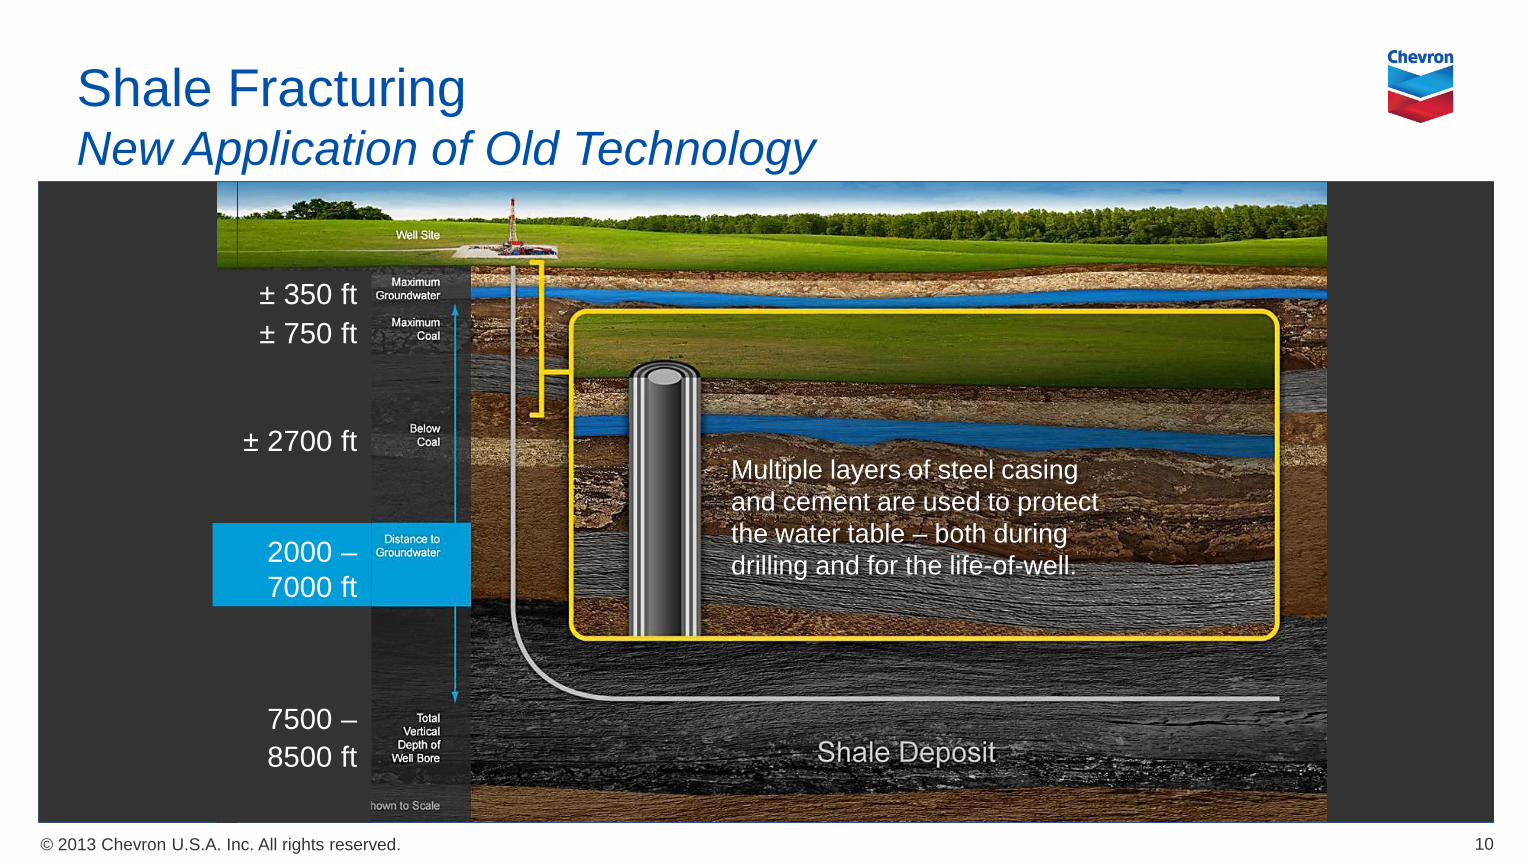
Shale Fracturing New Application of Old Technology
10
± 350 ft ± 750 ft
± 2700 ft 2000 – 7000 ft
7500 – 8500 ft
Multiple layers of steel casing and cement are used to protect the water table – both during drilling and for the life-of-well.

© 2013 Chevron U.S.A. Inc. All rights reserved.
Environmental and Social Responsibility
11
Good Practices Multiple wells from
one pad Greener fluid systems Water recycling Site reclamation Reduced footprint
Strong Regulation and Sustainable Standards Prevention is primary focus Standards in well design,
construction, well control and verification of integrity throughout life of a well
All companies operate at the same, high level
Community Engagement STEM education Workforce development Community advisory
councils Employee engagement
and volunteerism
© 2013 Chevron U.S.A. Inc. All rights reserved.
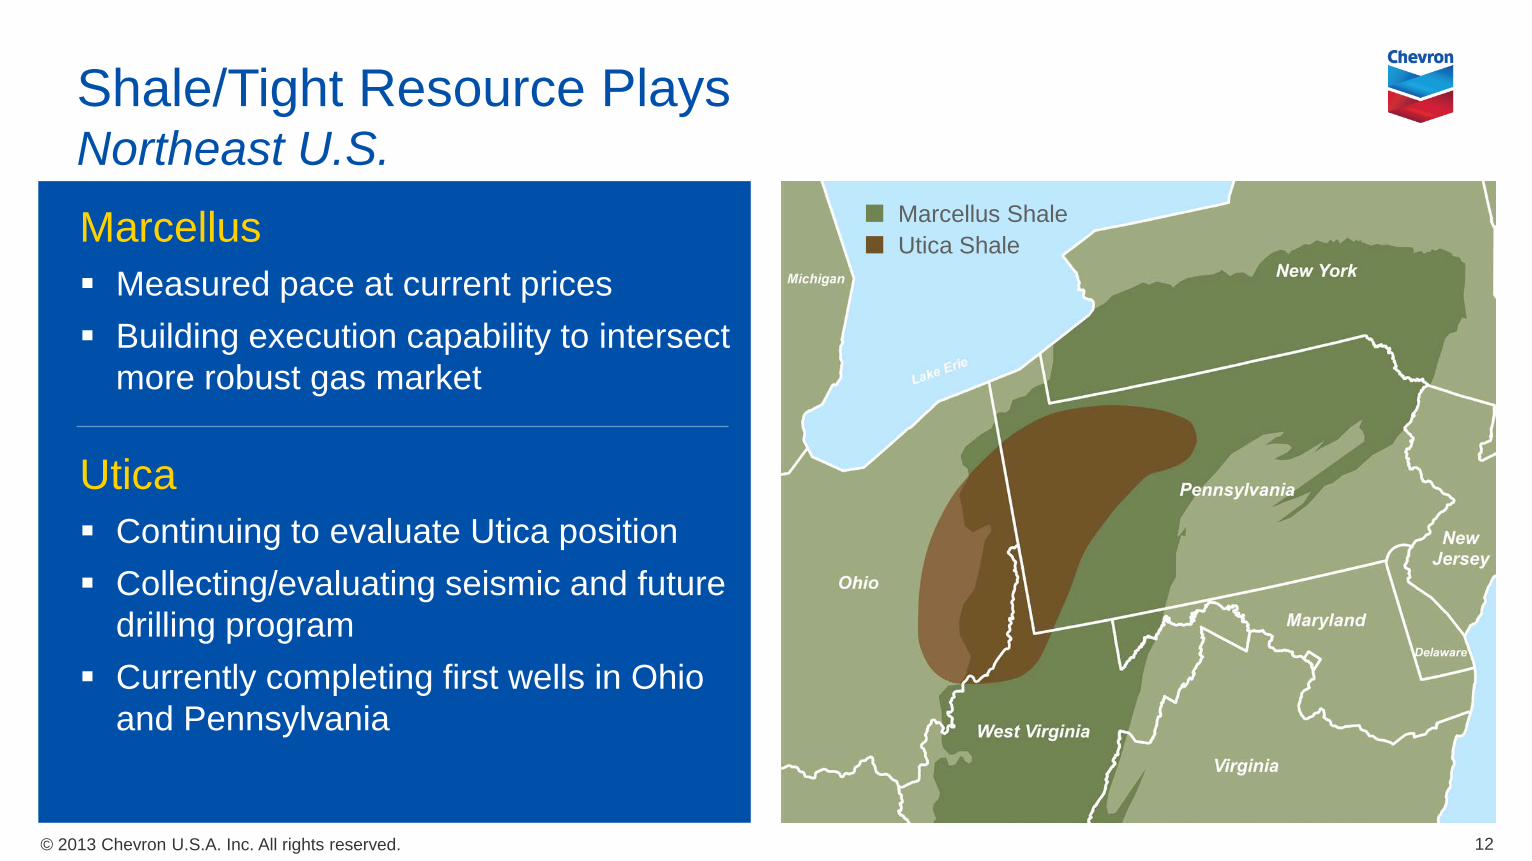
Shale/Tight Resource Plays Northeast U.S. Marcellus Measured pace at current prices Building execution capability to intersect
more robust gas market
Utica Continuing to evaluate Utica position Collecting/evaluating seismic and future
drilling program Currently completing first wells in Ohio
and Pennsylvania
12
Marcellus Shale Utica Shale
© 2013 Chevron U.S.A. Inc. All rights reserved.
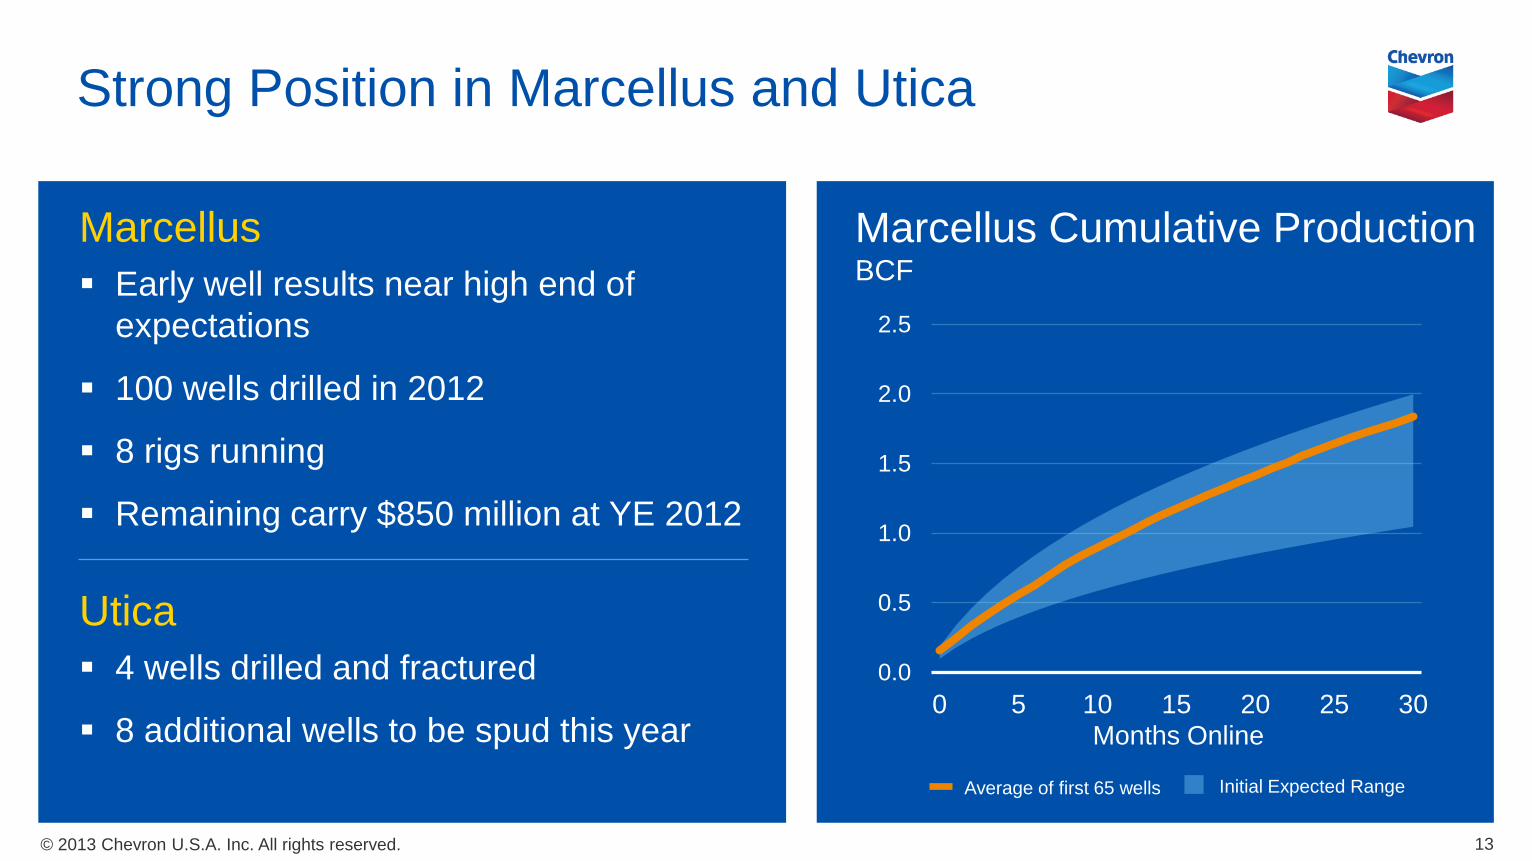
Strong Position in Marcellus and Utica
Marcellus Early well results near high end of
expectations
100 wells drilled in 2012
8 rigs running
Remaining carry $850 million at YE 2012
Utica 4 wells drilled and fractured
8 additional wells to be spud this year
13
Marcellus Cumulative Production BCF
Months Online
0.0
0.5
1.0
1.5
2.0
2.5
0 5 10 15 20 25 30
Average of first 65 wells Initial Expected Range
© 2013 Chevron U.S.A. Inc. All rights reserved.
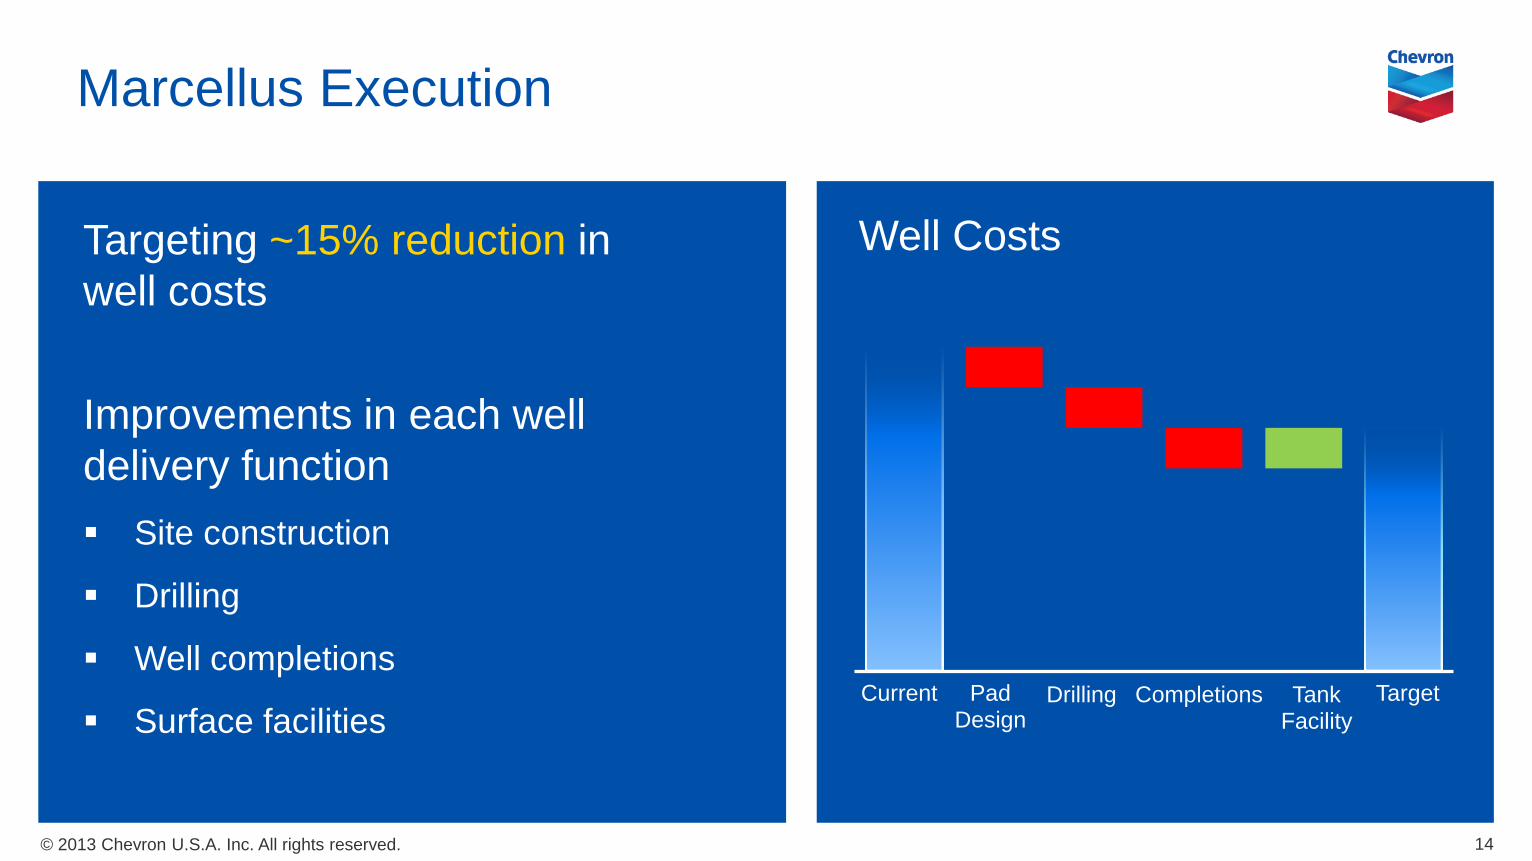
Marcellus Execution
Targeting ~15% reduction in well costs
Improvements in each well delivery function Site construction
Drilling
Well completions
Surface facilities
14
Well Costs
Current Pad Design
Drilling Tank Facility
Completions Target
© 2013 Chevron U.S.A. Inc. All rights reserved.
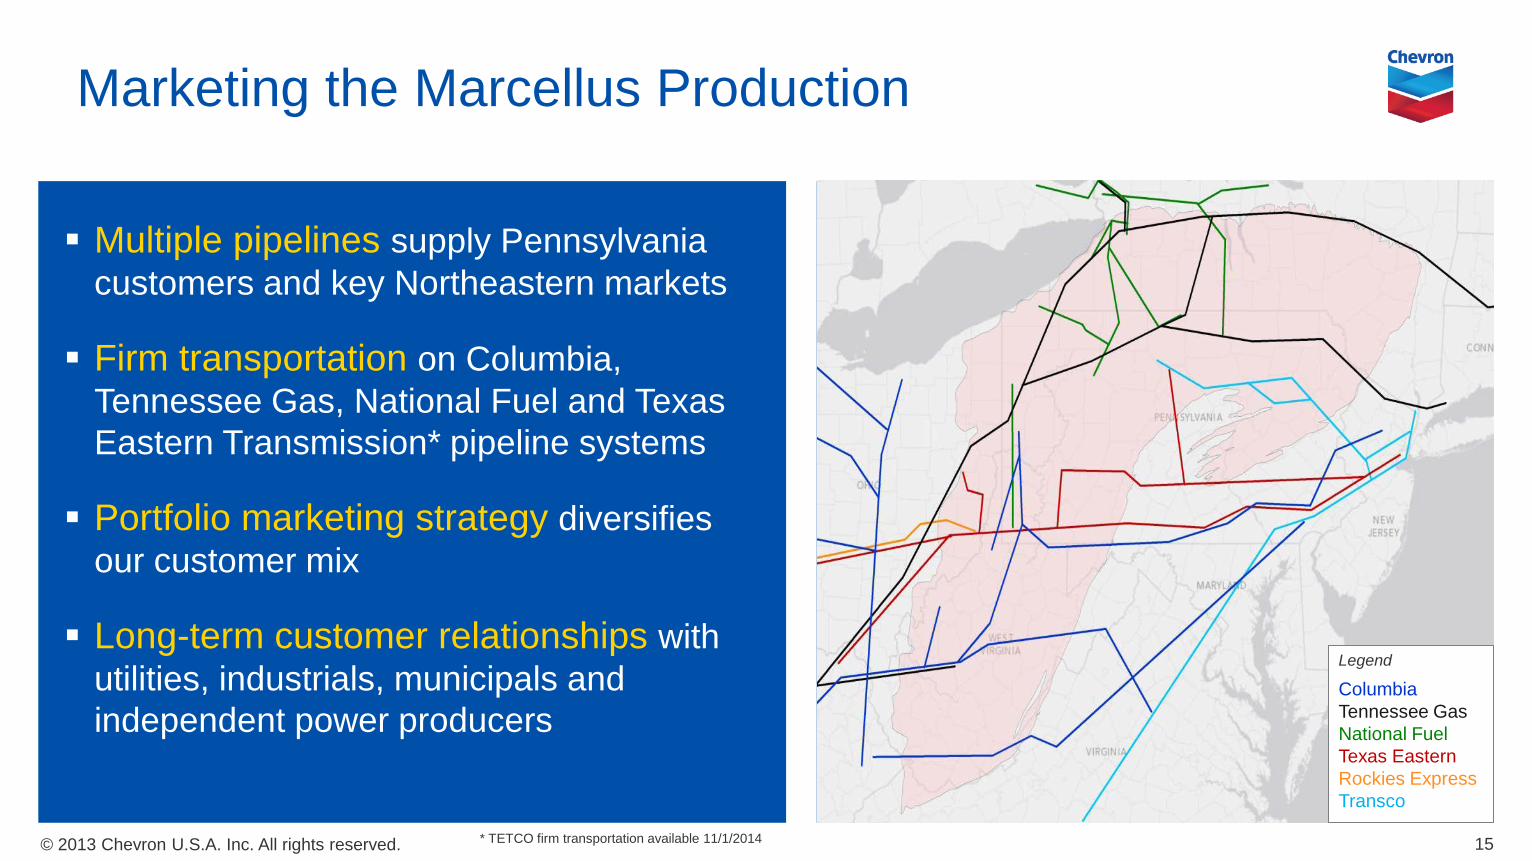
Marketing the Marcellus Production
Multiple pipelines supply Pennsylvania customers and key Northeastern markets
Firm transportation on Columbia, Tennessee Gas, National Fuel and Texas Eastern Transmission* pipeline systems
Portfolio marketing strategy diversifies our customer mix
Long-term customer relationships with utilities, industrials, municipals and independent power producers
* TETCO firm transportation available 11/1/2014 15
Legend
Columbia Tennessee Gas National Fuel Texas Eastern Rockies Express Transco
© 2013 Chevron U.S.A. Inc. All rights reserved. 16
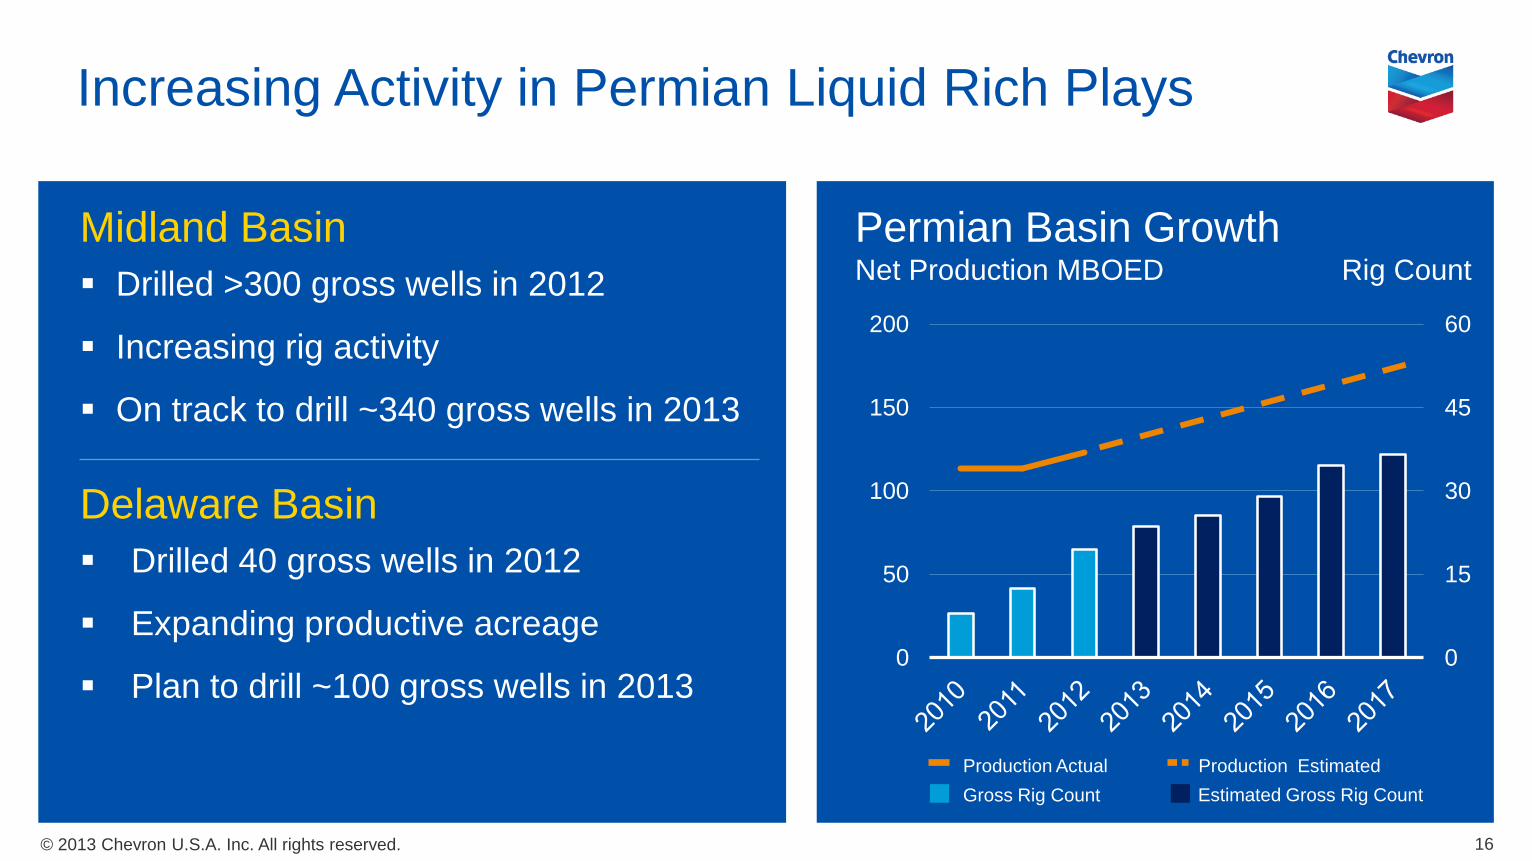
Permian Basin Growth Net Production MBOED Rig Count
0
15
30
45
60
0
50
100
150
200
Gross Rig Count Production Actual
Estimated Gross Rig Count
Increasing Activity in Permian Liquid Rich Plays
Production Estimated
Midland Basin Drilled >300 gross wells in 2012
Increasing rig activity
On track to drill ~340 gross wells in 2013
Delaware Basin Drilled 40 gross wells in 2012
Expanding productive acreage
Plan to drill ~100 gross wells in 2013
© 2013 Chevron U.S.A. Inc. All rights reserved.
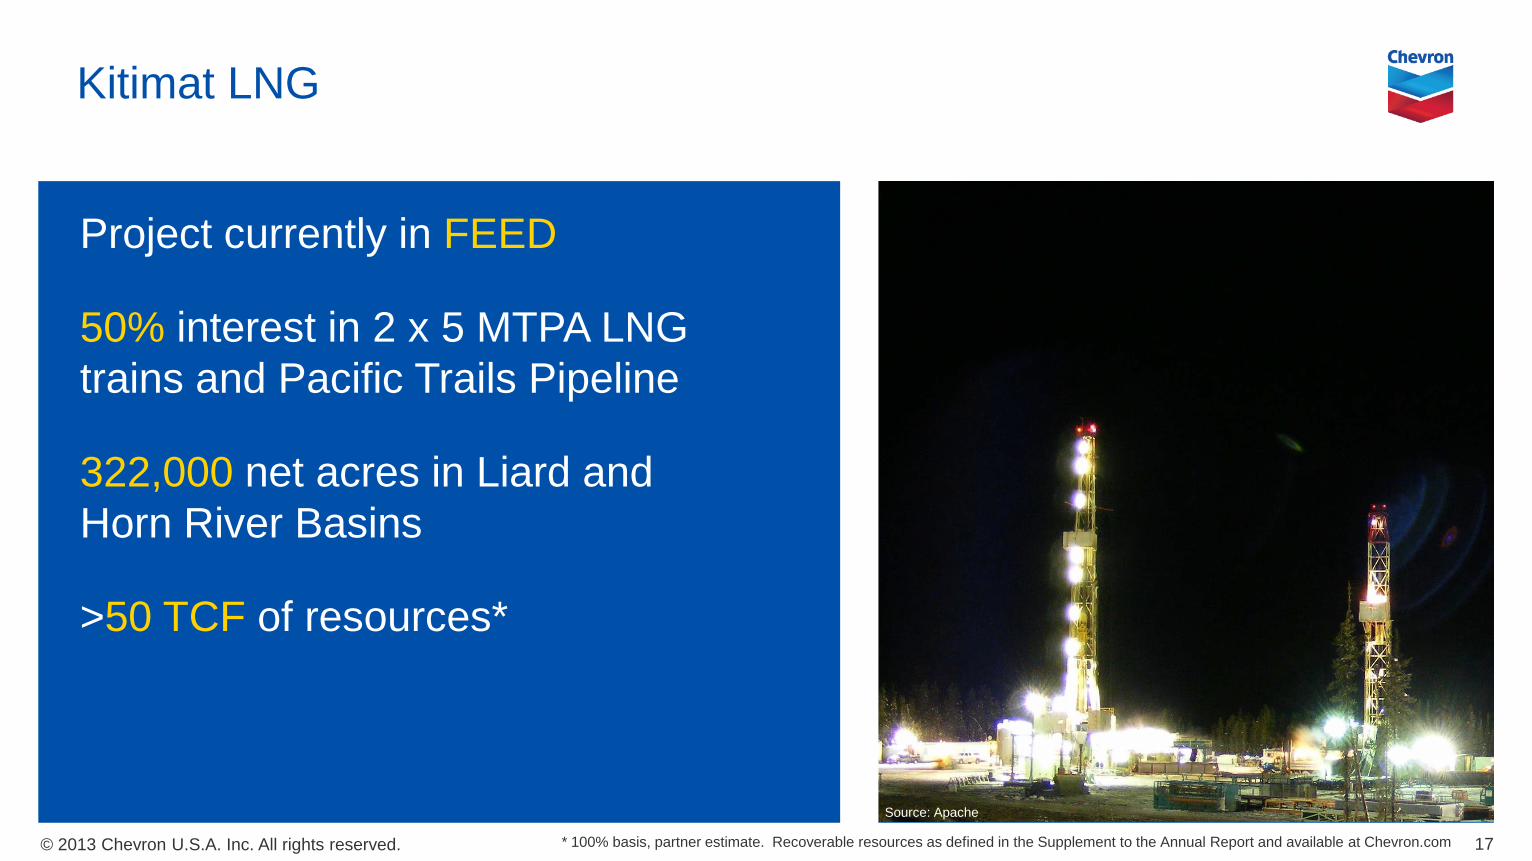
Kitimat LNG
Project currently in FEED
50% interest in 2 x 5 MTPA LNG trains and Pacific Trails Pipeline
322,000 net acres in Liard and Horn River Basins
>50 TCF of resources*
17 * 100% basis, partner estimate. Recoverable resources as defined in the Supplement to the Annual Report and available at Chevron.com
Source: Apache
© 2013 Chevron U.S.A. Inc. All rights reserved. 18