J.P. Morgan Global High Yield and Leveraged Finance...
30
NYSE: CVA FEBRUARY 2018 J.P. Morgan Global High Yield and Leveraged Finance Conference
Transcript of J.P. Morgan Global High Yield and Leveraged Finance...

NYSE: CVA FEBRUARY 2018
J.P. Morgan Global High Yield and Leveraged Finance Conference
Cautionary Statements
2
All information included in this earnings presentation is based on continuing operations, unless otherwise noted.
Forward-Looking Statements
Certain state e ts i this p ess elease a o stitute fo a d-looki g state e ts as defi ed i Se tio A of the Se u ities A t of , as a e ded the Se u ities A t , Se tio E of the Se u ities E ha ge A t of the E ha ge A t , the P i ate Se u ities Litigatio Refo A t of the PSLRA o in releases ade the Se u ities a d E ha ge Co issio SEC , all as a be amended from time to time. Such forward-looking statements involve known and unknown risks, uncertainties and other important factors that could cause the actual results, performance or
a hie e e ts of Co a ta Holdi g Co po atio a d its su sidia ies Co a ta o i dust esults, to diffe ate iall f o any future results, performance or achievements expressed or implied by such
forward-looking statements. Statements that are not historical fact are forward-looking statements. Forward-looking statements can be identified by, among other things, the use of forward-looking
la guage, su h as the o ds pla , elie e, e pe t, a ti ipate, i te d, esti ate, p oje t, a , ill, ould, ould, should, seeks, o s heduled to, o othe si ila o ds, o the negative of these terms or other variations of these terms or comparable language, or by discussion of strategy or intentions. These cautionary statements are being made pursuant to the Securities Act,
the E ha ge A t a d the PSLRA ith the i te tio of o tai i g the e efits of the safe ha o p o isio s of su h la s. Covanta cautions investors that any forward-looking statements made by
Covanta are not guarantees or indicative of future performance. Important assumptions and other important factors, risks and uncertainties that could cause actual results to differ materially from those
forward-looking statements with respect to Covanta include, but are not limited to: the risks and uncertainties affecting Covanta's business described in periodic securities filings by Covanta with the SEC.
Important factors, risks, and uncertainties that could cause actual results of Covanta and the JV to differ materially from those forward-looking statements include, but are not limited to: seasonal or long-
term fluctuations in the prices of energy, waste disposal, scrap metal and commodities, and Covanta's ability to renew or replace expiring contracts at comparable prices and with other acceptable terms;
adoption of new laws and regulations in the United States and abroad, including energy laws, tax laws, environmental laws, labor laws and healthcare laws; advances in technology; difficulties in the
operation of our facilities, including fuel supply and energy delivery interruptions, failure to obtain regulatory approvals, equipment failures, labor disputes and work stoppages, and weather interference
and catastrophic events; failure to maintain historical performance levels at Covanta's facilities and Covanta's ability to retain the rights to operate facilities Covanta does not own; Covanta's and the joint
ventures ability to avoid adverse publicity or reputational damage relating to its business; difficulties in the financing, development and construction of new projects and expansions, including increased
construction costs and delays; Covanta's ability to realize the benefits of long-term business development and bear the costs of business development over time; Covanta's ability to utilize net operating
loss carryforwards; limits of insurance coverage; Covanta's ability to avoid defaults under its long-term contracts; performance of third parties under its contracts and such third parties' observance of
laws and regulations; concentration of suppliers and customers; geographic concentration of facilities; increased competitiveness in the energy and waste industries; changes in foreign currency exchange
rates; limitations imposed by Covanta's existing indebtedness and its ability to perform its financial obligations and guarantees and to refinance its existing indebtedness; exposure to counterparty credit
risk and instability of financial institutions in connection with financing transactions; the scalability of its business; restrictions in its certificate of incorporation and debt documents regarding strategic
alternatives; failures of disclosure controls and procedures and internal controls over financial reporting; Covanta's and the joint ventures ability to attract and retain talented people; general economic
conditions in the United States and abroad, including the availability of credit and debt financing; and other risks and uncertainties affecting Covanta's businesses described periodic securities filings by
Covanta with the SEC.
Although Covanta believes that its plans, cost estimates, returns on investments, intentions and expectations reflected in or suggested by such forward-looking statements are reasonable, actual results
could differ materially from a projection or assumption in any forward-looking statements. Covanta's and the joint ventures future financial condition and results of operations, as well as any forward-
looking statements, are subject to change and to inherent risks and uncertainties. The forward-looking statements contained in this press release are made only as of the date hereof and Covanta does
not have, or undertake, any obligation to update or revise any forward-looking statements whether as a result of new information, subsequent events or otherwise, unless otherwise required by law.
Note: All estimates with respect to 2018 and future periods are as of February 22, 2018. Covanta does not have or undertake any obligation to update or revise any forward-looking statements whether as
a result of new information, subsequent events or otherwise, unless otherwise required by law.
Discussion of Non-GAAP Financial Measures
We use a u e of diffe e t fi a ial easu es, oth U ited States ge e all a epted a ou ti g p i iples GAAP a d o -GAAP, in assessing the overall performance of our business. To
supplement our assessment of results prepared in accordance with GAAP, we use the measures of Adjusted EBITDA, Free Cash Flow, Free Cash Flow Before Working Capital, and Adjusted EPS which are
non-GAAP measures as defined by the Securities and Exchange Commission. The non-GAAP financial measures of Adjusted EBITDA, Free Cash Flow, Free Cash Flow Before Working Capital, and Adjusted
EPS as described below, and used in this release, are not intended as a substitute or as an alternative to net income, cash flow provided by operating activities or diluted earnings per share as indicators of
our performance or liquidity or any other measures of performance or liquidity derived in accordance with GAAP. In addition, our non-GAAP financial measures may be different from non-GAAP measures
used by other companies, limiting their usefulness for comparison purposes. The presentations of Adjusted EBITDA, Free Cash Flow, Free Cash Flow Before Working Capital, and Adjusted EPS are intended
to enhance the usefulness of our financial information by providing measures which management internally use to assess and evaluate the overall performance of its business and those of possible
acquisition candidates, and highlight trends in the overall business.

Covanta – World Leader in Energy-from-Waste
Note: Guidance as of February 22, 2018.
Energy:
~10 million MWh
generated annually
1,400+ MW base load capacity
Metals: ~550,000 gross tons of
ferrous and non-
ferrous recovered
annually
Waste:
Operate 43 Energy-from-Waste (EfW) facilities
~20 million tons p o essed a uall → : tons of CO2 equivalent offset
19 material processing
facilities
FY 2018 Guidance:
• Adjusted EBITDA:
$425 - $455 million
• Free Cash Flow:
$70 - $100 million
• FCF Before W/C:
$100 - $130 million
% of 2017
Revenue
Waste
70%
Metals
5%
Energy
19%
Other
6%
3

EfW: Unique Renewable Energy Business
Waste Conversion Process
Energy / Outputs
Municipal
Commercial
Industrial
Technologically advanced mass-burn
facilities
The only power source that reduces greenhouse gas emissions
500-700 kWh power
~50lbs recycled metal
Ash: ~10% of original volume
1 ton of waste yields:
4

Market Leader in the U.S.
~400 Million Tons of
Waste Annually
7% Waste-to-
Energy
64% Landfill
29% Recycling / Composting
Covanta
~70% of this market
Benefits of EfW
• Environmentally sustainable waste management
• Renewable energy source
• Combats climate change 5

Irreplaceable Infrastructure
• Concentrated in attractive, densely-populated markets
• Limited alternative disposal capacity in metropolitan areas
• Cost advantage vs. long haul transfer to landfills
• Electricity sold at high demand points 6
Advantages
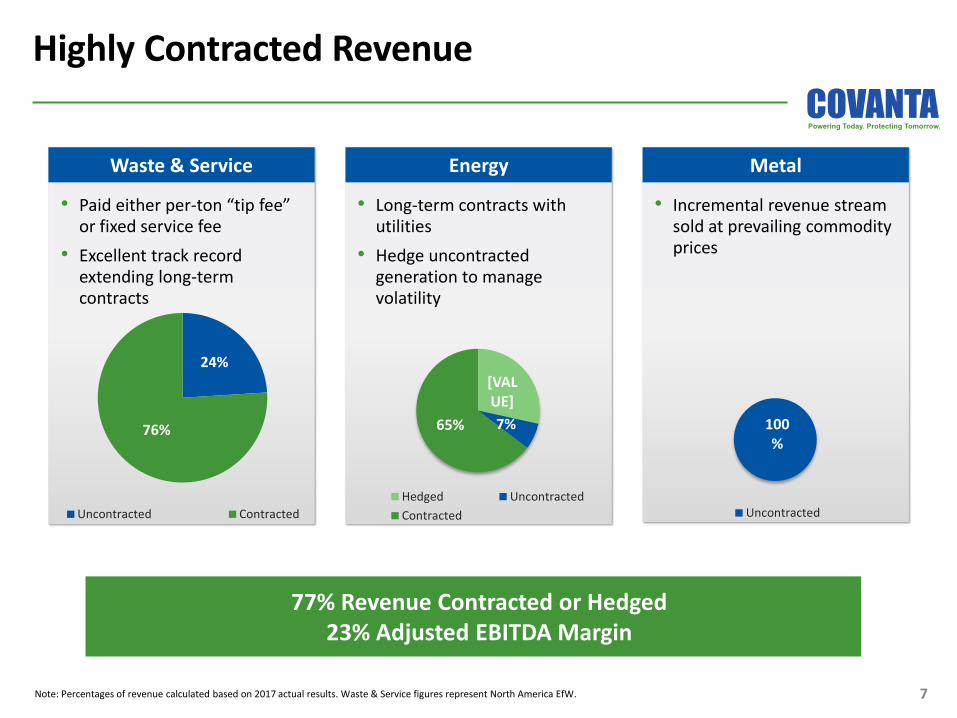
Highly Contracted Revenue
Waste & Service
Energy
Metal
• Paid either per-to tip fee or fixed service fee
• Excellent track record extending long-term contracts
• Long-term contracts with utilities
• Hedge uncontracted generation to manage volatility
• Incremental revenue stream sold at prevailing commodity prices
100
%
Uncontracted
24%
76%
Uncontracted Contracted
[VAL
UE]
7% 65%
Hedged Uncontracted
Contracted
7
77% Revenue Contracted or Hedged
23% Adjusted EBITDA Margin
Note: Percentages of revenue calculated based on 2017 actual results. Waste & Service figures represent North America EfW.

Entering a New Growth Era
2009 - 2017 2018+ 1980s - 2008
• Assembled unmatched EfW portfolio
– Construction and acquisitions
Build Transition Growth • Successfully managed
headwinds
– Mark-to-market of original long-term contracts
– Commodity prices
• Outlook for sustainable long-term growth
– Organic growth opportunities
– International development
8

Key Growth Drivers
• Significant leverage to commodity
market recovery
o Metals
o Energy
• Long-term target 3-5% growth
o Favorable waste market
dynamics
o Environmental Solutions
o Metals recovery and ash
management
o Continuous Improvement
Underpins long-term cash flow growth
and capital allocation plans
Opportunities to invest capital at
attractive equity returns
• EfW project development pipeline
o Dublin facility commenced
operations in Q4 2017
o Robust UK development
pipeline supported by GIG
partnership
Rookery project targeted to
begin construction 1H 2018
o Long-term opportunities in
other international markets
• Disciplined, synergistic acquisitions
o Environmental Solutions
o EfW
Organic New Investment
Co
re B
usi
ne
ss
Co
mm
od
itie
s
9

Growth Drivers: Environmental Solutions
EfW Profiled Waste
• Unmatched EfW footprint
• Assured destruction and/or
zero landfill disposal for non-
hazardous waste
• Drives higher average waste
revenue per ton
~$100 million Revenue
~50% Adjusted EBITDA margin
Environmental Services
• Synergistic network of
material processing facilities
• Wide range of solid and liquid
waste processing, recycling
and field services capabilities
~$100 million Revenue
~20% Adjusted EBITDA margin
+
10
Comprehensive solutions for government, commercial, industrial and
medical / pharmaceutical sectors

Growth Drivers: Metal Recovery and Ash Management
1. EfW Plant
Recovery Systems
• Significant growth in
recovery: +30% ferrous
and +170% non-ferrous
since 2012
• Continued focus on
optimizing recovery
2. Metals
Processing for
Enhanced Product
• Centralized processing
driving improved pricing
o Upgrading ~30% of
ferrous today, with
plans to expand
o Centralized non-
ferrous processing for
over 90% of volume
3. Enhanced Metal
Recovery and Ash
Reuse
• Permitting and designing
fi st Total Ash P o essi g S ste to handle ~10% of ash
• Returns driven by metal
recovery and sale of
aggregates which reduces
disposal by ~65%
• Target incremental sites
once technology proven
11
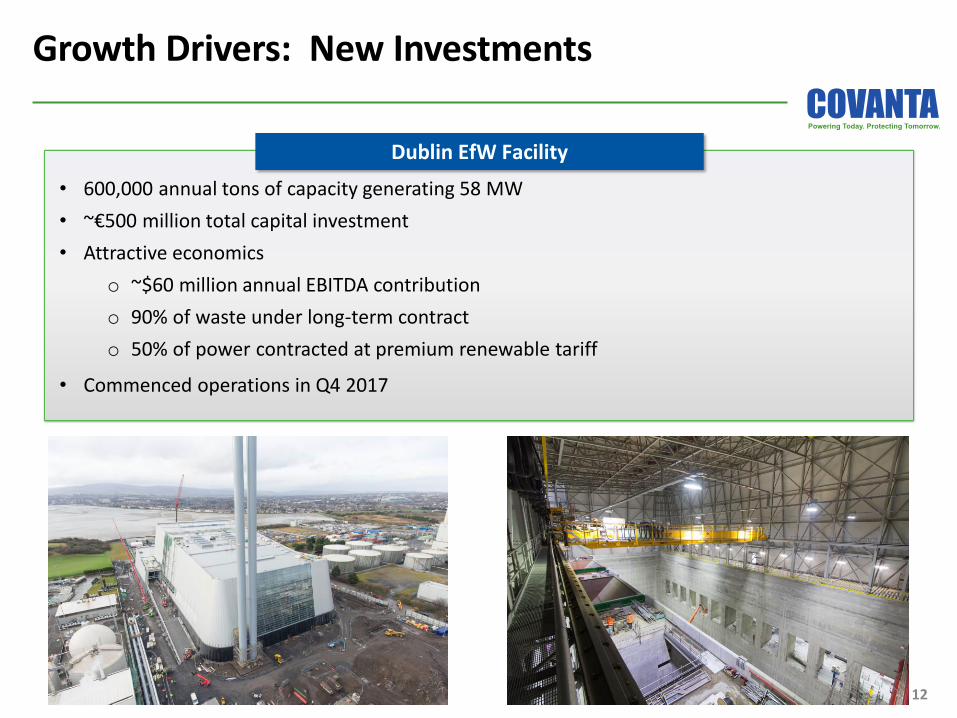
Growth Drivers: New Investments
Dublin EfW Facility
• 600,000 annual tons of capacity generating 58 MW
• ~€500 million total capital investment
• Attractive economics
o ~$60 million annual EBITDA contribution
o 90% of waste under long-term contract
o 50% of power contracted at premium renewable tariff
• Commenced operations in Q4 2017
12

Overview of Strategic Partnership with GIG
AssetCo
• Strategic partnership and investment vehicle to capitalize on UK growth opportunities
• Combined resources to develop projects jointly
• Joint (50:50) Investment / ownership upon closing of project financing
• Original developer receives premium at project finance close – Rookery to be the next asset to close
• Targeted project equity returns in the low to mid teens
• Covanta to provide contractual O&M services
100%
Dublin
50%
Newhurst Protos Rookery O&M Acquisitions New JV
Projects
Powerful Growth Platform
50%
3 GIG
Projects

Robust Project Development Pipeline
14
Newhurst
• Location: Leicestershire, England
• 350k tonnes / 40 MW
• Total Investment: £250-£300 million
• Non-JV Project Partner: Biffa
Protos
• Location: Cheshire, England
• 350k tonnes / 40 MW
• Total Investment: £250-£300 million
• Non-JV Project Partner: Biffa
Rookery
• Location: Bedfordshire, England
• 535k tonnes / 60 MW
• Total Investment: £375-£425 million
• Non-JV Project Partner: Veolia
Dublin
• Location: Dublin, Ireland
• 600k tonnes / 60 MW
• Total Investment: €525 million
London
Birmingham
Edinburgh
Belfast
Liverpool Manchester
Glasgow
GIG brings portfolio of 3 EfW
development projects in the UK
with combined capacity of over
800,000 tonnes per year (1)
Committed to invest £3 in green
infrastructure over the next three
years
Co a ta’s existing UK pipeline centered around major metro areas …
to e o ple e ted y GIG’s pipeli e hi h i reases apa ity u der de elop e t y %
Dublin
1) Name and location of GIG projects withheld due to confidentiality and commercial limitations.

• Annualized cash dividend of $1.00 / share
Capital Allocation Policy
15
Free Cash Flow
Dividend Stability
• Organic growth investments • Project development • Opportunistic M&A
• Potential opportunistic use of capital, but not near-term priority
• Contribution from investments coming online • Opportunistic debt repayment
Growth Investments
• To be driven by sustainable Free Cash Flow growth
Deleveraging
Dividend Growth
Share Repurchases

Stable and Flexible Balance Sheet
• ~€450 in Dublin project debt deconsolidated at
GIG transaction close
• Revolver balance shown does not reflect
epa e t of $ illio i Q ’ ia proceeds from GIG transaction
• Weighted average debt maturity of ~8.5 years,
with no material corporate maturities until
2020
As of 12/31/17 (Face Value; $ in millions)
Covanta Energy, LLC
Revolving Credit Facility due 2019-2020: (1) $445
Term Loan due 2020: 191
Equipment Leases due 2024-2027: 69
Tax-Exempt Corporate Bonds due 2024-2045: (2) 464
Domestic
Subsidiaries
Project Debt: $175
1) Total facility size of $1.0 billion ($50 million due 2019 and $950 million due 2020), with $192 million letters of credit outstanding and $363 million availability at December 31, 2017.
2) The tax-exempt corporate bonds are obligations of Covanta Holding Corporation and are guaranteed by Covanta Energy, and as such are effectively senior in right of payment to the other
indebtedness of Covanta Holding Corporation.
Covanta Holding Corporation
6.375% Senior Notes due 2022: $400
5.875% Senior Notes due 2024: 400
5.875% Senior Notes due 2025: 400
16
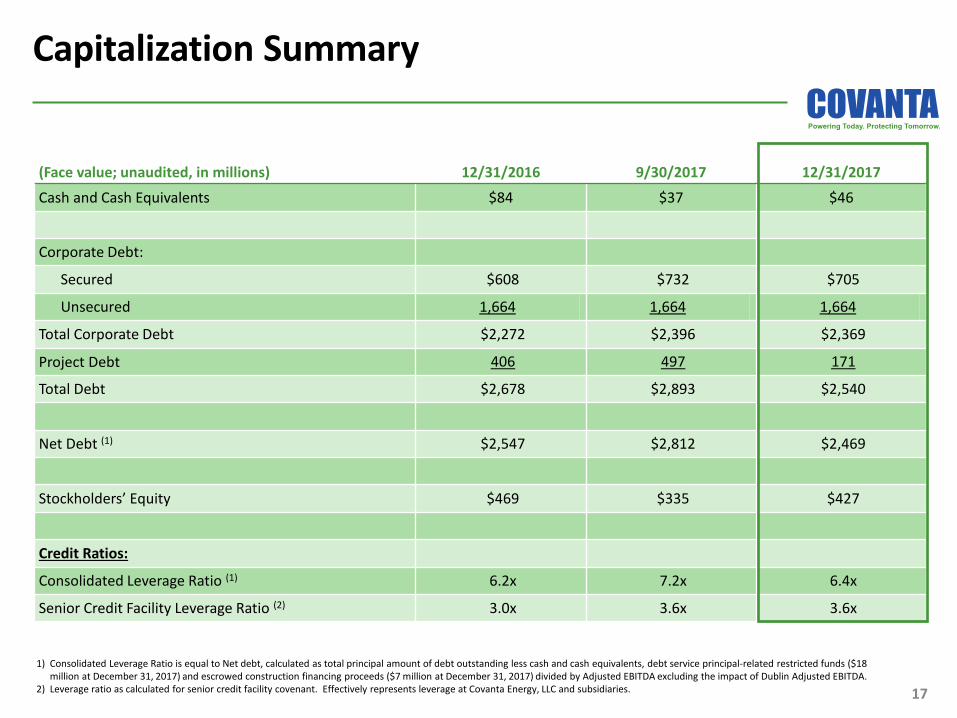
Capitalization Summary
17
1) Consolidated Leverage Ratio is equal to Net debt, calculated as total principal amount of debt outstanding less cash and cash equivalents, debt service principal-related restricted funds ($18
million at December 31, 2017) and escrowed construction financing proceeds ($7 million at December 31, 2017) divided by Adjusted EBITDA excluding the impact of Dublin Adjusted EBITDA.
2) Leverage ratio as calculated for senior credit facility covenant. Effectively represents leverage at Covanta Energy, LLC and subsidiaries.
(Face value; unaudited, in millions) 12/31/2016 9/30/2017 12/31/2017
Cash and Cash Equivalents $84 $37 $46
Corporate Debt:
Secured $608 $732 $705
Unsecured 1,664 1,664 1,664
Total Corporate Debt $2,272 $2,396 $2,369
Project Debt 406 497 171
Total Debt $2,678 $2,893 $2,540
Net Debt (1) $2,547 $2,812 $2,469
Sto kholde s’ E uit $469 $335 $427
Credit Ratios:
Consolidated Leverage Ratio (1) 6.2x 7.2x 6.4x
Senior Credit Facility Leverage Ratio (2) 3.0x 3.6x 3.6x

• 43 EfW facilities with ~20 million tons disposal capacity – one of the largest operators in the world
• Strong track record of operating performance – consistently achieve boiler availability in excess of 90%
World Leader in Energy-from-Waste
• Essential service to host communities
• Concentrated in attractive markets in Northeast U.S. with high barriers to entry – irreplaceable asset portfolio
Critical Infrastructure
Assets
• Earn revenue from both input (waste disposal) and output (energy and recycled metals)
• High Adjusted EBITDA margins (~23%) and Cash Flow conversion (~30%)
Attractive Economics
• 77% of revenue contracted or hedged
• Customers are primarily municipalities and utilities
Contracted Revenues
Robust current dividend with attractive long-term growth profile
18
Key Credit Highlights
• Cash flow underpins healthy shareholder capital returns and value-accretive reinvestment for growth
• Business model and balance sheet built to support capital allocation strategy though the commodity and economic cycles
Consistent Cash Flow Generation
• No near-term maturities and ample liquidity under revolving credit facility
• Predominantly fixed rate with average debt maturity of ~8.5 years
Stable Balance Sheet
Appendix

Waste Update
20 1) Excludes liquid waste.
Note: certain amounts may not total due to rounding.
• Client and new business activity:
▪ Extended service agreements at Lancaster/Harrisburg
facilities through 2032; extended anchor waste contracts at
Delaware Valley and SECONN
▪ Expanded CES footprint with 4 bolt-on acquisitions
• 2017 revenue drivers vs. 2016:
▪ Same store EfW tip fee revenue increased by
◦ EfW tip fee pricing up $14 million (2.5%)
◦ EfW tip fee volume lower by $29 million (5.3%), driven
by downtime at Fairfax
▪ Internalized profiled waste revenue up 3.5%
▪ Environmental services revenue up 24%, with 16% organic
growth
• Trends and outlook:
▪ EfW processing volume to increase by 1 million tons driven
by Dublin operations and Fairfax recovery
▪ Strong industry dynamics to support ~3% price growth
▪ Profiled waste growth to re-accelerate to ~10%
▪ Continued strong growth in environmental services
(Unaudited)
(in millions, except price) 2016A 2017A 2018E
Waste & Service Revenue:
EfW Tip Fees $551 $572 $600 - $620
EfW Service Fees 406 393 410 - 420
Environmental Services 104 129 135 - 145
Municipal Services 186 194 200
Other 36 42 40
Intercompany (96) (99) (100)
Total $1,187 $1,231 $1,285 - $1,325
EfW Tons: (1)
Tip Fee Contracted 8.4 8.0 8.6 - 8.7
Tip Fee Uncontracted 2.2 2.1 2.2
Service Fee 8.9 8.6 9.1 - 9.2
Total 19.5 18.7 19.9 - 20.1
EfW Tip Fee Revenue/Ton:
Contracted $47.39 $52.87
Uncontracted $68.95 $72.25
Average Tip Fee $51.89 $57.11 $56 - $57
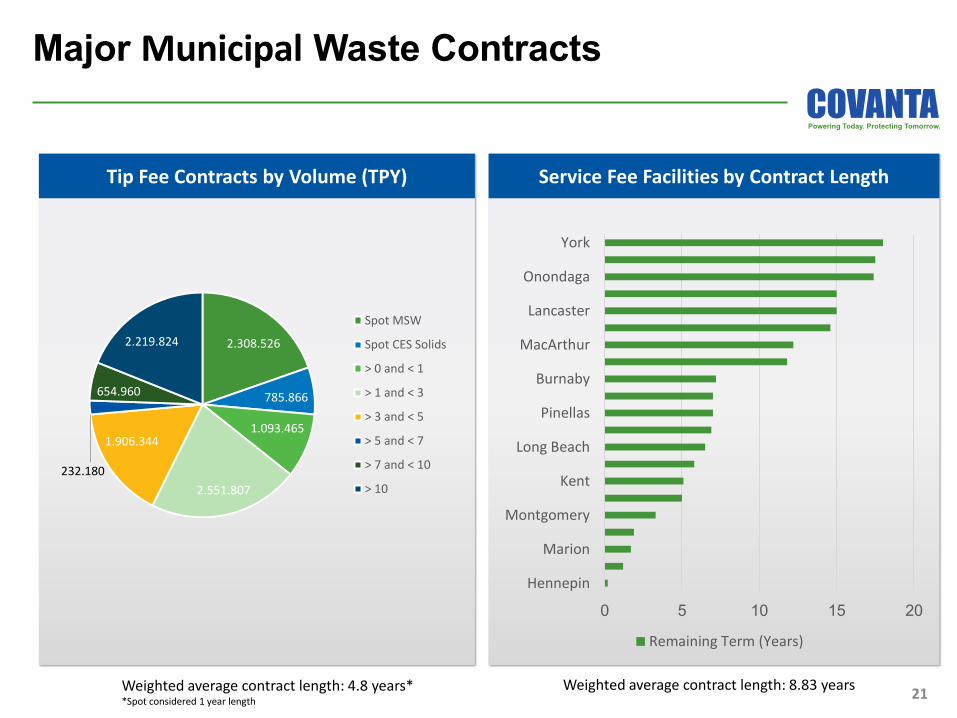
Service Fee Facilities by Contract Length
Tip Fee Contracts by Volume (TPY)
Major Municipal Waste Contracts
21
2.308.526
785.866
1.093.465
2.551.807
1.906.344
232.180
654.960
2.219.824
Spot MSW
Spot CES Solids
> 0 and < 1
> 1 and < 3
> 3 and < 5
> 5 and < 7
> 7 and < 10
> 10
0 5 10 15 20
Hennepin
Marion
Montgomery
Kent
Long Beach
Pinellas
Burnaby
MacArthur
Lancaster
Onondaga
York
Remaining Term (Years)
Weighted average contract length: 8.83 years Weighted average contract length: 4.8 years* *Spot considered 1 year length

Energy Update
22
• 2017 revenue drivers vs. 2016:
▪ Energy revenue, including capacity, down $15 million (4%)
on a same store basis
◦ Energy price down 1%
◦ Energy volume down $20 million, driven by downtime
at Fairfax
◦ Capacity revenue improved by $7 million
▪ PPA expirations, net of increased revenue share reduced
revenue by $23 million
▪ Dublin contributed $11 million in Q4
• Trends and outlook:
▪ Higher generation in 2018 to be driven by Fairfax recovery
▪ Hedge activity:
◦ 2018 market exposure reduced to 1.5 million MWh
with hedges at prices slightly below 2017 levels
◦ Beginning to reduce 2019 market exposure with
1 million MWh already hedged
▪ 2018 marks last year of legacy contract transitions until
the mid 2020's
1) Includes energy revenue from biomass plants and facilities in China.
2) Excludes capacity revenue.
Note: certain amounts may not total due to rounding.
(Unaudited)
(in millions, except price) 2016A 2017A 2018E
Energy Revenue:
Energy Sales $321 $288 $265 - $285
Capacity 40 46 50
Other (1) 9 - -
Total $370 $334 $315 - $335
MWh Sold:
Contracted 3.1 2.5 1.9 - 2.0
Hedged 1.9 2.7 3.0
Market 1.0 0.8 1.4 - 1.5
Total 6.1 6.0 6.3 - 6.5
Revenue per MWh: (2)
Contracted $65.98 $69.36 $65 - $66
Hedged $42.77 $34.92 $33
Market $31.35 $28.84 $25 - $37
Average $52.70 $48.26 $40 - $44

Recycled Metals Update
23
• 2017 revenue drivers vs. 2016:
▪ Ferrous:
◦ Price up $17 million (44%) on improved market
◦ Sales volume lower by $8 million (21%) mainly due to increased processing
▪ Non-ferrous:
◦ Realized pricing up $17 million (74%) due to improved quality from processing
◦ Sales volume lower by $6 million (25%) due to increased processing
• Trends and outlook:
▪ 2018 recovery and sales volumes to benefit from improved plant throughput and investments in non-ferrous recovery
▪ HMS averaged $317 per ton in January/February
◦ Full year outlook for $235 - $285 per ton with softening expected from current levels
▪ Full year performance of non-ferrous processing plant will further benefit 2018 realized pricing
1) 2017 and 2016 average #1 Heavy Melt Steel composite index ($ / gross ton) as published by American Metal Market.
2) 2017 and 2016 average Old Cast Aluminum Scrap ($ / pound) calculated using the high price as published by American Metal Market.
Note: certain amounts may not be totaled due to rounding.
(Unaudited) ($ in millions, except price; tons in thousands) 2016A 2017A 2018E
Metals Revenue:
Ferrous $38 $48 $45 - $55
Non-Ferrous 23 34 45 - 55
Total $61 $82 $90 - $110
Tons Recovered:
Ferrous 401 396 420 - 430
Non-Ferrous 36 38 40 - 45
Tons Sold:
Ferrous 345 302 350 - 360
Non-Ferrous 36 31 30 - 35
Revenue per Ton Sold:
Ferrous $111 $157 $135 - $165
Non-Ferrous $632 $1,088 $1,450 - $1,600
Average HMS index price (1) $197 $268 $235 - $285
Average Old Cast Aluminum (2) $0.57 $0.61 ~$0.59

Maintenance and Operating Expenses
24 Note: certain amounts may not total due to rounding.
• 2017 summary:
▪ Total EfW maintenance (expense + capex) higher year-over-
year
◦ Plant downtime required increased maintenance scope
at certain facilities
◦ 2018 maintenance activity accelerated into 2017
▪ Other plant operating expense increased due to:
◦ Dublin commencement of operations
◦ CES growth
◦ Non-ferrous processing facility operations
▪ Other operating expense included:
◦ $11 million in settlement of contract disputes
◦ $30 million in insurance recoveries, including $7 million
in Q4
• Trends and outlook:
▪ 2018 EfW maintenance spend to be similar to 2017 with
higher mix of capex
▪ Other plant operating expense expected to trend higher in
2018 due to a full year of the Dublin O&M and continued
growth in CES
▪ Expect $10 million of Fairfax business interruption insurance
recoveries in 2018
(Unaudited)
($ in millions) 2016A 2017A 2018E
Plant Maintenance Expense:
EfW $272 $302 $285 - $295
Other 6 8
Total $279 $311
Maintenance Capex:
EfW $97 $94 $105 - $115
Other 13 16 25
Total $110 $111 $130 - $140
Total EfW Maintenance Spend $369 $397 $390 - $410
Other Plant Operating Expense:
EfW $630 $650
Other 268 310
Total $898 $960
Other Operating Expense $86 $52

Growth Investment Outlook
25 1) Organic growth programs are focused primarily on growing waste, energy and metal revenue generated by our existing assets.
Note: certain amounts may not total due to rounding.
• The following items are not reflected in the 2018 outlook above:
▪ Rookery – Covanta equity commitment and timing of spend to be disclosed when project reaches financial close
▪ Ash processing – expect to spend ~$25 million on first unit once permit is received
▪ NYC MTS – expect to spend ~$35 million upon receipt of notice to proceed for Manhattan MTS
▪ Acquisitions to be targeted on an opportunistic basis – potential additional activity not reflected in FY 2018 outlook
(Unaudited, in millions)
FY 2017
Actual
FY 2018
Outlook
Organic growth investments (1) $37 ~$20
Acquisitions 17 4
Subtotal: Corporate funded $54 ~$25
Dublin facility construction 117 -
Total growth investments $171 ~$25

Long-term Outlook: Energy Detail
26 Note: hedged generation as presented above reflects only existing hedges. Certain amounts may not total due to rounding. 1) Excludes capacity revenue. Note: certain amounts may not total due to rounding
• Note: Production estimates for 2019 - 2022 are approximated based on historical operating performance and expected contract
structures
Consolidated EfW (Unaudited, in millions, except price) 2016A 2017A 2018E 2019E 2020E 2021E 2022E
MWh Sold – CVA Share:
Contracted 3.1 2.5 2.0 2.0 2.0 1.9 1.9
Hedged 1.9 2.7 3.0 1.0 — — —
Market 1.0 0.8 1.4 3.5 4.5 4.7 4.7
Total MWh Sold 6.1 6.0 ~6.4 ~6.5 ~6.5 ~6.6 ~6.6
Market Sales (MWh) by Geography:
PJM East 0.3 0.2 0.8 2.2 2.7 2.7 2.7
NEPOOL 0.2 0.2 0.2 0.7 1.2 1.2 1.2
NYISO 0.1 0.1 0.1 0.2 0.2 0.3 0.3
Other 0.4 0.3 0.4 0.4 0.4 0.4 0.4
Total Market Sales 1.0 0.8 1.5 3.5 4.5 4.7 4.7
Revenue per MWh: (1)
Contracted $65.98 $69.36 ~$66
Hedged $42.77 $34.92 ~$33
Market $31.35 $28.84 ~$31
Average Revenue per MWh $52.70 $48.26 ~$42

EfW Project Structures
Service Fee
Tip Fee Owned Operated
Number of Facilities (1) 20 4 17
% of Tons Processed ~50% ~7% ~43%
Client(s) Municipal anchor client; Merchant
capacity
Municipal anchor client; Limited
merchant capacity Municipal client
Waste or Service Revenue Pe to tippi g fee Fixed O&M fee
(Inflation escalators & incentives)
Energy Revenue Covanta retains 100% Share with client
(Covanta retains ~20% on average)
Metals Revenue Covanta retains 100% Share with client
(Covanta typically retains ~50%)
Operating Costs Covanta responsible for all operating
costs
Pass through certain costs to municipal client
(e.g., ash disposal)
Project Debt Service Covanta responsible; Debt on Covanta
books
Client pays as part of service fee; Debt
on Covanta books
Covanta not responsible; Debt not on
Covanta books
After Service Contract Expiration N/A
Covanta owns the facility; Facility
converts to Tip Fee or remains Service
Fee with new terms
Client owns the facility; Client extends
with Covanta or tenders for new
contract
1) Facilities in North America only. 27

Non-GAAP Reconciliation: Adjusted EBITDA
28 1) Adjustment for impact of adoption of FASB ASC 853 – Service Concession Arrangements.
Q4 Full Year
(Unaudited, in millions) 2016 2017 2016 2017
Net Income (Loss) $8 $131 $(4) $57
Depreciation and amortization expense 52 60 207 215
Interest expense, net 35 41 138 147
Income tax expense (benefit) 17 (186) 22 (191)
Impairment charges 1 1 20 2
Debt service billings in excess of revenue recognized 1 1 4 5
Severance and reorganization costs — — 3 1
Non-cash compensation expense 3 2 16 18
Capital type expenditures at client owned facilities (1) 10 19 39 55
(Gain) loss on asset sales (1) — (44) 6
Loss on extinguishment of debt — 71 — 84
Business development cost — 4 2 5
Property insurance recoveries — — — (2)
Other, including Other non-cash items 2 3 7 6
Total adjustments 120 16 414 351
Adjusted EBITDA $128 $147 $410 $408
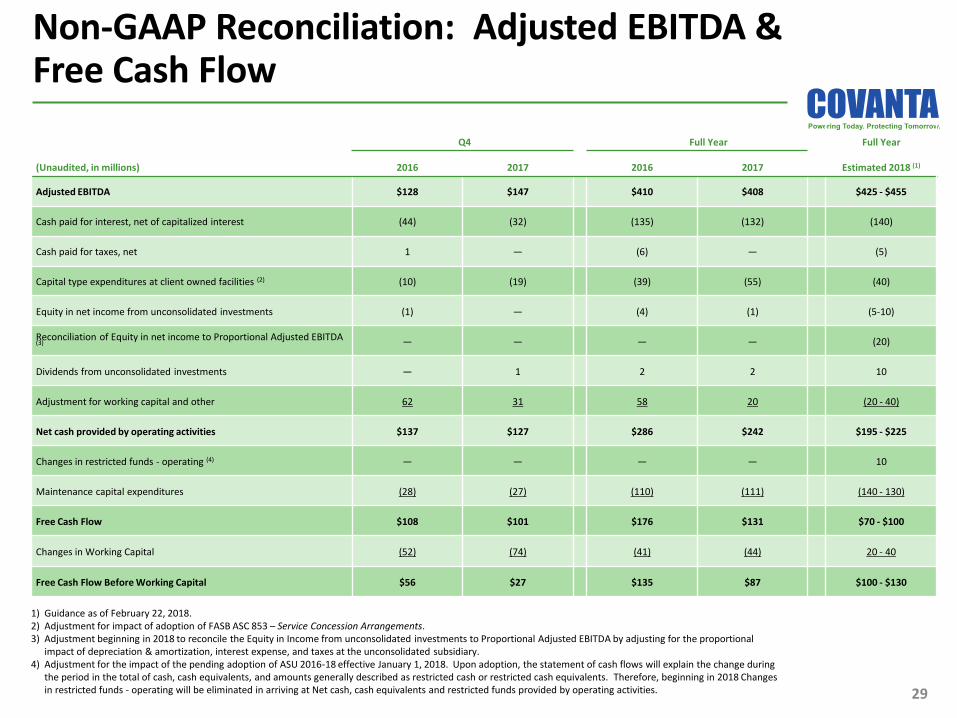
Non-GAAP Reconciliation: Adjusted EBITDA & Free Cash Flow
29
1) Guidance as of February 22, 2018.
2) Adjustment for impact of adoption of FASB ASC 853 – Service Concession Arrangements.
3) Adjustment beginning in 2018 to reconcile the Equity in Income from unconsolidated investments to Proportional Adjusted EBITDA by adjusting for the proportional
impact of depreciation & amortization, interest expense, and taxes at the unconsolidated subsidiary.
4) Adjustment for the impact of the pending adoption of ASU 2016-18 effective January 1, 2018. Upon adoption, the statement of cash flows will explain the change during
the period in the total of cash, cash equivalents, and amounts generally described as restricted cash or restricted cash equivalents. Therefore, beginning in 2018 Changes
in restricted funds - operating will be eliminated in arriving at Net cash, cash equivalents and restricted funds provided by operating activities.
Q4 Full Year Full Year
(Unaudited, in millions) 2016 2017 2016 2017 Estimated 2018 (1)
Adjusted EBITDA $128 $147 $410 $408 $425 - $455
Cash paid for interest, net of capitalized interest (44) (32) (135) (132) (140)
Cash paid for taxes, net 1 — (6) — (5)
Capital type expenditures at client owned facilities (2) (10) (19) (39) (55) (40)
Equity in net income from unconsolidated investments (1) — (4) (1) (5-10)
Reconciliation of Equity in net income to Proportional Adjusted EBITDA (3) — — — — (20)
Dividends from unconsolidated investments — 1 2 2 10
Adjustment for working capital and other 62 31 58 20 (20 - 40)
Net cash provided by operating activities $137 $127 $286 $242 $195 - $225
Changes in restricted funds - operating (4) — — — — 10
Maintenance capital expenditures (28) (27) (110) (111) (140 - 130)
Free Cash Flow $108 $101 $176 $131 $70 - $100
Changes in Working Capital (52) (74) (41) (44) 20 - 40
Free Cash Flow Before Working Capital $56 $27 $135 $87 $100 - $130

Non-GAAP Financial Measures
30
Free Cash Flow and Free Cash Flow Before Working Capital
Free Cash Flow is defined as cash flow provided by operating activities, plus changes in restricted funds - operating, less maintenance capital expenditures, which are capital
expenditures primarily to maintain our existing facilities. Free Cash Flow Before Working Capital is defined as Free Cash Flow excluding changes in working capital. We use the non-
GAAP measures of Free Cash Flow and Free Cash Flow Before Working Capital as criteria of liquidity and performance-based components of employee compensation. We use Free
Cash Flow and Free Cash Flow before Changes in Working Capital as measures of liquidity to determine amounts we can reinvest in our core businesses, such as amounts available to
make acquisitions, invest in construction of new projects, make principal payments on debt, or amounts we can return to our stockholders through dividends and/or stock
repurchases.
Adjusted EBITDA
We use Adjusted EBITDA to provide additional ways of viewing aspects of operations that, when viewed with the GAAP results provide a more complete understanding of our core
business. As we define it, Adjusted EBITDA represents earnings before interest, taxes, depreciation and amortization, as adjusted for additional items subtracted from or added to
net income including the effects of impairment losses, gains or losses on sales, dispositions or retirements of assets, adjustments to reflect the Adjusted EBITDA from our
unconsolidated investments, adjustments to exclude significant unusual or non-recurring items that are not directly related to our operating performance plus adjustments to
capital type expenses for our service fee facilities in line with our credit agreements. We adjust for these items in our Adjusted EBITDA as our management believes that these items
would distort their ability to efficiently view and assess our core operating trends. Going forward, as larger parts of our business will be conducted through unconsolidated entities
that we do not control, we will begin to adjust for our proportionate share of the entities depreciation and amortization, interest expense and taxes in order to improve
comparability to the Adjusted EBITDA of our wholly owned entities.
Our projections of the proportional contribution of our interests in the JV to our Adjusted EBITDA and Free Cash Flow are not based on GAAP net income/loss or Cash flow provided
by operating activities, respectively, and are anticipated to be adjusted to exclude the effects of events or circumstances in 2018 that are not representative or indicative of our
results of operations and that are not currently determinable. Due to the uncertainty of the likelihood, amount and timing of any such adjusting items, we do not have information
available to provide a quantitative reconciliation of projected net income/loss to an Adjusted EBITDA projection.
Adjusted EPS
Adjusted EPS excludes certain income and expense items that are not representative of our ongoing business and operations, which are included in the calculation of Diluted
Earnings Per Share in accordance with GAAP. The following items are not all-inclusive, but are examples of reconciling items in prior comparative and future periods. They would
include impairment charges, the effect of derivative instruments not designated as hedging instruments, significant gains or losses from the disposition or restructuring of
businesses, gains and losses on assets held for sale, transaction-related costs, income and loss on the extinguishment of debt and other significant items that would not be
representative of our ongoing business. We will use the non-GAAP measure of Adjusted EPS to enhance the usefulness of our financial information by providing a measure which
management internally uses to assess and evaluate the overall performance and highlight trends in the ongoing business.