Joy Western Precipitation Microdyne...
28
Transcript of Joy Western Precipitation Microdyne...
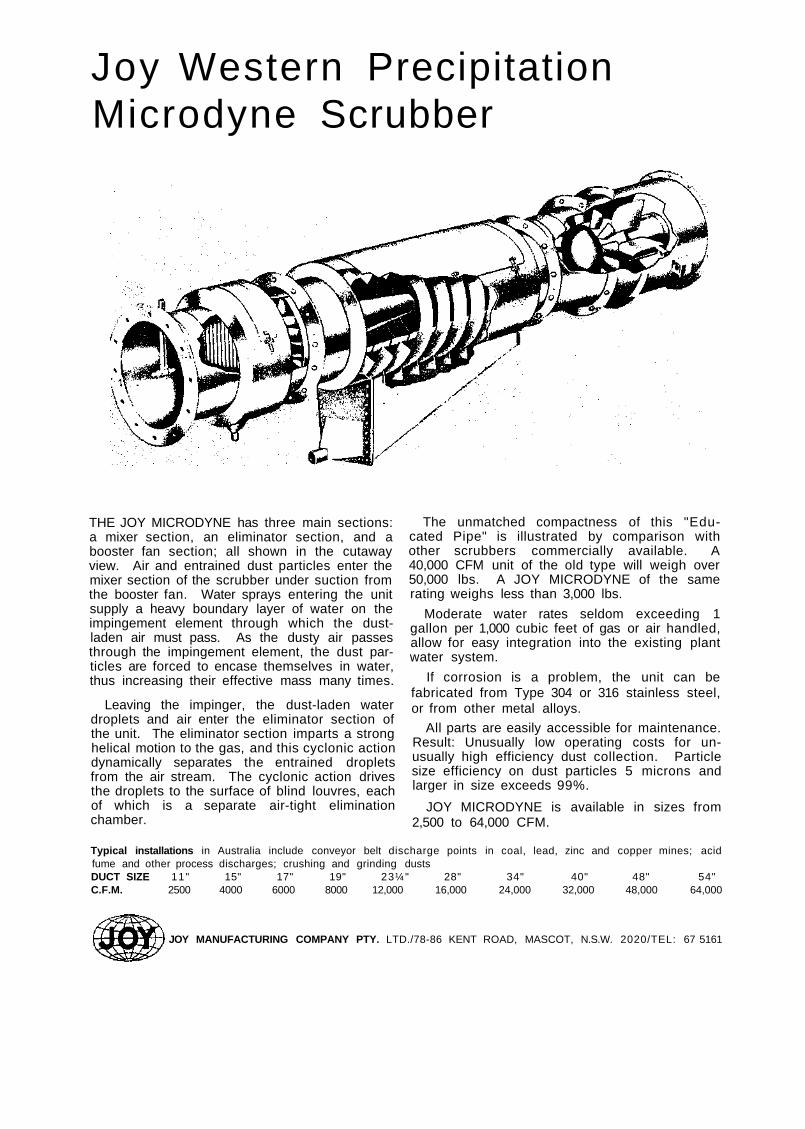
Joy Western Precipitation Microdyne Scrubber
THE JOY MICRODYNE has three main sections: a mixer section, an eliminator section, and a booster fan section; all shown in the cutaway view. Air and entrained dust particles enter the mixer section of the scrubber under suction from the booster fan. Water sprays entering the unit supply a heavy boundary layer of water on the impingement element through which the dust-laden air must pass. As the dusty air passes through the impingement element, the dust particles are forced to encase themselves in water, thus increasing their effective mass many times.
Leaving the impinger, the dust-laden water droplets and air enter the eliminator section of the unit. The eliminator section imparts a strong helical motion to the gas, and this cyclonic action dynamically separates the entrained droplets from the air stream. The cyclonic action drives the droplets to the surface of blind louvres, each of which is a separate air-tight elimination chamber.
The unmatched compactness of this "Educated Pipe" is illustrated by comparison with other scrubbers commercially available. A 40,000 CFM unit of the old type will weigh over 50,000 lbs. A JOY MICRODYNE of the same rating weighs less than 3,000 lbs.
Moderate water rates seldom exceeding 1 gallon per 1,000 cubic feet of gas or air handled, allow for easy integration into the existing plant water system.
If corrosion is a problem, the unit can be fabricated from Type 304 or 316 stainless steel, or from other metal alloys.
All parts are easily accessible for maintenance. Result: Unusually low operating costs for unusually high efficiency dust collection. Particle size efficiency on dust particles 5 microns and larger in size exceeds 99%.
JOY MICRODYNE is available in sizes from 2,500 to 64,000 CFM.
Typical installations in Australia include conveyor belt discharge points in coal, lead, zinc and copper mines; acid fume and other process discharges; crushing and grinding dusts DUCT SIZE 11" 15" 17" 19" 23¼" 28" 34" 40" 48" 54" C.F.M. 2500 4000 6000 8000 12,000 16,000 24,000 32,000 48,000 64,000
JOY MANUFACTURING COMPANY PTY. LTD./78-86 KENT ROAD, MASCOT, N.S.W. 2020/TEL: 67 5161
A Keener 'Nose' for S02 The air we have to live on is becoming more and more polluted by the by-products of industry and transport. Monitoring the level of pollution could be a step towards its control. Sulphur dioxide has long been recognised as a reliable indicator of the state of air pollution in many localities. Information about the S0 2 level in the air, as a function of place and time, could indicate, and even predict, dangerous situations. However, SO2 detectors have hitherto required too much supervision to be suitable for a large operating system.
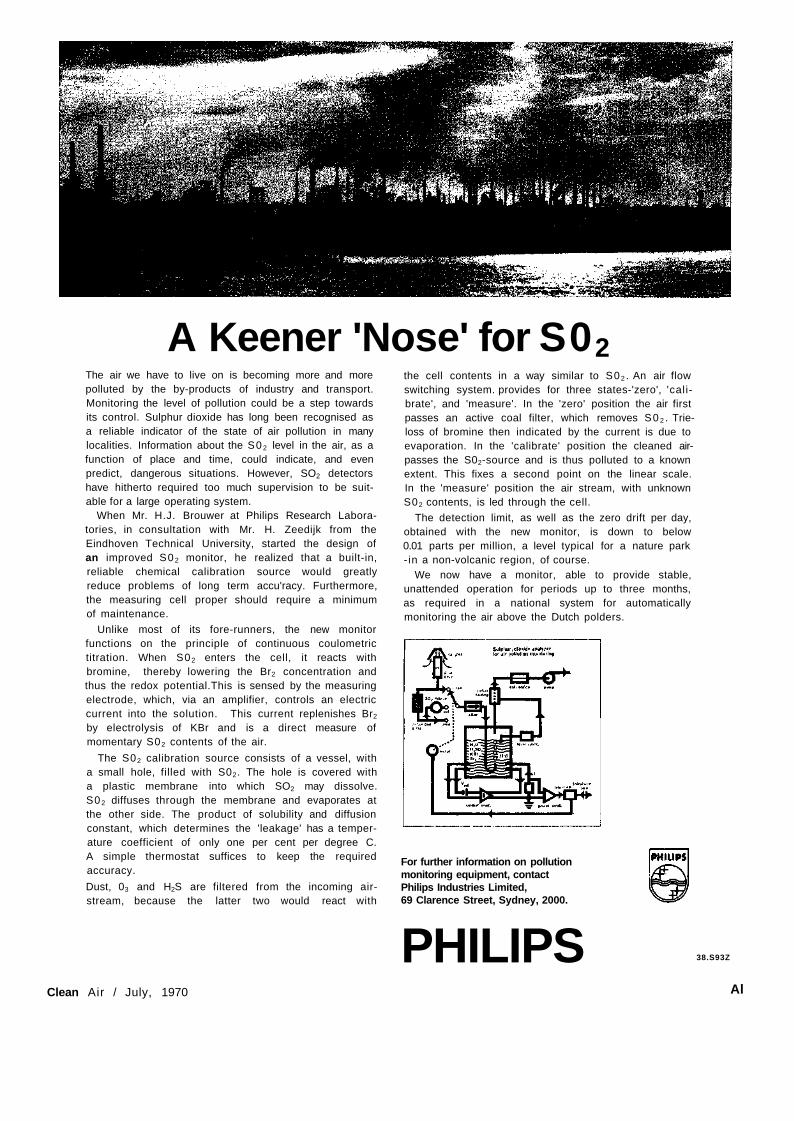
When Mr. H.J. Brouwer at Philips Research Laboratories, in consultation with Mr. H. Zeedijk from the Eindhoven Technical University, started the design of an improved S0 2 monitor, he realized that a built-in, reliable chemical calibration source would greatly reduce problems of long term accu'racy. Furthermore, the measuring cell proper should require a minimum of maintenance.
Unlike most of its fore-runners, the new monitor functions on the principle of continuous coulometric titration. When S02 enters the cell, it reacts with bromine, thereby lowering the Br2 concentration and thus the redox potential.This is sensed by the measuring electrode, which, via an amplifier, controls an electric current into the solution. This current replenishes Br2
by electrolysis of KBr and is a direct measure of momentary S02 contents of the air.
The S02 calibration source consists of a vessel, with a small hole, filled with S02. The hole is covered with a plastic membrane into which SO2 may dissolve. S02 diffuses through the membrane and evaporates at the other side. The product of solubility and diffusion constant, which determines the 'leakage' has a temperature coefficient of only one per cent per degree C. A simple thermostat suffices to keep the required accuracy.
Dust, 03 and H2S are filtered from the incoming air-stream, because the latter two would react with
the cell contents in a way similar to S0 2 . An air flow switching system. provides for three states-'zero', 'calibrate', and 'measure'. In the 'zero' position the air first passes an active coal filter, which removes S0 2 . Trie-loss of bromine then indicated by the current is due to evaporation. In the 'calibrate' position the cleaned air-passes the S02-source and is thus polluted to a known extent. This fixes a second point on the linear scale. In the 'measure' position the air stream, with unknown S02 contents, is led through the cell.
The detection limit, as well as the zero drift per day, obtained with the new monitor, is down to below 0.01 parts per million, a level typical for a nature park - in a non-volcanic region, of course.
We now have a monitor, able to provide stable, unattended operation for periods up to three months, as required in a national system for automatically monitoring the air above the Dutch polders.
For further information on pollution monitoring equipment, contact Philips Industries Limited, 69 Clarence Street, Sydney, 2000.
PHILIPS 38.S93Z
Clean Air / July, 1970 Al
Fully automated
Air Pollutants analysis is now a reality. . .
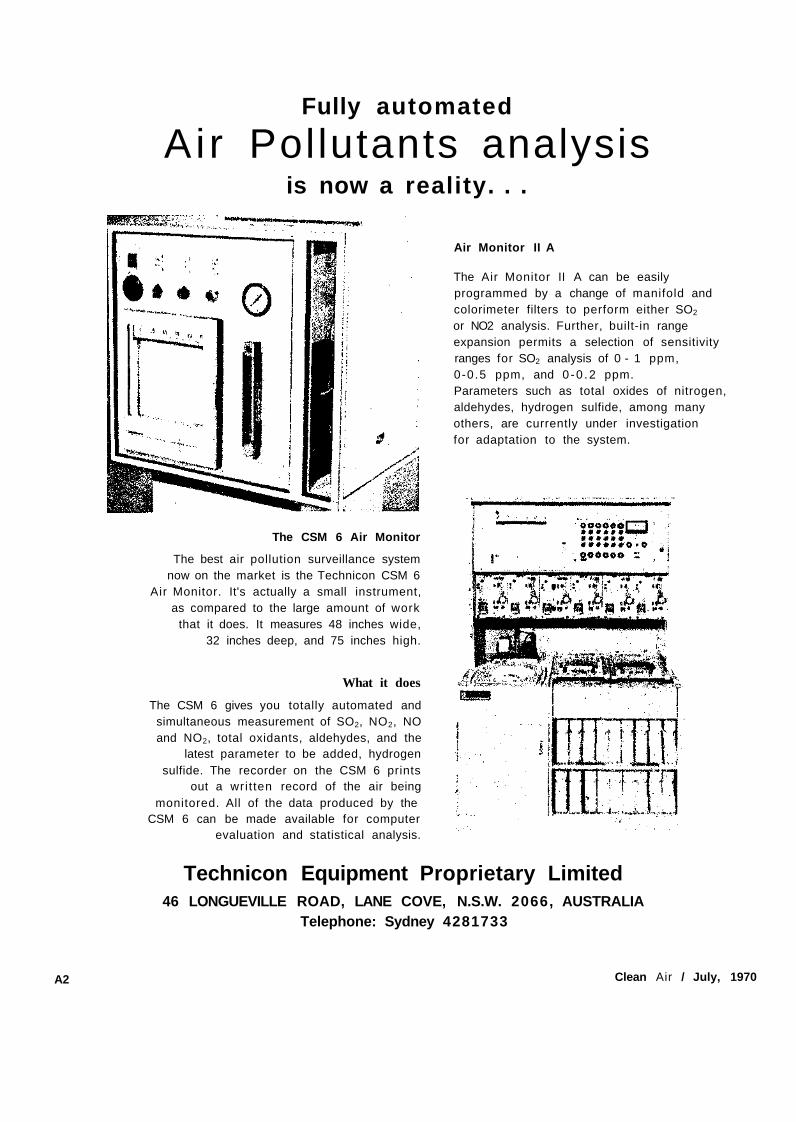
The CSM 6 Air Monitor
The best air pollution surveillance system now on the market is the Technicon CSM 6
Air Monitor. It's actually a small instrument, as compared to the large amount of work
that it does. It measures 48 inches wide, 32 inches deep, and 75 inches high.
What it does
The CSM 6 gives you totally automated and simultaneous measurement of SO2, NO2, NO and NO2, total oxidants, aldehydes, and the
latest parameter to be added, hydrogen sulfide. The recorder on the CSM 6 prints
out a wri t ten record of the air being monitored. All of the data produced by the
CSM 6 can be made available for computer evaluation and statistical analysis.
Air Monitor II A
The Air Monitor II A can be easily programmed by a change of manifold and colorimeter filters to perform either SO2
or NO2 analysis. Further, built-in range expansion permits a selection of sensitivity ranges for SO2 analysis of 0 - 1 ppm, 0-0.5 ppm, and 0 -0 .2 ppm. Parameters such as total oxides of nitrogen, aldehydes, hydrogen sulfide, among many others, are currently under investigation for adaptation to the system.
Technicon Equipment Proprietary Limited 46 LONGUEVILLE ROAD, LANE COVE, N.S.W. 2066, AUSTRALIA
Telephone: Sydney 4281733
A2 Clean Air / July, 1970
HANSSON DUST AND FUME EXTRACTORS
DUST AND FUME COLLECTION Dust and fume is generated in many forms. Some have a nuisance value while others, especially those generated in iron and steel foundries, machine tools, etc., have proved toxic properties. Dust or fume collection presents three main aspects, either collection to regain material lost during process or to remove the harmful products generated during operation, and saves machine tools from damage to bearings and slides, etc.
It has been established with reasonable certainty that silicious dust particles of size-range 0.2 to 5 microns cause respiratory disease when inhaled by power-tool operators. This collection may be made either by general room ventilation or by hoods adjacent to the work bench, or by collection at source.
An interesting note on the efficiency of the first two methods may be made here by comparison of the rate of fall of special particles of different sizes. A particle of 0.5 micron size has a terminal velocity of .001 c.m.s. per second in still air, while a particle of 10 micron size i nc reases the rate to 0.3 c.m.s. per second, and the rate of a 20 micron particle raises to 1.2 c.m.s. per second.
It will thus be seen that the small harmful particles dispersed in the normal air currents encountered in factories or foundries, may well remain in suspension for very long periods. If these particles are collected at source, such a condition cannot occur, and it is now generally accepted by authorities on dust that collection at source is the best method.
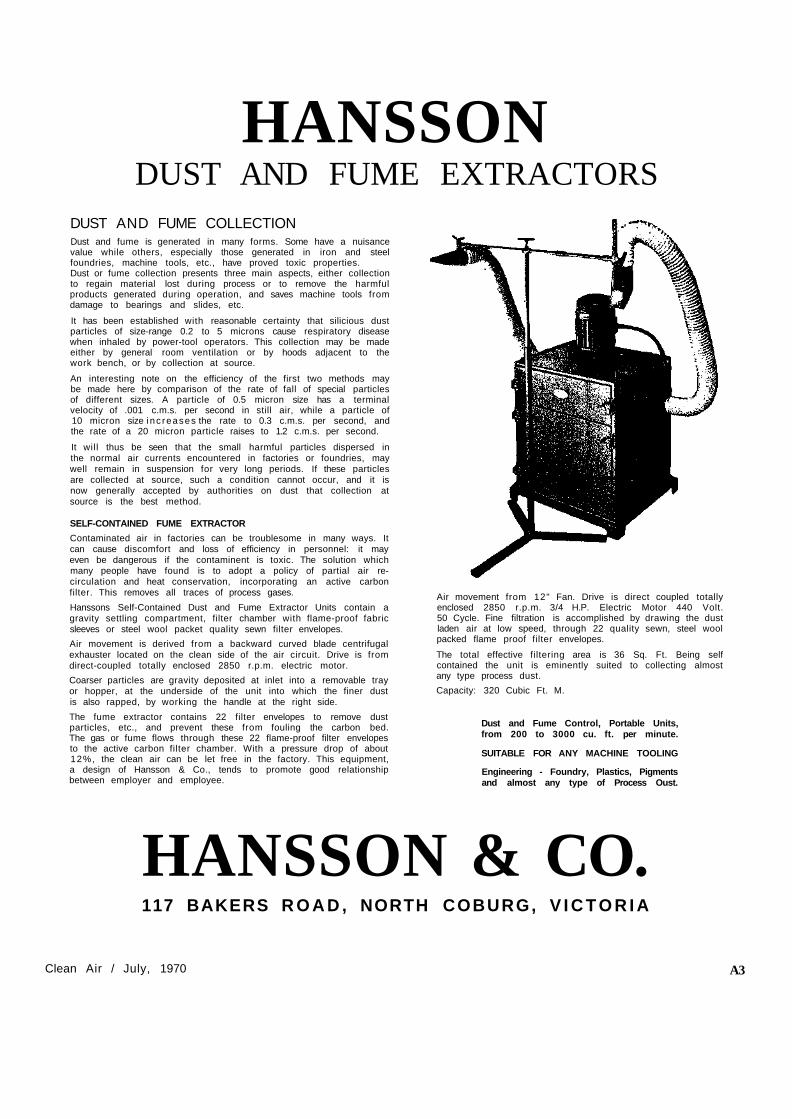
SELF-CONTAINED FUME EXTRACTOR
Contaminated air in factories can be troublesome in many ways. It can cause discomfort and loss of efficiency in personnel: it may even be dangerous if the contaminent is toxic. The solution which many people have found is to adopt a policy of partial air recirculation and heat conservation, incorporating an active carbon filter. This removes all traces of process gases.
Hanssons Self-Contained Dust and Fume Extractor Units contain a gravity settling compartment, filter chamber with flame-proof fabric sleeves or steel wool packet quality sewn filter envelopes.
Air movement is derived from a backward curved blade centrifugal exhauster located on the clean side of the air circuit. Drive is from direct-coupled totally enclosed 2850 r.p.m. electric motor.
Coarser particles are gravity deposited at inlet into a removable tray or hopper, at the underside of the unit into which the finer dust is also rapped, by working the handle at the right side.
The fume extractor contains 22 filter envelopes to remove dust particles, etc., and prevent these from fouling the carbon bed. The gas or fume flows through these 22 flame-proof filter envelopes to the active carbon filter chamber. With a pressure drop of about 12%, the clean air can be let free in the factory. This equipment, a design of Hansson & Co., tends to promote good relationship between employer and employee.
Air movement from 12" Fan. Drive is direct coupled totally enclosed 2850 r.p.m. 3/4 H.P. Electric Motor 440 Volt. 50 Cycle. Fine filtration is accomplished by drawing the dust laden air at low speed, through 22 quality sewn, steel wool packed flame proof filter envelopes.
The total effective filtering area is 36 Sq. Ft. Being self contained the unit is eminently suited to collecting almost any type process dust.
Capacity: 320 Cubic Ft. M.
Dust and Fume Control, Portable Units, from 200 to 3000 cu. ft. per minute.
SUITABLE FOR ANY MACHINE TOOLING
Engineering - Foundry, Plastics, Pigments and almost any type of Process Oust.
HANSSON & CO. 117 BAKERS R O A D , NORTH COBURG, V I C T O R I A
Clean Air / July, 1970 A3

Tilghman Wheelabrator Dust and Fume
Control Equipment engineered for efficiency and
economy
A4 Clean A i r / Ju ly , 1970

Birrus Suction Conveying Systems Eliminate Causes of Air Pollution in Indus t ry
Granular and powdered materials may be conveyed, handled or reclaimed by suction in metal or P.V.C. pipes. The fact that the system is below atmospheric pressure prevents any source of dust. The line diagram shows a typical system; the controls are not shown. Controls may be manual by sight glasses, automatic with level sensing devices or an electronic memory device to fill process hoppers in the order in which they become empty. Valve actuation may be pneumatic, hydraulic or mechanical with servo motor. Such a system may be extended by further inlets on the dust filter and further interceptor hoppers to reclaim valuable or poisonous materials, or to vacuum clean the factory.
• We make systems for conveying foods, plastics, garments, sand, metal swarf, cement, plaster, carbon black, oxides of zinc, lead, etc.
• Similar suction units are used to clean out low pressure dust collector filters.
• Fixed pipe vacuum cleaning systems can overcome pollution and save product.
• We supply road tankers for transport of powders and granules without loss or contamination. These are fitted with blowers for unloading.
• Birrus suction systems may be used to separate fines from useable material in foundry sand, blasting shot, etc. • Birrus range of exhauster/blowers are used to fluidize powders in hoppers, air slides or fluidized bed processes, and for passing
gasses through liquids.
For further information or a quotation on a system for your particular needs, contact —
RUSDEN BIRRELL & CO. PTY. LTD.
AIR POLLUTION CONTROL EQUIPMENT THE MIKRO-PULSAIR
a unit for every dust recovery or dust control application . . .
Reverse jet action • No moving parts
There is no dust recovery job too big for the Modular Mikro-Pulsaire because there is no limit to its filtering capacity. Units are designed in precision sections which are combined as required to meet any CFM specification. Knocked-down, they are economical to ship, and all parts are manufactured for simple alignment and speedy assembly at the site. Applicable throughout the processing industries, the Modular Mikro-Pulsaire is designed to vent all types of particle reduction equipment, spray dryers, separators, calciners, mixers, packaging machinery, mechanical conveyors, carloading operations, and many other dust generating sources. The Modular Mikro-Pulsaire is available with 6 or 8 ft . filter tubes and can be equipped with screw conveyor for continuous discharge at one point through a Mikro-Airlock. Available in the smaller round or square standard units.
ALSO AVAILABLE —
MANCUNA VACUUM VALVE —ELECTROSTATIC PRECIPITATORS — GAS SCRUBBERS
Supplied and manufactured under exclusive licence from Pulverizing Machinery, Division of Slick Industrial Company,
Summit, New Jersey, U.S.A., by
INDUSTRIAL ENGINEERING LIMITED CHEMICAL PLANT & ENGINEERING LTD. DIVISION
CONSULTATION
• INSTALLATION
• FABRICATION
• DESIGN
• PILOT TESTING
• COMMISSIONING
THE MODULAR MIKRO-PULSAIRE
Head Office: 97 FRANKLIN ST., MELBOURNE, 3000
Postal Address: G.P.O. Box 1700P, Melbourne, 3000 Telephone: 34-9311 — Telex: IEL AA 30756
New South Wales Office: 288 PARRAMATTA ROAD, AUBURN, N.S.W.
Postal Address: Box 85, P.O., Auburn, N.S.W. Telephone: 648-2144 — Telex: IEL AA 20818
Also represented in WEST AUSTRALIA 9 QUEENSLAND TASMANIA • SOUTH AUSTRALIA
• NEW ZEALAND
Clean Air / July, 1970 A5
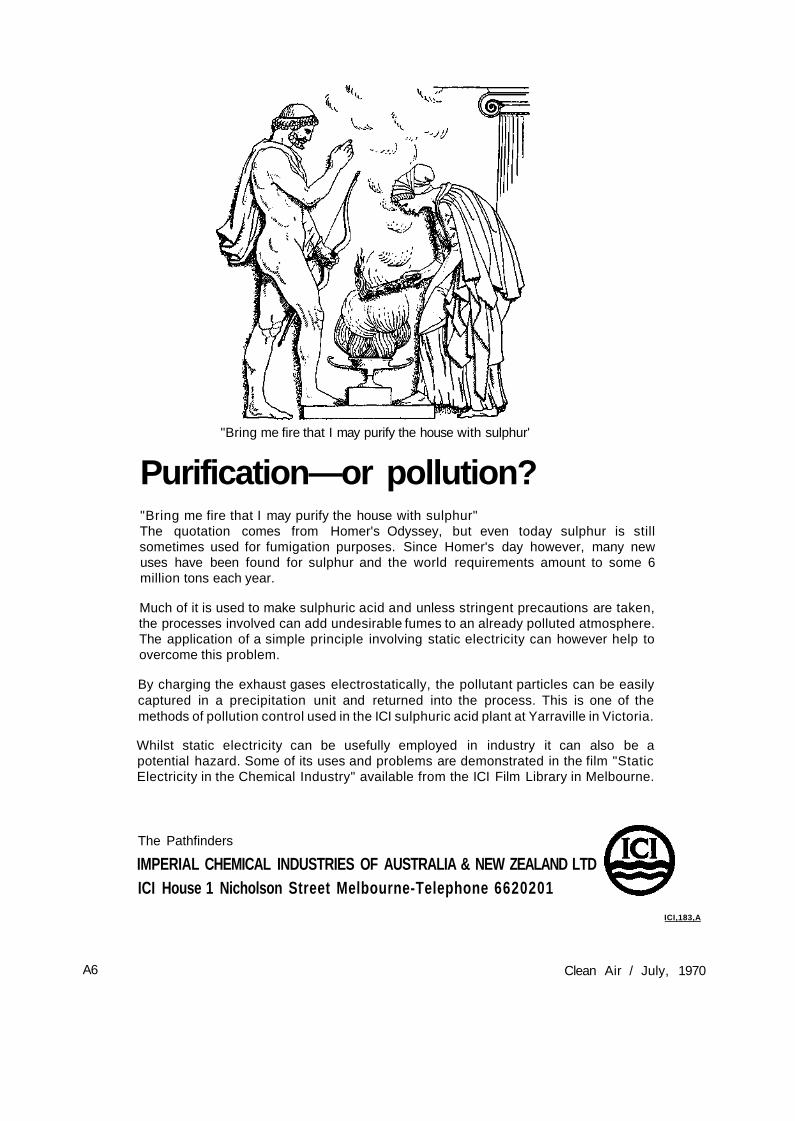
"Bring me fire that I may purify the house with sulphur'
Purification—or pollution? "Bring me fire that I may purify the house with sulphur" The quotation comes from Homer's Odyssey, but even today sulphur is still sometimes used for fumigation purposes. Since Homer's day however, many new uses have been found for sulphur and the world requirements amount to some 6 million tons each year.
Much of it is used to make sulphuric acid and unless stringent precautions are taken, the processes involved can add undesirable fumes to an already polluted atmosphere. The application of a simple principle involving static electricity can however help to overcome this problem.
By charging the exhaust gases electrostatically, the pollutant particles can be easily captured in a precipitation unit and returned into the process. This is one of the methods of pollution control used in the ICI sulphuric acid plant at Yarraville in Victoria.
Whilst static electricity can be usefully employed in industry it can also be a potential hazard. Some of its uses and problems are demonstrated in the film "Static Electricity in the Chemical Industry" available from the ICI Film Library in Melbourne.
The Pathfinders
IMPERIAL CHEMICAL INDUSTRIES OF AUSTRALIA & NEW ZEALAND LTD ICI House 1 Nicholson Street Melbourne-Telephone 6620201
ICI,183,A
A6 Clean Air / July, 1970
VOL. 4 / No. 2 / JULY, 1970
EDITOR W. Strauss
ART DIRECTOR Stuart Byfleld
ASSISTANT EDITOR J. R. Alonso
EDITORIAL BOARD W. H. Cock H. Hartmann J. Maher N. Hawthorn
EDITORIAL OFFICE Department of Industrial Science, University of Melbourne, Parkville, V i c , 3052, Australia.
The journal is published quarterly, in March, June, September, and December.
Manuscripts of original papers in the area of Air Pollution, its measurement, effects and control should be sent to the Editor.
Annual Subscription rates ( inc. postage) for non-members and libraries: Australia SA2.50 U.S.A. $US3.50 U.K. £S1.10.0 Elsewhere $A3.50 Single copies 0.75 cents.
Subscriptions and Subscription enquiries should be directed to the Circulation Manager, Mr. W. H. Cock, 151 Northern Road, Heidelberg, V i c , 3081, Australia.
ADVERTISING H. E. Pett & Co., 29 Crossley Street, Melbourne, 3000.
Clean Air is the Journal of the Clean Air Society of Australia and New Zealand.
Page
PRESIDENT'S MESSAGE J.G. Schroder
TECHNICAL PAPERS
The Systems Approach to Air Pollution, Arthur C. Stern (Part 1 )
Olfaction and Air Pollution, Herbert E. Heist, Bruce D. Mulvaney
Introduction of Natural Gas in Victoria, H.F. Hartmann
FEATURES
26
27
34
38
Meetings of the Branches: New Zealand New South Wales Victoria
Forthcoming Conferences: Fourth Australian Ceramic Conference The Way to Air Pollution Control
Book Review: Air Pollution Engineering
26 42 42
37 37
42
Clean Air / July, 1970 25

PRESIDENT'S MESSAGE The Population — Pollution Syndrome
Man, by harnessing natural energy sources, has created a situation where he is on a collision course with his environment, unless he becomes a more skillful navigator than he has been in the past. Our population explosion is coupled with man's insatiable appetite for energy. This results in the conversion of millions of acres each year from parkland to asphalt as well as the moving of mountains, creating lakes and altering the flow of rivers.
This requires the muscle provided by the combustion of fossilized fuels which discharge their pollutants to the atmosphere. While Thomas Mal-thus in 1798 correctly predicted our current population dilemma he did not envisage our enormous conversion of hydrocarbons into energy and carbon dioxide, which by the year 2000 is estimated as being at 250 times the 1900 rate.
The trend in Australian urban conditions is towards more pollution, and if there is no change in philosophy we will find ourselves in a position where
MEETINGS OF THE BRANCHES New Zealand Branch
The first Annual General Meeting was held at Caltex House, Fanshawe St., Auckland, on Wednesday, 25th February 1970, at 7.45 p.m. There was an attendance of some 80 members from Auckland and Wellington, and we were very pleased to welcome Dr. W. Strauss from the Victorian Branch who was later to address members and the fifty visitors present.
Officers elected for the year ending December 31, 1970 were as follows:
President: Mr. J. E. Fitzgerald, Borough Engineer, Mt. Wellington Borough Council, Auckland.
Vice-President: Mr. D. M. Walter, Chief Chemist, Caltex Oil N.Z. Ltd., Wellington.
Secretary-Treasurer: Mr. A. W. Skam, Executive Officer, Auckland Industrial Development Division, Department of Scientific & Industrial Research, Auckland.
Committee Members: Mr. L. E. Buckley, Manager, Furnace and Re-factories Contract Division, Lynn Potteries Ltd., Auckland. Mr. E. L. G. Clist, Chief City Inspector, City of Manukau, Auckland. Dr. J. F. de Lisle, Assistant Director (Research), N.Z., Meteorological Service, Wellington.
it becomes extremely expensive to turn the clock back and reverse this trend.
However, that this is not impossible can be demonstrated by the fact that in the last 15 years the dust fall out in Sydney has dropped from 25 tons per square mile per month to under 15 tons per square mile per month. To a large extent this trend can be attributed to the reduction in the quantity of coal burnt in the city's power stations — from 42,000 tons/ week in 1956 to 7000 tons/week in June 1969 — as well as the addition of precipitators to boilers.
A disturbing trend is the increase of sulphur dioxide in Sydney's industrial and commercial suburbs as shown in recently released statistics by the N.S.W. Department of Health. Since 1965 the measured annual average has more than doubled. This increase is coincident with the consumption of indigenous crude oil in Australia. While Australian crude oil, being a light crude, is very suitable for petroleum production, there are insufficient heavy ends to produce furnace oils. This shortage is being replaced from Middle East crudes which contain over 3% sulphur whereas Australian and Indonesian crude oils contain much less than 1% sulphur.
Countries such as Japan and the
Mr. R. T. Douglas, Chief Chemical Inspector, Department of Health, Wellington. Mr. H. E. Evans, District Electrical Engineer, N.Z. Electricity Department, Auckland. Mr. D. J. Higgins, Works Superintendent, Fertiliser Division, Kempthorne Prosser & Co. Ltd., Christchurch. Dr. J. Rogers, Director, N.Z. Fertiliser Manufacturers' Research Association (Inc.), Auckland. Mr. N. G. Thorn, Chemical Inspector, Department of Health, Auckland.
There was some discussion on the types and frequency of the programme for the year and it was suggested that one of these could be held in some other centre, say Wellington, perhaps in collaboration with one or more other technical group such as the Royal Society of N.Z., Technology Section, and the Institute of Fuel (N.Z. Group). Dr. Strauss commented on the frequency and types of programmes arranged in Victoria, and after some discussion, the Chairman said that all of the helpful comments made would be considered by the Committee when planning the year's activities.
At the conclusion of the formal business, Dr. W. Strauss of the Industrial Science Department, University of Melbourne, gave an address on "Air Pollution and the Environment." He emphasised that pollution, and in particular, air pollution, is the most
U.S.A. are legislating to reduce the sulphur content of furnace oils and one wonders whether by not legislating similarly against high sulphur oils Australia will become a dumping ground for sour residuals. It is possible to remove the sulphur from crude oil (and residual fractions) but this increases costs. We should ask ourselves whether we are prepared to put up with the increase in the sulphur dioxide content of our urban atmosphere or whether we are prepared to pay the cost of removal of this. The longer we defer action the more costly will become the cure.
The main danger to Australian cities is complacency. We are inclined to regard levels of pollution that have occurred overseas as not being possible here. But if something is not done to reverse the present trends, we will find ourselves in a similar situation to cities in Europe and America. It becomes extremely expensive to turn the clock back.
The Clean Air Society of Australia and New Zealand believes that the time for action is now. We believe now is the time for the oil industry, the electricity industry, the motor industry and our political leaders to follow the leads set by countries who have experienced the plague of pollution.
J. G. SCHRODER
serious problem facing civilized man. It is a result of the increasing demand for the amenities of our urban environment and the good things in life.
The reduction of air pollution to acceptable levels requires that every source has to be controlled. Thus motor car exhausts, industrial waste gases and domestic air pollution will have to be minimised. This will require decisions of social as well as environmental consequences. We may have to reduce our demand, and increase costs to achieve a worthwhile environment.
The control of pollution from a major source — the generation of electricity from oil — was discussed in detail. The problems involve site selection, the development of suitable processes for preventing pollution, particularly sulphur dioxide, and the possibility of alternative advanced power systems such as the high temperature fuel cell.
At the conclusion of his address, Dr Strauss answered several questions from members after which a vote of thanks to the speaker was carried with acclamation.
Supper, generously provided by the management of Caltex Oil N.Z. Ltd., concluded a most interesting and informative programme.
(Continued on page 42)
26 Clean Air / July, 1970
Arthur C. Stern THE SYSTEMS APPROACH TO ASR POLLUTION CONTROL (PART 1)
Professor Stern is Professor of Air Hygiene, Department of Environmental Sources and Engineering, School of Public Health, University of North Carolina, Chapel Hill, N.C., 27514, U.SA
This paper was presented at the Sydney Clean Air Conference, May, 1969.
Introduction: The systems approach means the application of the principles of systems analysis, systems engineering or operations research to the problem at hand. Although there are shades of difference implicit in these three disciplines, they so overlap and the techniques employed are so similar that, from our point of view, they are but different names for the same thing, thing.
The classical systems approach to a problem (1) is to first structure the real situation into a model; then give the model a graphic or mathematical form; effect a graphical or mathematical solution that optimizes the value or values used as measures of success; test the validity of the solution; and, finally, apply the solution to the problem.
The starting point for the systems approach is the formulation of the problem to be studied and solved. If the problem is incorrectly or incompletely stated, the solution obtained will be the right solution for the wrong problem, and its application may cause more harm than good.
Modelling Block diagrams and linear programming are the common tools of the systems analyst. However he does not give them sole reliance. The better the systems analyst, the more likely he is to by-pass these procedures when other descriptive, statistical, logical or intuitive approaches are more likely to best explore and explain a system.
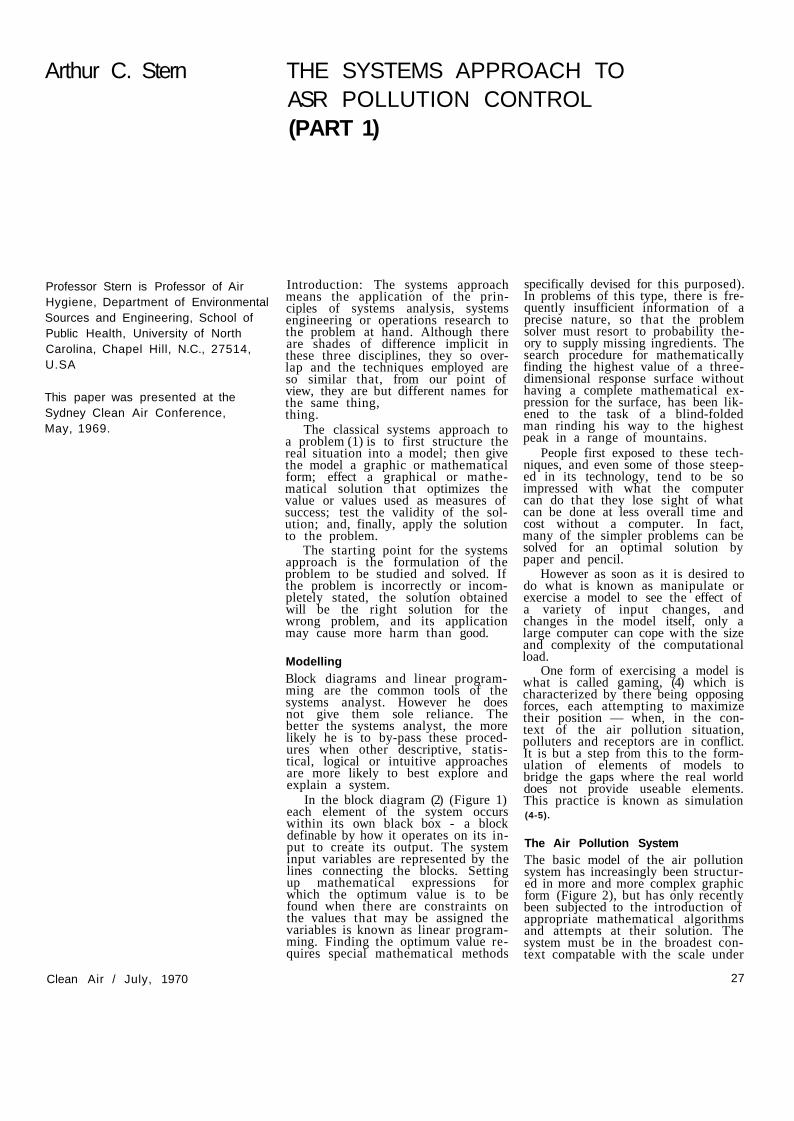
In the block diagram (2) (Figure 1) each element of the system occurs within its own black box - a block definable by how it operates on its input to create its output. The system input variables are represented by the lines connecting the blocks. Setting up mathematical expressions for which the optimum value is to be found when there are constraints on the values that may be assigned the variables is known as linear programming. Finding the optimum value requires special mathematical methods
specifically devised for this purposed). In problems of this type, there is frequently insufficient information of a precise nature, so that the problem solver must resort to probability theory to supply missing ingredients. The search procedure for mathematically finding the highest value of a three-dimensional response surface without having a complete mathematical expression for the surface, has been likened to the task of a blind-folded man rinding his way to the highest peak in a range of mountains.
People first exposed to these techniques, and even some of those steeped in its technology, tend to be so impressed with what the computer can do that they lose sight of what can be done at less overall time and cost without a computer. In fact, many of the simpler problems can be solved for an optimal solution by paper and pencil.
However as soon as it is desired to do what is known as manipulate or exercise a model to see the effect of a variety of input changes, and changes in the model itself, only a large computer can cope with the size and complexity of the computational load.
One form of exercising a model is what is called gaming, (4) which is characterized by there being opposing forces, each attempting to maximize their position — when, in the context of the air pollution situation, polluters and receptors are in conflict. It is but a step from this to the formulation of elements of models to bridge the gaps where the real world does not provide useable elements. This practice is known as simulation (4-5).
The Air Pollution System The basic model of the air pollution system has increasingly been structured in more and more complex graphic form (Figure 2), but has only recently been subjected to the introduction of appropriate mathematical algorithms and attempts at their solution. The system must be in the broadest context compatable with the scale under
Clean Air / July, 1970 27
study. By the scale of the system is meant the universe for which an optimal solution is sought. That universe may be a process, a plant, a corporation or an industry; a region, a city, a state, a country, a continent or the world. The larger the universe, the more complex the system and the less likely the development of a workable model.
The Global System
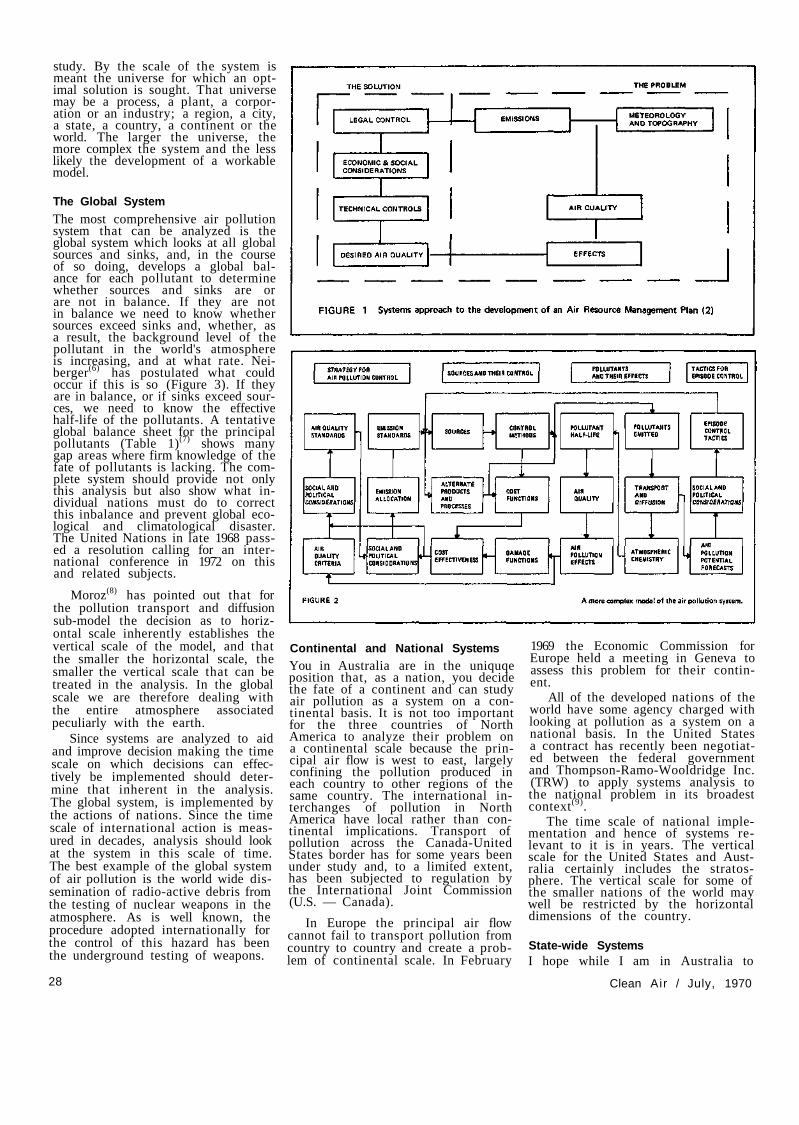
The most comprehensive air pollution system that can be analyzed is the global system which looks at all global sources and sinks, and, in the course of so doing, develops a global balance for each pollutant to determine whether sources and sinks are or are not in balance. If they are not in balance we need to know whether sources exceed sinks and, whether, as a result, the background level of the pollutant in the world's atmosphere is increasing, and at what rate. Nei-berger(6) has postulated what could occur if this is so (Figure 3). If they are in balance, or if sinks exceed sources, we need to know the effective half-life of the pollutants. A tentative global balance sheet for the principal pollutants (Table 1)(7) shows many gap areas where firm knowledge of the fate of pollutants is lacking. The complete system should provide not only this analysis but also show what individual nations must do to correct this inbalance and prevent global ecological and climatological disaster. The United Nations in late 1968 passed a resolution calling for an international conference in 1972 on this and related subjects.
Moroz(8) has pointed out that for the pollution transport and diffusion sub-model the decision as to horizontal scale inherently establishes the vertical scale of the model, and that the smaller the horizontal scale, the smaller the vertical scale that can be treated in the analysis. In the global scale we are therefore dealing with the entire atmosphere associated peculiarly with the earth.
Since systems are analyzed to aid and improve decision making the time scale on which decisions can effectively be implemented should determine that inherent in the analysis. The global system, is implemented by the actions of nations. Since the time scale of international action is measured in decades, analysis should look at the system in this scale of time. The best example of the global system of air pollution is the world wide dissemination of radio-active debris from the testing of nuclear weapons in the atmosphere. As is well known, the procedure adopted internationally for the control of this hazard has been the underground testing of weapons.
Continental and National Systems You in Australia are in the uniquqe position that, as a nation, you decide the fate of a continent and can study air pollution as a system on a continental basis. It is not too important for the three countries of North America to analyze their problem on a continental scale because the principal air flow is west to east, largely confining the pollution produced in each country to other regions of the same country. The international interchanges of pollution in North America have local rather than continental implications. Transport of pollution across the Canada-United States border has for some years been under study and, to a limited extent, has been subjected to regulation by the International Joint Commission (U.S. — Canada).
In Europe the principal air flow cannot fail to transport pollution from country to country and create a problem of continental scale. In February
1969 the Economic Commission for Europe held a meeting in Geneva to assess this problem for their continent.
All of the developed nations of the world have some agency charged with looking at pollution as a system on a national basis. In the United States a contract has recently been negotiated between the federal government and Thompson-Ramo-Wooldridge Inc. (TRW) to apply systems analysis to the national problem in its broadest context(9).
The time scale of national implementation and hence of systems relevant to it is in years. The vertical scale for the United States and Australia certainly includes the stratosphere. The vertical scale for some of the smaller nations of the world may well be restricted by the horizontal dimensions of the country.
State-wide Systems I hope while I am in Australia to
28 Clean Air / July, 1970
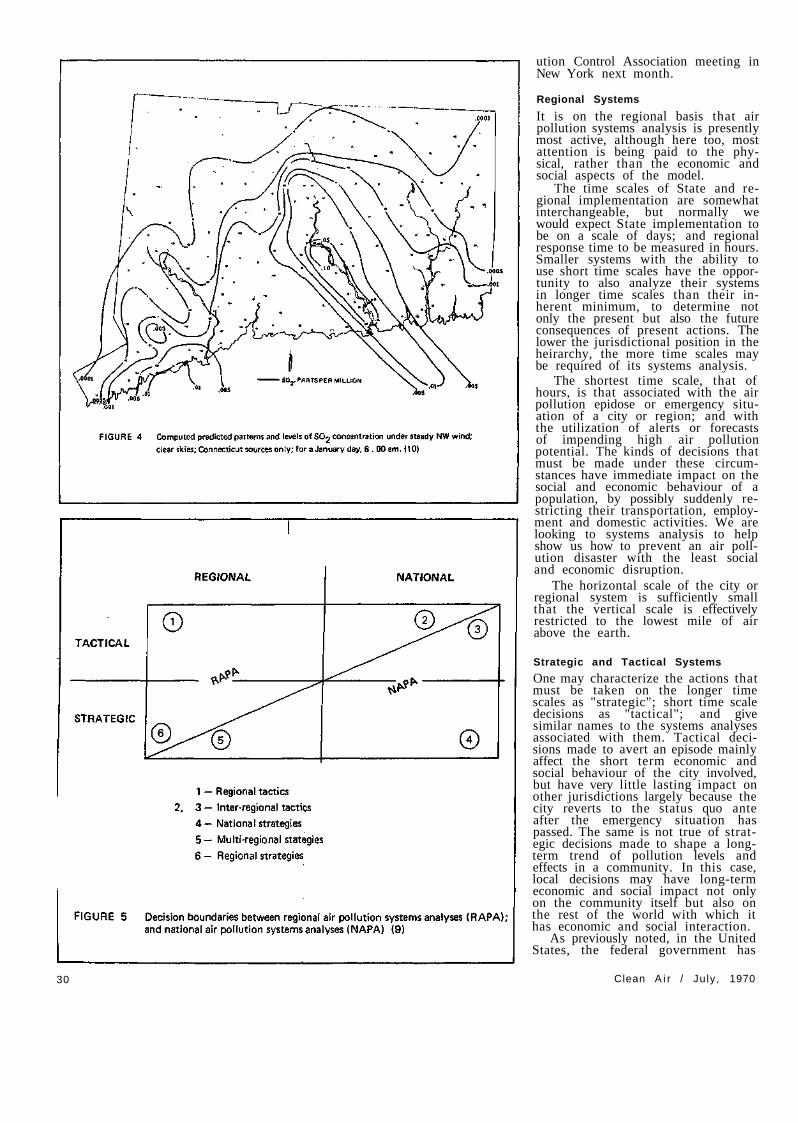
learn the extent that you are applying these analytical tools on a Statewide scale. In the United States, most of our States are assembling the kinds of data that would form input for systems analyses, but have yet to make such application in a structured analytical model. One state that has done so is Connecticut, a relatively small state on the Atlantic Coast in the north-eastern portion of our country. The Connecticut Research, Commission, with federal financial assistance granted funds to the Travellers Research Centre for the development of a simulation model of air pollution over Connecticut. The model for the physical aspects of the problem was completed in 1967(10). Some results are shown in Figure 4. The report of the project concludes: "The social and economic consequences of air pollution and of measures to control air pollution are also part of the total air pollution problem. Extension of these studies into these realms is a logical and necessary step along the way to a complete and fully operational air pollution information system." In 1968 additional funds were awarded for verification, refinement and reprogramming this model for greater computer efficiency. A preliminary report of this work is scheduled for presentation at the Air Poll-
Clean Air / July, 1970 29
ution Control Association meeting in New York next month.
Regional Systems
It is on the regional basis that air pollution systems analysis is presently most active, although here too, most attention is being paid to the physical, rather than the economic and social aspects of the model.
The time scales of State and regional implementation are somewhat interchangeable, but normally we would expect State implementation to be on a scale of days; and regional response time to be measured in hours. Smaller systems with the ability to use short time scales have the opportunity to also analyze their systems in longer time scales than their inherent minimum, to determine not only the present but also the future consequences of present actions. The lower the jurisdictional position in the heirarchy, the more time scales may be required of its systems analysis.
The shortest time scale, that of hours, is that associated with the air pollution epidose or emergency situation of a city or region; and with the utilization of alerts or forecasts of impending high air pollution potential. The kinds of decisions that must be made under these circumstances have immediate impact on the social and economic behaviour of a population, by possibly suddenly restricting their transportation, employment and domestic activities. We are looking to systems analysis to help show us how to prevent an air pollution disaster with the least social and economic disruption.
The horizontal scale of the city or regional system is sufficiently small that the vertical scale is effectively restricted to the lowest mile of air above the earth.
Strategic and Tactical Systems
One may characterize the actions that must be taken on the longer time scales as "strategic"; short time scale decisions as "tactical"; and give similar names to the systems analyses associated with them. Tactical decisions made to avert an episode mainly affect the short term economic and social behaviour of the city involved, but have very little lasting impact on other jurisdictions largely because the city reverts to the status quo ante after the emergency situation has passed. The same is not true of strategic decisions made to shape a long-term trend of pollution levels and effects in a community. In this case, local decisions may have long-term economic and social impact not only on the community itself but also on the rest of the world with which it has economic and social interaction.
As previously noted, in the United States, the federal government has
30 Clean A i r / July, 1970
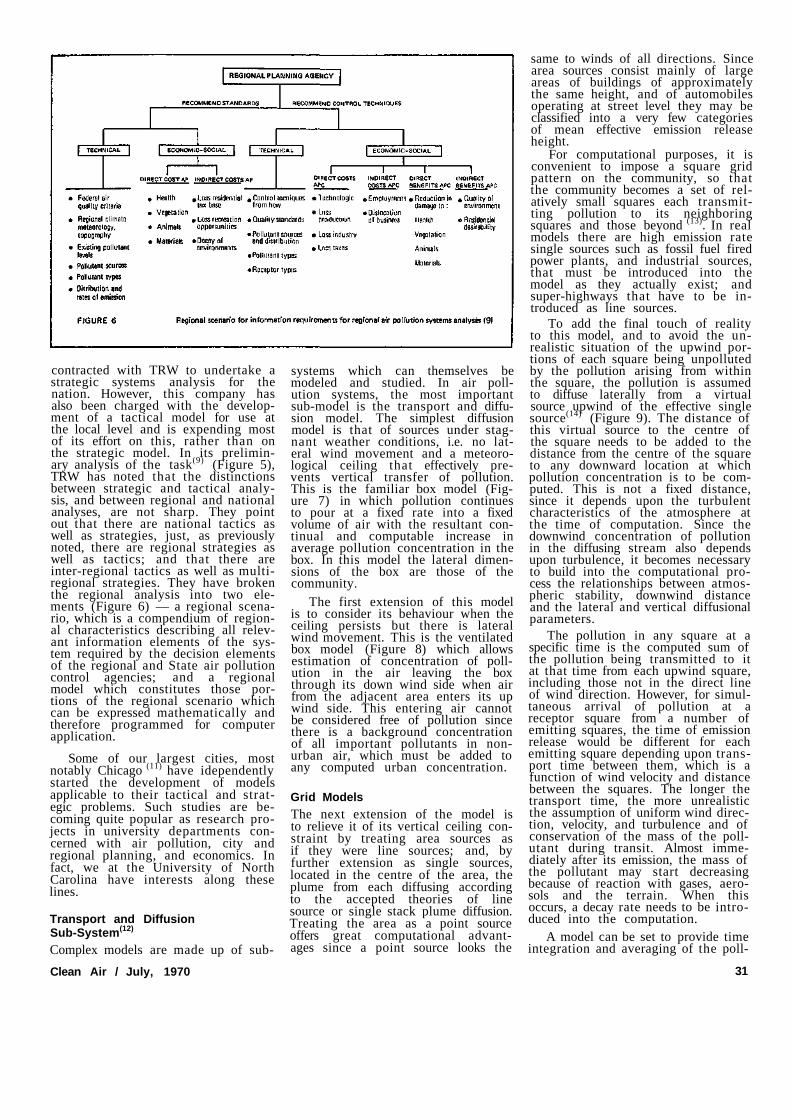
contracted with TRW to undertake a strategic systems analysis for the nation. However, this company has also been charged with the development of a tactical model for use at the local level and is expending most of its effort on this, rather than on the strategic model. In its preliminary analysis of the task(9) (Figure 5), TRW has noted that the distinctions between strategic and tactical analysis, and between regional and national analyses, are not sharp. They point out that there are national tactics as well as strategies, just, as previously noted, there are regional strategies as well as tactics; and that there are inter-regional tactics as well as multi-regional strategies. They have broken the regional analysis into two elements (Figure 6) — a regional scenario, which is a compendium of regional characteristics describing all relevant information elements of the system required by the decision elements of the regional and State air pollution control agencies; and a regional model which constitutes those portions of the regional scenario which can be expressed mathematically and therefore programmed for computer application.
Some of our largest cities, most notably Chicago (11) have idependently started the development of models applicable to their tactical and strategic problems. Such studies are becoming quite popular as research projects in university departments concerned with air pollution, city and regional planning, and economics. In fact, we at the University of North Carolina have interests along these lines.
Transport and Diffusion Sub-System(12)
Complex models are made up of sub
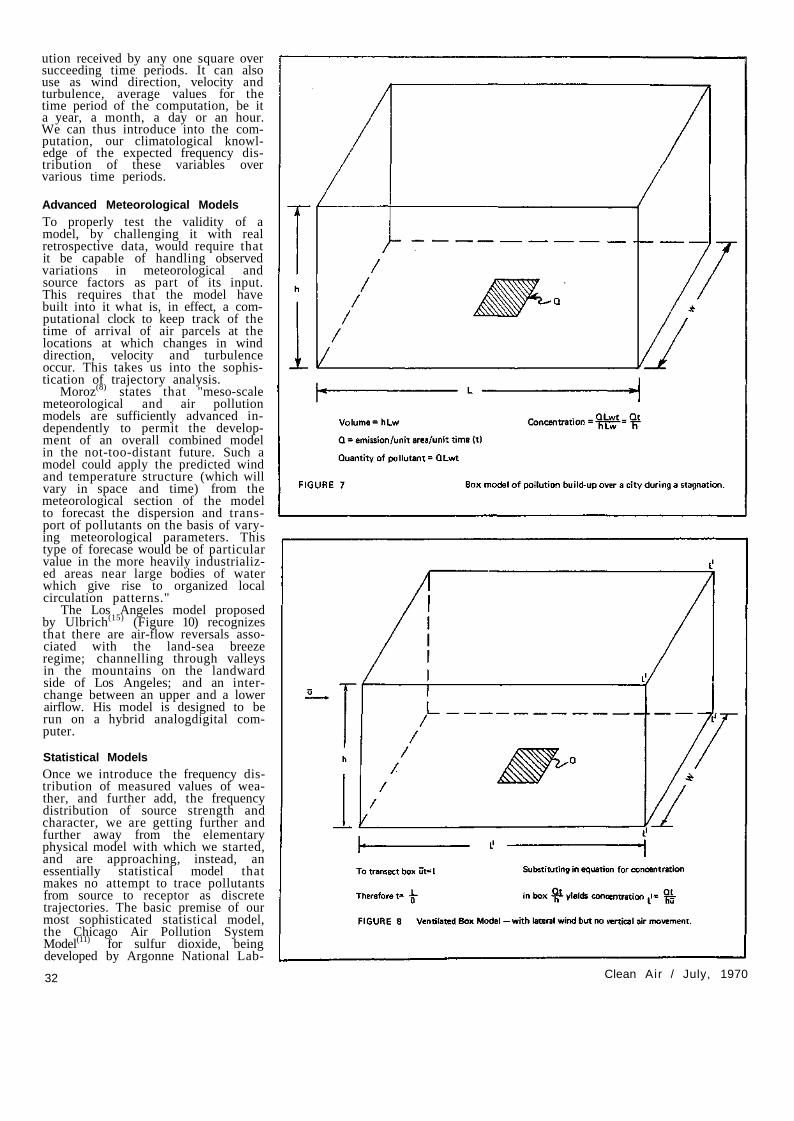
systems which can themselves be modeled and studied. In air pollution systems, the most important sub-model is the transport and diffusion model. The simplest diffusion model is that of sources under stagnant weather conditions, i.e. no lateral wind movement and a meteorological ceiling that effectively prevents vertical transfer of pollution. This is the familiar box model (Figure 7) in which pollution continues to pour at a fixed rate into a fixed volume of air with the resultant continual and computable increase in average pollution concentration in the box. In this model the lateral dimensions of the box are those of the community.
The first extension of this model is to consider its behaviour when the ceiling persists but there is lateral wind movement. This is the ventilated box model (Figure 8) which allows estimation of concentration of pollution in the air leaving the box through its down wind side when air from the adjacent area enters its up wind side. This entering air cannot be considered free of pollution since there is a background concentration of all important pollutants in non-urban air, which must be added to any computed urban concentration.
Grid Models The next extension of the model is to relieve it of its vertical ceiling constraint by treating area sources as if they were line sources; and, by further extension as single sources, located in the centre of the area, the plume from each diffusing according to the accepted theories of line source or single stack plume diffusion. Treating the area as a point source offers great computational advantages since a point source looks the
same to winds of all directions. Since area sources consist mainly of large areas of buildings of approximately the same height, and of automobiles operating at street level they may be classified into a very few categories of mean effective emission release height.
For computational purposes, it is convenient to impose a square grid pattern on the community, so that the community becomes a set of relatively small squares each transmitting pollution to its neighboring squares and those beyond (13). In real models there are high emission rate single sources such as fossil fuel fired power plants, and industrial sources, that must be introduced into the model as they actually exist; and super-highways that have to be introduced as line sources.
To add the final touch of reality to this model, and to avoid the unrealistic situation of the upwind portions of each square being unpolluted by the pollution arising from within the square, the pollution is assumed to diffuse laterally from a virtual source upwind of the effective single source(14) (Figure 9). The distance of this virtual source to the centre of the square needs to be added to the distance from the centre of the square to any downward location at which pollution concentration is to be computed. This is not a fixed distance, since it depends upon the turbulent characteristics of the atmosphere at the time of computation. Since the downwind concentration of pollution in the diffusing stream also depends upon turbulence, it becomes necessary to build into the computational process the relationships between atmospheric stability, downwind distance and the lateral and vertical diffusional parameters.
The pollution in any square at a specific time is the computed sum of the pollution being transmitted to it at that time from each upwind square, including those not in the direct line of wind direction. However, for simultaneous arrival of pollution at a receptor square from a number of emitting squares, the time of emission release would be different for each emitting square depending upon transport time between them, which is a function of wind velocity and distance between the squares. The longer the transport time, the more unrealistic the assumption of uniform wind direction, velocity, and turbulence and of conservation of the mass of the pollutant during transit. Almost immediately after its emission, the mass of the pollutant may start decreasing because of reaction with gases, aerosols and the terrain. When this occurs, a decay rate needs to be introduced into the computation.
A model can be set to provide time integration and averaging of the poll-
Clean Air / July, 1970 31
ution received by any one square over succeeding time periods. It can also use as wind direction, velocity and turbulence, average values for the time period of the computation, be it a year, a month, a day or an hour. We can thus introduce into the computation, our climatological knowledge of the expected frequency distribution of these variables over various time periods.
Advanced Meteorological Models To properly test the validity of a model, by challenging it with real retrospective data, would require that it be capable of handling observed variations in meteorological and source factors as part of its input. This requires that the model have built into it what is, in effect, a computational clock to keep track of the time of arrival of air parcels at the locations at which changes in wind direction, velocity and turbulence occur. This takes us into the sophistication of trajectory analysis.
Moroz(8) states that "meso-scale meteorological and air pollution models are sufficiently advanced independently to permit the development of an overall combined model in the not-too-distant future. Such a model could apply the predicted wind and temperature structure (which will vary in space and time) from the meteorological section of the model to forecast the dispersion and transport of pollutants on the basis of varying meteorological parameters. This type of forecase would be of particular value in the more heavily industrialized areas near large bodies of water which give rise to organized local circulation patterns."
The Los Angeles model proposed by Ulbrich(15) (Figure 10) recognizes that there are air-flow reversals associated with the land-sea breeze regime; channelling through valleys in the mountains on the landward side of Los Angeles; and an interchange between an upper and a lower airflow. His model is designed to be run on a hybrid analogdigital computer.
Statistical Models Once we introduce the frequency distribution of measured values of weather, and further add, the frequency distribution of source strength and character, we are getting further and further away from the elementary physical model with which we started, and are approaching, instead, an essentially statistical model that makes no attempt to trace pollutants from source to receptor as discrete trajectories. The basic premise of our most sophisticated statistical model, the Chicago Air Pollution System Model(11) for sulfur dioxide, being developed by Argonne National Lab-
32 Clean Air / July, 1970

oratory, is that a linear regression equation (Figure 11) in the form:
can be found which will allow prediction of X, the average concentration of SO2 at the receptor during time period n. C is the SO2 background concentration for averaging time n; T is temperature; C1 and C2 are temperature dependent co-efficients or functions; P1 and P2 are heating or fuel pattern co-efficients or functions; Q is the average emmis-sion from a point source over time period n; K is the coupling co-efficient between the sources and the receptor for a specific meteorological regime; subscripts 1 and 2 represent different area source categories; and subscript i identifies point sources. For example, subscript 1 could be for domestic sources; subscript 2 for large apartments and commercial buildings; and subscript i for a utility power plant. C, P and K are to be derived by statistical regression, discriminate, or factorial analysis of data obtained during a carefully defined meteorological regime, i.e. a specific stability condition, wind direction and wind velocity range.
The Argonne group has had the co-operation of Chicago's electric utility company, the Commonwealth Edison Company (CECO), which is the principal SO. emitter in Chicago. Together, they have developed a model to determine the extent that air pollution incidents, i.e. adverse combinations of SO2 concentration and duration, can be averted by reducing CECO emissions. The model (Figure 12) also seeks the least cost combination of fuel switching, load shifting and power purchase to accomplish these reductions. The coupling co-efficients between CECO power plants and the Chicago Department of Air Pollution Control air quality monitoring stations, which are the receptors are computed using a physical rather than a statistical model.
Clean Air / July, 1970
(This paper to be continued in the next edition.)
33
Herbert E Heist OLFACTION AND AIR Bruce D. Mulvaney POLLUTION
The authors are members of the Life Sciences Group at the Honeywell Corporate Research Centre, 500 Washington Avenue South, Hopkins, Minnesota, U.S.A., 55343.
Odor sensing cells are delicate, specialized nerve cells which have received little attention from sensory scientists. The ever increasing problems of air pollution focus new interest on our dependence upon this vital sense organ.
Introduction: For over 100 years scientists have been attempting to get an insight into man's least understood sense — the sense of smell. Until the last decade or two, the emphasis on the importance of these particular scientific endeavours has been severely lacking. Through the process of evolution the components for the physiological function of odour perception seemingly have been pushed away from the direct line of fire. This move to a back seat, so to speak, has been considered by many to be an indication of secondary importance for this sense when compared to our greater dependency upon vision, hearing and touch. Now, however, in this frenzied era of air pollution perils, we tend to give credit to Mother Nature for having sufficient foresight to locate the fragile tissues of this keen sense in a somewhat protected area. Most of us have never been too aware of the overall benefits of our olfactory acuities but a few words from those who have suffered temporary or total loss of this sense can give us considerable enlightenment.
Our perception of odours is performed by very delicate and sensitive specialized nerve cells. This article will discuss briefly (1) the structure of these cells and the nature of their immediate environment, (2) the research approaches being taken to determine the basic functional mechanisms of olfaction process with possible medical and economic implications.
Olfactory Tissue: The olfactory tissue is located toward the roof and back of the nasal passage in mammals, including man. In this position it is not in the direct path of the air that is drawn in through the nose to the lungs. The odour molecules in the air are taken more or less indirectly to the olfactory cells via eddy currents. Because of this, we sniff when we wish to detect an odour more acutely. Sniffing serves to increase both the amount and the rate of odour molecules entering the sensory area. Although this cellular location is not particularly beneficial
as an odour detector, it does serve somewhat to protect against possible injury from air pollutants. All of the remaining surface area in the nasal passages is covered with respiratory epithelium consisting of ciliated columnar cells. The exposed surface of these cells is covered with hundreds of hair-like structures called cilia. These cilia continuously move or beat in an orderly manner and they, together with the mucus that bathes them, serve to filter out most of the particulate pollutants that are inhaled. It is these cilia and others like them on cells in the bronchial tubes that are temporarily inactivated by tobacco smoke(1).
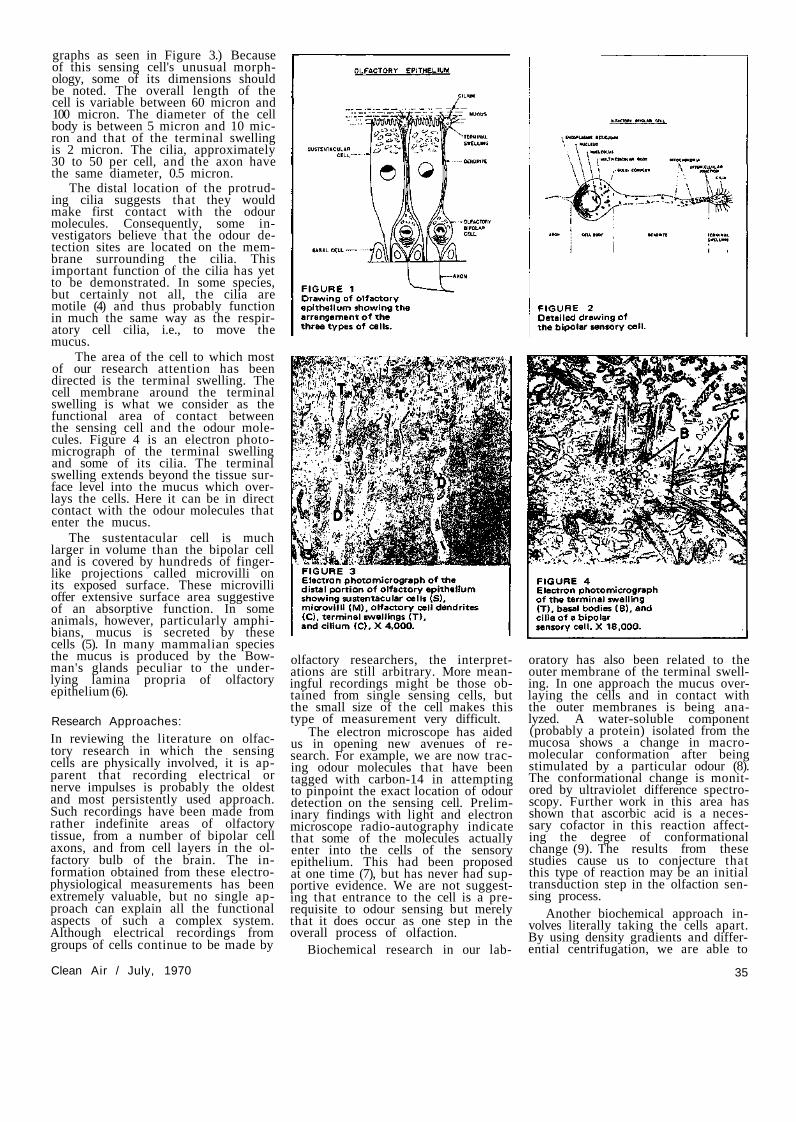
To understand a physiological function such as olfaction, it is essential to learn about its most basic unit, the bipolar sensing cell. Our initial approach to this study was to use the light microscope to completely map the location of olfactory cells on the complex sensory structures(2). New Zealand white rabbits were used for all of the studies discussed in this article. Gross anatomical differences exist in olfactory tissues among various species, but the odour sensing cells themselves are remarkably similar throughout the animal kingdom(3). Thus information gained from investigating the cells in rabbits is considered applicable in understanding those in man. Using the mapping study to accurately guide our selection of olfactory tissue sections, the next step was to use the electron microscope to determine the cell's ul-trastructure. Figure 1 is a drawing of the 3 types of cells that are found in olfactory epithelium. The bipolar sensing cell is a specialized nerve cell; consequently, it is assumed to do the sensing and is so named. The susten-tacular cell is also called the supporting cell in the assumption that it physically assists the bipolar in maintaining position. Its actual function and relation to the bipolar cell in mammals is still not fully understood.
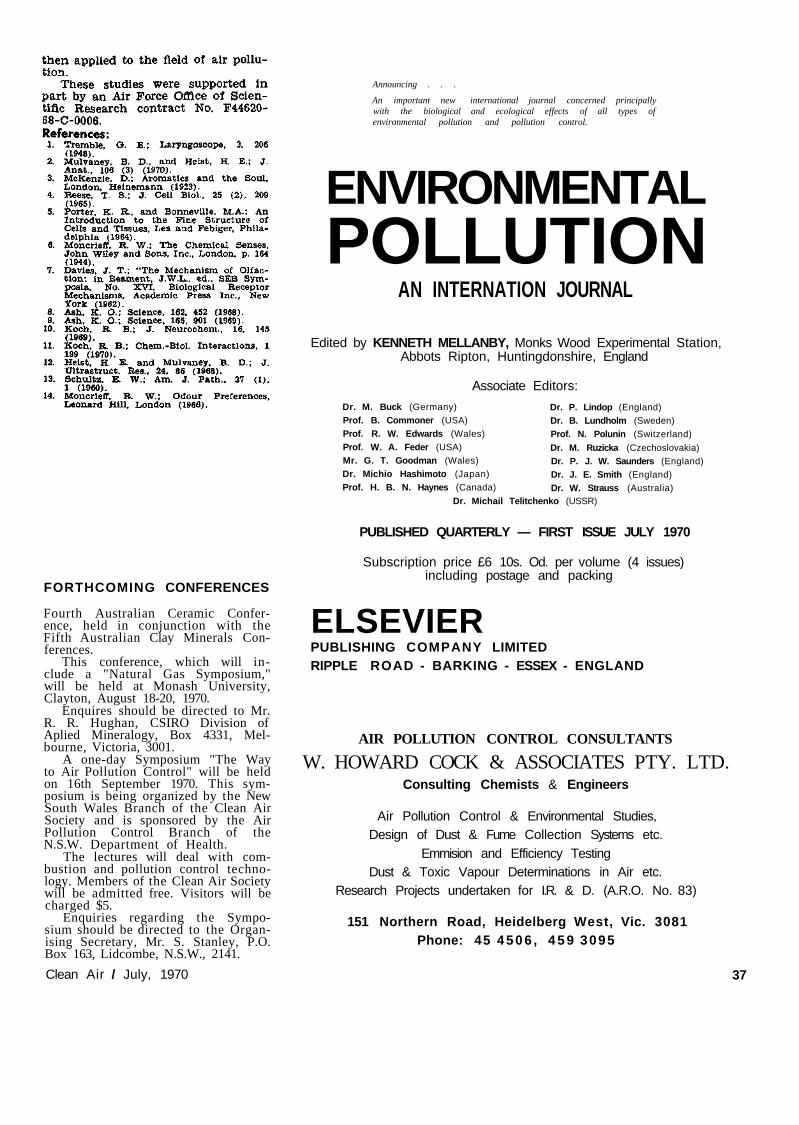
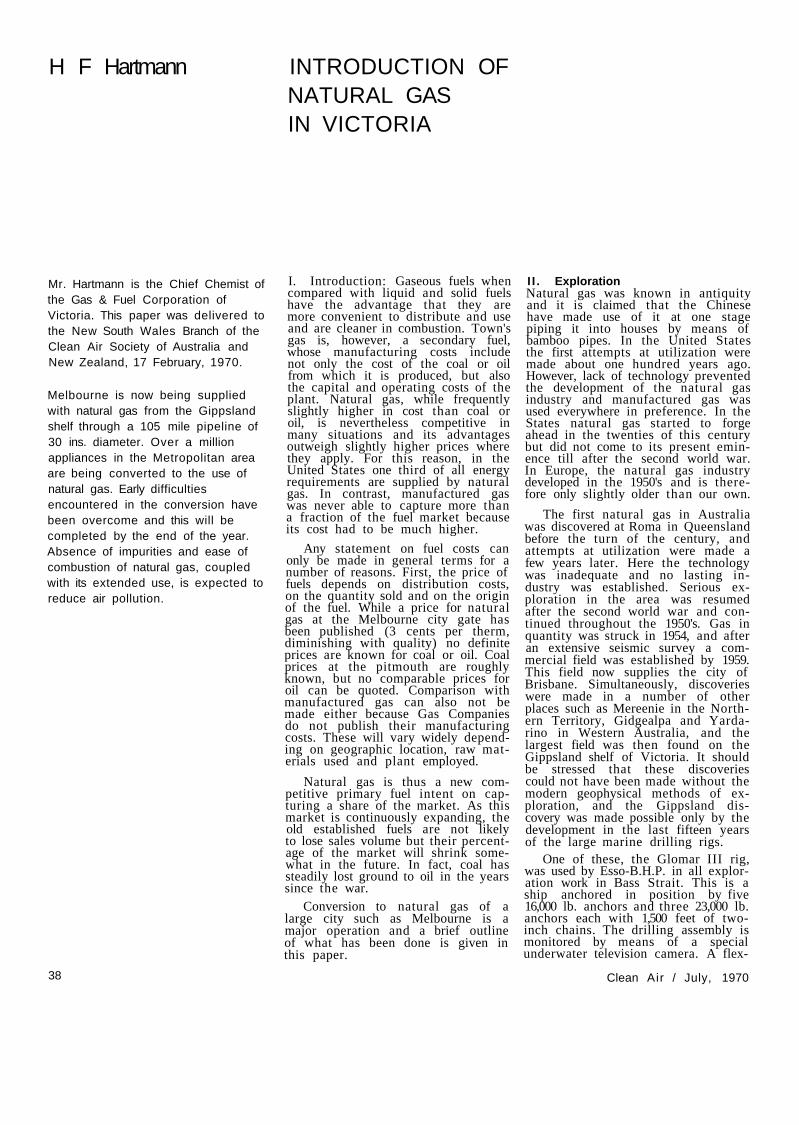
Figure 2 is a more detailed drawing of the bipolar cell. (These drawings are based on our electron photomicro-
34 Clean Air / July, 1970
graphs as seen in Figure 3.) Because of this sensing cell's unusual morphology, some of its dimensions should be noted. The overall length of the cell is variable between 60 micron and 100 micron. The diameter of the cell body is between 5 micron and 10 micron and that of the terminal swelling is 2 micron. The cilia, approximately 30 to 50 per cell, and the axon have the same diameter, 0.5 micron.
The distal location of the protruding cilia suggests that they would make first contact with the odour molecules. Consequently, some investigators believe that the odour detection sites are located on the membrane surrounding the cilia. This important function of the cilia has yet to be demonstrated. In some species, but certainly not all, the cilia are motile (4) and thus probably function in much the same way as the respiratory cell cilia, i.e., to move the mucus.
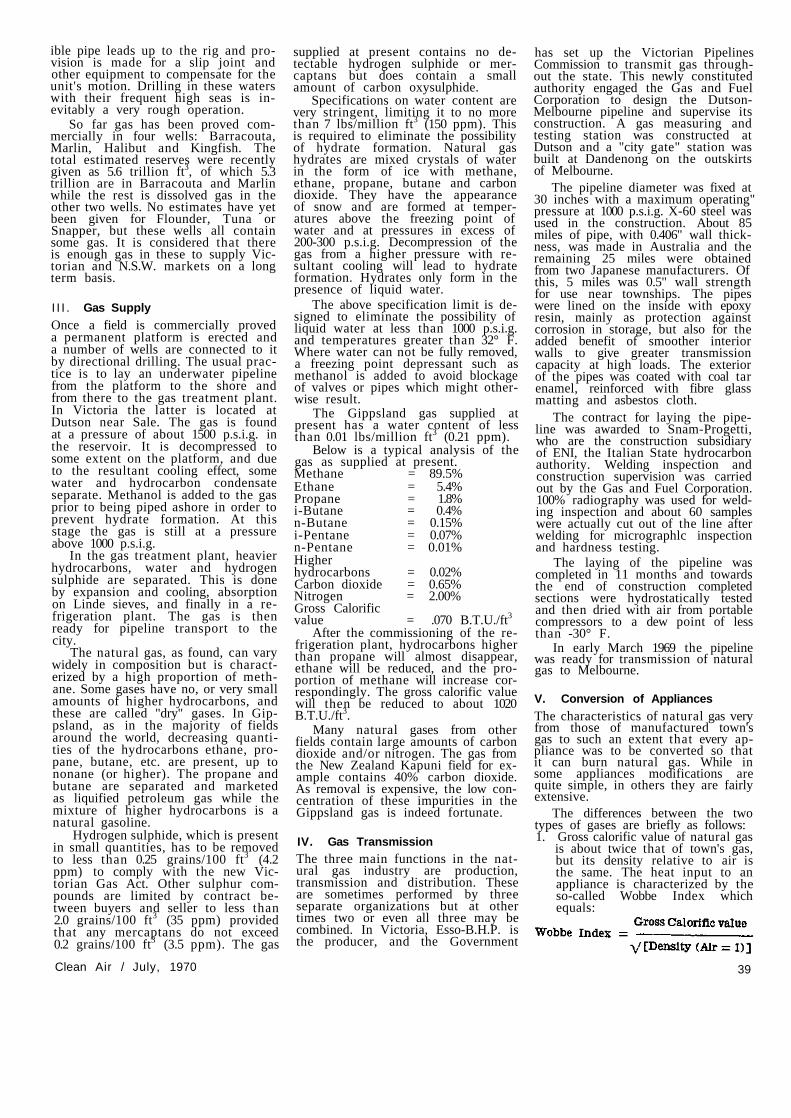
The area of the cell to which most of our research attention has been directed is the terminal swelling. The cell membrane around the terminal swelling is what we consider as the functional area of contact between the sensing cell and the odour molecules. Figure 4 is an electron photomicrograph of the terminal swelling and some of its cilia. The terminal swelling extends beyond the tissue surface level into the mucus which overlays the cells. Here it can be in direct contact with the odour molecules that enter the mucus.
The sustentacular cell is much larger in volume than the bipolar cell and is covered by hundreds of finger-like projections called microvilli on its exposed surface. These microvilli offer extensive surface area suggestive of an absorptive function. In some animals, however, particularly amphibians, mucus is secreted by these cells (5). In many mammalian species the mucus is produced by the Bowman's glands peculiar to the underlying lamina propria of olfactory epithelium (6).
Research Approaches:
In reviewing the literature on olfactory research in which the sensing cells are physically involved, it is apparent that recording electrical or nerve impulses is probably the oldest and most persistently used approach. Such recordings have been made from rather indefinite areas of olfactory tissue, from a number of bipolar cell axons, and from cell layers in the olfactory bulb of the brain. The information obtained from these electrophysiological measurements has been extremely valuable, but no single approach can explain all the functional aspects of such a complex system. Although electrical recordings from groups of cells continue to be made by
olfactory researchers, the interpretations are still arbitrary. More meaningful recordings might be those obtained from single sensing cells, but the small size of the cell makes this type of measurement very difficult.
The electron microscope has aided us in opening new avenues of research. For example, we are now tracing odour molecules that have been tagged with carbon-14 in attempting to pinpoint the exact location of odour detection on the sensing cell. Preliminary findings with light and electron microscope radio-autography indicate that some of the molecules actually enter into the cells of the sensory epithelium. This had been proposed at one time (7), but has never had supportive evidence. We are not suggesting that entrance to the cell is a prerequisite to odour sensing but merely that it does occur as one step in the overall process of olfaction.
Biochemical research in our lab-
oratory has also been related to the outer membrane of the terminal swelling. In one approach the mucus overlaying the cells and in contact with the outer membranes is being analyzed. A water-soluble component (probably a protein) isolated from the mucosa shows a change in macro-molecular conformation after being stimulated by a particular odour (8). The conformational change is monitored by ultraviolet difference spectroscopy. Further work in this area has shown that ascorbic acid is a necessary cofactor in this reaction affecting the degree of conformational change (9). The results from these studies cause us to conjecture that this type of reaction may be an initial transduction step in the olfaction sensing process.
Another biochemical approach involves literally taking the cells apart. By using density gradients and differential centrifugation, we are able to
Clean Air / July, 1970 35

isolate and analyze almost any kind of subcellular component regardless of size; this includes membranes such as those of the terminal swellings. One of our biochemists is studying certain enzymes associated with these membranes. He has found that one particular enzyme of the olfactory cell membrane reacts differently from the same enzyme of a brain nerve cell (10). He has also demonstrated for the first time that chlorinated hydrocarbon pesticides in living systems inhibit the energy-releasing ATPase enzymes at the cellular level(11). These findings could be vital in understanding the true functional mechanism of the odour sensing cell. Investigations such as these in olfaction research are relatively new, but more scientists are and will be using these approaches in directing their studies on odour perception. The ultimate and complete understanding of the sense of smell will be the cumulative result of many types of research including psy-chophysiology (odour panels) and the organic chemistry of odour molecules, neither of which are included in this article.
Air Pollutants and the Olfactory Process: The immediate problem concerning us at this time is the relation between air pollution and odour perception. Fortunately our odour sensing cells do not appear in serious danger of being injured by the major air pollutants; however, this is not a certainty at present. Much has been written and stated about effects of pollutants to our overall health. Certain compounds cause eye irritations, some cause various degrees of coughing, others antagonize emphysematous conditions, etc. Little is actually known, though, about the pollutant effects at the cellular level such as the chemical reaction of polluting compounds with the cells of the bronchial tubes and lungs. Even less is known about the effects on olfactory cells, since little specific research has been conducted on them.
Through part of our research program, we have gained some insight into the problem and a degree of encouragement as relates to air pollutants. While making detailed observations on odour sensing cells in adult animal tissues, we noticed unusual locations of a certain organelle, the centriole. In addition to their function in cell division, centrioles, in cells containing cilia, reduplicate and form basal bodies from which the cilia develop. In the fully mature cell the centrioles would be expected to be found only in that location. However, we observed significant numbers of bipolar cells with centrioles in other locations(12). This suggested to us that perhaps we were observing developing
cells. Further, it suggested that, unlike most nerve cells, these cells might have regenerative capability. Using previously established techniques (13), we preferentially destroyed olfactory epithelium by treatment with a 1% zinc sulphate solution. A regeneration process began almost immediately and a nearly complete new olfactory tissue layer was formed in one month. Although destruction of these cells was not produced by air pollutants, presumedly this tissue would regenerate just as well after possible injury by such pollutants. The amount of injury, if any, to olfactory cells would depend upon the concentration of the pollutant and the exposure time. Until such studies are made, we have no way of measuring the detrimental effects.
A complicating factor in this odour-air pollution matter is the individual human variance to odours. Likewise, a single odour can vary according to its concentrations. Many chemicals have an unpleasant odour when concentrated, but become more pleasant in dilution. The characteristic strong skunk smell is an example. When very diluted it smells somewhat like musk which is a basic ingredient for many perfumes and soaps.
Much has been written about the factors that influence humans' odour likes and dislikes including the effects of sex, age and temperament(14). Pregnancy is also known to change the sense of smell and certain substances (caffeine) reportedly enhance odour sensitivity whereas others (acetylcholine) suppress it. There are a number of abnormal conditions of olfaction which may be due to genetics, disease, injury or even emotional upsets. The effects from these conditions vary in that some individuals perceive an odour completely differently from "normal" persons; some detect an odour when there is no odour stimulus; some lose perception of only certain odours; some continually perceive unpleasant odours; some have a temporary or permanent complete loss of odour perception; etc. That air pollutants may cause any of these anomalies is unknown. It would not be surprising, though, to find that such a sensitive and delicate system as olfaction is affected by certain pollutants.
From an economic or psychological standpoint, the nuisance value of odourous pollutants is currently of more importance than the threat to the well-being of our olfactory cells. A strong unpleasant odour in this day of air pollution concern can cause intense reaction by the public to the source of the odour. Regardless of actual cellular injury by the pollutant, a general ill-feeling such as nausea can be induced by the asso
ciated odour. Although odours may serve as warning signals in some instances, odour abatement is necessarily involved with air pollution problems.
It is readily recognizable that the field of odour control is highly complicated. Public demand is making the control, or at least the masking, of odours absolutely essential. This should become an easier task when we hope, some day, completely to understand the mechanism of olfaction.
Summary: Rabit olfactory tissue, particularly the bipolar sensing cell, has been analyzed fairly extensively. Cell ultra-structure was determined by electron microscopy. The terminal swelling and cilia are of considerable interest because of their exposed position and presumed initial contact with odour molecules. Exact odour detection sites have not been determined, but preliminary radioautographic findings indicate entrance of some of the molecules into the cells.
Biochemical investigations have isolated a water-soluble component from, the olfactory mucosa which undergoes a conformational change when stimulated by certain odourants in the presence of an ascorbic acid cofactor. Other studies have determined the activity of certain ATPase enzymes associated with the outer membrane of the terminal swelling. The activity in one instance is different from that of the same enzyme isolated from a similar section of brain nerve cells.
Following destruction of the olfactory tissue by a 1% zinc sulphate solution, almost complete regeneration of the epithelium occurred within one month. This is encouraging in the light of possible cell injury by air pollutants. We doubt very much that injury by pollution would ever be as severe as that caused experimentally by zinc sulphate. Public reaction to the odour-air pollution problems will undoubtedly be more concerned with the nuisance and psychological aspects than with actual effects on the odour sensing cells at this time.
Acknowledgements: This article is partially a result of several years of research because of Honeywell's interest in the field of air pollution. The research was conducted at the Honeywell Corporate Research Centre by scientists in the Life Sciences Group of the Chemistry Department. Dr. Herbert E. Heist is a Staff Scientist and Mr. Bruce D. Mulvaney is an associate Research Scientist in this group. The initial studies were conducted to get a better understanding of the functional mechanism of the sense of olfaction. Information resulting from these investigations were
36 Clean Air / July, 1970
FORTHCOMING CONFERENCES
Fourth Australian Ceramic Conference, held in conjunction with the Fifth Australian Clay Minerals Conferences.
This conference, which will include a "Natural Gas Symposium," will be held at Monash University, Clayton, August 18-20, 1970.
Enquires should be directed to Mr. R. R. Hughan, CSIRO Division of Aplied Mineralogy, Box 4331, Melbourne, Victoria, 3001.
A one-day Symposium "The Way to Air Pollution Control" will be held on 16th September 1970. This symposium is being organized by the New South Wales Branch of the Clean Air Society and is sponsored by the Air Pollution Control Branch of the N.S.W. Department of Health.
The lectures will deal with combustion and pollution control technology. Members of the Clean Air Society will be admitted free. Visitors will be charged $5.
Enquiries regarding the Symposium should be directed to the Organising Secretary, Mr. S. Stanley, P.O. Box 163, Lidcombe, N.S.W., 2141.
Announcing . . .
An important new international journal concerned principally with the biological and ecological effects of all types of environmental pollution and pollution control.
ENVIRONMENTAL POLLUTION
AN INTERNATION JOURNAL
Edited by KENNETH MELLANBY, Monks Wood Experimental Station, Abbots Ripton, Huntingdonshire, England
Associate Editors:
Dr. M. Buck (Germany) Prof. B. Commoner (USA) Prof. R. W. Edwards (Wales) Prof. W. A. Feder (USA) Mr. G. T. Goodman (Wales) Dr. Michio Hashimoto (Japan) Prof. H. B. N. Haynes (Canada)
Dr. P. Lindop (England) Dr. B. Lundholm (Sweden) Prof. N. Polunin (Switzerland)
Dr. M. Ruzicka (Czechoslovakia) Dr. P. J. W. Saunders (England) Dr. J. E. Smith (England) Dr. W. Strauss (Australia)
Dr. Michail Telitchenko (USSR)
PUBLISHED QUARTERLY — FIRST ISSUE JULY 1970
Subscription price £6 10s. Od. per volume (4 issues) including postage and packing
ELSEVIER PUBLISHING COMPANY LIMITED RIPPLE ROAD - BARKING - ESSEX - ENGLAND
AIR POLLUTION CONTROL CONSULTANTS
W. HOWARD COCK & ASSOCIATES PTY. LTD. Consulting Chemists & Engineers
Air Pollution Control & Environmental Studies, Design of Dust & Fume Collection Systems etc.
Emmision and Efficiency Testing Dust & Toxic Vapour Determinations in Air etc.
Research Projects undertaken for I.R. & D. (A.R.O. No. 83)
151 Northern Road, Heidelberg West, Vic. 3081 Phone: 45 4506 , 4 5 9 3095
Clean Air / July, 1970 37
H F Hartmann INTRODUCTION OF NATURAL GAS IN VICTORIA
Mr. Hartmann is the Chief Chemist of the Gas & Fuel Corporation of Victoria. This paper was delivered to the New South Wales Branch of the Clean Air Society of Australia and New Zealand, 17 February, 1970.
Melbourne is now being supplied with natural gas from the Gippsland shelf through a 105 mile pipeline of 30 ins. diameter. Over a million appliances in the Metropolitan area are being converted to the use of natural gas. Early difficulties encountered in the conversion have been overcome and this will be completed by the end of the year. Absence of impurities and ease of combustion of natural gas, coupled with its extended use, is expected to reduce air pollution.
I. Introduction: Gaseous fuels when compared with liquid and solid fuels have the advantage that they are more convenient to distribute and use and are cleaner in combustion. Town's gas is, however, a secondary fuel, whose manufacturing costs include not only the cost of the coal or oil from which it is produced, but also the capital and operating costs of the plant. Natural gas, while frequently slightly higher in cost than coal or oil, is nevertheless competitive in many situations and its advantages outweigh slightly higher prices where they apply. For this reason, in the United States one third of all energy requirements are supplied by natural gas. In contrast, manufactured gas was never able to capture more than a fraction of the fuel market because its cost had to be much higher.
Any statement on fuel costs can only be made in general terms for a number of reasons. First, the price of fuels depends on distribution costs, on the quantity sold and on the origin of the fuel. While a price for natural gas at the Melbourne city gate has been published (3 cents per therm, diminishing with quality) no definite prices are known for coal or oil. Coal prices at the pitmouth are roughly known, but no comparable prices for oil can be quoted. Comparison with manufactured gas can also not be made either because Gas Companies do not publish their manufacturing costs. These will vary widely depending on geographic location, raw materials used and plant employed.
Natural gas is thus a new competitive primary fuel intent on capturing a share of the market. As this market is continuously expanding, the old established fuels are not likely to lose sales volume but their percentage of the market will shrink somewhat in the future. In fact, coal has steadily lost ground to oil in the years since the war.
Conversion to natural gas of a large city such as Melbourne is a major operation and a brief outline of what has been done is given in this paper.
I I . Exploration Natural gas was known in antiquity and it is claimed that the Chinese have made use of it at one stage piping it into houses by means of bamboo pipes. In the United States the first attempts at utilization were made about one hundred years ago. However, lack of technology prevented the development of the natural gas industry and manufactured gas was used everywhere in preference. In the States natural gas started to forge ahead in the twenties of this century but did not come to its present eminence till after the second world war. In Europe, the natural gas industry developed in the 1950's and is therefore only slightly older than our own.
The first natural gas in Australia was discovered at Roma in Queensland before the turn of the century, and attempts at utilization were made a few years later. Here the technology was inadequate and no lasting industry was established. Serious exploration in the area was resumed after the second world war and continued throughout the 1950's. Gas in quantity was struck in 1954, and after an extensive seismic survey a commercial field was established by 1959. This field now supplies the city of Brisbane. Simultaneously, discoveries were made in a number of other places such as Mereenie in the Northern Territory, Gidgealpa and Yarda-rino in Western Australia, and the largest field was then found on the Gippsland shelf of Victoria. It should be stressed that these discoveries could not have been made without the modern geophysical methods of exploration, and the Gippsland discovery was made possible only by the development in the last fifteen years of the large marine drilling rigs.
One of these, the Glomar III rig, was used by Esso-B.H.P. in all exploration work in Bass Strait. This is a ship anchored in position by five 16,000 lb. anchors and three 23,000 lb. anchors each with 1,500 feet of two-inch chains. The drilling assembly is monitored by means of a special underwater television camera. A flex-
38 Clean Air / July, 1970
ible pipe leads up to the rig and provision is made for a slip joint and other equipment to compensate for the unit's motion. Drilling in these waters with their frequent high seas is inevitably a very rough operation.
So far gas has been proved commercially in four wells: Barracouta, Marlin, Halibut and Kingfish. The total estimated reserves were recently given as 5.6 trillion ft3, of which 5.3 trillion are in Barracouta and Marlin while the rest is dissolved gas in the other two wells. No estimates have yet been given for Flounder, Tuna or Snapper, but these wells all contain some gas. It is considered that there is enough gas in these to supply Victorian and N.S.W. markets on a long term basis.
I I I . Gas Supply Once a field is commercially proved a permanent platform is erected and a number of wells are connected to it by directional drilling. The usual practice is to lay an underwater pipeline from the platform to the shore and from there to the gas treatment plant. In Victoria the latter is located at Dutson near Sale. The gas is found at a pressure of about 1500 p.s.i.g. in the reservoir. It is decompressed to some extent on the platform, and due to the resultant cooling effect, some water and hydrocarbon condensate separate. Methanol is added to the gas prior to being piped ashore in order to prevent hydrate formation. At this stage the gas is still at a pressure above 1000 p.s.i.g.
In the gas treatment plant, heavier hydrocarbons, water and hydrogen sulphide are separated. This is done by expansion and cooling, absorption on Linde sieves, and finally in a refrigeration plant. The gas is then ready for pipeline transport to the city.
The natural gas, as found, can vary widely in composition but is characterized by a high proportion of methane. Some gases have no, or very small amounts of higher hydrocarbons, and these are called "dry" gases. In Gip-psland, as in the majority of fields around the world, decreasing quantities of the hydrocarbons ethane, propane, butane, etc. are present, up to nonane (or higher). The propane and butane are separated and marketed as liquified petroleum gas while the mixture of higher hydrocarbons is a natural gasoline.
Hydrogen sulphide, which is present in small quantities, has to be removed to less than 0.25 grains/100 ft3 (4.2 ppm) to comply with the new Victorian Gas Act. Other sulphur compounds are limited by contract between buyers and seller to less than 2.0 grains/100 ft3 (35 ppm) provided that any mercaptans do not exceed 0.2 grains/100 ft3 (3.5 ppm). The gas
supplied at present contains no detectable hydrogen sulphide or mercaptans but does contain a small amount of carbon oxysulphide.
Specifications on water content are very stringent, limiting it to no more than 7 lbs/million ft3 (150 ppm). This is required to eliminate the possibility of hydrate formation. Natural gas hydrates are mixed crystals of water in the form of ice with methane, ethane, propane, butane and carbon dioxide. They have the appearance of snow and are formed at temperatures above the freezing point of water and at pressures in excess of 200-300 p.s.i.g. Decompression of the gas from a higher pressure with resultant cooling will lead to hydrate formation. Hydrates only form in the presence of liquid water.
The above specification limit is designed to eliminate the possibility of liquid water at less than 1000 p.s.i.g. and temperatures greater than 32° F. Where water can not be fully removed, a freezing point depressant such as methanol is added to avoid blockage of valves or pipes which might otherwise result.
The Gippsland gas supplied at present has a water content of less than 0.01 lbs/million ft3 (0.21 ppm).
Below is a typical analysis of the gas as supplied at present. Methane = 89.5% Ethane = 5.4% Propane = 1.8% i-Butane = 0.4% n-Butane = 0.15% i-Pentane = 0.07% n-Pentane = 0.01% Higher hydrocarbons = 0.02% Carbon dioxide = 0.65% Nitrogen = 2.00% Gross Calorific value = .070 B.T.U./ft3
After the commissioning of the refrigeration plant, hydrocarbons higher than propane will almost disappear, ethane will be reduced, and the proportion of methane will increase correspondingly. The gross calorific value will then be reduced to about 1020 B.T.U./ft3.
Many natural gases from other fields contain large amounts of carbon dioxide and/or nitrogen. The gas from the New Zealand Kapuni field for example contains 40% carbon dioxide. As removal is expensive, the low concentration of these impurities in the Gippsland gas is indeed fortunate.
IV. Gas Transmission The three main functions in the natural gas industry are production, transmission and distribution. These are sometimes performed by three separate organizations but at other times two or even all three may be combined. In Victoria, Esso-B.H.P. is the producer, and the Government
has set up the Victorian Pipelines Commission to transmit gas throughout the state. This newly constituted authority engaged the Gas and Fuel Corporation to design the Dutson-Melbourne pipeline and supervise its construction. A gas measuring and testing station was constructed at Dutson and a "city gate" station was built at Dandenong on the outskirts of Melbourne.
The pipeline diameter was fixed at 30 inches with a maximum operating" pressure at 1000 p.s.i.g. X-60 steel was used in the construction. About 85 miles of pipe, with 0.406" wall thickness, was made in Australia and the remaining 25 miles were obtained from two Japanese manufacturers. Of this, 5 miles was 0.5" wall strength for use near townships. The pipes were lined on the inside with epoxy resin, mainly as protection against corrosion in storage, but also for the added benefit of smoother interior walls to give greater transmission capacity at high loads. The exterior of the pipes was coated with coal tar enamel, reinforced with fibre glass matting and asbestos cloth.
The contract for laying the pipeline was awarded to Snam-Progetti, who are the construction subsidiary of ENI, the Italian State hydrocarbon authority. Welding inspection and construction supervision was carried out by the Gas and Fuel Corporation. 100% radiography was used for welding inspection and about 60 samples were actually cut out of the line after welding for micrographlc inspection and hardness testing.
The laying of the pipeline was completed in 11 months and towards the end of construction completed sections were hydrostatically tested and then dried with air from portable compressors to a dew point of less than -30° F.
In early March 1969 the pipeline was ready for transmission of natural gas to Melbourne.
V. Conversion of Appliances The characteristics of natural gas very from those of manufactured town's gas to such an extent that every appliance was to be converted so that it can burn natural gas. While in some appliances modifications are quite simple, in others they are fairly extensive.
The differences between the two types of gases are briefly as follows: 1. Gross calorific value of natural gas
is about twice that of town's gas, but its density relative to air is the same. The heat input to an appliance is characterized by the so-called Wobbe Index which equals:
Clean Air / July, 1970 39
was found that they would not operate satisfactorily on natural gas when both oven and griller were operating at the same time and extensive work had to be done to produce suitable modifications.
A few of the unflued heaters also showed great sensitivity to adjustment, necessitating particularly careful control.
At present the number of complaints have been reduced to half as adjusters have gained experience, and the causes of earlier troubles were analysed. Conversion is now proceeding at the planned rate of two sections per week. At present it is anticipated that the whole operation will be completed by the end of 1970. Repeated surveys have shown that the vast majority of customers are now satisfied with both natural gas and the conversion of their appliances.
A point of concern from the beginning has been the odour of the gas because natural gas as supplied at the City boundary is odourless, and an odourant has to be added for safety. The contractor had warned the corporation that one of their chief causes of complaints in other conversions was due to the odour of natural gas being different to town's gas. This had frequently given rise to complaints about excessive leaks. The contractor, therefore, asked that the odourant added should give an odour as close as possible to that of the town's gas previously used and that
it be kept to a minimum consistent with safety.
There are only three types of odourant in use at present, and all are sulphur compounds: mercaptans, aliphatic sulphides and cyclic sulphides. There is no experience with aliphatic sulphides in Australia but tetrahydro-thiophene, a cyclic sulphide had been used for years to odourize brown coal gas from the Corporation's Lurgi plant. As some tertiary butyl-mercaptan had also been present in town's gas in recent years, a mixture of two-thirds of tetrahydro-thiophene and one-third tertiary butyl-mercaptan is used to odourize the natural gas. Following published information and the supplier's recommendations, % lb of this blend was added per million fts (i.e. about 2 ppm). Records of gas escape complaints soon showed that this was too high and thus both absolute quantity and the concentration of the mercaptan were reduced to a lower, but still safe, level. Odourant concentrations are monitored both by nose and by gas chromatographic analysis. After conversion is completed odour levels will gradually be raised again as consumers get used to the odour.
When conversion is completed next December, Melbourne will have available a new source of energy which is endeavouring to obtain an increased share of the market.
New natural gas tariffs will give domestic consumers reductions be
tween 10 and 20% depending on volume used and industrial gas customers reductions 10 to 50%. With higher quantities even greater reductions may be obtained. As a result of this and a vigorous sales campaign consumption is already rising sharply in spite of the conversion difficulties mentioned.
Natural gas will certainly also have an impact on air pollution. In its combustion all the usual pollutants are present in negligible amounts with the exception of oxides of nitrogen and these are produced to a lesser extent than with other fuels.
As Australian fuels are generally low in sulphur, natural gas will probably not displace other fuels to the extent it has done in the United States, but the freedom fram pollution combined with the fact that no tall stack will be needed will recommend it in many industrial situations in our urban areas.
The present contract with the supplier runs for twenty years and adequate reserves are available for this period. Concern has been expressed that conversion has been undertaken without assurance of a longer lasting reserve. However, there is gas further away at Mereenie and overseas experience has shown that further discoveries can be confidently expected. The natural gas industry in Australia, like its counterparts overseas, is likely to be a vigorous growth industry.
ATMOSPHERIC ENVIRONMENT AN INTERNATIONAL JOURNAL
EXECUTIVE EDITORS D. J. MOORE W. KLUG J. P. LODGE, Jr. U.S.A.
Central Electricity Research Laboratories, England. Technische Hochschule, Darmstadt, Germany. National Center for Atmospheric Research, Boulder, Col.,
The journal is published Bi-monthly. Publishing Offices: Headington Hill Hall, Oxford
Subscription Rates per annum (inc. postage) — (a) £20 ($US 50.00) for libraries, Research Establishments and other multiple reader Institutions. (b) £3.10s.0d. ($10.00) for individual subscribers who write direct to the publisher certifying that
the journal is for their personal use. Back issues are available; write for Back Issues Price List.
PERGAMON PRESS LTD. HEADINGTON HILL HALL, OXFORD, ENGLAND
44-01 21st STREET, LONG ISLAND CITY, N.Y. 11101, U.S.A.
Clean Air / July, 1970 41

New South Wa les Branch
The first meeting of the New South Wales Branch for 1970 was held on February 17. The presentation of the Annual Report (printed elsewhere in this issue) was followed by the election of office bearers for 1970. These are as follows: President: Mr. K. Sullivan. Secretary/ Treasurer: Mr. J. Pottinger. Councillors: Dr. K. Basden, Mr. A. Denholm, Mr. I. Doig, Mr. N. Lamb, Mr. P. Murphy, Mr. S. Stanley, Mr. H. Voss, Mr. R. Williams.
Following on the Annual Meeting an address was given by Mr. H. Hart-mann, President of the Victorian Branch of the Society on "The Advent of Natural Gas in Australia and its Implications for Air Pollution Control."
On the night of February 18, the New South Wales Branch of the Society held its second public meeting. This time in the Newcastle Area at Mayfleld, the heart of sources of industrial pollution in the area. The meeting was opened by Mr. K. Sullivan, New South Wales Branch President and was chaired by the Deputy Lord Mayor of Newcastle. The guest speaker was Mr. R. P. Murphy, Principal Engineer of the Air Pollution Control Branch of the New South Wales Health Department. Mr. Murphy spoke to an audience of over 60 members of the public, on the effects of air pollution and measures used both in Australia and overseas to control the problem. The talk was followed by a film on air pollution after which the meeting was thrown open for general discussion.
Victorian Branch
March Meeting. The first meeting of the year was addressed by Dr. Nigel Gray, Director of the Anti Cancer Council of Victoria on the subject of "Air Pollution and Human Health."
Dr. Gray pointed out that apart
from the fact that air pollution in London and similar cities in the United Kingdom causes chronic bronchitis, the direct health effects of air pollution are not serious, although they may be unpleasant: for example, Los Angeles smog causes eye irritation, but not serious disease.
Nonetheless, there is the clear possibility that increases in air pollution could be responsible for diseases not yet defined. In the cases of yellow fever, smallpox and polio the identity and extent of the problem was well
known before an answer was available.
In the case of pollution, at this stage we know far more about its control, than the medical effects of air pollution. In view of the spectrum of possibilities of these effects, controls are essential. This will require some of the most important public health decisions of this century.
About 40 members and their friends attended the meeting, the contents of which were afterwards reported by both press and radio.
BOOK REVIEW AIR POLLUTION ENGINEERING MANUAL
Compiled and Edited by John A. Danielson, Public Health Service Publication No. 999-AP-40 U.S. Department of Health, Education and Welfare. Obtainable by wri t ing to the Superintendent of Documents, U.S. Government Printing Office, Washington D.C. 2002. Price $U.S. 5.75 (Normal Sea Freight approx. $16.50).
This manual is unique, because it deals with the control of air pollution at individual sources, emphasizing the practical engineering problems of design and operation.
The sources of air pollution are in the metallurgical, chemical and petroleum industries and in mechanical, combustion and incineration processes carried out by all industries. It is recognized that while the literature contains excellent data on some of these, no handbook or manual has previously been compiled. Thus the new volume fulfils a distinct need.
The air pollution problems presented in the manual originate in the Los Angeles area, which has commercial industrial sources of a distinct nature, some processes such as burning of coal in combustion equipment are not mentioned. Furthermore, the
degree of control strived for in the techniques surveyed in this manual corresponds to that demanded by the air pollution control statutes of the Los Angeles County Air Pollution Control District. It must be remembered that many other areas (even within the U.S.A.) require less stringent controls and permit less effective control devices.
The manual consists of 11 chapters, each by different authors and 4 appendices. The first chapters treat the history of Air Pollution in Los Angeles County, the types of air contaminants, and the design of air pollution control devices. The remaining chapters discuss the control of air pollution from specific sources. A reader interested in controlling air pollution from a specific source can gain the information needed by referring only to the chapter dealing with that source. If he then desires more general information about an air pollution control device, he can refer to the chapters on control devices.
Many actual field test results are included in this manual. They involved hundreds of painstaking man-years of engineering innovation In the air pollution control field and were carried out by the technical personnel of the Los Angeles County Air Pollution Control District, whilst working closely with Industry. This is recommended as excellent material which can be used as a guiding reference for air pollution control from specific sources in this country. J.F. MAHER
INDUSTRIAL ENGINEERING LTD. Chemical Plant and Engineering Division
APPLICATIONS are invited for the following positions for location In Melbourne — ( A ) MANAGER — DUST CONTROL DIVISION SALARY in the vicinity of $7,500 per annum. Responsible for the development of Sales and Sales applications for Dust Collection Equipment in Australia and New Zealand. A Degree or Diploma in Mechanical Engineering and experience with Dust Collection Equipment is essential. (B) DUST CONTROL ENGINEER
SALARY in the vicinity of $6,500 per annum. To assist the Manager of the Dust Control Division in the development of Sales and applications for Dust Control Equipment. A Degree or Diploma in Mechanical Engineering and experience in Dust Collection applications desirable. Contributory Superannuation is available and includes a life cover.
The Dust Control Equipment manufactured under licence has the highest world-wide reputation and includes Mikro-Pulsaire bag type collectors, Airetron Venturi Scrubbers and Cyclones, and Skirtevant Electrostatic precipitators. Complete supporting technical and application information is available from the Licensors.
Applications should be sent to- THE MANAGING DIRECTOR Chemical Plant and Engineering Division, 97 Franklin Street, Melbourne, 3000
42 Clean Air / July, 1970