Journal Research - SIJRsijr.in/articles/june2018/Sahyadri-Journal-Research-Vol-4-Issue-1.pdf · Dr....
56
Sahyadri Journal of Research JUNE 2018 VOL.4 ISSUE 1 SIJR Journal Research Research Papers Review Papers Scientific Articles International ISSN 2456-186X
Transcript of Journal Research - SIJRsijr.in/articles/june2018/Sahyadri-Journal-Research-Vol-4-Issue-1.pdf · Dr....

Sahyadri Journal of Research JUNE 2018VOL.4 ISSUE 1
SIJRJournal
Research
Research Papers
Review Papers
Scientific Articles
International
ISSN 2456-186X

Advisors
Editorial Board
Editors
Dr. D L Prabhakara (Director)
Dr. Manjappa Sarathi (Director-Consultancy)
Dr. Umesh M Bhushi (Director- Strategy & Planning)
Dr. R Srinivasa Rao Kunte (Principal)
Dr. Rajesha S (Dean- Academic)
Mr. Ravichandra K. Rangappa (Dean-Industry)
Mr. Ramesh K G
Dr. Shriganesh Prabhu, TIFR, Mumbai
Dr. Dinesh Kabra, IITB, Mumbai
Dr. Pushpalatha K - Editor-in-Chief
Dr. Ramakrishna Sharma
Dr. Navin N Bappalige
Dr. Rathishchandra Gatti
Dr. Ravindra Babu G
Dr. Niraj Joshi
Dr. M B Savitha
Mr. S N Bharath Bhushan
Mr. Balaji N
Mrs. Geetha S D
Mrs. Megha N
Mrs. Aysha Shabana
Mrs. Smitha
Disclaimer: The individual authors are solely responsible for
infringement, if any, of Intellectual Property Rights of third
parties. The views expressed are those of the authors. Facts
and opinions published in SIJR express solely the opinions of
the respective authors. Authors are responsible for citing of
sources and accuracy of references and bibliographies.
Although every effort will be made by the editorial board to
see that no inaccurate or misleading data, opinion or
statements appear in this journal, the data and opinions
appearing in the articles including editorials and
advertisements are the responsibility of the contributors
concerned. The editorial board accepts no liability
whatsoever for the consequences of any such inaccurate or
misleading data, information, opinion or statements.
Contents
SAHYADRI International Journal of Research | Vol 4 | Issue 1 | June 2018
Contents
Research / Review Articles
Editorial 1
Nano Ceramic Matrix Composite Development and Its
Applications 2-7
Isolation of Omega 3 Fatty acid from Fish oil 8-11
Useful Application of Plastic Waste in Composite Brick
Manufacturing 12-14
Aptitude Question Solver: AptitudeQS 15-21
An Integrated Approach for Personality Analysis using
OCR and Text Mining 22-26
Recognition of Overlapping Sound Events 27-31
IoT Based Energy & Waste Management for Smart Cities 32-35
ADS Recommendation Using Data Mining 36-39
Multilevel Encryption for Cloud Storage 40-42
War Field Spy Robot 43-45
Accessing Spatial Variability of SOC Content Using
GIS Based Interpolation Techniques 46-49
Study On Strength Of Hybrid Concrete Beam 50-52
Vol. 4, Issue 1ISSN 2456-186X (Online)ISSN Pending (Print)
Mailing Address:Editor Sahyadri International Journal of ResearchSahyadri campus, Adyar, Mangalore - 575 007, IndiaE-mail: [email protected]: www.sijr.in
SAHYADRIInternational Journal of Research

It gives us immense pleasure to bring out Volume 4, Issue 1 of Sahyadri International Journal of Research
(SIJR). The journal covers the wide disciplines in science, engineering and technology. SIJR is published
biannually and is an open access journal available online. The focus of the Journal is to motivate the
researchers of various disciplines to publish their quality research. The most important disciplines in
which we would focus are: Physics, Chemistry, Applied Mathematics, Electronics and Communication,
Mechanical Engineering, Civil Engineering and Computer Science and Engineering. This issue has the
research and review articles of current trends in various disciplines.
In this occasion I would like to express heartfelt appreciation to all authors and reviewers of the SIJR on
behalf of the entire editorial board and the publisher. It was with the mere co-operation, enthusiasm,
and spirit of the authors and reviewers we could make SIJR a grand success. I thank all the authors in
considering and trusting SIJR as the platform for publishing their valuable work. I also thank for their
kind co-operation extended during the various stages of processing of the manuscript in SIJR.
The reviewing of a manuscript is very essential to assure the quality of the manuscript published in any
journal. The inputs of reviewers are frequently used in improving the quality of a submitted manuscript.
I thank all reviewers for their excellent contributions and support for the journal.
I also wish to acknowledge the contributions made by the dedicated members of our Editorial Board,
the invaluable support given by advisors and the Sahyadri Management, and the hard working,
professional staff of the publishing office.
Finally, I would like to thank the readers of SIJR, for your interest in the journal. We welcome your
valuable feedback and ideas for further improvement of SIJR.
Editor-in-Chief
Editorial
1SAHYADRI International Journal of Research | Vol 4 | Issue 1 | June 2018

SAHYADRI INTERNATIONAL JOURNAL OF RESEARCH, VOL 4, ISSUE 1, 2018
ISSN: 2456-186X, Published Online June, 2018 (http://www.sijr.in/)
2
Nano Ceramic Matrix Composite Development and
Its Applications
Priyanka Singh1, Nathi Ram Chauhan2, Rajesha3*
1 JSS Academy of Technical Education, Noida, 201301, India 2 Indira Gandhi Delhi Technical University for Women (IGDTUW), New Delhi, 110006, India
3Sahyadri College of Engineering & Management, Mangaluru, 575007, India *Email: [email protected]
ABSTRACT
The nano ceramic matrix composite is used in variety of applications due to its unique physical properties and capability
to perform better at elevated temperature. Research is going on worldwide to understand the characteristics of such
composite material and better fabrication methods. Some of the fabrication methods, physical properties and
microstructure characteristic have been reported so far and process needs further investigation for better understanding
the characteristics of such matrix. In this paper, emphasis is given on are fabrication methods, physical behavior and
probable application of nano composites reported so far and efforts has been made to indicate the future scope of study
on nano ceramic composite.
Keywords: Ceramic composite, microstructure, Strengthening potential
1. INTRODUCTION
Nanocomposite are materials in which at least one of the
dimensions is in nano meter range. Reduction of reinforcement
to nano range makes interaction of particles with dislocation
more significant and leads to improvement in various
properties which have proven to be useful for a wide range of
critical applications. Extensive research is going on worldwide
to improve the desirable properties of ceramics by adding
reinforcements and limiting their inherent weaknesses. The
Ceramic composites based on SiC, Si3N4, TiN, TiB2,
Alumina, Zirconia, TiC and many other have been developed
and mechanical properties such as tensile, compressive, fatigue
resistance, fracture toughness, R-Curve behavior, creep have
been studied by various researcher for different CMCs. At
elevated temperature better physical properties of CMCs are
obtained as compared to monolithic composite due to
nanoscale reinforcement (increasing the surface to volume
ratio) which makes it suitable for ceramic cutting tools, wear
resistive components, radiation resistive ceramic component,
aerospace, & automobile components and other applications.
Fracture toughness decreases when components are subjected
to high temperature limits in some application, however, it is
also reported that toughness improves with reinforcement in
CMCs.
Main challenges are involved in synthesis of these materials
which require advanced processing techniques. These
challenges can be either due to the characteristic of reinforcing
phase or limited processing techniques.
This paper is aimed at reviewing the fabrication methods,
mechanical properties, strengthening mechanism and
application in field of ceramic matrix composite reported by
various investigators.
2. PREPARATION METHODS AND
PROPERTIES
Self-propagating high-temperature synthesis (SHS) method is
basically used for producing inorganic compounds by
exothermic reactions, usually involving salts. Synthesis of
nano-sized precursor powders is performed by special
techniques like high energy ball milling process, sol-gel
processing, gas condensation process, inert SHS reaction and
infiltration technique. Consolidation difficulties of nano-sized
powders, caused by their higher propensity to form strong
agglomerates because of very high ratio of surface area to
volume may be reduced by using various specialized
techniques while their fabrication.
Infiltration methods are used to fabricate ceramic matrix
composites reinforced with long fibers. This type of Ceramic
matrix is formed with a fluid (liquid or gases) which is
infiltrated into the fiber structure. The surfaces of the
reinforcing fibers are coated with a deboning interphase prior
to infiltration which weakens the bonds interface between
matrix materials and the fiber. Weak bonding allows these
long fibers to slide in the matrix and this results in the
prevention of brittle fracture [1].
SAHYADRI INTERNATIONAL JOURNAL OF RESEARCH, VOL 4, ISSUE 1, 2018
3
In Sol gel processing, sol is formed by dispersing the matrix
and reinforcing particles in the liquid. The deposition of this
sol solution results in coating on substrates by spraying,
dipping or spinning process. Gel is formed from evaporation
of solvents and particles or ions join together to form network.
Thermal treatment is done to enhance mechanical properties. It
is low temperature process and generates highly pure and well
controlled ceramics [2].
Nano SiC/TiN composite was prepared by sol gel method
using, TiN nanopowder as toughening phase, b-SiC nano
powder as matrix phase and YAG (synthetic yttrium aluminum
garnet) as sintering additive. Combination of aqueous slurry
with spray-drying was used to prepare Nano SiC based
granules. It was then uniaxially pressed at 160 MPa for 10s
and pressed isostatically with a pressure of 250 MPa for 300
seconds [3]. TiC x/2009Al particles were ball milled at a
speed of 100 rpm for 50 hours. Combustion synthesis was
conducted in self-made vacuum vessel with a vacuum degree
about 0.5 tar. Composites were extruded at 773 K under an
extrusion ratio of 16:1 [4].
Al2O3/ AlN particle were ball milled in ethanol for 48 hours
and then dried [5]. In Al2O3/TiC nano composite, the nano
scale TiC powders were prepared into suspension using
dispersant as polyethylene glycol and alcohol as the dispersing
medium. After that, micro-scale TiC, Al2O3, and cobalt was
added into the suspensions. After ball milling for 48 hours, dry
type evaporator with vacuum was used for drying [6].
Alumina/zirconia/nano-TiO2 ceramic composites were ball
milled for 2 hours for mixing. The mixed powder was semi-
dried and pressed at 100 MPa [7].
In ZrC/SiC composite, ZrC powder was first heated in air
for about 10 hours at 250°C and mixed with SiC powder and
pyrolysed under argon at 600°C for 5 hours and further ball
milled [8]. In α- Al2O3/Si3N4 nano composite, α- Al2O3 and
Si3N4 were mixed and ball-milled with ethanol for 72 hours
and dried in a vacuum dry evaporator at 110°C [9].
Earlier most of the nano ceramic matrix composite were
developed using hot isostatic pressing (HIP), hot pressing and
sinter forging. Sintering kinetics is increased by the application
of working pressure above atmospheric pressure. Limitation of
conventional sintering techniques is the formation of strong
agglomerates of nano sized powder due to extremely high ratio
of surface area to volume which results in difficulty in
consolidation leading to poor mixing, inhomogeneous packing,
residual porosity and poor density.
With the advancement in fabrication technique today, most
of the nano ceramic composite are fabricated by Spark Plasma
Sintering (SPS). Heating rapidly to sintering temperature
(Temperature lower than conventional sintering) and less
holding time results in good control of the fine grain size,
retention of nano scaled microstructure and high relative
densities.
SPS of ZrC/SiC for developing ceramic composite was done
at 1950°C temperature for 15 minutes under vacuum with a
pressure of 50 MPa. The sample was then cooled to 1200°C
with 25°C/min in order to reduce any quenching stresses. It
was observed during sintering of the composite that overall
strain associated to the applied load was preferably
accommodated by plastic deformation of ZrC to a much lesser
degree by the formation of stacking faults through phase
transition operating within SiC. Sintering temperature in this
process was high for retaining better properties [8].
ZrC/SiC Composite has been developed by solution based
processing using divinylbenzene, polycarbosilane
polyzirconoxane, to obtain ZS precursor prepared at 200°C
and then heat-treated for 2 hours to a temperature of 1500°C
with 5°C/min heating rate in argon atmosphere. Highly
crystalline ZrC and SiC phases were observed in ceramic
powders with 100–400 nm particle size. Distribution of Zr, Si,
C was uniform at different sites in the powder. ZrC/SiC weight
ratio was varied to control different element in the sample and
precursors with good stability and processibility was used in
polymer infiltration pyrolysis process. The prepared composite
sample with less carbon content exhibited good oxidation
resistance at high temperature [10].
In another method of fabricating ZrC/SiC Composite, tape-
casting process and vacuum hot-pressing was used. In this
method, ZrC and SiC powder was used as raw material for
tape casting. First, sols of 5 wt% polyvinyl butyral resin (PVB)
and 5 wt% polyethylene glycol were dissolved in ethanol as
the adhesive and plasticizer, respectively. The mixture was
placed in a water bath heated at 60 °C to obtain a homogenous
material. Second, 20 wt% ZrC powder was introduced to the
above mixture and dispersed in ethanol by ultrasonic agitation
for 2 hours to form a homogenous mixture with a certain
viscosity. Third, tape casting mould was used for placement of
sol on it at room temperature for 8 hours and were cut into
slices in the form of sheets. The same steps were carried out
for SiC and then ZrC and SiC sheets were alternately stacked.
The stacked sheets were heated at 550 °C for 60 min with
heating rate of 10 °C/min to remove the binder. Finally,
vacuum hot pressing furnace at 1700 °C was used for sintering
the laminated sample for 90 min under an applied pressure of
20 MPa. Fracture behavior of laminated ZrC–SiC ceramics
was quite different from brittle fracture and showed a non-
catastrophic failure behavior. The crack deflection extended
the crack propagation path and increased the energy
consumption capacity of laminated ceramics and thus
increased the fracture toughness [11].
Sintering of Al2O3/TiC was done between 1600ºC - 1700ºC
in sintering furnace in vacuum for 10-30 minutes [6]. Wetting
between metal interfaces and ceramic was improved by the
addition of cobalt in the composite. Cobalt presence at grain
boundary not only prevented TiC and Al2O3 from growing but
also restricted the reaction between TiC and Al2O3 during the
process, vapour phase formed during processing caused pores
in Al2O3/TiC ceramics. At maximum sintering temperature
cobalt liquefied and filled the pores in grains exhibiting better
density. However, in Al2O3/TiC composite fabricated by
Spark Plasma Sintering at different temperatures 1100 ºC,
1200 ºC, 1400 ºC, 1500 ºC for 3 minutes with 50 ºC /minute
heating rate at a load of 60 MPa, complete densification was
observed at lower sintering temperature than conventional
sintering [12].
Another method of fabrication of Al2O3/TiC nano
composite has been reported, using hot pressing. The samples

SAHYADRI INTERNATIONAL JOURNAL OF RESEARCH, VOL 4, ISSUE 1, 2018
4
were prepared using alpha alumina, micro TiC, nano TiC and
Cobalt. Firstly the TiC powder (nano scale) was prepared into
suspension using dispersant as polyethylene glycol and alcohol
as dispersing powder and subjected to ultrasonic dispersion for
20 minutes. PH value of 9 was obtained by addition of
NH3.H2O. It was then mixed and ball milled for 48hours and
dried in dry type evaporator in vacuum. The dried powder was
poured in graphite die and hot pressed with a pressure of 32
MPa at 1650°C in vacuum sintering furnace for 20 minutes.
Composite showed better wear resistance and fatigue behavior
to be used as tool material [13].
Alumina/zirconia/nano-TiO2 nano composite sintered at
temperature of 1600 ºC for 1 hour with 5 ºC /min heating rate
from room temperature to 1000 ºC, and 2.5 ºC /min heating
rate from 1000 ºC to 1600 ºC. Addition of TiO2 formed
Al2TiO5 ceramic which showed resistance to thermal shock
[7]. However, high sintering temperature decomposed Al2TiO5
into Al2O3 and TiO2 leading to increase in apparent porosity.
Two step pressureless sintering for fabrication of Nano-
SiC/TiN nano composites reported in [3].Composites were
first sintered at 1900ºC for 15 minutes in vacuum furnace and
second step sintering at 1700 ºC, 1750 ºC, 1800 ºC and
1850ºC for 45 min at each temperature. YAG was used as
sintering additive for densification. The densification in
second step sintering was observed by slower grain boundary
diffusion which restricted the grain growth. Y2O3 was used as
sintering additive for fabrication of α- Al2O3/Si3N4 by hot
pressing at 1450°C temperature in vacuum for 30 minutes
under a pressure of 32 MPa. Due to the covalent bonding
nature of Si3N4, it was sintered to a high density by addition of
Y2O3 as sintering additive [9]. Al2O3/AIN composite was
fabricated at 1600 ºC under an applied pressure of 30 MPa for
180 minutes [5].
Fabrication of nano ceramic composite by stir casting
method is reported by few investigators. A resistance furnace
equipped with inert gas injection instrument and a graphite
stirring system was used to fabricate TiB2/ A356 Al nano
composite at casting temperatures of 750 ºC, 800 ºC and 900
ºC. An increment of volume fraction of reinforcements and
decrement of the particle’s size lead to the increment of the
porosity content. Decreased density and dislocation pile up
phenomena was observed due to the presence of slip band in
the matrix. Stir casting method of fabrication is not suitable for
fabricating nano ceramic composite [14].
Zirconia toughened alumina nanocomposite was developed
by SPS at 1100°C with heating rate of 500°C/min via
combination of High Energy Ball Milling process followed by
SPS of γ-alumina powders added with zirconia and yttria. Full
densification was observed in nanocomposites which was
SPSed at 1100°C. The hardness and toughness was increased
which is almost three times than monolithic alumina due to
addition of zirconia [15].
2.1 Mechanical Properties
Development of new material implies value-added to the
physical properties. CMCs shows improvement in mechanical
properties due to superior strength, hardness, abrasion
resistance and chemical inertness in comparison to other
materials. Reduction of grain size to nano meter range leads to
hardness increment which improves mechanical properties as
reduced wear behaviour, higher fracture toughness and higher
resistance against abrasion. Physical properties of CMCs vary
with fabrication techniques indicating that better the
fabrication method better is the development of CMC material.
The reduction of grain size to nano metric range of SiC in the
composite ZrC/SiC fabricated by spark plasma sintering leads
to an improvement of fracture toughness and flexural strength
due to densification at high sintering temperature, the overall
strain associated with the applied load was preferentially
accommodated by the plastic deformation of ZrC [8]. The
creep behavior remained unaffected upto 1600 ºC in Al2O3–
TiC composites fabricated by the same method at lower
sintering temperature showed homogenous distribution of
titanium carbide in the alumina matrix, there was no new phase
formations during sintering. The fully dense Al2O3/TiC
composite showed higher Young’s modulus and hardness
values. Scratch test on the bulk sample showed that sample
sintered at higher temperature had better scratch resistance due
to strong bonding of the particle [12]. Addition of Cobalt in
Al2O3/TiC fabricated by chemical deposition method revealed
greater improvement in fracture strength of composite.
Fracture toughness was also increased reducing the crack
propagation [6]. Two step pressure less sintering of Nano-
SiC/TiN nano composites densified the composite with
improved properties as Vicker’s hardness, bending strength
and fracture toughness. Similarly addition of YAG in
composite enhanced toughness by crack deflection [3]. Hot
pressing of Al2O3/AIN composite at high temperature showed
significant improvement in the properties like flexural
strength, fracture toughness and relative density [5].
Hot pressed α- Al2O3/Si3N4 nano composite at lower
temperature revealed optimum mechanical properties as
flexural strength, hardness, fracture toughness and high
relative density [9]. Increased in Si3N4 content beyond
optimum value lead to crack formation on applied load which
weakened the grain boundary strength and caused stress
concentration. Flexural strength was decreased due to
propagation of cracks easily. Sintering of
alumina/zirconia/nano-TiO2 ceramic composites exhibited
higher density and less porosity. Hardness was significantly
improved along with resistance to thermal shock [7].
The strengthening mechanism of Nano ceramic matrix
composite is used to analyze the physical properties of the
material. Orowan Strengthening Mechanism [16-18] has been
used to analyze the effect of reinforcement and inter
particulate spacing of secondary phase disperiods. Orowan
strengthening is caused by resistance of particles to the passing
of dislocations. Creep resistance raises considerably even for a
small volume fraction due to dispersion of fine insoluble
particle in the ceramic matrix. Ceramic reinforcement particle
pin the crossing dislocation and assist dislocation in bowing
around the particles. For simulation of better mechanical
SAHYADRI INTERNATIONAL JOURNAL OF RESEARCH, VOL 4, ISSUE 1, 2018
5
properties of nano ceramic composite Orowan loop
mechanism is used.
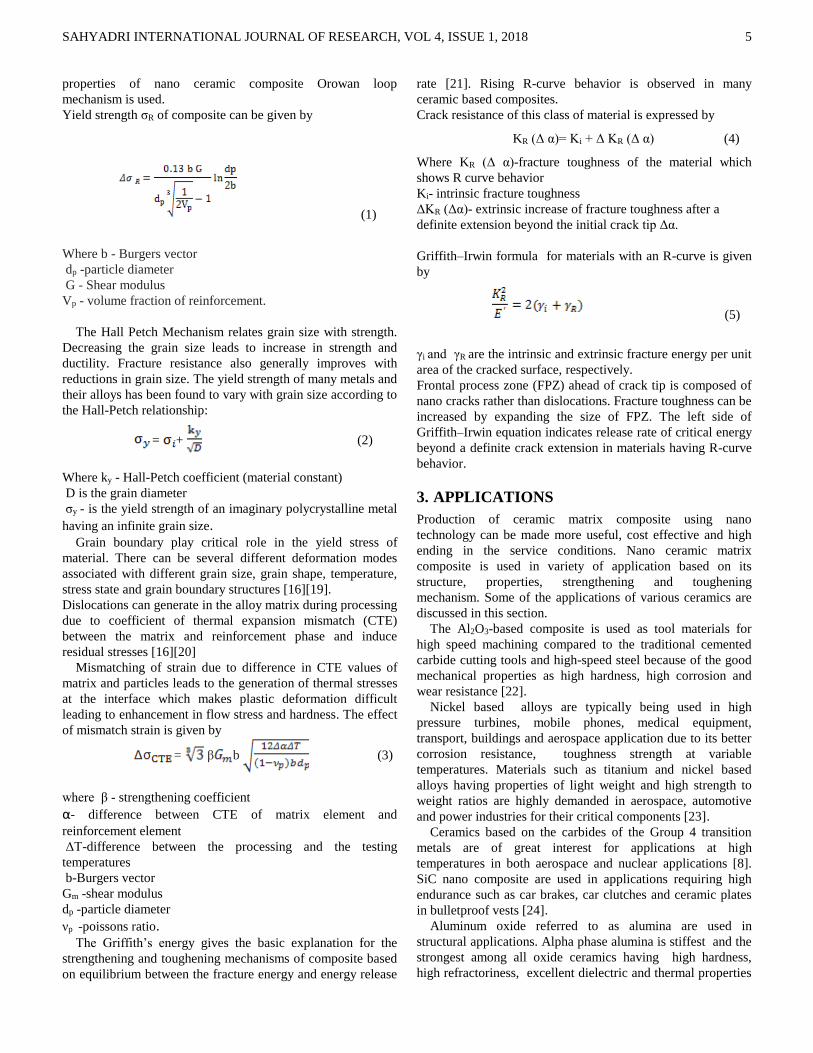
Yield strength σR of composite can be given by
(1)
Where b - Burgers vector
dp -particle diameter
G - Shear modulus
Vp - volume fraction of reinforcement.
The Hall Petch Mechanism relates grain size with strength.
Decreasing the grain size leads to increase in strength and
ductility. Fracture resistance also generally improves with
reductions in grain size. The yield strength of many metals and
their alloys has been found to vary with grain size according to
the Hall-Petch relationship:
= + (2)
Where ky - Hall-Petch coefficient (material constant)
D is the grain diameter
σy - is the yield strength of an imaginary polycrystalline metal
having an infinite grain size. Grain boundary play critical role in the yield stress of
material. There can be several different deformation modes
associated with different grain size, grain shape, temperature,
stress state and grain boundary structures [16][19].
Dislocations can generate in the alloy matrix during processing
due to coefficient of thermal expansion mismatch (CTE)
between the matrix and reinforcement phase and induce
residual stresses [16][20]
Mismatching of strain due to difference in CTE values of
matrix and particles leads to the generation of thermal stresses
at the interface which makes plastic deformation difficult
leading to enhancement in flow stress and hardness. The effect
of mismatch strain is given by
= β b (3)
where β - strengthening coefficient
α- difference between CTE of matrix element and
reinforcement element
ΔT-difference between the processing and the testing
temperatures
b-Burgers vector
Gm -shear modulus
dp -particle diameter
νp -poissons ratio. The Griffith’s energy gives the basic explanation for the
strengthening and toughening mechanisms of composite based
on equilibrium between the fracture energy and energy release
rate [21]. Rising R-curve behavior is observed in many
ceramic based composites.
Crack resistance of this class of material is expressed by
KR (Δ α)= Ki + Δ KR (Δ α) (4)
Where KR (Δ α)-fracture toughness of the material which
shows R curve behavior
Ki- intrinsic fracture toughness
ΔKR (Δα)- extrinsic increase of fracture toughness after a
definite extension beyond the initial crack tip Δα.
Griffith–Irwin formula for materials with an R-curve is given
by
(5)
γi and γR are the intrinsic and extrinsic fracture energy per unit
area of the cracked surface, respectively.
Frontal process zone (FPZ) ahead of crack tip is composed of
nano cracks rather than dislocations. Fracture toughness can be
increased by expanding the size of FPZ. The left side of
Griffith–Irwin equation indicates release rate of critical energy
beyond a definite crack extension in materials having R-curve
behavior.
3. APPLICATIONS
Production of ceramic matrix composite using nano
technology can be made more useful, cost effective and high
ending in the service conditions. Nano ceramic matrix
composite is used in variety of application based on its
structure, properties, strengthening and toughening
mechanism. Some of the applications of various ceramics are
discussed in this section.
The Al2O3-based composite is used as tool materials for
high speed machining compared to the traditional cemented
carbide cutting tools and high-speed steel because of the good
mechanical properties as high hardness, high corrosion and
wear resistance [22].
Nickel based alloys are typically being used in high
pressure turbines, mobile phones, medical equipment,
transport, buildings and aerospace application due to its better
corrosion resistance, toughness strength at variable
temperatures. Materials such as titanium and nickel based
alloys having properties of light weight and high strength to
weight ratios are highly demanded in aerospace, automotive
and power industries for their critical components [23].
Ceramics based on the carbides of the Group 4 transition
metals are of great interest for applications at high
temperatures in both aerospace and nuclear applications [8].
SiC nano composite are used in applications requiring high
endurance such as car brakes, car clutches and ceramic plates
in bulletproof vests [24].
Aluminum oxide referred to as alumina are used in
structural applications. Alpha phase alumina is stiffest and the
strongest among all oxide ceramics having high hardness,
high refractoriness, excellent dielectric and thermal properties

SAHYADRI INTERNATIONAL JOURNAL OF RESEARCH, VOL 4, ISSUE 1, 2018
6
which makes it a suitable choice for different applications
such as in manufacturing of wear pads, grinding media, seal
rings, high temperature electrical insulator and aerospace
components [25].
Alumina based ceramic, (ZrO2) toughened improves the
toughness and resistance to fracture and are used as tool material
[26]. Zirconia (ZrO2) based ceramic material with adequate
mechanical properties are used for manufacturing of medical
devices [27].
Alumina Mullite ceramic is used as a traditional and
advanced ceramic material because of having favorable thermal
and mechanical properties for structural applications [28].
Silicon nitride (Si3N4) ceramic material having excellent
thermo mechanical property is most suitable for structural
applications, bearings, cutting tools and engine components. It
performs better at high temperature retaining high strength and
creep resistance and low thermal expansion coefficient giving
good thermal shock resistance [9]. Titanium based ceramic are
used in the manufacturing of wear-resistant tools, cutting tools
and coating for abrasive steel bearings [29].
4. CONCLUSION
In this paper effort has been made to understand the CMCs
process of development and its characteristics. The
application of various CMCs literature report has been
discussed and following conclusions have been made.
Spark Plasma sintering is found to be most advanced
technique for fabrication of CMC which restricts the grain
growth and densify the material at high temperature providing
better strength.
Effect of various phases play an important role in internal
stress distribution within the composite affecting the
properties. Mechanical behavior of nano composite is
presented which showed strength and hardness increased by
nano particle reinforcement. However, flexural strength is
decreased in some cases with the increase in reinforcement
percentage.
Exclusive study and development of better CMCs
fabrication techniques are needed for improving overall
properties to be used for wide range of application.
REFERENCES
[1] Rosso M, “Ceramic and Metal Matrix Composite Routes
& properties”, Journal of material Processing and
technology, 175 (2006) 36-375
[2] Schmidth H, “Chemistry of material preparation by sol-gel
process”, Journal of Non Crystalline solids Volume 100
(1988) 51-64
[3] Xingzhong Guo, Hui Yang, Xiaoyi Zhu and Lingjie
Zhang, “Preparation and properties of nano-SiC-based
ceramic composites containing nano-TiN”, Science
Direct, China, November 2012
[4] Lei Wang, Feng Qiu, Jingyuan Liu, Huiyuan Wang,
Jinguo Wang, Lin Zhu, Qichuan Jiang, “Microstructure
and tensile properties of in situ synthesized nano-sized
TiCx/2009Al composites” , Science Direct, China, April
2015
[5] Qinggang Li, Chao Wu, Zhi Wang, “Mechanical
properties and microstructures of Nano-Al2O3 particles
reinforced Al2O3/AlN composite”, Journal of Alloys and
Compounds 636(2015) 20-23, China , February 2015
[6] Huang L.P., J. Li, “Properties of cobalt-reinforced
Al2O3–TiC ceramic matrix composite made via a new
processing route” Science Direct , China, September 1998
[7] Wahsh M.M.S., R.M. Khattab, M.F. Zawrah “Sintering
and technological properties of Alumina/zirconia/nano-
TiO2 ceramic composites”, Science Direct, Egypt,
December 2012 .
[8] Antou G., M.D. Ohin , R. Lucas, G. Trolliard, W.J. Clegg,
S. Foucaud, A. Maître, “Thermomechanical properties of
a spark plasma sintered ZrC–SiC composite obtained by a
precursor derived ceramic route”, Science Direct,
Material Science and Engineering A 643 (2015) 1-11,
UK, July 2015
[9] Xiaolan Bai, Chuanzhen Huang , Jun Wang, Bin Zou,
Hanlian Liu, “Fabrication and characterization of Si3N4
reinforced Al2O3-based ceramic tool materials”, Science
Direct, China, June 2015
[10] Dan Liu, Wen-Feng Qiu, Tao Cai , Ya-nan Sun, Ai-Jun
Zhao, and Tong Zhao, “Synthesis, Characterization, and
Microstructure of ZrC/SiC Composite Ceramics via
Liquid Precursor Conversion Method”, China, 2014
[11] Yuanyuan Li , Qinggang Li , Zhi Wang , Shifeng Huang ,
Xin Cheng, “Fabrication and crack propagation behaviour
of ZrC/SiC laminated Composite”, Material Science and
Engineering A647 (2015) 1-6
[12] Rohit Kumar, A.K.Chaubey, Sivaiah Bathula, B. B. Jha
and Ajay Dhar, “Synthesis and characterization of Al2O3-
TiC nano-composite by spark plasma sintering”,
IJRMHM, India, August 2015
[13] Zengbin Yin, Chuanzheng Yuan, Bin Zou, Hanlian Liu,
Hongtao Zhu, “ Cutting performance and life prediction of
an Al2O3/TiC micro-nano-composite ceramic tool when
machining Austenitic steel”, China, 2014
[14] Karbalaei Akbari M., H.R. Baharvandi, K.
Shirvanimoghaddam, “Tensile and fracture behavior of
nano/micro TiB2 particle reinforced casting A356
aluminum alloy composites”, Materials and design 66
(2015)150-161, Iran, October 2014
[15] GD Zhan, J Kuntz, J Wan, J Garay and A K Mukherjee ,
American Ceramic Society 86 [1] (2003
[16] M. Habibnejad-Korayema, R. Mahmudi , W.J. Poole ,
“Enhanced properties of Mg-based nano-composites
reinforced with Al2O3 nano-particles”, Materials Science
and Engineering Iran, A 519 (2009) 198–203
[17] Zhang, Z, Chen.D.L, “Contribution of Orowan
strengthening effect in particulate-reinforced metal matrix

SAHYADRI INTERNATIONAL JOURNAL OF RESEARCH, VOL 4, ISSUE 1, 2018
7
nanocomposites”, Material Science and Engineering A
(2008), pp.148-152, 483-484
[18] Zhang, Z, Chen. D.L, “Contribution of Orowan
strengthening effect in particulate-reinforced metal matrix
nanocomposites: A model for predicting their yield
strength”, A Material Science and Engineering A (2006)
54, pp.1321-1326
[19] John Bosco R, “Melting points, mechanical properties of
nanoparticles and Hall Petch relationship for
nanostructured materials”, Sastr University, Bangaluru
[20] M. Habibnejad-Korayem, R. Mahmudi , W.J. Poole,
“Enhanced properties of Mg-based nano-composites
reinforced with Al203 nano particled”, Material Science
and Engineering A 519 (2009) 198-203
[21] Hideo Awaji, Seong-Min Choi, Eisuke Yagi,
“Mechanisms of toughening and strengthening in ceramic-
based nanocomposites”, Science Direct, Japan, February
2002.
[22] Zengbin Yin, Chuanzhen Huang , Bin Zou , Hanlian Liu,
Hongtao Zhu, Jun Wang , “Study of the mechanical
properties, strengthening and toughening
mechanisms of Al2O3/TiC micro-nano-composite ceramic
tool material”, Elsevier, Material Science and
Engineering A 577 (2013) 9-15
[23] Tresa M. Pollock and Sammy Tin, "Nickel-Based
Superalloys for Advanced Turbine Engines :Chemistry,
Microstructure and Properties", Journal of Propulsion and
Power, Vol. 22, No. 2 (2006), 361-374.
[24] Kumar Sidheshwar , Singh Bhagirathi, “Study on SiC
produced from rice husk as reinforcing agent”
,Department of Metallurgical & Materials Engineering,
NIT Rourkela
[25] Cheng-Liang Huang , Jun-Jie Wang , Chi-Yuen Huang ,
“Sintering behavior and microwave dielectric properties
of nano alpha-alumina”, Materials Letter 59 (2005) 3746-
3749
[26] A. Senthil Kumar , A. Raja Durai , T. Sornakumar,
“Machinability of hardened steel using alumina based
ceramic cutting tools”, International Journal of Refractory
Metals and Hard Materials 21 (2003) 109-117
[27] J.Chevalier, L. Gremillard, “Ceramics for medical
applications: A picture for the next 20 years
”, Journal of European Ceramic Society 29 (2009) 1245-
1255
[28] Eugene Medvedovski, “Alumina–mullite ceramics for
structural applications”, Ceramic International 32 (2006)
369-375
[29] Bellosi, R. Calzavarini, M.G. Faga, F. Monteverde, C.
Zancolò, G.E. D’Errico, “Characterisation and application
of titanium carbonitride-based cutting tools”, Journal of
Materials Processing Technology 143-144 (2003) 527-
532

SAHYADRI INTERNATIONAL JOURNAL OF RESEARCH, VOL 4, ISSUE 1, 2018
ISSN: 2456-186X, Published Online June, 2018 (http://www.sijr.in/)
8
Isolation of Omega 3 Fatty Acid from Fish Oil
Sahana C Hiremath1, C T Puttaswamy1, Sarathi Manjappa2*, Ajith B S 2
1Department of Chemical Engineering, BMS College of Engineering, Basavangudi, Bengaluru, India 2Research Centre, Sahyadri College of Engineering and Management, Mangaluru, India - 575007
*Email: [email protected]
ABSTRACT
Omega 3 fatty acids containing Eicosapentaenoic acid (EPA) and Docosahexaenoic acid (DHA) play a beneficial role in
human health and as functional food. In this study fish oil was purchased from Fish oil and Fish meal extraction factory,
Mangalore. The standards were purchased from sigma Aldrich. The fish oil was further characterized by various
analytical techniques such as High performance Liquid chromatography (HPLC), thin layer chromatography (TLC),
Fourier infrared spectroscopy (FTIR) in order to isolate omega 3 fatty acids from fish oil. Quality of fish oil was analysed
in order to determine impurities, acid value and peroxide value of fish oil which was in recommended range. Traditional
extraction of omega 3 fatty acids are expensive and time consuming. Basically high yield and concentrated omega 3 fatty
acids from sardine fish oil were obtained by supercritical fluid extraction, urea complexation, low temperature
crystallization and molecular distillation, enzymatic hydrolysis. The main aim to enhance and improve the concentration
of polyunsaturated omega 3 fatty acids from saradine fish oil and production of biodiesel through Tansesterification after
recovery of omega 3 fatty acids.
Keywords: Omega 3 Fatty acid, Enzymatic Hydrolysis, Transesterification
1. INTRODUCTION
Fish is one of the perishable human food overall the world. Its
nutritional value includes phosphorous, magnesium, selenium.
Fish oil which is rich in EPA and DHA helps in the reduction
of heart attack, strokes, abnormal heart rhythms, death [1].
Omega 3 are the polyunsaturated fatty acids having carbon
carbon as double bond in its position [2]. Determination of
omega lipids in the fish oil comprises of several steps
including extraction, hydrolysis and derivatization and making
UV active compound for measured by HPLC [3].
HPLC with UV detector was a challenging task by making
sample derivatization helped to isolate an omega fatty acids in
fish oil [4]. EPA and DHA from fish oil content varies from
species to species and season. Conversion of fatty acids to
ethyl esters followed by molecular distillation, urea
crystallization damages the omega 3 fatty acids. Re-
esterification of fatty acids leads to a disturbance in backbone
of glycerol [5].
To overcome this destruction and challenges, lipase is used
for concentrating omega fatty acids due to its important
properties [6-7].
2. MATERIALS AND METHODOLOGY
2.1 Determination of acid value:
The acid value of the sardine fish oil sample was determined
according to the standard procedure described in the American
Oil Chemists Society (AOCS). 25 mL of 1:1 toluene-isopropyl
alcohol and 2 mL of phenolphthalein indicator were added into
250 mL conical flask and neutralized with 0.1N potassium
hydroxide to a faint but permanent pink color. In another
conical flask, 0.75 g of oil sample was weighed and 25 mL of
neutralized solvent mixture were added to the sample and
mixed thoroughly. Titration was then carried out with 0.1N
potassium hydroxide to permanent pink color. The acid value
(mg KOH/g of sample) was given by the following formula
[8].
Acid value = (1)
A= mL of standard alkali used in the titrating the sample
B= mL of standard alkali used in the titrating the blank
N= normality of standard alkali
W= grams of sample
56.1 is molecular weight of KOH in grams.

SAHYADRI INTERNATIONAL JOURNAL OF RESEARCH, VOL 4, ISSUE 1, 2018
9
2.2 Determination of p-Anisidine value
The p-Anisidine value of sardine fish oil sample was
determined using the standard protocol described in the AOCS
official method (AOCS). 0.7 g of oil was added into a 25 mL
volumetric flask.Volume was made up with diluted iso-octane.
The absorbance was measured at 350 nm with
spectrophotometer. 5:1 ratio of iso-octane and of p-anisidine
reagent were used as blank. 5:1 ratio of sardine oil and p
anisidine reagent was added to test tube and taken for UV
analysis after 10 minutes; the absorbance was measured at 350
nm. The p-anisidine value was given by the following
formula[8-9].
p-anisidine value = (2)
Where:
AS = absorbance of the oil solution: p-anisidine reagent
AB= absorbance of the oil solution
W= weight of sample
25= size of volumetric flask used
1.2= correction factor
2.3 Chemical hydrolysis of fish oil
The fatty acid of sardine fish oil composition has been
previously stated9.Among the fatty acids such as EPA (15.6%)
and DHA (10.7%), the hydrolysis of sardine fish oil was
performed in an organic and aqueous system. The protocol
was as follows: 2mL fish oil was added into 20mL of distilled
water along with 2g of NaOH and refluxed for around 8h at
1000C.
2.4 Thin layer chromatography
The various fatty acids are separated and fractionated by thin
layer chromatography. The lipids were fractioned using
hexane/ethyl acetate (75:25). The conditions for analysis of
fish oil were established by experimental selection of
appropriate stationary and mobile phases. Experiments were
performed on TLC silica gel aluminum plate. Good
separations were obtained in short time using mobile phase
Ethyl acetate (25%): Hexane (75%). TLC plate was spotted
with crude sample and esterified sample. Plates were then air
dried and analysed in UV chamber [4].
2.5 Preparation of UV absorbing derivatives
0.1-0.2 g of fish oil was transferred into round bottom flask. It
was dissolved in 2mL of acetonitrile and around 0.4 g of 4-
Nitrobenzyl bromide is added and exactly 0.2 g of potassium
carbonate was added in RB flask. The reaction mixture was
kept stirring at room temperature for 18 h. After refluxing the
sample was allowed to settle down and around 50 microliter of
sample was taken for analysis of TLC to check the state of
reaction. Remaining refluxed mixture is subjected to phase
separation using separating funnel and extracted with ethyl
acetate. Aqueous phase was separated and discarded and
further organic phase was concentrated using rotary evaporator
and subjected to HPLC analysis.
2.6 Characterization of fish oil by FTIR Spectroscopy
FTIR spectra of sardine fish oil were analyzed on a Perkin
Elmer RXI. The FTIR spectra were acquired from 3850-400
cm-1 with 4 cm-1 resolution by 20 scans with, monochromatic
infrared radiation as source, with LiTa 03 detector.
2.7 Concentration of n-3 fatty acids by enzymatic
hydrolysis
4g sardine fish oil, 6 mL of 1M phosphate buffer to activate
lipase enzyme and maintained pH of 7.5 and 1,150 Units (600
U/g) of lipase were transferred into a 50 mL conical flask. The
flask was transferred to water bath by maintaining temperature
at 35°C. The hydrolysis was started with the constant stirring
for 18 hours. The hydrolysis process was stopped by addition
of 2 mL methanol to the mixture. An amount of base was
added to neutralize the fatty acids obtained during hydrolysis.
The mixture was taken into a separating funnel and mixed
thoroughly with 50 mL hexane and 25 mL distilled water. The
upper layer containing ethyl esters was separated and was
washed twice with 50 mL distilled water. In order to remove
moisture content it is subjected with anhydrous sodium
sulphate [10] .After hexane removal at 45°C, ethyl esters were
recovered in a rotary evaporator.
2.8 Transesterification reaction
Transesterification was carried out in 50mL conical flask with
14mL of pure methanol and kept flask on the stirring plate
with constant speed to stir vigorously, and then slowly 0.50g
of NaOH added. Once NaOH is dissolved completely it forms
methoxide of sodium which serves as very strong and
dangerous base. Now place 30mL of fish oil which is warmed
at 65°C by placing it on stir plate under medium agitation, then
later add slowly the sodium methoxide solution to it which
forms a cloudy appearance and reaction mixture was kept for
around 20 minutes. Then transfer the above mixture into
separating funnel were biodiesel and glycerol was separated
based on their density [11].
3. RESULTS AND DISCUSSIONS
3.1 Quality of fish oil
Quality of fish oil was determined by standard AOAC method.
The obtained anisidine and acid value were in recommended
range.
3.2 FT-IR Spectrum
FTIR spectra of fish oil is shown in the figure 1, group
frequency ranging from 1750-1725 cm-1 clearly indicates esters
functional group ,by seeing figure 6 which clearly indicates the
presence of esters in the range 1745.84 cm-1.
3.3 EPA Standard
Figure 2, shows a typical Chromatogram of Eicosapentaenoic
Acid (EPA), a single fatty acid was found to have 92.63 area
percent of fatty acid DHA Standard.

SAHYADRI INTERNATIONAL JOURNAL OF RESEARCH, VOL 4, ISSUE 1, 2018
10
Figure 3 shows a typical Chromatogram of Docosahexaenoic Acid (DHA), a single fatty acid was found
to have 85.73 area percent of fatty acids.
3.4 Chemical method of separation
A chromatogram for chemically hydrolyzed fish oil is shown
in the figure 4. Here a single fatty acid was found to have 0.4
area percent of the omega 3 fatty acids.
Figure 1. FTIR spectra (4000-400cm-1) of fish oil
Figure 2. Chromatogram of EPA standard
Table 1: Recommended quality parameters of fish oil and
Experimental values
Quality
Parameter
Recommended
Value
Experimental
value References
Acid Value
7-8 mg of
KOH/g of
sample
7.48mg of
KOH/g of
sample
12
p-anisidine
value ≤20 19.575 13
3.5 Enzymatic method of separation
A chromatogram for enzymatic hydrolyzed fish oil is shown in
the figure 5. Here a single fatty acid was found to have 2.0826
area percent of the omega 3 fatty acids.
3.6 Biodiesel yield and its properties
Transesterification of fish oil resulted in the reduced kinematic
viscosity and density was within permissible limit which plays
an important role in fuel atomization. The flash point, fire
point were in limit of safe storage and handling conditions.
Figure 3. Chromatogram of DHA standard
Figure 4. Chromatogram of chemical method of separation by
HPLC

SAHYADRI INTERNATIONAL JOURNAL OF RESEARCH, VOL 4, ISSUE 1, 2018
11
Figure 5. Chromatogram of enzymatic method of separation by
HPLC
Table 2: Fuel properties of sardine fish oil ethyl esters
Parameters Obtained
value
Expected
value
viscosity at 40°C 3.41 20
Flash point(°C) 170 200
Fire point(°C) 180 215
Density kg/m3 830 920
4. CONCLUSION
Quality of fish oil was carried out by standard AOAC method.
The recommended range for p anisdine value of crude fish oil
is 7-8 mg of KOH /g. The obtained p anisidine value were in
the range of 7.48 mg of KOH /g of the sample. Anisidine value
is an empirical test which determines the advanced oxidative
rancidity of oils and fats. The obtained acid values were in the
recommended range, the acid values quantifies the amount of
acid present, TLC analysis helped in quantitative identification
of fatty acids present in fish oil. FTIR spectroscopy of the
sample clearly indicated that frequency ranging from 1745.84
cm-1 clearly indicated esters functional group.
Using various Analytical techniques, it is possible to isolate
different omega free fatty acids. Samples were hydrolyzed to
separate the fatty acids from their glycerol backbone and
analyzed directly using HPLC with UV detector. Chemical
method of separation shown that 0.4 area percent of omega 3
fatty acids were as enzymatic method of separation 2.0826
area percent of omega 3 fatty acids. Transesterification of fish
oil resulted in reduced kinematic viscosity and density within
permissible limit which meets and well within the biodiesel
characteristics as compared.
ACKNOWLEDGMENT
Authors are thankful to the Managements of
BMS College of Engineering, Bengaluru and Sahyadri
College of Engineering and Management for providing
infrastructure facilities to carry out their research work.
All India Council of Technical Education for their
financial support under Research Promotion Scheme.
M/s Mangaluru Marine Products.
REFERENCES
[1] Akoh, C.C., S. Sellappan, L.B. Fomuso and V.V. Yankah.
2002. Enzymatic synthesis of structured lipids. Lipid
Biotechnology. New York, NY: Marcel Dekker, Inc., 433-
460.
[2] David Cowan Agro food industry hi tech Aug 2010
.Concentration of omega 3 fatty acids using enzyme. Vol
21 n4.
[3] Ian Acworth,Marc Plante et al,Quantitation of
underivatized omega3 and omega 6 fatty acids in foods by
HPLC and charged aerosol detection,Thermo fisher
Scientific ,Chelmsford,MA,USA.
[4] Durst HD et al Anal Chem 1975, Preparation of UV
absorbing derivatives, 47, 1797.
[5] Klinkeson U, Aran H,et al .Chemical transesterification of
tuna oil to enrich omega 3 polyunsaturated fatty
acids.2004:87(3):415-21.
[6] Kralovec JA ,Wang W, Barrow CJ,Production of omega 3
triacylglycerol concentrates using a new food grade
immobilized Candida lipase 2010;63(6):922-8.
[7] Kosungi Y,Azuma Synthesis of triglycerol from
polyunsaturated fatty acid by immobilized
lipase,AOCS1994; 1397-403.
[8] P.Arul franco et al 2014 .Performance and emission study
of sardine fish oil Biodiesel in a diesel engine: oxidation
communications 37, no.3, 802-816.
[9] O’Brien, R.D. 2009. Fats and oils. Formulating and
processing for applications, 3rd ed., CRC press, London,
213-300.
[10] Wanasundara, U.N. and F. Shahidi. 1999. Concentration
of omega 3-polyunsaturated fatty acids of seal blubber oil
by urea complexation: optimization of reaction conditions.
Food Chemistry, 65, 41-49.
[11] Meher, L.C., D. Vidya Sagar and S.N. Naik. 2006.
Technical aspects of biodiesel production by
transesterification: a review. Renewable and sustainable
energy reviews, 10(3), 248-268.

SAHYADRI INTERNATIONAL JOURNAL OF RESEARCH, VOL 4, ISSUE 1, 2018
ISSN: 2456-186X, Published Online June, 2018 (http://www.sijr.in/)
12
Rajmunni Hombal1, Shwetha L G1, Pooja K1, Rathishchandra.R.Gatti2*
1 Department of Civil Engineering, Sahyadri College of Engineering & Management, Mangaluru-575007 2 Department of Mechanical Engineering, Sahyadri College of Engineering & Management, Mangaluru-575007
*Email:[email protected]
ABSTRACT
Plastic can be said as a waste, when it is not properly managed and hence imposes the negative environmental effects. All
types of non-bio-degradable and unused plastic waste, when cannot be recycled is sent to landfills. Landfills are becoming
a big environmental issue and hence expensive with lot of restrictive procedures, forcing the companies to look for
alternatives to dispose or reuse plastics. At the same time, reduced availability of conventional binding materials such as
clay tested in terms quantity and quality pose a frantic threat for the builders. The proposed research is an experimental
development and validation of the use of PET plastics to act as filler materials for brick manufacturing. Samples of bricks
were manufactured for studying few design parameters and were tested for the common brick evaluation standards as
prescribed by BIS proving that PET plastics can be used as filler materials.
Keywords: Composite, Environment, Plastics, Recycle, conventional
1. INTRODUCTION
Plastic waste involves the accumulation of plastic products in
the environment that adversely affects wildlife, habitat or
humans [1]. But plastic is a relatively cheap, durable and
versatile material and its products have brought benefits to
society in terms of economics and quality of life [2]. Because
of its demand and use, plastic waste generation has also
continued to grow. However, at the global scenario, although
its production and utility is being met according to the demand,
the proper disposal of plastics is not addressed satisfactorily.
Most of the plastics that are carelessly disposed to the
environment get directly or indirectly consumed by the animals
and has thus entered the food chain [3]. Since these plastics are
non-biodegradable and hence not digestible, they can block the
intestines leading to health hazards to animal life. Not many
plastics can be recycled [4]. Also, recycling not only incurs
costs but also emits harmful toxins to the air [5]. The other
option is to refill the plastics. However, plastics have become a
menace in the landfill areas making it expensive even for
landfill [6].
Generally, bricks are made using top soil from agricultural
fields and quarries, approximately half an acre land about
2000m2X 0.05m top soil is required for the making of about
1,00,000 bricks Essentially, bricks are produced by mixing
ground clay with, forming the clay into the desired shape, and
drying and heating. The manufacturing process has seven
general phases which include mining and storage of raw
materials, preparing raw materials, preparing different grain
sized particle, forming the brick, drying, heating and cooling,
de-hacking and storing finished products.
The objective of this research was to develop a solution for
the use of plastic waste in composite brick manufacturing. This
is achieved by experimenting samples of bricks made of
different grain sizes of Polyethylene Terephthalate (PET)
plastic waste that replace the weight of natural soil in order to
achieve the strength of bricks. The optimum mixing proportion
is then determined for the maximum compressive strength of
the brick. The typical tests that are done for bricks either in the
lab or in the field are commonly compressive strength test,
water absorption test, efflorescence test, above one metre
impact drop test, ringing sound test and hardness test. These
tests were performed according to the BIS standards for the
proposed composite bricks and their properties were studied.
2. EXPERIMENTAL SAMPLE
PREPERATION
The sample composite bricks were studied for the varied sizes
of the PET as shown in the figure 1 below. After once finished
with preparing different grain sized plastic material we move
on to the proportionality of mixing this plastic grain in the
manufacturing of brick.
Useful Application of Plastic Waste in
Composite Brick Manufacturing

SAHYADRI INTERNATIONAL JOURNAL OF RESEARCH, VOL 4, ISSUE 1, 2018
13
Figure1: Different grain sizes of PET considered in the composite brick
samples.
The materials used to manufacture bricks are clay, fly ash,
plastic grains, and water. This all material mixed in the
proportion and mould in the still mould. After that left to dry
for one day. The dried bricks are sent to Kundapur brick factory
for heating in the kiln.
Figure 2: Process of composite brick sample preparation
3. COMPRESSIVE STRENGTH TEST 1 - FOR
OPTIMAL GRAIN SIZE
The four samples that were prepared as discussed in section two
were tested for compressive strength in the Double column
Universal testing machine as shown in the figure 3. From the
test, it was found that the brick sample of 4 mm plastic grain
size had the highest compressive strength. Thus this grain size
was considered for the next compressive strength test.
Figure 3: Testing of the composite bricks in Universal Testing machine
4. COMPRESSIVE STRENGTH TEST 2 - FOR
OPTIMAL PLASTIC PROPORTION
Five new samples of plastic composite bricks were
manufactured similar to the procedure mentioned in the section
2, but for the same grain size of 4 mm. However, in this
experiment, the proportion of the PET plastic to the coarse
aggregate percentage weight was kept as 5%, 10%, 15%, 20%
and 25% for the five samples respectively. It was found that the
sample 4 consisting of 20% PET percentage by weight had the
maximum compressive strength of 7.2 N/mm2.
5. WATER ABSORPTION AND OTHER
BRICK TESTS
The water absorption test was conducted on a new sample
manufactured as per section 2 with the 4 mm PET plastic grain
size in the proportion of 15% by weight to the weight of the full
brick. The initial weight of the brick was 2.46 kg and the final
weight of the brick was 2.67 kg. The water absorption
percentage was calculated to be 8.53%.
The same brick was later dried and tested for efflorescence.
This was done by dipping the brick in water for 24 hours and
then removed to dry in the atmosphere. Approximately, around
2546 mm2 = 3% of the brick’s surface was covered by white
patches which are highly acceptable as per the standards.
Impact drop test was performed by dropping the sample brick
at a height slightly above 1.5 m high. As the plastic grains are
well bonded with soil, the sample brick considered was able to
clear the impact drop test.
6. RESULTS & DISCUSSIONS
The results of the compressive strength 1 test for varied grain
sizes are shown in the figure 4. From the compression test result
it is clearly shows that the value of compressive strength is
maximum for the plastic grain size with 0.5 to 0.75cm followed
by 20% replacement of clay by plastic and it showed in the
maximum load on compression is 97kN.
According to Bureau of Indian Standards 1077:1992
commonly burnt clay building bricks average compressive
strength for first class brick should not less than 10N/mm2 or
100kgf/cm2.
Our experiment results justifies that this bricks are reaching
the BIS limits. Therefore we can use this bricks and replace the
first class bricks since it is economical and ecofriendly product.
The results of the compressive strength test 2 for varied plastic
proportion by weight is as shown in the figure 5.
The compressive strength of the sample bricks of proportions
of 5%, 10%, 15%, 20% and 25% plastic waste were 5.15, 5.35,
5.68, 5.25 and 5.2 N/mm2 respectively. The maximum load was
recorded as 72 kN, 75 kN, 82 kN, 97 kN and 93 kN respectively.
Firing
of
bricks

SAHYADRI INTERNATIONAL JOURNAL OF RESEARCH, VOL 4, ISSUE 1, 2018
14
Figure 4: Experimentally observed effect of grain size of the PET
in the compressive strength of the composite brick.
Figure 5: Experimentally observed effect of plastic proportion by weight
of the PET in the compressive strength of the composite brick.
The water absorption percentage was about 8.53% which is
significantly less than the 20% set by the Indian Standards
1077:1992. The efflorescence test confirmed 3% of the surface
to have alkaline deposition not affecting much of the brick
structure.
7. CONCLUSION
The percentage of different grain sizes of plastic waste is
replaced by the weight of natural soil in order to achieve the
strength of bricks. This results in reducing the harmful effects
of the waste plastics in the environment. We also developed
a solution for reduction of the disposal of plastic waste by
replacing 20% plastic waste in order have maximum load at
crushing of 97 kN.
ACKNOWLEDGMENT
We are thankful to Mr Vaishak N L, Assistant Professor, and
Mr. Sudeep Shetty for extending their support to do this project.
We would like to extend our gratitude to Sahyadri project
support scheme -SPSS, an Undergraduate project grant for
doing this project.
REFERENCES
[1] Jambeck, J.R., et al., Plastic waste inputs from land into the
ocean. Science, Vol. 347, No. 6223, pp. 768_771, 2015.
[2] Andrady, A.L. and M.A. Neal, Applications and societal
benefits of plastics. Philosophical Transactions of the
Royal Society of London B: Biological Sciences, Vol.364,
no.1526, p p. 1977_1984, 2009.
[3] Rochman, C.M., et al., Ingested plastic transfer’s
hazardous chemicals to fish and induces hepatic stress.
Scientific reports, Vol.3, pp. 3263, 2013.
[4] Hopewell, J., R. Dvorak, and E. Kosior, Plastics recycling:
challenges and opportunities. Philosophical Transactions
of the Royal Society of London B: Biological Sciences,
Vol.364, no.1526, pp. 2115_2126, 2009.
[5] Tsai, C.J., et al., The pollution characteristics of odor,
volatile organo chlorinated compounds and polycyclic
aromatic hydrocarbons emitted from plastic waste
recycling plants. Chemosphere, Vol.74, no.8, pp.
1104_1110, 2009.
[6] Ishigaki, T., et al., The degradability of biodegradable
plastics in aerobic and anaerobic waste landfill model
reactors, Chemosphere, Vol.54, no.3, pp.225_233, 2004.
Grain size (mm)
Co
mp
ress
ive
stre
ng
th (
N/m
m2)
Percentage by weight of PET
Co
mp
ress
ive
stre
ngth
, N
/mm
2
SAHYADRI INTERNATIONAL JOURNAL OF RESEARCH, VOL 4, ISSUE 1, 2018
ISSN: 2456-186X, Published Online June, 2018 (http://www.sijr.in/)
15
Mohammed Mustafa*, Ronald Anthony D’souza, Deepthi H., Jeevan T. B., and Dr. Pushpalatha K
Department of Computer Science and Engineering, Sahyadri College of Engineering & Management, Mangaluru-575007
*Email: [email protected]
ABSTRACT
An aptitude test is a systematic means of testing a candidate's abilities to perform specific tasks and react to a range of
different situations. Quantitative aptitude problems are difficult to analyze and formulate without having a clear
understanding. Basic concepts must be known thoroughly to solve the problem efficiently. Many people lack the
knowledge of solving the problem using the basic concepts. When solving aptitude tests for companies, candidates should
have the ability to solve the problem within a limited time. Hence, we have introduced Aptitude Question Solver (AQS)
which provides a step-by-step procedure for each quantitative problem.
Keywords: Mathematical word problem, natural language processing, aptitude questions.
1. INTRODUCTION
With the advent of computers, all aspects of society have been
influenced by it, including education. Computers are used at
all levels of education. But with recent advancements in
technology, even children are learning with computers.
Wikipedia, Freebase, YAGO, Microsoft, Satori and Google
Knowledge Graph are some of the well-known knowledge
bases. Information present in them could be used to build
specific decision making advisory systems. Question
Answering systems, which are a part of advisory systems are
viewed as futuristic replacement of call centers and are called
as virtual assistants [9]. An aptitude test is a systematic means
of testing a candidate's abilities to perform specific tasks and
react to a range of different situations. Quantitative problems
are a part of Aptitude tests. It involves a wide range of
mathematical problems. A mathematical problem is a problem
which can be controlled, analyzed and solved using methods
that contain sequence of formulae, theorems, postulates, and
axioms. The duration for solving each quantitative problem is
limited. Various studies show that students often face
problems while solving mathematical word problems like
generating variables and forming equations without any basic
knowledge and techniques to solve [1]. Sometimes, the correct
calculations will result in incorrect answers due to incorrect
problem representation [10].
Existing application such as Wolfram Alpha [2] requires input
in terms of equations or simple math word problems. It fails to
provide solution as the complexity of the mathematical word
problems increase. So, if the users are not able the form the
equations from the given word problem, he/she will get
completely stuck. Other applications are MathWay [3] and
WebMath [4] that helps to solve mathematical problems, but it
cannot process these problems when given in English
language. And it also requires the users to choose what
operation to be performed.
Keeping in mind these issues in existing systems we have
proposed AptitudeQS for solving these problems. AptitudeQS
can be of great use to understand the solution and to know the
techniques to solve these problems in a quick and efficient
way. The main purpose of our system is to provide stepwise
approach to solve any given aptitude question. Our system can
be used by any person who intends to learn and solve and can
also be used by students or candidates to improve their
aptitude solving ability. Users, who intend to use this system,
will need to enter the word problem question. The system will
interpret the question entered by the user and generate an
appropriate solution. The solution will be represented in a step
by step manner, which will help the student to understand the
solution and concept behind it.
This paper is structured as follows. Section III describes the
system architecture and the various components involved in it.
Section IV deals with the generation of training dataset and the
development of neural network. The process of analyzing the
query from user is explained in section V. Section VI
illustrates the system performance and its evaluation. Finally,
we conclude about AptitudeQS in Section VI.
2. RELATED WORKS
In recent years, technologies such as Wolfram Alpha [2],
WebMath [3] and MathWay [4] were developed which can
solve verbal mathematical problem only if the question is
simple. Wolfram Alpha is able to solve simple verbal
mathematical problems but fails to do so when the complexity
Aptitude Question Solver: AptitudeQS

SAHYADRI INTERNATIONAL JOURNAL OF RESEARCH, VOL 4, ISSUE 1, 2018
16
of it increases. WebMath places the overhead of extracting
numerical data form the verbal statement upon the user.
MathWay is an interactive chat bot application which tries to
solve mathematical word problems but the problem here is that
we must choose the operation to be perform. Therefore, to
overcome all these drawbacks, we propose a new system
called Aptitude Question Solver. AptitudeQS can solve
complex verbal mathematical problems. The main goal of our
system is to provide the detailed procedure to solve any given
aptitude question.
3. SYSTEM OVERVIEW
Figure 1: System architecture
The system architecture of the AptitudeQS is shown in
figure 1. The components present in this system are dialogs,
pre-processor, vectorizer, neural network, entity recognizer
and AptitudeQS.
Initially, the system is trained before it can be used to solve
the questions. The dialogs component defines a set of
expressions and the corresponding methods to find the
solution. An expression is a template or a pattern that
describes a question, which can also include one or more
entities. An entity is a parsed element found within the user’s
query. Each expression has an intent, which is a method, to
solve the question associated with it. Using these expressions,
the system generates a training dataset that consists of
questions and the name of the expression to which it belongs
to. The system uses a neural network to classify the questions
to the corresponding expression and uses the generated
training set for training. Before feeding questions to the neural
network, they preprocessed using Natural Language
Processing (NLP) to understand the meaning and to remove
unwanted information from it. Finally, the output from NLP is
converted into feature vectors. These feature vectors are given
as input to the neural network and a similarity score associated
to each expression is produced as output. The expression with
the maximum score is considered as the classification result.
The AptitudeQS component is the central unit of our
system. This component is responsible for starting the training
process. It accepts the question from the user and consults the
neural network to identify the expression to which it belongs
to. Once the expression is known, the entity recognizer
matches the question with the expression to extract the entities
from it. The intent associated with the expression is then
invoked to compute the solution.
4. TRAINING NEURAL NETWORK
An Artificial Neural Network (ANN) is a computing system
inspired by the biological neural network present in animal
brains [5]. The main idea here is to build an ANN model to
classify the user’s query to a matching expression. Once the
classification of the query is done and a matching expression is
identified, the corresponding intent is invoked to compute the
solution.
A prerequisite to understand the input given by the user is to
train the system with predefined datasets. The steps involved
in training phase are generating training dataset, pre-
processing, vectorizing and training of neural network. The
system begins by generating a set of sample questions from the
expressions in the Dialogs component to form a training
dataset. Since the neural network accepts only fixed sized
inputs containing numerical data, the sample questions, before
feeding for training, need to be converted into a form that the
neural network can understand. This task is done by
Preprocessor and Vectorizer components. After this, the neural
network is trained using the converted training dataset and can
be used for prediction, to find out to which expression in the
Dialogs a given query matches.
4.1 Generating training dataset
A dialog is a collection of expressions with corresponding
intents. An expression is a pattern that defines the user input,
while an intent is a void function with expression and entity
attributes. The proposed system has a set of dialogs like “profit
and loss”, “average”, “clocks” and “ages” which are used to
train the neural network. An example of an expression is as
follows:
“Find the average of prime numbers between
@number.integer:num1 and @number.integer:num2”
where, @number.integer is an entity that is used for parsing
integer values present in the query, and num1 and num2 are
the alias names given to the two entities. num1 refers to the
first integer number in the query, while num2 refers to the
second integer value.
To train the neural network, a set of sample data is
required. For this, we generate a set of sample queries for each
of the expressions present in the system. The sample queries
are generated by replacing any entities present in the
expression with the values that they define. For example, using
the above expression, a sample query can be generated by
replacing the entities @number.integer:num1 and
@number.integer:num2 by random integers such as 10 and 20.
The so formed sample query after replacing will be

SAHYADRI INTERNATIONAL JOURNAL OF RESEARCH, VOL 4, ISSUE 1, 2018
17
“Find the average of prime numbers between 10 and 20”
In this way, at least five sample questions are generated for
each expression. Let T indicate the training dataset. For each
of these sample questions, a dictionary is created with a key
named expression to store the expression and another key
named query to store the sample query. The expression part
behaves as label while the query part behaves as data. The
dictionary is then appended to the training dataset T.
Table 1: Variable definition.
Symbols Description
T Labeled training dataset
W List of words in each data
E List of expressions
IW List of words or symbols that needs to be
ignored
D Document in our corpus
training Training dataset after vectorization
output List of output labels
output_empty Initial output label filled with zeros
X Input dataset to neural network
Y Output dataset matrix of neural network
hno Number of hidden neurons present in neural
network
s0 Synaptic weights of links between input layer
and hidden layer
s1 Synaptic weights of links between hidden
layer and the output layer
psu0 Updates of previous synaptic weights between
input layer and the hidden layer
psu1 Updates of previous synaptic weights between
hidden layer and output layer
lmerror Last mean error
sdcount0 Direction count of s0
sdcount1 Direction count of s1
E Epoch – number of iterations of training
l1error Hidden layer error
l2error Output layer error
l1delta Layer 1 error rate
l2delta Layer 2 error rate
s1wu Synaptic 1 weight update
s0wu Synaptic 0 weight update
QW List of words present in a query
Algorithm 1 describes the process of generating documents,
expressions and words from the training dataset. All variables
are shown in Table 1 along with their description.
The algorithm begins by looping through each query in the
training data T. For each query, the algorithm tokenizes it,
using the word_tokenize method of NLTK Python package,
into a list of words. These words are appended to the word list
W. A tuple consisting tokenized words and the expression to
which the query belongs is created and then appended to the
documents list D. The word list W is then refined by removing
the unwanted words or symbols from it which are present in
the ignored word list IW (from line 6 to line 13). In line 14,
each word in W is transformed to lowercase letters. Finally, the
algorithm converts the lists W and E, each consisting of unique
words and expressions respectively. The algorithm ends by
returning W, E, D.
4.2 Transforming training data into bag of words
The next step after generating training data and organizing
data structures for words, expressions and documents is to
transform the training data into bag of words. Text Analysis is
a significant field for machine learning algorithm. The raw
data, sequence of symbols cannot be directly fed to the neural
network because most of them expect numerical feature
vectors with fixed size. To address this problem, we convert
text into fixed-length vectors of numbers using Bag-of-Words
(BoW) model [6]. This model focuses on the occurrence of
words in the document and does not keep track of their order.
In this model, each word is assigned a unique number. The
document is encoded as a fixed-length vector with the length
of the vocabulary of known words. The value in each position
in the vector is filled with a count or frequency of each word in
the encoded document.

SAHYADRI INTERNATIONAL JOURNAL OF RESEARCH, VOL 4, ISSUE 1, 2018
18
Algorithm 2 describes the process of preparing the training
data in terms of vectors and the output label in terms of
numbers. In this algorithm, each of the queries present in
document is converted into a fixed-length vector using the
BoW model. It first gets all the tokenized words of the query.
Then the algorithm iterates through the word list W. If a word
in W exists in the query, a 1 is appended for that particular
word in the bag list, otherwise 0 is appended. Finally, an
output label is created by adding 0 at all the indices except for
the index belonging to the expression that the query matches.
The algorithm returns the training and the output lists.
4.3 Training the neural network
The classification of a query entered by the user to identify
expression to which the query matches the most can be
attained using an Artificial Neural Network (ANN). Neural
Network is an information processing model that process
information. The main component is the novel structure of
information processing system. Information processing system
takes information in one form and processes it into another
form. Neural network is organized in layers. Layers are made
up of interconnected ‘nodes’ that includes activation function
which defines the output of the node for the given set of
inputs.
An activation function in neural networks is used to
determine its output. It maps the resulting values in between 0
to 1. AptitudeQS uses the Sigmoid function as activation
function.
Figure 2: Sigmoid function
The Sigmoid function curve looks like an S-shape, as
shown in figure 2. The main reason to use Sigmoid function is
because the curve always exists between 0 and 1. Therefore, it
is used by our neural network to predict the probability as an
output. This system uses Sigmoid function to normalize values
and its derivative to measure the error rate. The value Sigmoid
function can be calculated using the following equation:
(1)

SAHYADRI INTERNATIONAL JOURNAL OF RESEARCH, VOL 4, ISSUE 1, 2018
19
For error propagation, it is necessary to find the derivative
of the output of the sigmoid function. This derivative can be
calculated using the following equation:
(2)
Now that the algorithms to calculate the sigmoid function and
its derivative are defined, it is time to develop a training
function to create synaptic weights of the neural network.
Algorithm 3 describes this process of training the neural
network.
Finally, the algorithm returns the synaptic weight between
layer 0 and layer 1, s0, and the synaptic weight between layer
1 and layer 2, s1. These weights are converted into list and
stored in the form of JSON in a file named “synapses.json”.
5. PROCESSING QUERY
This section describes about how the user’s query is processed
to compute the solution. The query asked by the user is first
accepted by the dialog controller. If this is the first time an
instance of dialog controller is created, it calls Algorithm 3 for
training.
5.1 Pre-Processing
Intention of the query needs to be understood to process it. [7].
This can be done by using Natural Language Processing. The
next step is to pre-process the query entered by the user. The
main task of pre-processing is tokenizing, stemming and
transforming all the letters into lower case. The NLP process is
done by using Natural Language Toolkit (NLTK) Python
package [8].
o Tokenization – The process of breaking up the given
text into units called tokens. The tokens may be in the form of words, numbers or punctuation symbols. The main aim of tokenization is to explore the words in the given query and to give an integer id to every token. The list of tokens becomes input for vectorization.
o Stemming – The process of reducing words to their root form. The main goal of stemming is to reduce inflectional forms and convert it to the base form. English Stemmer is used for reducing the words to their root form.
Algorithm 4 is used to pre-process a query given by the
user. It begins by breaking the query statement into a list of
words called tokens (line 2). Each of these words are
transformed into lower case and stemmed down into their root
form (line 3). The algorithm then returns a list of preprocessed
words.
5.2 Vectorizer
The vectorizer component takes in the user’s query as input
and converts it into a fixed size vector using BoW model. The
following algorithm explains the process of vectorizing.
In algorithm 5, a list named bag of length similar to that of
words list, W, is created and filled with 0s. It calls Algorithm 6
with the query to obtain a list of pre-processed words, QW.
The algorithm then iterates through W and checks if each word
is in QW. If that word is present in QW, a 1 is added to the bag
at the position corresponding to that word. In this way, the
algorithm returns a vector that represents the user’s query.
5.3 Neural Network for prediction
Algorithm 6 creates an initial neural network model. The
neural network used in this system has three layers: an input
layer that accepts vector inputs, a hidden layer that processes
the information and an output layer that produces the output.

SAHYADRI INTERNATIONAL JOURNAL OF RESEARCH, VOL 4, ISSUE 1, 2018
20
Now that the neural network model is developed and trained
using the sample training data generated earlier, it is now
possible to classify the query entered by the user to which
expression it belongs to. Algorithm 7 describes this
classification process. In this algorithm, we maintain a
minimum error threshold of 0.7. After prediction, the output of
the neural network with the highest score is considered as the
prediction result only if the score is greater than the threshold.
This algorithm finally returns the classified expression.
5.4 Entity Recognizer
Before calling the Invoke method of AptitudeQS component, it
is required to extract the entities, if any, from the query. The
task of extracting entities is done by Entity recognizer. This
component first identifies the entity types present in the
expression. Based on these entity type, it compares the query
with the expression to locate the values of each of these entity
types. Entity recognizer then returns a list of tuples containing
the entity types along with their values.
6. RESULTS AND PERFORMANCE
EVALUATION
We have implemented our system using python 3.6.0
programming language on a system running Windows 10
Operating System. For evaluating the performance of the
system, testing, was carried out on AptitudeQS. Table 2 shows
the test cases for AptitudeQS and its results for the given
input.
Table 2: Test Cases.
Question
Find the average of first 10 prime
numbers.
Expression Find the average of first
@number.integer:num2 prime
numbers
Expected Output 4.25
Output 4.25
Result Success
Question
Find the average of all prime
numbers between 30 and 50.
Expression Find the average of all {prime}
numbers between
@number.integer:num1 and
@number.integer:num2
Expected Output 39.8
Output 39.8
Result Success
Question
Find the average of first 40 natural
numbers.
Expression Find the average of first
@number.integer:count natural
numbers.
Expected Output 20.5
Output 20.5
Result Success
Question
Find the average of first 20
multiples of 7
Expression Find the average of first
@number.integer:count multiples
of @number.integer:num
Expected Output 73.5
Output 73.5
Result Success
Test ID 5
Question
The average of four consecutive
even numbers is 27. Find the
largest of these numbers.
Expression The average of @number:count
consecutive @evenOrOdd
numbers is
@number.integer:average. Find the
@largestOrSmallest of these
numbers.
Expected Output 30
Output 30
Result Success
The goal of the evaluation is to find the accuracy of the
system. Based on the test cases executed using few sample

SAHYADRI INTERNATIONAL JOURNAL OF RESEARCH, VOL 4, ISSUE 1, 2018
21
questions, it is estimated that the system provides a
classification accuracy of 98%.
7. CONCLUSION
In this paper, we have proposed Aptitude Question Solver that
solves mathematical word problems. AptitudeQS accepts
query from the user and provides detailed solution. This helps
the users to learn how to solve aptitude questions and
improves their skills in solving. Currently the AptitudeQS
system solves four classes of questions, which are average,
profit and loss, ages and clocks. In future, the system can be
upgraded to solve other categories of questions. The system
can also be enhanced for solving aptitude questions by
accepting speech as an input.
REFERENCES
[1] D. Cummins et al., “The role of understanding in solving
word problems”, Cognitive Psychology, vol. 20, pp. 405-
438, 1988.
[2] Wolfram Alpha (2009). [Online]. Available:
http://www.wolframalpha.com/
[3] MathWay, online available at http://www.mathway.com as
on 18-05-2018
[4] WebMath, online available at http://www.mathway.com as
on 18-05-2018
[5] "Artificial Neural Networks as Models of Neural
Information Processing | Frontiers Research Topic".
Retrieved 2018-02-20.
[6] McTear, Michael (et al) (2016). The Conversational
Interface. Springer International Publishing.
[7] Sarkar et al., “NLP Algorithm Based Question and
Answering System”,
[8] Natural Language Toolkit. (2001). [Online]. Available:
http://www.nltk.org/
[9] Dong. X. L. Murphy.K.Gabrilovich .E. Heitz.G.Horn.
W.Lao.N. & Zhang.W. (2014). Knowlegde Vault. A web-
scale approach to probabilistic knowledgr fusion.
[10] R. Schumacher and L. Fuchs, ―Does understanding
relational terminology mediate effects of intervention on
compare word problems?,‖ Journal of Experimental Child
Psychology, vol. 111, pp. 607-628, 2012.

SAHYADRI INTERNATIONAL JOURNAL OF RESEARCH, VOL 4, ISSUE 1, 2018
ISSN: 2456-186X, Published Online June, 2018 (http://www.sijr.in/)
22
An Integrated Approach for Personality Analysis
using OCR and Text Mining
Pavithree B. Shetty, Sanath R. Kashyap, Sneha V. Kamath, Supraja,
Bharath Bhushan S. N*.
Department of Computer Science and Engineering, Sahyadri College of Engineering & Management, Mangaluru-575007 *Email: [email protected]
ABSTRACT
In this paper we aim at recognizing handwritten text from an image and convert that into an editable document and
perform personality analysis. It is a challenging task because each individual's handwriting is unique. As a person’s
mind-set plays a major role when he pens down the content, in our work we use the content written by the person to
classify contextually if the person is positive minded or negative minded. In order to convert handwritten characters into
an editable document we have used optical character recognition (OCR) and machine learning techniques. Personality
analysis is done based on the frequency of occurrences of words.
Keywords: Optical Character Recognition, Text Mining, Machine Learning
1. INTRODUCTION
From past few years there is a lot of data which is being
generated which demands automated management without
much human intervention. This paper mainly focuses on
offline handwritten character recognition of English words by
initially identifying individual characters. Today due to the
advent of internet and its wider reach to public there are
millions of text data which is being generated every day and
this requires data management.
Optical character recognition (OCR) is the electronic or
mechanical conversion of handwritten, typed or printed text
images into machine-encoded text. This involves scanning of
the text character by character and then the character image is
translated into character codes, which is frequently used in
data processing.
Given a scanned image of handwritten text, we aim to
extract the text in that image using OCR algorithm and display
it in a editable document along with identifying if the content
has been written by a positive minded or negative minded
person by identifying and understanding what has been
written. Using text mining techniques we achieve the later part
of the problem statement.
In the field of business, management, education, various
billing systems and various ticket reservation systems lot of
data is being generated but this does not provide us any useful
conclusions. When this data is analysed we get valuable
information from which we can get the current interests of
people and improve the present business trends.
Text mining techniques can be used to derive useful insights
from the wide range of data. Text mining is analysing the data
which is contained in natural language text. From editable
document using machine learning and text mining techniques
we infer if a person is contextually positive minded or negative
minded.
The aim of the text classification algorithm is to determine
if the person is positive minded or negative minded based on
the content given by the user. Suppose we have two classes of
documents i.e., class1->content given by positive thinkers and
class 2- content given by negative thinkers. We have to train
our model with these documents. The text classification
assigns a Boolean value to each pair Φ (Qd,S)=1 where, S is
a set of predefined categories and Qd is the domain of
documents. The task is to approximate the true function Φ=
(Qd,S)->{0,1} ( where its 1 if classifier classifies the
document properly as positive minded or negative minded else
it is 0) using a function^
^ Φ= (Qd,S)->{0,1} such that the values of Φ and Φ has
approximately similar values.
Following section of the paper is organized as follows. Section
2 gives a brief literature survey on the text classification and
representation. Section 3 represents the proposed model for
conversion of handwritten characters to editable format and in
the later part we use text classifier to classify if a person is
positive minded or negative minded using text mining
approaches. Experimentation and comparative analysis
performed on the proposed models will be discussed in the
section 4. Finally we conclude the paper in section 5.

SAHYADRI INTERNATIONAL JOURNAL OF RESEARCH, VOL 4, ISSUE 1, 2018
23
2. LITERATURE SURVEY
In [1], authors highlight the main techniques and methods used
in text document classification. It emphasises the
representation of text and machine learning techniques. The
methods and theories of text mining and document
classification is analysed in the paper. [2] This research article
contains a B-Tree based classification methodology which is
adapted for classification. The proposed compressed
representation and B-Tree methodologies are verified on the
publicly available large corpus to validate the effectiveness of
the proposed models. [3] In this paper, a learning model of text
classification for support vector machine (SVM) is evolved. It
creates a bridge between the characteristics of text
classification task and the generalisation performance of a
SVM in a quantifiable manner. [4] Major problem such as
handling large number of attributes, dealing with the
unstructured text, and choosing a machine learning technique
applicable to the text-classification application. [5] To increase
the performance of the Centroid classifier, a novel batch-
updated method is proposed in this paper. The aim of this
approach is to successively update the classification model by
batch, by taking advantage of training errors. [6] This paper
explores a new technique of feature selection metrics using
less number of keywords which is highly successful. [7] To
deal with multi-label classification problems, this paper
proposes the Probabilistic Neural Network (PNN) algorithm,
and is compared with Ml-kNN algorithm. This application
divides the MI-kNN algorithm into four parts which is used for
multi-label categorization problems. [8] This paper describes a
natural language processing system reinforced by the use of
association of words and concepts, implemented as a neural
network. Combining an associative network with a
conventional system contributes to semantic disambiguation in
the process of interpretation.[9] In this paper, a new text
document classifier is implemented using the support vector
machine (SVM) training algorithm and the K-nearest
neighbor(KNN) classification approach combined together.
The Support Vector Machine - Nearest Neighbor classification
approach is named as SVM-NN. [10] In this paper, it takes the
advantage of both longest common subsequence (LCS) and
VSM algorithm and proposes integrated text retrieval (ITR)
mechanism. LCS is used to evaluate the weight of terms and is
the main idea of the ITR mechanism, so that the weight
relationships and the sequence between the texts and the query
can be examined concurrently. [11] This paper measures the
virtual generalizing random access memory weightless neural
networks (VG-RAM WNN), which is an efficient method for
machine learning technique which is very simple to implement
and faster in training and testing. To build automatic multi-
label text categorization systems, VG-RAM WNN is used as a
tool. The performance of the VG-RAM WNN is evaluated on
two issues: 1) classification of the text characterization of
commercial activities, 2) Web page classification. [12] This
paper proposes an algorithm which will learn from the data set
provided to perform speech recognition task and multiclass
text task. This method is based on fresh and enhanced family
for boosting the algorithms. Boos Texter, which is the new
algorithm for boosting the performance, is used for text
categorization task. [13] This paper presents a mathematical
model of classification schemes and the one scheme which can
be proved optimal among all those based on word frequencies.
[14] This paper represents a method DP4FC which is used to
choose appropriate feature to categorize and differentiate the
appropriate documents from the inappropriate documents.
DP4FC is combined with the other classifiers. After getting the
appropriate document, the classifier creates the effective
category groups and takes appropriate decisions in classifying
and filtering. [15] In this paper, for dimension reduction, the
phonological different words, grammatical words, and the
stopwords are recognized and eliminated. There are two
algorithms for dimension reduction. They are frequent term
generation and improved stemming algorithms. [16] This
paper explains the flow of the processing of the information
and for text categorization. There are two efficient learning
algorithms. They are Partial Least Squares (PLS) and Support
Vector Machines (SVM) and is applied in other domain as
well. [17] In this paper, the authors explain about the steps.
They are rule generation, calculation of probability and pre-
processing. The training set document is read in the rule
generation. Negative and positive weights are calculated in the
calculation of probability. The document which is given as
input is divided into statements and paragraphs in pre-
processing. [18] This paper makes use of statistical term
clustering and syntactic processing to represent a document
which is more accurate than obtained by using traditional
keyword methods. [19] This paper compares the success rate
of automatic learning algorithms by means of speed in
learning, accuracy and speed in real time calculation for
categorization of text. This paper also checks the size of
training set and other representations of document. [20] This
paper proposes transfer of knowledge method which is
mapped from source to target domain based on feature
representation. A new future space is created first, then feature
representation map is built, and the target and source domain
is reweighed. With the help of this, in the source domain,
classifier models are trained which is used by target domain.
[21] This paper tells the use of linear regression residual for
binary text categorization. The main idea is to predict the
given test vector using its k nearest neighbors in both positive
and negative classes. [22] In this paper, the problem of
classifying text by removing the information which is gained
from clustering both testing and training is addressed. The
knowledge which is gained from clustering is needed to
increase the performance of the text classifier. [23] This paper
explains the algorithm which combines the feature of k-
nearest neighbor (KNN) and support vector machine (SVM)
methods to improve the precision of classification of text
which is based on variable precision rough sets (VPRS). [24]
This paper explores on enhancing the kNN which is improved
by implementing alternate distance functions which has
weights to measure the data from various viewpoints. By using
genetic algorithm, the weights for optimization are computed
[25-29]. This paper gives the solution by Back propagation
network, the techniques used for feature identification. The

SAHYADRI INTERNATIONAL JOURNAL OF RESEARCH, VOL 4, ISSUE 1, 2018
24
back propagation network algorithm is used for the text
classification.
3. PROPOSED METHOD
We have broadly classified our project into two stages where
the first one deals with conversion of handwritten characters
into editable format and another one deals with classifying
people as positive minded or negative minded based on the
content of what they write. We will see both the stages in
details in the following section.
STAGE 1:
Optical Character Recognition:
Handwritten character recognition is broadly classified as
online character recognition which is the real time acquisition
and recognition of characters and offline character recognition
which deals with recognition of characters which is written on
a sheet of paper. This can be achieved with three techniques
namely OCR (optical character recognition), MICR (magnetic
ink character recognition), OMR (optical mark recognition).
Pre-processing and segmentation:
The image is given as a input to the OCR template matching
algorithm where the characters are processed which involves
segmenting the characters by using horizontal and vertical
profiling using OCR techniques.
Feature Extraction:
For the given input image we get the corresponding vertical
profile of complemented image from where we extract the
required features of the segmented characters.
Text Classification:
We obtain matrix representation of recognized characters and
thereby the text is classified. And hence we get the editable
format which is the output of our first proposed model.
Algorithm 1: Character Recognition:
Input: A text image
Output: An editable document
Method:
for i=1 to length(Training_Samples)
img=imread(dataset(i));
No_Lines=HorizontalProfile(img);
No_Char=VerticalProfile(img);
Identified_Text=OCR(No_Char);
Save(“Identified_Text.txt”);
End
Stage 2:
As a person’s mind contextually set plays a major role in the
what a person writes, we are classifying them as positive
minded or negative minded based on the content of the written
matter.
Text mining and machine learning techniques:
The output of the previous model i.e., editable document is
further processed in this model to get the final output. We use
text mining techniques and machine learning techniques along
with stop word elimination algorithm to classify if the person
is positive minded or negative minded which our end result is.
A survey was conducted to understand the regional
vocabulary of people and we collected English words from
them which is classified as positive word and negative word by
them according to their thinking. The detailed model is
explained in the following section, here we use compression
based integer representation based approach for classifying the
extracted words as positive or negative. The task of classifying
is a supervised task where we train the classifying algorithm
with terms belonging to two major classes positive and
negative. The result of this classification algorithm is to assign
binary values {0, 1} (1->if the application recognises the terms
properly else its 0). We are emphasizing at using integers
based compression due to the fact that text terms occupies
more space than integers. Once we are able to convert the
terms to integers it will be very easy to handle the integer
numbers and hence it contributes a lot to classification
algorithm. The detailed explanation for this is presented in the
corresponding subsections.
Classification Stage:
We first read the positive dictionary of words and negative
dictionary of words and save it. Given the query document we
first apply natural language processing methods and eliminate
stop words. After which the set of positive and negative words
of the query document will be compared with the dictionary. If
found we keep the count of positive and negative words and
based on the frequency of occurrence of words we classify the
content of text as positive or negative. If the positive or
negative word which is present in the query document is not
found in the dictionary we update the dictionary with the new
words.
Algorithm 2: Personality Analysis
Input: A query Document
Output: classifying the document as positive or negative
Method:
Positive <- read pos_dictionary
save Positive
Negative <- read neg_dictionary
save Negative
[Prow Pcol]=size(Positive)
[Nrow Ncol]=size(Negative)
[Trow Tcol]=size(Reg_Text)
for i<-1 to Prow
for j<-1 to Trow
if(strcmp(Positive(i), Reg_Text(j))=1)
pos++
SAHYADRI INTERNATIONAL JOURNAL OF RESEARCH, VOL 4, ISSUE 1, 2018
25
end
end
for i<-1 to Nrow
for j<-1 to Trow
if(strcmp(Negative(i), Reg_Text(j))=1)
neg++
end
end
end
End
4. EXPERIMENTATION
We have performed experimentation on three types of datasets.
They include well-formed characters, partially well-formed
characters and non-identifiable characters. Here we have
mainly used two types of experimentation techniques to find
the accuracy of the handwritten characters that are recognised.
1. The first one is using optical character recognition
technique (OCR).
2. The second one is using Text Mining
4.1 Optical Character Recognition:
STEP 1: Here we initially give handwritten sample as input to
OCR and find out the characters that are recognized.
STEP 2: Next we generate the Confusion matrix as follows:
● Create Rows and Columns of matrix using English
Alphabets.
● Mark those cells in the matrix depending on how the
alphabets are recognised.
● Calculate Row sum and Column sum, this will be our
Recall and Precision for finding F Measure.
F measure calculated for partially well-formed characters is
shown in Table 1.
4.2 Text Mining:
Steps:
1. Once the OCR data gets converted into editable text
format and this will be stored in a .txt file.
2. The obtained data set will be divided into training and
testing sample.
3. Stop words are removed from the training sample and
integer representation is given to the data. Results of text
mining stage is presented in Table 2.
5. CONCLUSION
This project can be useful for conversion of old handwritten
documents into digital form. This will help a lot of
organisations who have legacy documents in need of
digitisation. This can also help students to digitize their notes.
Right now there are scanners which are used to scan printed
documents. But this is will be a single app which can do the
work of a hardware device and its separate software. If this
technology is used for other languages we can easily convert
old books which are in need of restoration. This will convert
the book to digital form and prevent the natural wear and tear
that physical books are often subjected to. The personality
analysis can be used by various organisations to judge a person
before taking them into their organisation or to check the
changes in a person’s state of mind over time. This particular
study can have huge applications in the field of psychology.
We can see the similar works done in the references [26] to
[51].
ACKNOWLEDGMENT
This research project was supported by Department of
Computer Science & Engineering, Sahyadri College of
Engineering & Management, Mangalore. We thank all the
teaching and non-staff for their continuous support and
encouragement.
REFERENCES
[1] Aurangzeb Khan, Baharum Baharudin, Lam Hong Lee,
Khairullah khan, A Review of Machine Learning
Algorithms for Text-Documents Classification,
Department of Computer and Information Science,
Universiti Teknologi PETRONAS, Tronoh, Malaysia.
[2] S. N. Bharath Bhushan, Ajit Danti and Steven Lawrence
Fernandes. Integer Representation and B-Tree for
Classification of Text Documents: An Integrated
Approach.
[3] Thorsten joachims, GMD Forsehungszentrum IT, AIS.KD
Schloss Birlinghoven, 53754 Sankt Augustin, Germany
[4] Mita K. Dalal, Mukesh A. Zaveri Automatic Text
Classification: A Technical Review ,International Journal
of Computer Applications (0975 – 8887) Volume 28–
No.2, August 2011
[5] Songbo Tan, An improved centroid classifier for text
categorization, 2007 Elsevier Ltd.
[6] Serafettin Tasc, Tunga Güngör , Comparison of text
feature selection policies and using an adaptive
framework, 2013 Elsevier Ltd.
[7] Elias Oliveira, Patrick Marques Ciarelli. Claudine Gon¸
calves. A Comparison Between a kNN based Aproach and
a PNN Algorithm for a Multi-Label Classification
Problem, Universidade Federal do Esp´ırito Santo,Brazil
[8] KIMURA Kazuhiro SUZUOKA Takashi AMANO Sin-
ya, Association-based Natural Language Processing with
Neural Networks, Information Systems Laboratory
Research and Development Center TOSHIBA Corp.
[9] Chin Heng Wan a, Lam Hong Lee b, Rajprasad Rajkumar
b, Dino Isa, A hybrid text classification approach with low
dependency on parameter by integrating K-nearest
neighbor and support vector machine, 2012 Elsevier Ltd.
[10] Cheng-Shiun Tasi, Yong-Ming Huang, Chien-Hung Liu,
Yueh-Min Huang, Applying VSM and LCS to develop an
integrated text retrieval mechanism, 2011 Elsevier Ltd.
[11] Alberto F. De Souza, Felipe Pedroni, Elias Oliveira,
Patrick M. Ciarelli, Wallace Favoreto Henrique, Lucas

SAHYADRI INTERNATIONAL JOURNAL OF RESEARCH, VOL 4, ISSUE 1, 2018
26
Veronese, Claudine Badue, Automated multi-label text
categorization with VG-RAM weightless neural networks.
Elsevier 2009.
[12] Robert E Schapire, Yoram Singer, Boos Texter: A
Boosting-based System for Text Categorization, Machine
Learning, 39(2/3):135-168, 2000.
[13] Louise Guthrie Elbert Walker, Document Classification
by Machine: Theory and Practice.
[14] Rey-Long Liu, Dynamic category profiling for text
filtering and classification.
[15] P. Ponmuthuramalingam and T. Devi, Effective
Dimension Reduction Techniques for Text Documents,
IJCSNS International Journal of Computer Science and
Network Security, VOL.10 No.7, July 2010 .
[16] Setu Madhavi Namburu, Haiying Tu, Jianhui Luo and
Krishna R. Pattipati, Experiments on Supervised Learning
Algorithms for Text Categorization IEEEAC paper
#1260, Version 8, Updated December 10, 2004 .
[17] S. Subbaiah, Extracting Knowledge using Probabilistic
Classifier for Text Mining, Proceedings of the 2013
International Conference on Pattern Recognition,
Informatics and Mobile Engineering, February 21-22.
[18] Tomek Strzalkowski and Barbara Vauthey, Fast Text
Processing for Information Retrieval, Courant Institute of
Mathematical Sciences New York University 251 Mercer
Street New York, NY 10012
[19] Susan Dumais, John Platt, David Heckerman, Inductive
Learning Algorithms and Representations for Text
Categorization
[20] Jiana Meng, Hongfei Lin, Yanpeng Li, Knowledge
transfer based on feature representation mapping for text
classification, 2011 Elsevier Ltd.
[21] Hakan Altınçay, Using Linear Regression Residual of
Document Vectors in Text Categorization, 2013 IEEE
[22] Antonia Kyriakopoulou, Theodore Kalamboukis, Using
Clustering to Enhance Text Classification”, SIGIR.
Amsterdam, The Netherlands. ACM 978-1-59593-597-
7/07/0007.
[23] Wen Li, Duoqian Miao, Weili Wang, Two-level
hierarchical combination method for text classification,
2010 Elsevier Ltd
[24] Takahiro Yamada, Kyohei Yamashita, Naohiro Ishii,
Text Classification by Combining Different Distance
Functions with Weights”, 2006 IEEE
[25] S.Ramasundaram, S.P. Victor, Text Categorization by
Back propagation Network, International Journal of
Computer Applications (0975 – 8887) Volume 8– No.6,
October 2010.
[26] Bhushan Bharath S. N. and Danti Ajit. Classification of
text documents based on score level fusion approach.
Pattern Recognition Letters 94., 118–126. 2017.
[27] Danti Ajit and Bhushan Bharath S N. 2013, Document
Vector Space Representation Model for Automatic Text
Classification. In Proceedings of International Conference
on Multimedia Processing, Communication and
Information Technology, Shimoga. pp. 338–344
[28] Danti Ajit and Bhushan Bharath. Classification of Text
Documents Using Integer Representation and Regression:
An Integrated Approach.Special Issue of The IIOAB
Scopus Indexed Journal.Vol. 7, No.2, pp. 45–50. 2016.
Table 2: F measure calculated for recognized characters.
F Measure of recognized handwritten text in editable format
PRECISION RECALL F MEASURE
0.91 0.9225 0.9162
Table 1: F measure calculated for partially well-formed characters.
F Measure of recognized handwritten text in editable format
PRECISION RECALL F MEASURE
1 0.9285 0.9523

SAHYADRI INTERNATIONAL JOURNAL OF RESEARCH, VOL 4, ISSUE 1, 2018
ISSN: 2456-186X, Published Online June, 2018 (http://www.sijr.in/)
27
Recognition of Overlapping Sound Events
Jayalaxmi*, Hegde Abhijna Satish, Harshitha N Kotari, and Deeksha
Department of Computer Science and Engineering, Sahyadri College of Engineering & Management, Mangaluru-575007
*Email:[email protected]
ABSTRACT
In this paper, we address the challenge of recognizing the isolated sound in the noisy background. Here we propose an
approach where we extract the local spectrogram features for each isolated acoustic sound events. The local spectrogram
features are extracted by using the keypoints which are unique for each sound event. The “keypoints” are the peak values
for each sound event where the sound is maximum. These local spectrogram features are then clustered to form a
codebook. The codebooks are used for training purpose. The features of the sound events which will be used for testing
are extracted separately using spectrogram. The extracted feature is then mapped with the local spectrogram features in
the codebook to recognize the sound event. The experimental setup has 12 isolated sounds, 12 overlapped sound events,
and 11 mixed noises to determine the accuracy of our approach.
Keywords: Cluster, Codebook, Keypoint detection, Local spectrogram features, Time Frequency Location, visual word.
1. INTRODUCTION
In any environment there can be many overlapping sound
events which will be present along with many background
noises. In many cases the background noise will be as
important as the structured sound events, so they cannot be
simply neglected and considered as unstructured sound events.
In cases like surveillance camera, hearing machine and also
automatic speech recognition the unstructured surrounding
background noises are as important and useful as the
structured sound events. So, the concept of Sound Event
Recognition (SER) is used to detect and also to classify the
sound events which are present in the unstructured
environment. Detecting and classifying these sounds based on
the sound events are helpful in case of security cameras,
monitoring of bioacoustics, meeting room transcription and is
also very helpful in case of “hearing machines”.
Different Technologies have been developed regarding
sound event recognition, most popular techniques among them
are based on frame-based features, such as Mel-frequency
cepstral coefficients (MFCCs) from ASR, or MPEG-7
descriptors (Casey,2001). All these techniques can then be
modeled with Gaussian Mixture Models (GMMs) and
combined with Hidden Markov Models (HMMs) in order for
recognition, and it can also be used to train SVM or Support
Vector Machine for the different classifications based on the
features. But these methods may not perform best in the case
of mismatched conditions which occur in sound events
recognition tasks.
To overcome these challenges Missing Feature Recognition
systems were developed. The task here is to identify how to
mask the sound so that it stands out separately from the
background noise. The performance of this system depends on
how well the mask can separate the sound from background.
This technique may not be helpful in case of overlapping
sounds as there will be information about two or more sounds.
In a research of humans understanding of speech traces of
frame-based feature is found, and it is also found that the
human auditory system may be based on the partial feature
extraction that are uncoupled and also local across the
frequency of the speech. This helps humans to recognize the
speech even if there is lot of disturbance and distortion across
the different regions of the spectrogram of the sound event.
Thus, based on Local Spectrogram Features we develop a
Sound Event Recognition system, where we will making use of
frame-based features.
Here we try to address a task of simultaneous recognition of
the sound events which are from single channel audio.
Conventional Frame-based methods cannot be used here as
each time the frame will contain information mixed as the
sound event will have different sounds or from multiple
sources.
Another method which can be used to detect the
overlapping sound is Missing Feature Recognition technique.
The drawback with this technique is that the recognition of the
sounds will be based on the way mask is created or in other
words the recognition of sound depends on the accuracy of the
mask. Here we try to make use of Local Spectrogram Features
which represent the local spectral feature of each sound and
this is extracted from spectrogram which is covered with
keypoints. “Keypoints” represents the peaks in the
spectrogram. Based on these keypoints we can form LSF
clusters and their occurrences can be shown using
spectrogram.
We have conducted experiments on the isolated sound
without background noise, and also on isolated sounds with
factory floor noise as background noise with the background
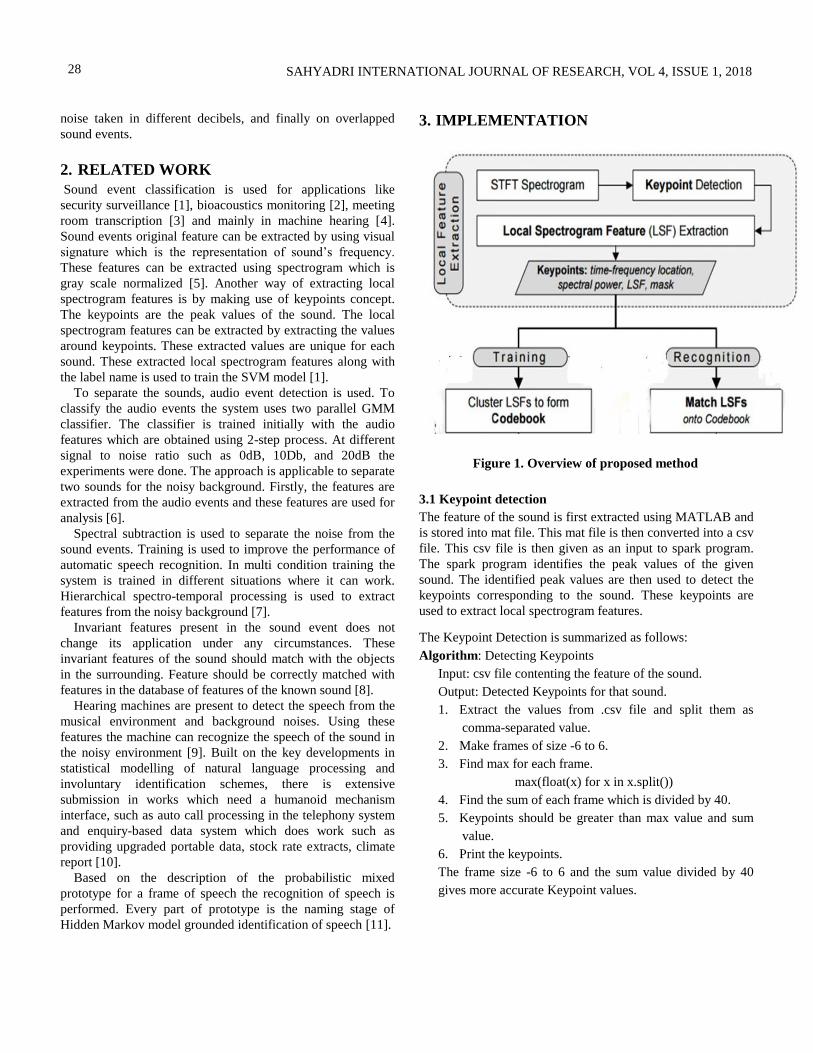
SAHYADRI INTERNATIONAL JOURNAL OF RESEARCH, VOL 4, ISSUE 1, 2018
28
noise taken in different decibels, and finally on overlapped
sound events.
2. RELATED WORK
Sound event classification is used for applications like
security surveillance [1], bioacoustics monitoring [2], meeting
room transcription [3] and mainly in machine hearing [4].
Sound events original feature can be extracted by using visual
signature which is the representation of sound’s frequency.
These features can be extracted using spectrogram which is
gray scale normalized [5]. Another way of extracting local
spectrogram features is by making use of keypoints concept.
The keypoints are the peak values of the sound. The local
spectrogram features can be extracted by extracting the values
around keypoints. These extracted values are unique for each
sound. These extracted local spectrogram features along with
the label name is used to train the SVM model [1].
To separate the sounds, audio event detection is used. To
classify the audio events the system uses two parallel GMM
classifier. The classifier is trained initially with the audio
features which are obtained using 2-step process. At different
signal to noise ratio such as 0dB, 10Db, and 20dB the
experiments were done. The approach is applicable to separate
two sounds for the noisy background. Firstly, the features are
extracted from the audio events and these features are used for
analysis [6].
Spectral subtraction is used to separate the noise from the
sound events. Training is used to improve the performance of
automatic speech recognition. In multi condition training the
system is trained in different situations where it can work.
Hierarchical spectro-temporal processing is used to extract
features from the noisy background [7].
Invariant features present in the sound event does not
change its application under any circumstances. These
invariant features of the sound should match with the objects
in the surrounding. Feature should be correctly matched with
features in the database of features of the known sound [8].
Hearing machines are present to detect the speech from the
musical environment and background noises. Using these
features the machine can recognize the speech of the sound in
the noisy environment [9]. Built on the key developments in
statistical modelling of natural language processing and
involuntary identification schemes, there is extensive
submission in works which need a humanoid mechanism
interface, such as auto call processing in the telephony system
and enquiry-based data system which does work such as
providing upgraded portable data, stock rate extracts, climate
report [10].
Based on the description of the probabilistic mixed
prototype for a frame of speech the recognition of speech is
performed. Every part of prototype is the naming stage of
Hidden Markov model grounded identification of speech [11].
3. IMPLEMENTATION
Figure 1. Overview of proposed method
3.1 Keypoint detection
The feature of the sound is first extracted using MATLAB and
is stored into mat file. This mat file is then converted into a csv
file. This csv file is then given as an input to spark program.
The spark program identifies the peak values of the given
sound. The identified peak values are then used to detect the
keypoints corresponding to the sound. These keypoints are
used to extract local spectrogram features.
The Keypoint Detection is summarized as follows:
Algorithm: Detecting Keypoints
Input: csv file contenting the feature of the sound.
Output: Detected Keypoints for that sound.
1. Extract the values from .csv file and split them as
comma-separated value.
2. Make frames of size -6 to 6.
3. Find max for each frame.
max(float(x) for x in x.split())
4. Find the sum of each frame which is divided by 40.
5. Keypoints should be greater than max value and sum
value.
6. Print the keypoints.
The frame size -6 to 6 and the sum value divided by 40
gives more accurate Keypoint values.

SAHYADRI INTERNATIONAL JOURNAL OF RESEARCH, VOL 4, ISSUE 1, 2018
29
3.2 Local spectrogram feature extraction
Local spectrogram features for a sound are the values
surrounding the keypoints. Once the keypoints are detected we
can then extract the local spectrogram features using these
keypoints. The extracted local spectrogram features is then
grouped into clusters. Clustering is done using K-Means
clustering algorithm. This makes use of Euclid’s distance to
form the clusters. The Euclid’s distance formula is as follows:
…. (1)
Where (x1,y1) and (x2,y2) are the co-ordinates of keypoint
selected for clustering. The clusters are grouped based on the
distance obtained using Euclid’s formula. In K-Means, K
refers to number of clusters. In our approach we are making
use of 500 clusters which are formed using 50 iterations
3.3. Codebook
For each of the clusters formed mean is calculated which is
called visual word. The collection of all those visual word is
called codebook. Then we are matching extracted features or
the input sound with this codebook to predict the sound event.
Fig 2 shows the generation of codebook.
The extracted local spectrogram features for the input is
matched with the codebook line by line and features with least
distance will be plotted in the histogram along with the
corresponding labels. The label for which the histogram value
is highest is predicted as the output. Fig 3 shows the plotting
of histogram. In the figure, x-axis represents labels and y-axis
represents values.
Figure 2. Codebook generation
3.4. Training and testing
From each sound class 32 sounds are taken for training and 8
sounds are taken for testing. During training the features and
the labels are given to support-vector machine (SVM).
Figure 3. Histogram
During testing only, features are given and the
corresponding labels are given as output from trained SVM.
To classify the sound events and to predict the accuracy SVM
Chi-squared Kernel is used. Chi-squared Kernel is very
popular for training non-linear SVM. The Chi-squared Kernel
is calculated as follows:
.… (2)
Where x and y need to be non-negative and should be
normalized.
Accuracy is calculated by predicting how correctly the sound
is recognized. SVM classifiers are used to maintain a balance
between accuracy of training and the strength of the classifier.
4. EXPERIMENTAL RESULTS
4.1. Datasets
For our experiment we are using the following 12 classes of
sound: Applause, Cup Jingle, Chair Moving, Cough, Door
Slam, Key Jingle, Knock, Keyboard Typing, Phone Ringing,
Paper Work, Steps, and Laugh. For convenience in table 2 it is
represented as Ap, CJ, CM, Co, DS, KJ, Kn, KT, PR, PW, St,
La respectively. Each of this single class consists of 40 sounds.
Firstly, we have considered all the above classes in its isolated
form amongst which 32 sounds were used for training and 8
sounds were used for testing. Next we mixed the above
isolated sounds with the factory floor noise which is from
NOISEX’92 database. The sounds were mixed in 0dB, 10dB,
and 20dB. Next, we have considered single sound from 1 class
(i.e. Laugh) and mixed with other classes to form mixed sound
events.
4.2. Results
As estimation we are measuring the accuracy of the
recognized sound events. The results of our experiment can be

SAHYADRI INTERNATIONAL JOURNAL OF RESEARCH, VOL 4, ISSUE 1, 2018
30
found in Table I. As shown in the Table 1 isolated sounds have
more accuracy compared to overlapped sounds. The factory
floor noise of 20dB has more accuracy compared to the 10dB
and 0dB.The sound events with 20dB has less noise compared
to the 0dB.Mixed events have less accuracy compared to the
other overlapped sound since there will be confusion to
recognize the sounds. Here we are taking a single sound from
single class and mixing with all the other 11 classes. Our
approach finds it difficult to distinguish the two sound events
present in the mixed environment. In Table 2 has a confusion
matrix for mixed sound events where the confusion gives the
clear picture of how well the sound has been recognized
correctly and where it has been mis-predicted. In table 2 we
have taken confusion matrix of mixed sound events that has
given the accuracy of 71.591%. In this 8 applause sounds that
are given for testing is correctly recognized as applause itself.
But in cup jingle sound only 4 out of 8 sounds were
recognized correctly, remaining 4 sounds are mispredicted one
as chair moving, one more as keyboard typing and the
remaining 2 as paper work. Because of these types of
mispredictions, the accuracy has been decreased.
5. CONCLUSION
In this paper a technique to recognize the event is proposed in
overlapped noisy form. Our motivation is derived from social
observation, which has been recommended for human listening
built on confined evidence, and also after picture entity
identification that will make parallels with overlying SER. The
methodology we made use of is to discover keypoints in the
spectrogram, later portray the sound conjointly via the LSF
and the key-point dispersal in relation with the sound
inception. Further as future deed, our goal is to improve the
accuracy of mixed sound events. Also the work may comprise
reconstruction of the recognized acoustic events.
Table 1 Experimental Result under various test conditions
Experimental
setup
Acoustic events
Isolated
Sound
Events
Noisy sound Mixed
Sound
Events 0
dB
10
dB 20dB
Accuracy 88.542 74.583 79.167 82.292 71.591
Table 2 Confusion Matrix for mixed events
Ap CJ CM Co DS KJ Kn KT PR PW St
Ap 8 0 0 0 0 0 0 0 0 0 0
CJ 0 4 1 0 0 0 0 1 0 2 0
CM 0 0 5 1 0 0 0 0 1 1 0
Co 0 0 0 7 0 1 0 0 0 0 0
DS 0 0 0 0 8 0 0 0 0 0 0
KJ 0 0 0 1 0 6 0 0 0 1 0
Kn 0 0 0 0 1 0 6 0 0 0 1
KT 0 1 0 0 0 1 0 4 0 2 0
PR 0 0 0 3 0 0 1 1 3 0 0
PW 0 1 0 0 0 1 0 0 0 5 1
ST 0 0 0 1 0 0 0 0 0 0 7
ACKNOWLEDGMENT
This research was supported by Sahyadri College of
Engineering and Management. We are grateful to Mr. Sunil
B.N and Dr. Pushpalatha K who moderated this paper and in
that line improved the manuscript significantly.
REFERENCES
[1] Gerosa, L., Valenzise, G., Antonacci, F., Tagliasacchi,
M., Sarti, A., 2007. Scream and gunshot detection in
noisy environments, in: 15th European Signal Process.
Conf. (EUSIPCO-07), Sep. 3–7, Poznan, Poland.
[2] Bardeli, R., Wolff, D., Kurth, F., Koch, M., Tauchert, K.,
Frommolt, K., 2010. Detecting bird sounds in a complex
acoustic environment and application to bioacoustic
monitoring. Pattern Recognition Lett. 31, 1524–1534.
[3] Temko, A., Nadeu, C., 2009. Acoustic event detection in
meeting-room environments. Pattern Recognition Lett. 30,
1281–1288.

SAHYADRI INTERNATIONAL JOURNAL OF RESEARCH, VOL 4, ISSUE 1, 2018
31
[4] Dennis, J., Tran, H., Li, H., 2011. Spectrogram image
feature for sound event classification in mismatched
conditions. IEEE Signal Process. Lett. 18, 130–133.
[5] Dennis, J., Tran, H., Chng, E., 2012. Overlapping sound
event recognition using local spectrogram features with
the generalised hough transform, in: Proc. Interspeech
2012.
[6] Heckmann, M., Domont, X., Joublin, F., Goerick, C.,
2011. A hierarchical framework for spectro-temporal
feature extraction. Speech Comm. 53, 736–752.
[7] Lowe, D., 2004. Distinctive image features from scale-
invariant keypoints. Internat. J. Comput. Vision 60, 91–
110
[8] Lyon, R., 2010. Machine hearing: an emerging field.
IEEE Signal Process. Mag. 27, 131–139.
[9] Nádas, A., Nahamoo, D., Picheny, M., 1989. Speech
recognition using noise-adaptive prototypes. IEEE Trans.
Acoustics Speech Signal Process. 37, 1495–1503.
[10] O’Shaughnessy, D., 2008. Invited paper: automatic
speech recognition: history, methods and challenges.
Pattern Recognit. 41, 2965–2979.

SAHYADRI INTERNATIONAL JOURNAL OF RESEARCH, VOL 4, ISSUE 1, 2018
ISSN: 2456-186X, Published Online June, 2018 (http://www.sijr.in/)
32
Janardhana D R*, Ashreen, Anusha, Ashoora and Gladys Merlyn Dsouza
Department of Information Science and Engineering, Sahyadri College of Engineering & Management, Mangaluru - 575007
*Email: [email protected]
ABSTRACT
Over the centuries, humans have tried to reduce energy and one of the most efficient way to achieve this is to build a
smart city. Many modernist cities have started using different methods to reduce energy consumption and also to create
healthy surroundings. Few methods are used specially regarding road safety of passengers and waste management;
thereby we are introducing a simplest way to avoid such problems using an idea of Internet of Things (IoT) i.e. an “IOT
Based Energy and Waste Management System for Smart Cities”. Internet of Things is a simple way of connecting the
software and hardware components to the internet. IoT refers to an emerging model consisting of combination of
uniquely addressable things communicating with one another to form dynamic networks. Here this idea is used on street
lights and dustbins where street lights promote security across city and improves safety for drivers, riders and
pedestrians. Similarly, nobody wants to be in a place which is encompassed with waste or has awful smell, hence we
introduce smart dustbins, which are capable of sending alerts when they are full and can be emptied immediately, giving
no chance for the dustbin to be over flown .
Keywords: Arduino Microcontroller, Dustbin, ESP Module, IoT, Sensor, Streetlight
1. INTRODUCTION
The Internet of Things (IoT) is the network of hardware and
software devices connected on to the ever available internet.
Each factor is unambiguously recognizable through its
embedded automatic data processing system. At times IoT is
connected to an object and then they are invoked and
controlled remotely. The IoT will usually be connected to
associate information processing network to the worldwide
net. IoT focuses on reducing human intervention. Commercial
IoT, where local communication is usually either Bluetooth or
LAN (wired or wireless), the IoT device will typically
communicate only with local devices. The IoT promotes
increase the level of awareness concerning our world and a
platform to observe the reactions to the dynamic conditions.
India is a developing nation with massive population, due to
which the energy consumed and waste produced is huge. Thus
there is need for saving these resources and also to keep the
city clean. Since energy is one in all the foremost vital
resource in our life so it should be employed in economical
ways to make use of the energy and save energy for future
requirement. Over the century, humans have tried to cut back
energy and one among the foremost economical manner is to
create a sensible green home. Several modernist cities started
adopting this technique to cut back energy and environmental
pollution over the past few years. Few of the major reasons
are basically throughout night time all the lights on the main
road stay ON for the passengers, similarly as for vehicles,
however ton of energy is wasted once there's no vehicle or
traveler movement. Dominant of street lamp is of utmost
important in developing country like India to cut back the
power consumption. Saving of this energy could be a vital
issue lately as energy resources are getting reduced day by
day.
Secondly, waste management is additionally one among the
first drawback that the globe faces irrespective of the case of
developed or developing country. Within the contemporary
situation, many times we see that the dustbins are placed at
public places within the town are seen flooded because of
increase in the waste daily. It creates insanitary circumstances
for the folks and creates awful smell which leads in spreading
of some deadly diseases.
To avoid such issues, we are progressing to vogue “IoT
Based Energy and Waste Management for Smart Cities”. This
project describes about the circuit that switches the road lights
ON during dedicated amount of time and remains OFF after
steady time. The dynamic street lamp management depends on
an inter-connectable IoT. Novel methods are adapted to make
the connection of hardware units to speed up the connection to
the internet faster. These details are usually accessed by the
IoT Based Energy and Waste Management for
Smart Cities

SAHYADRI INTERNATIONAL JOURNAL OF RESEARCH, VOL 4, ISSUE 1, 2018
33
municipal authorities from their place with the help of
software. Admin has the authority to read the status of
streetlight that is if the light is active or inactive and also read
the dustbin that is he can check the level of waste. He/she can
also view the graph that is the execution time.
2. RELATED WORK
Nabil Ouerhani et al. [1], the paper affords a real-global
established solution for dynamic street light managing which is
based on the fancy internet. Enormous interest is delivered on
interoperability degree, the use of novel tool connection
concept based totally on version-driven communique
marketers to connect the sensors to the internet. The paper
shows the outcomes from actual-international assessments with
deployed dynamic road lighting fixtures in cities. The
proposed model will trying save the energy up to an estimate
of 50% of the power consumed. Zigbee unit used in this
system will ensure the safety in the operations.
Rohaida Husin et al. [2], the paper gives an idea about
automatic streetlamp system supported by an inexpensive
microcontroller. This method consists of a microcontroller,
lightweight device, rain device, optical device and a collection
of the LED units. The system was programmed to
mechanically shut at the daytime and work during the night.
Many numbers of tests are conducted to check and validate the
projected image within the completely different environment.
As conclusion, around at the max there is 80% of reduction in
electricity usage can be achieved. This paper makes a case for
the uses microcontroller and detector to browse the input and
processes it to get needed output. It uses low price
microcontroller. It doesn’t use IoT.
Deepak Kapgate [3], the paper describes the employment of
wireless sensing element network for streetlight observation
and management. As we glance at existing systems the ability
consumption and maintenance price of streetlight management
department is high. This technique would provide associate in
nursing optimum cost accounting for lamp maintenance and
control. System utilized use of network process device for
sensing of sunshine then gathered information is used for
dominant lamp ON/OFF. Lifetime of streetlight depends on
the length for which they get used. During this analysis, this
will be able to try and scale back the required length that lamp
ought to get on, focuses on increasing band for network nodes
to urge most possible rate and additionally discuss the
parameters needed to automatic detection and removal of
nodes within the network. This paper discusses concerning the
usage of Wireless Sensor Network (WSN) to control and
monitor the road light-weight. The control center will manage
and monitor all street at real time. It uses Zigbee that may not
secure and conjointly the coverage is restricted.
Dr. N. Sathish kumar et al. [4], The problem that people face
in current days are the garbage is overflown and there is no
proper waste management. It in turn ends up in numerous
hazards appreciate dangerous odour and create unhealthy
atmosphere which could be seen as a number one cause for
uninvited diseases. To prevent all these dangerous situation
and to maintain a healthy surrounding, the proposed work is to
have a feasible garbage management system. This paper tries
to tackle the problem by cleaning the garbage as soon as it is
full with keeping in mind some of the criteria, primarily based
on level of garbage filling. The garbage system works in very
simple way, once the bin is full to certain level the alert is sent
the respective municipal authority sever and the cleaning is
taken care of. The proposed system is taken care with the help
of RFID tags, these tags help in verifying the signals that are to
be sent to the system. The IoT system is segregated with the
other components and the process is completed.
Twinkle Sinha et al. [5], the paper discusses relating to the
design of model for a ‘Smart Dustbin’ that indicates directly
that the waste bin is crammed to a particular level by the
rubbish and cleansing or evacuation them may be a matter of
immediate concern. This prevents lumping of garbage within
the edge waste bin that finally ends up giving foul smell and
health problem to folks. The design of the sensible waste bin
includes one directional cylinder associated an arduino UNO.
Here the garbage system uses the alerting way to notify the
municipal through some method of alerting system. There is a
level sensor which indicates the level of the garbage, it sends
notification when a defined level is reached. The signals are
received as in a format of glowing diodes.
3. SYSTEM DESIGN
System design is the process of describing the data,
architecture and modules for a system to fulfill the specified
requirements.
3.1 Architecture Diagram
Architectural diagrams are used to illustrate the relationship
between different components of a system. It is very important
to understand the complete concept of the system. The figure1
shows the architectural diagram of our proposed system. The
proposed system consists of IR sensors which will identify the
level of the garbage bin. When the garbage bin is full it sends
the level details to the arduino microcontroller, which sends
alert to the admin. The streetlights are monitored for their
states and their status is sent to the admin. ESP module is used
for communication with the web server.
4. IMPLEMENTATION
Implementation is the process of carrying out an execution,
application of a plan in particular manner. The process of
implementation is done to see how information will be
processed, installed, deployed into a working operational unit.
4.1 C#
C# is a programming language that encompasses functional,
imperative, generic, object-oriented (class-based), and
component-oriented programming disciplines. C# is intended
to be a simple, modern, general-purpose, object-oriented
programming language. We have used c# to design a software.
4.2 Microsoft Visual Studio 2010
Microsoft visual studio is an integrated development
environment from Microsoft. It is used to develop console and

SAHYADRI INTERNATIONAL JOURNAL OF RESEARCH, VOL 4, ISSUE 1, 2018
34
graphical user interface applications along with websites and
web pages. Visual Studio supports different programming
languages by means of language services. Visual studio is used
for front end to design our software.
4.3 Microsoft Visual Studio 2010
Microsoft visual studio is an integrated development
environment from Microsoft. It is used to develop console and
graphical user interface applications along with websites and
web pages. Visual Studio supports different programming
languages by means of language services. Visual studio is used
for front end to design our software.
4.4 MySQL
MySQL is an open source Relational Database Management
System (RDBMS) that runs as a server providing multi-user
access to a number of databases. The MySQL development
project has made it source code available under the terms of
the GNU General Public License, as well as under a variety of
proprietary agreements. MySQL is a popular choice of
database for use in web applications, and is a central
development of the widely used LAMP open source web
application software stack. My Sql is used for back end to
design our software.
4.5 Ultrasonic Sensor
In this project we have made use of Ultrasonic sensor.
Ultrasonic sensor mainly works by using ultrasonic signal, it
sends the signal to check the distance between the objects.
Sound wave is sent at particular frequency to measure the
distance there is some frequency at which sound bounce back.
When the object is detected it send those values to the
processing unit.
4.6 Arduino Uno
Arduino is an open source software and hardware company
that manufactures single board micro controllers. Arduino
boards have an Atmel 8-bit AVR microcontroller. Arduino
Uno is one of the most common one these day, they have six
pins for pulse-width modulated signals and another six analog
inputs, which can also be used as six digital I/O pins and 14
digital pins. Which is main unit in our project that combines
the two circuit.
4.7 IR Sensor
IR Sensors works by selecting light wavelength in the InfraRed
(IR) spectrum by using a specific light sensor. One can look at
the intensity of the received light by comparing the intensity of
received light.
4.8 LCD
LCD is used to display the percentage of dustbin fill in our
project.
Figure 1: Architecture diagram of proposed system.
4.9 ESP 8266
It connects microcontroller i.e arduino uno to wi-fi network
and creates a simple TCP/IP connection. The two pins of esp
module was used to create the Communication i.e is Rx and
Tx. One is used for transmitting and other one is used for the
receiving purpose
5. RESULTS AND ANALYSIS
The hardware prototype of our project “IoT based Energy
and Waste Management for Smart Cities” is been developed
using arduino as the microcontroller, IR as level sensor, There
is a screen to monitor the garbage level. When the level is
25%, 50%, or 75% the level message is shown to the admin.
Streetlights are turned ON during the night time and switched
OFF during day, the status of streetlight is displayed to the
admin.
Figure 2. Graph indicating the status of dustbin
6. CONCLUSION AND FUTURE WORK
IOT based energy and waste management aims at keeping the
environment clean by continuously monitoring the dustbin.
Here the level of waste filled in the bin can be detected by the

SAHYADRI INTERNATIONAL JOURNAL OF RESEARCH, VOL 4, ISSUE 1, 2018
35
admin thus helping in cleaning the bin immediately once it is
filled and also helps in monitoring the streetlight hence
preventing the accidents caused at the night and any other
filthy acts. Hence this project would be of great benefit to the
society.
The proposed system is built in such a way that there is
room for further enhancement. New additional features can be
added without any hassle. In future this system can be
designed as mobile/IOS application so that the user can
publish the online publication without cost per click.
REFERENCES
[1] Nabil Ouerhani, Nuria Pazos, Marco Aeberli, Michael
Muller, “IoT Based Dynamic Street Light Control for
Smart Cities”, IEEE University of Applied Sciences,
Switzerland, 2016.
[2] Rohaida Husin, Syed Abdul Mutalib Al Junid, Zulkifli
Abd Majid, “Automatic Street Lighting System for Energy
Efficiency Based on Low Cost Microcontroller”,
International Journal of Simulation Systems, Science and
Technology, Vol.13, 2012.
[3] Deepak Kapgate, “Wireless Streetlight Control System”,
International Journal of Computer Applications, Vol.41,
2012.
[4] Dr.N.Sathish kumar, B.Vijayalakshmi, R.Jeniferprarthana,
A.Shankar, “IoT Based Smart Garbage Alert System
Using Arduino UNO”, 2016.
[5] Twinkle Sinha, K.Mugesh Kumar, P.Saisharan, “Smart
Dustbin”, International Journal of Industrial Electronics
and Electrical Engineering, Vol.3, 2015.

SAHYADRI INTERNATIONAL JOURNAL OF RESEARCH, VOL 4, ISSUE 1, 2018
ISSN: 2456-186X, Published Online June, 2018 (http://www.sijr.in/)
36
Ads Recommendation Using Data Mining
Akhila Thejaswi R*, Mohammed Mohiddin, Deshik, Jnanesh Shetty and Nilesh Kumar
Department of Information Science and Engineering, Sahyadri College of Engineering & Management, Mangaluru – 575007
*Email: [email protected]
ABSTRACT
Every vendor wants to publicize their products. They do it by showing ads on various platforms like social media,
television etc. These ads will sometimes be of use to customer or it won’t be of any use to them. Sometimes unwanted ads
may even annoy the customers. So in order to avoid such cases we develop a project that provides ads based on location,
time and interest of the customer. The interest will be given by the user via social media and the location and system time
will be calculated by the software. Therefore if a customer likes something in social media, that will be taken as interest
and whenever user comes across such a location based on his interest, ads of such vendors or shops will be given. This will
help both vendors to provide its ad and customers to get the ads it likes.
Keywords: User Interests, Location based, Recommendation, Data Mining, IP Address, Offers and Vendors.
1. INTRODUCTION
Data mining is a process that allows sorting of large data sets
to identify patterns and establishing connections to solve a
particular problem using data analysis. Data mining tools also
allows the enterprises to predict their future trends.
In data mining, association rules can be created by analyzing
the data that requires frequent use of if/then patterns, and using
the confidence criteria one can locate the most important
connections within the data. The other data mining parameters
can include Classification, Clustering, Forecasting and Path
Analysis.
Data mining techniques can also be used in many research
areas including marketing, mathematics, cybernetics and
genetics. While data mining techniques are meant to drive
efficiency and predict the behavior, if correctly used, any
business can set itself apart from other computational business
through the proper use of predictive analysis. Data mining is
primarily used by the companies which have a strong
consumer focus like retail, financial, marketing organizations
and communications.
In general, the benefits of data mining comes from the ability
to uncover hidden patterns and relationships in data that can be
used to make predictions that impact businesses.
Likewise, the development of data warehouse also uncovers
the immediate way you are currently practicing: The
requirement for an intense, easy-to-use and economic data
warehouse created for the cloud to bank all your data in one-
single point and use and analyze it later. Therefore, the modern
data warehouse came as an effective data solution.
The proposed work is a web based application using location
and interest of the user. First, we collect the interests of the
users and store it in a file. The location and the ads of the
vendors are provided to the admin by the vendors itself. The
ads are verified based on certain criteria by the admin. The
verified ads are added to the LIT software.
When the user reaches a certain location near to that of the
vendor at a particular time, the ad will pop up on the screen.
The user can now use the help of the LIT software and use the
ad or can just ignore it. The decision is completely based on
the user whether or not to use the ads.
2. RELATED WORK
In the recent years, wireless networks and mobile technologies
have shown a rapid growth. This has led to opportunities for
marketers and advertisers which include satisfaction of the
customer, customer engagement etc. The main challenge for
advertisers and marketers is to analyze huge amount of data
emitted by mobile devices. And also provide customer
engagement from the mobile data. Lei Deng et al. [1],
addresses this challenge by introducing a framework that
recommends ads by using big data analytics. The algorithm
used here is clustering algorithm. GEO information integration
with profile datasets is also been used. The framework
proposed here provides a decision based approach to handle
various cases associated in pushing ads towards the end users.
Ananthi Sheshasaayee and H. Jayamangala.[2], focuses
mainly on a node in a network called the influential node or an
information hub. This influential node has a large number of
contacts in social networks. So, any recommendations of ads
will reach a vast number of users. The technique used in order

SAHYADRI INTERNATIONAL JOURNAL OF RESEARCH, VOL 4, ISSUE 1, 2018
37
to identify the information hub or influential node is beSt
sPreadeR Identi_catioN using K-shelL graph structurE
(SPRINKLE) approach. In future, more focus is given on
popularity of the item relevant to the preferences, as they are
considered as the main factor for recommendation of ads.
Social networking is not only seen as a means of
entertainment, but also an active tool for marketing. Andy
Bengal et al.[3], proposes a framework that empowers
marketers and analysts by providing them with all the
information related to tags that are deployed on websites in
real time. In order to find any information about the behavior
of a user of any webpages a “tag" is used. A tag is a small
piece of code which will be embedded in the webpages in
order to find any information related to the user of the
webpage, for example, the visitor's browsing behavior. The
method used here is real-time tag discovery and an analysis
tool.
In business field, Internet has been used as a primary tool
for advertising and marketing. Most of the advertising
solutions these days use Behavior Targeting (BT) technology
to provide services to the end users. Lei Deng and Jerry Gao.
[4], proposes a system with the help of data mining algorithms
and machine learning solutions. The main objective in this
paper is to provide static services for advertisers. Services
such as when, where what and how to place advertisements
will be provided to the advertisers. This not only recommends
the advertisements but also predicts trends. The system also
uses NoSQL database technologies. This will allow advertisers
to reduce cost and improve effectiveness. The algorithm used
here is Synthesis Index Strategy (SIS) Algorithm. Ads will be
recommended using location and current state of art
technologies.
Nico Neumann. [5], discusses the development of
advertising and marketing technology. The system is based on
Automated buying processes and micro-targeting
personalization. It also uses Location-based targeting
combined with profile data.
Badrish Chandramouliet al.[6], presents a big data
application for demand-side plat-form(DSP), for mobile
display advertising. The algorithm used here is behavior
targeting (BT) Algorithms with TiMR. In order to increase the
efficiency of the campaigns through information collected
based on visitors browsing data, by advertisers and marketers.
Validate the approach by proposing a new end-to-end solution
using temporal queries for BT.
3. ARCHITECTURE OF THE PROPOSED
MODEL An architecture model is concerned with a set of tradeoffs
inherent in structure and design of a system.
The figure 1 shows the architecture of our system. The system
is divided into two phases; train phase and test phase.
Initially, the file will contain all the user details like user
interests. The Ads can be viewed by the user once their
location is fetched by the LIT software.
The locations of the vendors are verified and also their Ads
based on admin's strategies. The admin can discard or use the
given Ads. The verified Ads are added to the LIT software.
The user when arriving at a certain location at a certain time,
he can view the Ads based on his interests. The user can ignore
or visit the store of the vendor.
Figure 2: Architecture diagram for ads recommendation
4. IMPLEMENTATION
4.1 Front End
Front end is through which all end-users interact with the
software. There are many styling languages because it is
mainly concerned with the design. We have used JSP to design
our front end. JSP is nothing but JavaServer Pages which is
used to create web pages dynamically. It is similar toASP and
PHP but here Java programming language is used.
4.2 Pseudo code
The pseudocode for Admin end is as follows:
1. BEGIN
2. IF admin login is successful
3. IMPORT JSON and CSV
4. IF successfully imported
5. EXTRACT keyword
6. UPDATE user interest table with user interest and
weight
7. ELSE DISPLAY error message
8. ADD Vendors and provide login credentials to
vendor
9. Admin LOGOUT
10. ELSE DISPLAY invalid credentials.
11. END
The pseudocode for Vendor end is as follows:
1. BEGIN
2. IF vendor login is successful
3. ADD offers,DELETE offers,UPDATE offers
4. Vendor LOGOUT
5. ELSE DISPLAY invalid credentials
6. END

SAHYADRI INTERNATIONAL JOURNAL OF RESEARCH, VOL 4, ISSUE 1, 2018
38
The pseudocode for User end is as follows:
1. BEGIN
2. IF user registration is successful
3. ENABLE Location
4. LOGIN to view ads
5. IF login is successful
6. IF offer is available
7. DISPLAY OFFERS based on user location and
interest
8. ELSE DISPLAY no offer available
9. ELSE DISPLAY invalid credentials
10. User LOGOUT
11. END
4.3 Back End
The back end is where the data is stored and is accessed by
end-users from the front end. In our system, the software
database is kept at back end and mySQL is used in order to
access or manipulate data.
5. RESULTS AND ANALYSIS
The software has been used at various places in order to check
the output which the software has to yield.
The performance which is measured in time here is
compared with the size of dataset.
A graph is obtained which is shown in figure 4.
Figure 1: Represents the place - 1
6. CONCLUSION
The proposed system recommends ads based on three factors
i.e., Location of the user, Interest the user has shown in social
media and until the time the offer is valid for. The system will
provide details about the ongoing offers around him. The
objective of the system is to avoid unwanted ads which one
gets while he is nowhere concerned about it.
Figure 3: Represents place - 2
Figure 4. Graph: time vs dataset
ACKNOWLEDGMENT
We are grateful to Dr. R Srinivasa Rao Kunte, Principal,
Sahyadri College of Engineering & Management, Dr. Umesh
M. Bhushi, Director Strategic Planing, Sahyadri College of
Engineering & Management and Dr. D. L. Prabhakara,
Director, Sahyadri Educational Institutions, who have always
been a great source of inspiration. Finally, yet importantly, we
express our heartfelt thanks to our family & friends for their
wishes and encouragement throughout the work.
REFERENCES
[1] Deng, Lei, Jerry Gao, and Chandrasekar Vuppalapati,
"Building a big data analytics service framework for
mobile advertising and marketing", 2015 IEEE
First.International Conference on Big Data
Computing..Service and Applications.

SAHYADRI INTERNATIONAL JOURNAL OF RESEARCH, VOL 4, ISSUE 1, 2018
39
[2] Sheshasaayee, Ananthi, and H. Jayamangala. "A study on
the new approaches for social network based
recommendations in digital marketing", 2017
International Conference on Innovative Mechanisms for
Industry Applications (ICIMIA).
[3] Bengel, Andy, Amin Shawki, and Dippy Aggarwal.
"Simplifying web analytics for digital marketing", 2015
IEEE International Conference on Big Data (Big Data).
[4] Deng, Lei, and Jerry Gao. "An advertising analytics
framework using social network big data", 2015 5th
International Conference on Information Science and
Technology (ICIST).
[5] Neumann, Nico, "The power of big data and algorithms
for advertising and customer communication,
“International Workshop on Big Data and Information
Security (IWBIS)”, IEEE, 2016.
[6] Chandramouli, Badrish, Jonathan Goldstein, and Songyun
Duan. "Temporal analytics on big data for web
advertising", 2012 IEEE 28th International Conference
on Data Engineering (ICDE).
[7] Michael Blaha and James Rumbaugh, “Object-Oriented
Modeling and Design with UML”, 2nd Edition, Pearson
Education, 2005, pp 21-157.
[8] Sommerville, “Software Engineering”, Eighth edition,
Pearson publication.
Sheshasaayee, Ananthi, and H. Jayamangala. "A Study on
Advertising." 2012 IEEE (ICDE).
Michael

SAHYADRI INTERNATIONAL JOURNAL OF RESEARCH, VOL 4, ISSUE 1, 2018
ISSN: 2456-186X, Published Online June, 2018 (http://www.sijr.in/)
40
Multilevel Encryption for Cloud Storage
Deepti Rai*, Roopa Desai, Tripti P S and Vinutha B
Department of Information Science and Engineering, Sahyadri College of Engineering & Management, Mangaluru – 575007
*Email: [email protected]
ABSTRACT
InformationCloud storage has easy access anytime, anyplace, anyhow due to its scalability, cost efficiency, and high reliability of the
data. Cloud computing uses internet for computing services. Organizations are moving their data to cloud. So we have to protect
uploaded data against unauthorized users from data access, modification etc. In this paper, a multilevel encryption and decryption for
cloud storage is proposed. Here a combination of AES and Rounded shift algorithm is used. Thus, only a valid user will access and
modify the data file. If an intruder takes the confidential data intentionally or accidentally, one must have had to decrypt the data for at
each level. So, there is less probability of getting original data. It is expected that using double level encryption and decryption will
provide more security of cloud storage that using one level for encryption and decryption.
Keywords: Cryptograph, Security algorithm, AES, Rounded shift, Symmetric, Asymmetric
1. INTRODUCTION
In this new era, Cloud computing provides large number of
services of internet. For cloud services allows user to utilize
software and hardware that will be managed by unauthorized
or invalid users. Cloud services mainly used for file storage,
webmail and business application. Security to the data that
resides in the cloud is provided by cryptographic algorithms.
By using cryptography original data called plain text is
converted into non readable form called cipher text. Existing
cryptographic algorithm uses single level encryption and
decryption so cyber criminals can easily break single level
encryption.
Hence we propose the system that consists of multilevel
encryption and decryption to provide security to cloud data. In
our proposed system we implement two algorithms in which
first level of encryption is done by Advanced Encryption
Standard (AES) and second level encryption is done by
Rounded Shift algorithm which is of Caesar Cipher type. AES
will process huge amount of data and that has high speed of
performing encryption and decryption which is more secure.
Caesar Cipher also known as shift cipher which consists of left
and right shifts. Here each bit of plain text is shifted in Caesar
box to a certain position using key. In our paper, we use
modified Caesar cipher for better security purpose. When user
uploads file it undergoes first level encryption using AES
algorithm and here plain text is converted into cipher text. This
scrambled form again undergoes second level encryption using
Rounded Shift algorithm and these encrypted data stored in
cloud database. When user wants to retrieve data from cloud
decryption is done in the reverse order of encryption. Thus
user gets the original data. In multilevel encryption it is
difficult to guess the key for intruder.
Architecture design shows the conceptual model of the
application. A graphical representation of concepts, their
principles, elements and components that are part of
architecture. The general architectural diagram of Multilevel
Encryption/Decryption for Cloud Storage is shown in Figure.
This design consists two level of encryption and decryption.
Initially when user uploads the file, it undergoes first level of
encryption using AES algorithm. During this original data is
converted to cipher text and this cipher text undergoes second
level of encryption using Rounded Shift algorithm. This
encrypted data is stored in cloud database. When the user
wants to download the file, the file is retrieved from cloud
database and it undergoes two level of decryption using
Rounded Shift and AES algorithm respectively. During each
level of decryption cipher text is converted to plain text. Thus
user gets original data file.
Figure 1: Architecture diagram of multilevel encryption / decryption for
cloud storage

SAHYADRI INTERNATIONAL JOURNAL OF RESEARCH, VOL 4, ISSUE 1, 2018
41
2. LITERATURE SURVEY
Data security in the cloud will be increased for using RSA and
AES encryption and decryption algorithm. Here it uses key
size of 1024 bit and 128 bit, so attacker cannot determine
private key even if public keys are generated. The performance
can be analysed with the help of file size and computation cost.
This paper uses symmetric and asymmetric algorithm wherein
asymmetric public of key is used by encryption to and private
for key is for used by decryption. In symmetric one key is used
for either an encryption or a decryption. Security can be
enhanced using both symmetric and asymmetric algorithm.
Hash and signature algorithms used to compress data [1]. The
major issue related for cloud security of data integration. As a
solution Byzantine for fault-tolerant protocol across over
multiples of clouds is used. Another major concern is service
availability. It prevents loss of customer private data as about
result for malicious insiders out of clouds. This paper uses
cloud computing of model includes of five characteristics
features [2]. Security can be gained by applying cryptographic
for methods by enclosing data decryption key only of the
registered users. But here solution produces many computation
times over the data owner on key distribution with
management. This problem can be overcome by using
attribute-based encryption like proxy decryption and lazy
decryption. Data access control is developed by implementing
fine grained to access by control, with leads to edibility of
differential access with rights on individual users [5]. The
system architectures used concatenating of digitalized
signature algorithm of Diffie Hellman and AES as encryptions.
Block tag form of authentication is used to maintain data over
cloud storage. So there was need to remoting data integrity
along provides security regards of user data. The combination
with authentications techniques and key exchanged algorithms
is implemented and that leads to three way of mechanisms.
Here key distribution done in decentralized manner. Data
slicing was doing through data for fragmentation technique to
create segments of data. Datasets get slice onto three segments
with using vertical, horizontal of mixed fragmentation with
techniques. [6].
3. IMPLEMENTATION
Functional modules of multilevel encryption for cloud storage
are:
1. Registration
2. Login into the system
3. Upload files
4. My files
3.1. Registration
Here new user signup into the system by entering username,
mobile number, email, password which will be stored in the
database for further reference.
3.2. Login into the system
Registered user can login into system for the upload, download
and viewing the files which are stored in cloud.
3.3 Upload files
Here user chooses the file to be stored in the cloud. This file
will undergo two level of encryption using rounded shift and
AES algorithms before uploading it to cloud.
3.4. My files
Here get two options viz download and view. The file can be
searched by its uploaded date and with file title. During
download and view decryption is done in the reverse order of
encryption and OTP is sent to the authorized user to access the
file.
Here we are using two algorithms such as rounded shift
algorithm and advanced encryption standard.
1) Rounded shift algorithm: Rounded Shift algorithm is
Caesar-cipher type algorithm which uses the shifting of bits to
encrypt the plain text. In this paper, we have used nine cross
nine matrix which is further divided into nine blocks which is
of three cross three matrix.
In first step this algorithm shifts fixed number of blocks as it
defined in an algorithm. Later, in second step it shifts the bytes
within the selected block based on the original length of the
plain text. This generated cipher text is given as input to AES
algorithm which is further encrypted using random generated
keys. The decryption is done just by reverse order of
encryption.
2) Advanced encryption standard (AES): Most popularized
and with widely used symmetric of encryption algorithm is
advanced encryption standard. AES is much faster than DES.
The size of key used in DES is very small. It needed to be
replaced by an algorithm. The feature with AES are symmetric
of key, block cipher, 128 bit data, 128/192/256 bit keys. This
algorithm treats the 128 bits in a plane text as a block of 16
bytes. The 16 bytes are arranged in the form of a matrix
consisting of 4 rows and columns.
There are 4 steps in the encryption process.
1. Bytes substitution: Byte substitution is a step in which 16
bytes of input is substituted after looking up a fixed table
which gives a matrix of 4 rows and columns.
2. Shifting of rows: Shifting of rows includes shift of the
matrix’s rows to the left, whichever entry which falls of re-
inserted to the right of the row. The shifting is done randomly
picking each row and shifting towards the left with random
number of shifts. This step occurs in numerous number of
times.
3. Mixing of columns: Mixing of columns is done by
transforming each column which consists of 4 bytes using
some mathematical function. This function replaces the
original column of 4 bytes into completely new set of 4 bytes.
This gives with result upon another unique in matrix which
consists of 16 new with bytes.
4. Adding of round keys: Adding of round keys has 16 from
bytes of matrix which are considered with 128 bits and is OR,
forming a round key of same number of bits. This step is
performed many number of times to get the output as cipher
text. The decryption of cipher text is done by reversing the
order of encryption process.
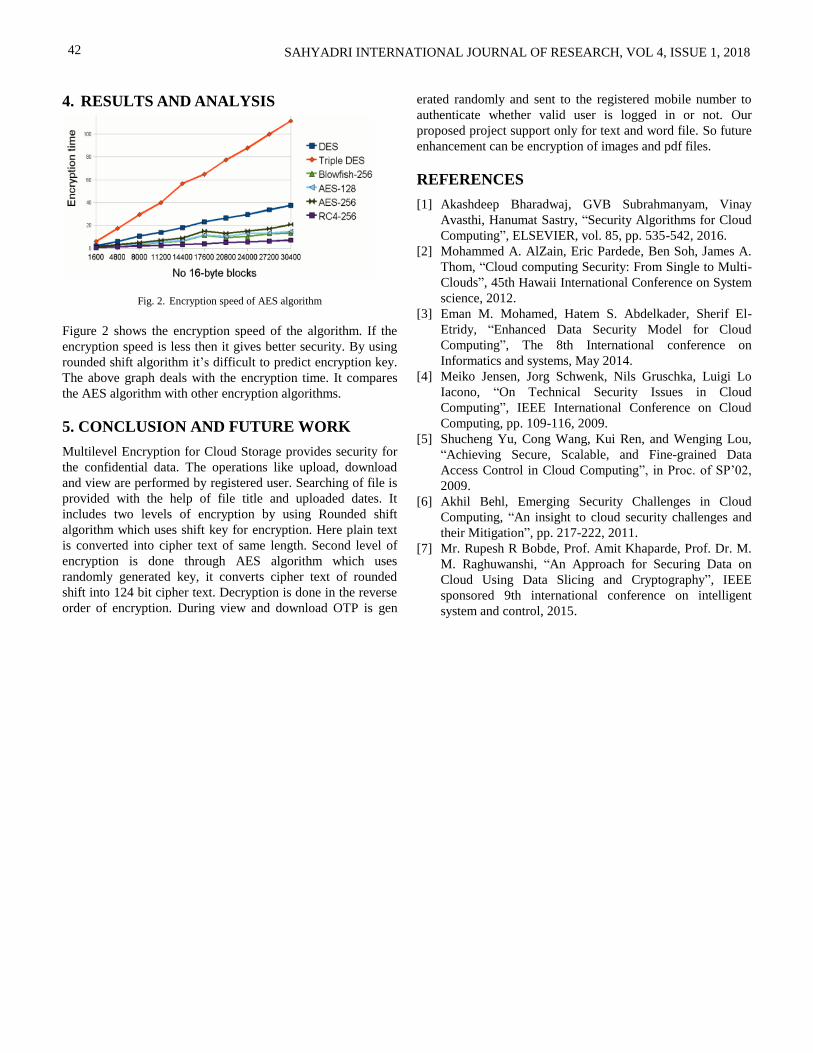
SAHYADRI INTERNATIONAL JOURNAL OF RESEARCH, VOL 4, ISSUE 1, 2018
42
4. RESULTS AND ANALYSIS
Fig. 2. Encryption speed of AES algorithm
Figure 2 shows the encryption speed of the algorithm. If the
encryption speed is less then it gives better security. By using
rounded shift algorithm it’s difficult to predict encryption key.
The above graph deals with the encryption time. It compares
the AES algorithm with other encryption algorithms.
5. CONCLUSION AND FUTURE WORK
Multilevel Encryption for Cloud Storage provides security for
the confidential data. The operations like upload, download
and view are performed by registered user. Searching of file is
provided with the help of file title and uploaded dates. It
includes two levels of encryption by using Rounded shift
algorithm which uses shift key for encryption. Here plain text
is converted into cipher text of same length. Second level of
encryption is done through AES algorithm which uses
randomly generated key, it converts cipher text of rounded
shift into 124 bit cipher text. Decryption is done in the reverse
order of encryption. During view and download OTP is gen
erated randomly and sent to the registered mobile number to
authenticate whether valid user is logged in or not. Our
proposed project support only for text and word file. So future
enhancement can be encryption of images and pdf files.
REFERENCES
[1] Akashdeep Bharadwaj, GVB Subrahmanyam, Vinay
Avasthi, Hanumat Sastry, “Security Algorithms for Cloud
Computing”, ELSEVIER, vol. 85, pp. 535-542, 2016.
[2] Mohammed A. AlZain, Eric Pardede, Ben Soh, James A.
Thom, “Cloud computing Security: From Single to Multi-
Clouds”, 45th Hawaii International Conference on System
science, 2012.
[3] Eman M. Mohamed, Hatem S. Abdelkader, Sherif El-
Etridy, “Enhanced Data Security Model for Cloud
Computing”, The 8th International conference on
Informatics and systems, May 2014.
[4] Meiko Jensen, Jorg Schwenk, Nils Gruschka, Luigi Lo
Iacono, “On Technical Security Issues in Cloud
Computing”, IEEE International Conference on Cloud
Computing, pp. 109-116, 2009.
[5] Shucheng Yu, Cong Wang, Kui Ren, and Wenging Lou,
“Achieving Secure, Scalable, and Fine-grained Data
Access Control in Cloud Computing”, in Proc. of SP’02,
2009.
[6] Akhil Behl, Emerging Security Challenges in Cloud
Computing, “An insight to cloud security challenges and
their Mitigation”, pp. 217-222, 2011.
[7] Mr. Rupesh R Bobde, Prof. Amit Khaparde, Prof. Dr. M.
M. Raghuwanshi, “An Approach for Securing Data on
Cloud Using Data Slicing and Cryptography”, IEEE
sponsored 9th international conference on intelligent
system and control, 2015.

SAHYADRI INTERNATIONAL JOURNAL OF RESEARCH, VOL 4, ISSUE 1, 2018
ISSN: 2456-186X, Published Online June, 2018 (http://www.sijr.in/)
43
War Field Spy Robot
Megha N*, Pratham Shet, Salian Veena Suresh, Shashidhar, Susmitha K.
Department of Electronics and Comm. Engineering, Sahyadri College of Engineering & Management, Mangaluru-575007
*Email: [email protected]
ABSTRACT
This paper presents a design scheme to develop robotic vehicle which provides surveillance in the war field. The spy robot
is very useful and capable of performing jobs in situations which are hazardous for humans. The robotic vehicle is attached
with a wireless camera which wirelessly transmits real time videos with night vision capabilities. This robot is used in
monitoring purpose in the war field by spying the activities taking place in the war field. The android application device
used at the transmitting end acts as a remote control to control the motion of the robot. The robot is capable of detecting
the bomb underneath and sending a message to android application device.
Keywords: Night vision wireless camera, Android application device, PIC microcontroller.
1. INTRODUCTION
Robots help in performing repetitive and dangerous task which
humans won’t consider to do. This project deals with the control
of robotic vehicle using android application. The robot can
move in required directions using android application and
captures the real time images and videos. The Microcontroller
is used to interface with Bluetooth Module, Camera, and
Proximity sensor. The Bluetooth Module is used for
transmitting the data to Android Application device. The aim of
this project is to develop an android controlled robotic vehicle
using Bluetooth Module. Robots can do jobs in areas where
human cannot go and in situations that pose risk to human life.
Small holes make human movement difficult inside it and hence
robots prove beneficial under such circumstances [1]. The
robotic vehicle moves according to the commands given by
android application. The motor drivers act as the wheels for
robot which is programmed using Microcontroller. Bluetooth
module is used to interfacing the robot with android device. The
camera mounted on the robot transmits real time happenings of
its surroundings. The path followed by the robot is being seen
in the camera by remote user, accordingly the video signals are
sent to the PC or laptop. Wired robots were developed in 1940’s
and were used by expertise trained for the same. A new class of
robots controlled by remote can be accessed now on the site:
the online robots. These allow users from all over the world to
museum, tend gardens, find way undersea, or handle crystals of
protein. The first generation of online robots came into
existence in 1994. In contrast, research on the second
generation of Internet robots has of late focuses on independent
mobile robots that steer in a forceful and unsure environment.
Remote controlled robot had problem in their range restriction
and also they were very high-priced in terms of safety and use
[1]. We are exploring how a robot can be controlled using
android application. The Secret Robot will be able to replace
human. It has camera used to capture the real time videos. The
robot vehicle work like military tank, moving forward, turning
left direction and turning towards right direction. Wireless
camera will send back the existent time videos of surrounding
happenings which can be seen on a distant monitor in the PC
where the robot is being inhibited and action can be taken
accordingly.
The research paper [1], proposed by Darshan Dayma,
Bhushan Chavan Authors presents a Bluetooth and cell phone
controlled robot. The system uses bluetooth module, four dc
motors, microcontroller, temperature sensor and humidity
sensor. PIC Microcontroller used is the heart of this structure
which is used to organize and process several functions based
on coding. The humidity sensor senses the humid environment
around the robot. Based on the numerical temperature value the
temperature sensor senses the weather changes. In April 2016
[2] Authors have developed a Smart spy robot system using RF
technology. The system consists of wireless camera, Bluetooth,
8051 microcontroller, RF technology. It is an RF based spying
robot attached with a wireless camera that reduced human
victim. Microcontroller is the main controller that decodes all
the instructions received from the transmitter unit. The
commands to control the motion of the robot is transmitted
through the Bluetooth module and the microcontroller decodes
to manage the movement of the robot. The wireless camera
transmits the real time videos to the android application device
at the receiving end. The wireless camera is mounted on the
robot. In [3] the Authors have developed a Bluetooth controlled
robot. An 8051 series microcontroller is used as control device
in the system. The robot design is controlled by the mobile
application. The project’s purpose is scheming a robot that can
be managed using Android cellular phone. The robot is capable
of programming again and can be used for multiple

SAHYADRI INTERNATIONAL JOURNAL OF RESEARCH, VOL 4, ISSUE 1, 2018
44
applications. In the research paper [4], proposed by Tushar
Maheshwari Upendra Kumar presents operation of wireless spy
robots which controls large operating ranges. The camera is
based on WiFi technology which helps in appearing of
suurounding area live through mobile, laptop, etc.. In paper [5],
the Authors have designed a Bluetooth controlled automated
vehicle. The controller utilized here is an 8051 arrangement
microcontroller used to control the framework. The utilization
of Android cellular phone to control a mechanical vehicle is the
fundamental reason behind outlining this undertaking.
Bluetooth Module is implemented in the android device to
operate the wireless Robot. An advanced mobile phone with
Android application is utilized to control the mechanical
vehicle.
2. METHODOLGY
2.1 Block Diagram
Figure 1: Block diagram of proposed system
As shown in Fig. 1, robot is controlled using android based
gadget. The robot moves according to the commands given by
Android application i.e. front, back, left and right. The system
uses four DC motors which act as the wheels for the robot. The
DC motors are controlled using motor driver which is interfaced
with Microcontroller.
A supply of 12V DC is given to the regulator and the 5V DC
output is applied to each of the modules. The system uses a
Proximity sensor to determine the bomb underneath which are
interfaced to the Microcontroller and message will be
transferred to Android Application Device through Bluetooth
Module. The robot is controlled manually.
A Wi-Fi camera is used in this project. The advantage of
digital Wi-Fi camera systems is that they do not require a line-
of-sight connection between the transmitter and the receiver.
Bluetooth device is used to interface with PC, mobile phone.
It acts as a gateway between android device and the
microcontroller. The microcontroller used here is PIC16F877a.
The system uses HC-05 Bluetooth module. It operates at a
frequency of 2.5GHz. It is applied with a 3.3V DC supply. The
working temperature is from 20oC to75oC.
Android is user friendly and works effectively with all
applications. Android application can be used to control the
movement of robotic vehicle. The system uses a Sealed Lead-
acid rechargeable battery AP12-1.3 with 12V/1.3Ah supply, the
battery is mounted on the robotic chassis and the power is
supplied to the whole system through Microcontroller Board.
Since the battery is rechargeable, a Switch mode power adapter
with input voltage range AC100-240V - 50/60Hz 0.3A and
output voltage DC12V - 1A is used to recharge the battery.
2.2 Robotic Motion Control
The robot moves according to the commands given by Android
application i.e. front, back, left and right. The system uses four
DC motors which act as the wheels for the robot.L293D is a
motor driver circuit which is used to steer the DC motor in the
requisite direction. It has 16 pins which controls two set of DC
motor. This single IC can control two DC motors. It works on
the notion of H-bridge circuit which allows the voltage to flow
in both directions. It has four input pins. Input pins on left will
rotate the motor connected on the left side and input pins on
right rotate motor on the right side. Based on the inputs given
such as logic 0 or logic 1 to the input pins motors will rotate.
2.3 Data Transmission
Bluetooth module is used to interface robot with android device.
It acts as a gateway between android device and the
Microcontroller. The system uses HC-05 Bluetooth module.
HC-05 is a 6 pin module out of which only 4 pins are used to
interface with Microcontroller. The four pins include VCC
(Supply), GND (Ground), RXD (Receiver pin), and TXD
(Transmitter pin). The VCC is provided with 5V DC supply,
GND is grounded, RXD is connected to TX0 of Microcontroller
and TXD is connected to RX0 of the Microcontroller pins R6
and R7 are transmitter and receiver pins.
The receiver pin of Bluetooth is given to the transmitter pin
RC6, side transmitting pin of the Bluetooth is connected to the
receiver pin RC7, hence we establish a wireless network. The
transmitting pin of the Bluetooth is connected to the receiving
pin RC7 of the PIC.
3. FLOW CONTROL OF THE ROBOT
As shown in the fig.2, the motion control of the robot is shown.
Based on the commands received by the android application
device the motion of the robot is controlled. When L, R, F, B
are received the robot is moved left, right, front and backward
direction respectively. When S is received the robot is stopped.
In the figure.2, the motion control of the robot is shown.
Based on the commands received by the android application
device the motion of the robot is controlled. When L, R, F, B
are received the robot is moved left, right, front and backward
direction respectively. When S is received the robot is stopped.

SAHYADRI INTERNATIONAL JOURNAL OF RESEARCH, VOL 4, ISSUE 1, 2018
45
Figure 2: Flow of control of the robot.
Figure 3 shows the proximity sensor sensing the bomb
underneath. Whenever a bomb is detected proximity sensor
provides a logic high signal to the RC0 pin of the PIC16F877a
and the controller sends message to the android application
device “Bomb is detected” through the Bluetooth module.
4. CONCLUSION
The primary need of our project would be accuracy. The robot
is able to move in required directions with help of the
commands given by the android application. The things
happening currently in the area can be clearly and accurately
seen to locate the spy robot as to where it is situated. The robot
is able to detect the bombs that are placed underneath in the war
field and notify the detection of bombs. By keeping the circuit
uncomplicated and effortless many users will be able to use it
without difficulty.
REFERENCES
[1] Darshan Dayma, Bhushan Chavan, Suraj Kale, Assoc.
Prof. B. S. Tarle “SMART SPY ROBOT” International
Journal of Science, Technology and Management, (IJSTM)
Volume 4, Issue 02, February-2015.
[2] Ankit Yadav, Anshul Tiwari, Divya Sharma
RatneshSrivatsava, Sachin Kumar, O.P. Yadav “SMART
SPY ROBOT” International Journal of Science,
Engineering and Technology Research (IJSETR) volume
5, Issue 4, April-2016..
[3] Arvind Kumar Saini,Garima Sharma, Kamal
KishorChoure, “BluBO: Bluetooth Controlled Robot”
International Journal of Science and Research (IJSR), April
2015
[4] Rowjatul Zannat Esita, Tanwy Barua, Arzon Barua, Anik
Mahammod Dip “Bluetooth Based Android Controlled
Robot” American Journal of Engineering Research
(AJER), Volume 5, Issue 3, 2016.
[5] Rahul Kumar, Ushapreethi P, Pravin R. Kubade,
Hrushikesh B. Kulkarni “Android Phone Controlled
Bluetooth Robot” IRJET Volume 3, Issue 04, April- 2016.
Figure 3. Flowchart of bomb detection

SAHYADRI INTERNATIONAL JOURNAL OF RESEARCH, VOL 4, ISSUE 1, 2018
ISSN: 2456-186X, Published Online June, 2018 (http://www.sijr.in/)
46
Adnan Aslam Hasan Haji Shaikh*, Prajwal M, Leandra Sonal, Kanishka Madan Gaonkar, Athar Ali
Department of Civil Engineering, Sahyadri College of Engineering & Management, Mangaluru-575007
*Email:[email protected]
ABSTRACT
Precision farming is a field which is gaining more importance every passing day. It involves finding out the accurate top
soil constituents for farming application. The application of chemical and natural farming additives with a main purpose
of increasing and preserving the yield, but it will be prone to spatial variability across the farm. To obtain accurate values
sampling all across the field is not economic. Hence the need for interpolation to obtain accurate values. In this study we
have used four interpolation techniques to study the variation of Soil organic carbon (SOC) in a 3 acre farm. They were
namely Inverse Weighted Distance (IDW), Spline, Ordinary Krigging and Natural Neighbour. A total of 35 samples were
taken across the farm, 30% of this data set was used for validation and 70% of the data set was used for calibration. The
results obtained showed that IDW method had a deviation of less than 10% compared to the other methods. Hence out of
the four techniques IDW is most suited for SOC variability for precision agriculture applications.
Keywords: Soil organic carbon, Precision farming, Inverse weighted distance, Spatial variation, Interpolation, farming,
Ordinary krigging, Natural Neighbour, Spline.
1. INTRODUCTION
Soil is the basic element of all living beings on earth. The top
loose layer of the earth's surface, consisting of minerals and
rock particles blended with decomposed organic matter
(humus), and capable of holding water. Soils regulate
ecosystem services [1] and assume a noteworthy role in the
global system managing major biogeochemical cycles and
energy.
Soil is a standout amongst the most important of agricultural
production [2] and has dominant effect on crop yields and
quality [3]. In-field soil data has been utilized for quite a long
time by agriculturists to settle on choices concerning crop
management practices.
Topsoil (0 to 20cm) has the highest concentrations of
nutrients and microorganisms [4] and is the framework for most
of the earth’s soil biological activity. Soil properties are
neither static nor homogenous with space and time. Topsoil
has its major application in agriculture as plants obtain most of
the nutrients from it. Information on soil properties at finer
resolution are essential in many fields, more so in precision
agriculture [5].
When it comes to precision agriculture accurate and precise
values of the top soil constituents is a necessity. One such
important constituent is soil organic carbon (SOC). In the past
different geostatistical approaches have been used to estimate
the spatial distribution of SOC [6]. Sampling all across the field
is not economical and it a time intensive task. Geostatistics is
an efficient method [7] for the study of spatial allocation of
SOC content and its irregularities and reducing the variance of
assessment error and execution costs.
In this paper an attempt has been made to assess the
interpolation techniques to predict the variability of soil
organic carbon across a farm plot. The farm had lateritic soil.
The interpolation techniques used are Inverse Weighted
Distance (IDW) [8], Spline [9], Ordinary Krigging [10] and
Natural Neighbour [11]. The data set has been divided into
calibration dataset (70%) and validation dataset (30%) and the
accuracy of the results are compared.
2. AREA OF STUDY
The area chosen for this study is Saripalla situated in
Mangalore, Karnataka, India. The site is 3 acres in area. It is
an open flat surface that’s consisting of lateritic soil. There
used to be a rubber plantation before but now it is barren.
Sites for sampling were chosen in a gridded pattern of 25 m
X 25 m for each cell.
Figure 1: Study area
Accessing Spatial Variability of SOC Content
Using GIS Based Interpolation Techniques

SAHYADRI INTERNATIONAL JOURNAL OF RESEARCH, VOL 4, ISSUE 1, 2018
47
3. METHODOLOGY
Figure 2: Methodology
The soil sample was collected from 35 sample sites. These
sites were initially marked on Google earth and with the help
of its coordinates were located. The sampling [12] was done by
digging into the ground up to a depth of 15 cm using pickaxe
and shovel. The sample was collected and stored in zip lock
bags to avoid contamination.
Figure 3: Sample collection
Soil organic carbon was tested using the standard muffle
furnace test [13]. The parameters used were 500 degree Celsius
for 30 minutes of heating. The carbon content for each sample
was noted.
Figure 4: SOC determination
The samples were calibrated into two data sets namely
calibration and validation data set. 30 samples were used for
calibration and 5 samples were used for validation for the
purpose of ground trothing.
The technique for estimation of unknown value between two
known value and deducing missing values from a set of known
values is called interpolation. Interpolation comes in use where
the values around the missing values are known and its
seasonality, repetition and long-term cycle is known.
On the calibration data set four types of interpolation
techniques are used namely Inverse distance weighed, Spline,
Natural neighbour and ordinary krigging.
Inverse distance weighted assumes that the values around a
specific unknown value is more likely to be similar than that
are further apart. That is the nearest values around unknown
value have most influence on the unknown value.
Spline keeps low regards for the curvature of the surface
and uses a mathematical equation [14] to assess the unknown
value. Basically the surface is assumed to be a smooth one
where the surface moves exactly over the input points.
The following equation (1) is used in for spline interpolation:
(1) Where: j= 1, 2…..N.
N is the number of points.
λj are coefficient found by the solution of the system of a
linear equations.
rj is the distance from the point (x,y) to the jth point.
T(x,y) and R(r) are defined differently, depending on the
selected option.
Ordinary Kriging is an advanced geostatistical method that
produces an estimated surface from a scattered set of points
with z-values [15]. It assumes that the distance or direction
between data points show a spatial correlation that can be used
to understand variation in the surface. The Kriging tool assigns

SAHYADRI INTERNATIONAL JOURNAL OF RESEARCH, VOL 4, ISSUE 1, 2018
48
a mathematical function to a known number of points, or all
points within a known radius, to find the output value for each
location.
Kriging is similar to IDW in a way that it weights the
surrounding known values to predict values of unknown
location. The following equation (2) is used in for krigings
interpolation:
(2)
where:
Z(si) = the measured value at the ith location
λi = an unknown weight for the measured value at the ith
location8
s0 = the prediction location
N = the number of measured values
The technique used by Natural neighbour interpolation tool
searches the nearest subset of input values to a query point and
applies weights to them based on proportionate areas to
interpolate a value[16]. This method is also known as Sibson or
“area-stealing” interpolation. Its base identity is that its local,
using only a subset of samples that surround a query point, and
interpolated heights are guaranteed to be within the range of
the values used. It does not regard trends and will not produce
peaks, ridges, pits or valleys that are not already represented
by the input values. The surface passes through the input
values and is smooth throughout except at points of the input
value.
4. RESULTS
The results obtained for the interpolation techniques are
depicted in the figures below. In IDW method the power used
was 2. In ordinary krigging spherical semivariogram was used.
Figure 5: IDW output
Figure 6: Spline output
Figure 7: Krigging output
Figure 8: Natural neighbor

SAHYADRI INTERNATIONAL JOURNAL OF RESEARCH, VOL 4, ISSUE 1, 2018
49
The results were tabulated using the validation data set which
was not used for calibrating the results. The average error was
found using the difference between the original and
interpolated SOC content. Root mean square deviation
(RMSD) represents the sample standard deviation of the
differences between predicted values and observed values. The
RMSD serves to aggregate the magnitudes of the errors in
predictions for various times into a single measure of
predictive power. RMSD is a measure of accuracy, to compare
forecasting errors of different models for a particular data and
not between datasets, as it is scale-dependent [17].
(3)
The Error and RMSD is tabulated in the table below
along with the percentage change with the actual value.
Interpolation
method
Error
(gms) RMSD
(gms) Percentage
change (%)
IDW
0.028 0.1392
9.87
Spline
0.028 0.1392
11.22
Krigging
0.036 0.1392
10.87
Natural
neighbour 0.028 0.1443
11.18
5. CONCLUSION
From the results, we can infer that there is very little change in
interpolation techniques used. IDW method gives the best
results in terms of RSMD and percentage change. Other than
IDW all the other methods give a percentage error greater than
10%. For a change of distance of 25 meters the interpolation
deviation of greater than 10% may not be acceptable for
precision farming applications.
This is an indication of interpolation taking only SOC
content into consideration. More studies have to be conducted
to assess the accuracy of interpolation for different top soil
constituents.
REFERENCES
[1] Dominati, Estelle, Murray Patterson, and Alec Mackay. "A
framework for classifying and quantifying the natural capital and
ecosystem services of soils." Ecological Economics 69.9 (2010):
1858-1868.
[2] Matson, Pamela A., et al. "Agricultural intensification and
ecosystem properties." Science 277.5325 (1997): 504-509.
[3] Cassman, Kenneth G. "Ecological intensification of cereal
production systems: yield potential, soil quality, and precision
agriculture." Proceedings of the National Academy of
Sciences 96.11 (1999): 5952-5959.
[4] Li, Feng-Min, et al. "Dynamics of soil microbial biomass C and
soil fertility in cropland mulched with plastic film in a semiarid
agro-ecosystem." Soil Biology and Biochemistry 36.11 (2004):
1893-1902.
[5] McBratney, Alex, et al. "Future directions of precision
agriculture." Precision agriculture 6.1 (2005): 7-23.
[6] Bhunia, Gouri Sankar, Pravat Kumar Shit, and Ramkrishna
Maiti. "Comparison of GIS-based interpolation methods for
spatial distribution of soil organic carbon (SOC)." Journal of the
Saudi Society of Agricultural Sciences (2016).
[7] Goovaerts, Pierre. "Geostatistics in soil science: state-of-the-art
and perspectives." Geoderma 89.1-2 (1999): 1-45.
[8] Lu, George Y., and David W. Wong. "An adaptive inverse-
distance weighting spatial interpolation technique." Computers
& geosciences 34.9 (2008): 1044-1055.
[9] Wahba, Grace. Spline models for observational data. Vol. 59.
Siam, 1990.
[10] Bhat, Vishwanatha, et al. "Spatiotemporal Relationship Linking
Land Use/Land Cover with Groundwater Level." Groundwater.
Springer, Singapore, 2018. 41-54.
[11] Boissonnat, Jean-Daniel, and Frédéric Cazals. "Smooth surface
reconstruction via natural neighbour interpolation of distance
functions." Computational Geometry 22.1-3 (2002): 185-203.
[12] Tan, Kim H. Soil sampling, preparation, and analysis. CRC
press, 2005.
[13] Dean Jr, Walter E. "Determination of carbonate and organic
matter in calcareous sediments and sedimentary rocks by loss on
ignition: comparison with other methods." Journal of
Sedimentary Research 44.1 (1974).
[14] Hengl, Tomislav, and Ian S. Evans. "Mathematical and digital
models of the land surface." Developments in soil science 33
(2009): 31-63.
[15] Childs,Colin. "Interpolating surfaces in ArcGIS spatial
analyst." ArcUser, July-September 3235 (2004): 569.
[16] Sibson, Robin. "A brief description of natural neighbour
interpolation." Interpreting multivariate data (1981).
[17] Hyndman, Rob J.; Koehler, Anne B. (2006). "Another look at
measures of forecast accuracy". International Journal of
Forecasting, 22(4):679688 doi:10.1016/j.ijforecast.2006.03.001

SAHYADRI INTERNATIONAL JOURNAL OF RESEARCH, VOL 4, ISSUE 1, 2018
ISSN: 2456-186X, Published Online June, 2018 (http://www.sijr.in/)
50
Study on Strength of Hybrid Concrete Beam
Sachin K S, Vinayak Patgar, C S Darshan, Murigeppa, Manohar K*
Department of Civil Engineering, Sahyadri College of Engineering & Management, Mangaluru-575007
*Email:[email protected]
ABSTRACT
The construction industry place a very important role in the economic development of a country. The main intention of
these materials is to improve the quality of the materials used in the concrete. Hybrid concrete beam is one of the method
of improving the quality of the materials. This hybrid beam consist beam consist of a special reinforcement called arch
reinforcement other than concrete and main reinforcement.
Keywords: Arch Reinforcement, Flexural strength, Hybrid Beam, Partial Beam.
1. INTRODUCTION
The basic of all the construction work depends up on a term
called Concrete. Concrete is the most consumed material in the
world. It is made up of three basic ingredients that is cement,
aggregates and water. And these materials get in to a liquid
which can be turned into almost any shape and later on gets in
to a hard rock. The materials used for concrete are easily
available. It does not include any complicated system. The
concrete structures can be formed in to any shapes, size and
height. Depending up on the mixture of cement, aggregate and
water we can get different grades of concrete mixtures.
Concrete is strong in compression and weak in tension, in
order to overcome this we are providing a material which can
withstand the tensile forces called reinforcements. Steel is
mainly used as the reinforcing material. With the use of steel
in concrete we can obtain a material which is strong in
compression and tension
1.1 Partial Beam
Beam is a horizontal structural member which takes the load
from the super structure right angle to its axis. Beams while
bending develop tension and compression zone which are
divide by the neutral axis. As we know that concrete is good in
compression and steel reinforcement is good in tension. Here
we are going to reduce the amount of cement content in the
tension zone that is we are going for two grades of concrete. A
high grade concrete in the compression zone that is above
neutral axis and low grade of concrete in the tension zone that
is below the neutral axis. These types of beams are called as
partial beams. The definition of partial beams says that using
two different grade of concrete or creating a hollow or vacuum
section in the tension zone of the beam, having flexural and
shear strength similar to homogenous solid beam
1.2 Arch Reinforcement
Flexural test is done in order to find the tensile strength of the
concrete. And it is a measure of calculating the bending of
beams or slabs. As load is applied on the beam the beam start
bending. In order to resist the bending nature of the beams we
are introducing a special type of reinforcement called arch
reinforcement. This special reinforcement tries to reduce the
bending nature of beams and helps to carry more loads due to
bending forces. This arch reinforcement can be applied in the
longer span of the beam where the bending action is more
visible. In this project the arch reinforcement is made with the
help of PVC pipe with an infill of cement mortar in which the
pipe is made to bend in to the shape of an arch.
2. METHODOLOGY
In this project we are casting 13 beams specimens of 6 varities.
The beam mould is of size 150mm *150mm *700mm. Table
2.1 represents the different type of beams and the type of
concrete grades used in the work.
Table 1: Types of beam with different grades of concrete
Sl.No. Type of Beam Grade of
Concrete
No. of
specimens
1 Conventional M25 3
2 Partial beam M25 & M15 3
3 Conventional with single arch M25 3
4 Partial beam with single arch M25 & M15 3
5 Conventional with double arch M25 3
6 Partial beam with double arch M25 & M15 3
2.1 Bar Bending
The reinforcement are made with 10mm and 8mm dia. Bars,
10mm dia. bars as main reinforcement & 8mm dia. bars as

SAHYADRI INTERNATIONAL JOURNAL OF RESEARCH, VOL 4, ISSUE 1, 2018
51
vertical reinforcement (Shear reinforcement @ 100 mm c/c).
There are 2 bars at the top (Anchor bar) and 3 main bars at the
bottom (Tension reinforcement).
2.2 Materials
The OPC cement is used of 53 grade with a fine aggregate
confirming to IS standards, and coarse aggregate is used in
different percentage i.e., 60% of 10mm down size and 40% of
20mm down.
2.3 Placing of Reinforcement and Testing
The reinforcement is provided with 20 mm cover from all the
sides. And clover Blocks are used for the providing cover. The
arch reinforcement is made with a PVC pipe which has got an
infill of 1:3 cement mortars and it is bent in to the shape of an
arch. The arch reinforcement is supported with help of hook
of the main reinforcement which is present at the bottom.
Figure 1: Arch action in placing of reinforcement
After placing the reinforcement inside the mould the concrete
is filled inside the mould. After placing the concrete inside the
mould tamping is done with the help of tamping rod. Tamping
is done in order to remove the air voids inside. The specimen
is cured for 28 days. The beam specimen is tested for the
flexural strength. Two point loading is applied for the
specimens. The point of application of load is at l/3 distance
from the ends. 50mm from the end is given for the support.
Marking on the specimen is done as per the above
requirements. Beams specimen is kept on the loading frame.
Reading is noted with the help of proving ring.
Figure 2: Two point loading
Figure 3: Test Setup
Figure 4: Cracked beam
2.4 Proving Ring Reading Calculation
Proving ring consists of two scales one is main scale reading
and the other one is small scale reading. In the main scale,
there are 25 divisions and each division value is 0.2 mm. In the
small scale reading there are 100 divisions and the value of
each division is 0.002mm. When the load is applied if the
needle of the small scale rotates one cycle the deflection value
is taken as 0.2 mm which can be seen in the main scale. Least
count of the small scale: 1 division = 0.002mm by using this
values the deflection value of each specimens can be
calculated. For each crack the divisions on the proving ring
has to be noted down and the corresponding deflection has to
be calculated. To calculate load, if the needle covers 103
division in the small scale then the load value is taken to be 20
kN. Corresponding values has to be noted down.
Figure 5: Variation of strength for different type of beams

SAHYADRI INTERNATIONAL JOURNAL OF RESEARCH, VOL 4, ISSUE 1, 2018
52
Figure 6: Deflection of conventional beam with 20mm
down aggregate
Figure 7: Deflection variation of partial beam
3. CONCLUSION
According to the test results, the conventional beam with
single arch and the partial beam with single arch takes load
which is almost near to that of the conventional beam. The
load at which cracks developed in the conventional and partial
beams having single arch reinforcements is almost near to that
of conventional beam. Since arch reinforcement helps to resist
the deflection load, these arch reinforced beams mainly fails
due to shear failure. By increasing the number of stirrups at the
supports and minimizing at the centre the shear failure can be
reduced and the beam will be capable to resist more loads.
REFERENCES
[1] M.A. Abeol Seoud and J.J. Myers, “Implementation of
Hybrid Composite Beam Bridges In Missouri, USA.” 11-
13 December 2013.
[2] John R. Hillman, “Product Application of A Hybrid
Composite Beam System”, The Idea Program
Transportation Research Board, National Research
Council, March 17, 2008.
[3] John R. Hillman, “Hybrid Composite Beam – Design and
Maintenance Manual”, The Missouri Department of
Transportation, August 27, 2012.
[4] Fathoni Usman, “Flexural Behavior of Hybrid Concrete
Beam”, The 3rd National Graduate Conference,
University Tenaga National, Putrajaya Campus, 8-9 April
2015.
[5] Prof. Pravin B Shindhe, Prof. Sangita V Pawar, Prof. V P
Kulkarni, “flexural behavior of hybrid fiber reinforced
concrete deep beam and effect of steel and polypropylene
fibre on Mechanical properties of concrete”, IJARSC,
Vol. No.4, Issue No.02, Feb.2015

Guidelines for Submission
• Authors are requested to provide full details for correspondence: postal
address, phone numbers and email address. (The email address of
corresponding authors will be published along with the article).
• Authorsarerequestedtopreparetheirsoftcopyversionintextformatsand not in
PDF version.
• Authorsarerequestedtofollowthemanuscripttemplatewhilepreparingthe
manuscript.
SIJR is devoted to the publication of original research work. The journal also
accepts review papers and scientific articles. SIJR welcomes the submission of
manuscripts that meet the journal standard which includes novelty, significance
and excellence. Every volume of the journal will have two issue in a year. All
articles published in the SIJR are peer-reviewed.
Contact for any query
or
Information on
SAHYADRI International Journal of Research
Email: [email protected]
Web: www.sijr.in
Sahyadri Journal of ResearchInternational
SAHYADRI International Journal of Research
PublisherManjunath Bhandary - President
Bhandary Foundation, Sahyadri Campus, Adyar, Mangaluru - 575 007
PrintersPrakash Offset Printers, 164, Industrial Area, Baikampady, Mangaluru - 575 011
| Vol 4 | Issue 1 | June 2018

Sahyadri Campus, Adyar, Mangaluru - 575 007
COLLEGE OF ENGINEERING & MANAGEMENTSAHYADRI
(Affiliated to VTU, Belagavi and Approved by AICTE, New Delhi)
Empowering Young Minds
+ 91-824-2277222 | [email protected] | www.sijr.in | www.sahyadri.edu.inSAHYADRI Journal of Research | December 2015 | 3
Sahyadri College of Engineering & Management is in existence since a decade, being recognized by AICTE,
Government of India, affiliated to VTU, Government of Karnataka, NAAC accredited with “A” Grade and
certified by ISO.
The Sahyadri college has Academic MoU with various National, International Universities and also has
collaborations with leading Corporate & Industries that have given a tremendous boost to the students for
innovation, incubation, internships, research, projects and hands on experience.
Sahyadri encourages students to “Walk-in with an Idea and Walk-out with the Product”. The College aims at
imparting Project based learning, thus enabling students to understand the process of learning concepts.
Students right from day one are offered an opportunity to take part in the events held at IIT’s, NIT’s and SAE
events, thus improving their analytical skills, connectivity and gain exposure across the globe. The total
student and staff strength at campus is nearly 4000.


![088001451031 PUSHPALATHA[1].S](https://static.fdocuments.us/doc/165x107/546dd991b4af9f09738b4c4b/088001451031-pushpalatha1s.jpg)