
Journal of Volcanology and Geothermal Researchweb.pdx.edu/~rmaxwell/papers/Munoz_etal_2015.pdf ·...
15
Dynamics within geyser conduits, and sensitivity to environmental perturbations: Insights from a periodic geyser in the El Tatio geyser field, Atacama Desert, Chile Carolina Munoz-Saez a, ⁎, Michael Manga a , Shaul Hurwitz b , Maxwell L. Rudolph c , Atsuko Namiki d , Chi-Yuen Wang a a University of California, Berkeley, CA, USA b US Geological Survey, Menlo Park, CA, USA c Portland State University, Portland, OR, USA d Hiroshima University, Hiroshima, Japan abstract article info Article history: Received 28 September 2014 Accepted 15 January 2015 Available online 24 January 2015 Keywords: Geysers Eruptions Geothermal systems Bubble trap Conduit Choked flow Despite more than 200 years of scientific study, the internal dynamics of geyser systems remain poorly charac- terized. As a consequence, there remain fundamental questions about what processes initiate and terminate eruptions, and where eruptions begin. Over a one-week period in October 2012, we collected down-hole mea- surements of pressure and temperature in the conduit of an exceptionally regular geyser (132 s/cycle) located in the Chilean desert. We identified four stages in the geyser cycle: (1) recharge of water into the conduit after an eruption, driven by the pressure difference between water in the conduit and in a deeper reservoir; (2) a pre-eruptive stage that follows the recharge and is dominated by addition of steam from below; (3) the eruption, which occurs by rapid boiling of a large mass of water at the top of the water column, and decompression that propagates boiling conditions downward; and (4) a relaxation stage during which pressure and temperature de- crease until conditions preceding the recharge stage are restored. Eruptions are triggered by the episodic addition of steam coming from depth, suggesting that the dynamics of the eruptions are dominated by geometrical and thermodynamic complexities in the conduit and reservoir. Further evidence favoring the dominance of internal processes in controlling periodicity is also provided by the absence of responses of the geyser to environmental perturbations (air pressure, temperature and probably also Earth tides). © 2015 Elsevier B.V. All rights reserved. 1. Introduction Geysers are springs that produce discrete eruptions of steam, liquid water, and non-condensable gases. Their eruptions are smaller and typ- ically more frequent than volcanoes and hydrothermal eruptions, pro- viding a natural laboratory to study eruptive processes (Kieffer, 1984). Geysers are uncommon; less than 1000 have been described world- wide, and this number is decreasing due to geothermal energy develop- ment (Bryan, 1995). Special conditions are needed for their formation: a supply of water, a source of heat, and a particular system of fractures and/or porous rocks to permit episodic discharge (e.g., White, 1967; Fournier, 1969; Kieffer, 1989; Ingebritsen and Rojstaczer, 1993, 1996; Kedar et al., 1998; Kiryukhin et al., 2012; Belousov et al., 2013; Karlstrom et al., 2013; Shteinberg et al., 2013; Vandemeulebrouck et al., 2013; Namiki et al., 2014; Vandemeulebrouck et al., 2014). There are several open questions about processes and conditions be- fore, during and after the eruption: how is heat transported to and within the geyser system? Do eruptions begin in a conduit as observed in some laboratory experiments (Adelstein et al., 2014)?, or in a deeper reservoir as proposed from limited observations in natural systems (Belousov et al., 2013; Vandemeulebrouck et al., 2013) and experiments (Steinberg et al., 1982)? What is the geometry of subsurface fractures and how do they affect the eruption process? Previous studies of natural geysers provide at least partial answers to these questions. Some obser- vations indicate that prior to an eruption, temperature in the water col- umn is below boiling, and the boiling is caused by ascent-driven decompression (e.g., Bunsen, 1847, Fukutomi, 1942a,b; Kieffer, 1984). Conversely, some studies in Yellowstone National Park (USA) suggested that intermittent injection of superheated water leads to eruption (Rinehart, 1972, 1980), assuming hydrostatic conditions and that the depth of the measurements (23 m) was accurate. White (1967) pro- posed that eruptions begin with the discharge of water below the boil- ing temperature (T boil ), progress to a liquid-dominated fountain that becomes steam-rich, and end with a quiescent phase. Seismic observa- tions suggest that steam bubbles are crucial in transferring heat to water in the conduit and in driving the eruption (Kieffer, 1984, 1989). Under- ground cavities at some geysers may create a “bubble trap” that allows Journal of Volcanology and Geothermal Research 292 (2015) 41–55 ⁎ Corresponding author. E-mail address: [email protected] (C. Munoz-Saez). http://dx.doi.org/10.1016/j.jvolgeores.2015.01.002 0377-0273/© 2015 Elsevier B.V. All rights reserved. Contents lists available at ScienceDirect Journal of Volcanology and Geothermal Research journal homepage: www.elsevier.com/locate/jvolgeores
Transcript of Journal of Volcanology and Geothermal Researchweb.pdx.edu/~rmaxwell/papers/Munoz_etal_2015.pdf ·...

Journal of Volcanology and Geothermal Research 292 (2015) 41–55
Contents lists available at ScienceDirect
Journal of Volcanology and Geothermal Research
j ourna l homepage: www.e lsev ie r .com/ locate / jvo lgeores
Dynamics within geyser conduits, and sensitivity to environmentalperturbations: Insights from a periodic geyser in the El Tatio geyser field,Atacama Desert, Chile
Carolina Munoz-Saez a,⁎, Michael Manga a, Shaul Hurwitz b, Maxwell L. Rudolph c,Atsuko Namiki d, Chi-Yuen Wang a
a University of California, Berkeley, CA, USAb US Geological Survey, Menlo Park, CA, USAc Portland State University, Portland, OR, USAd Hiroshima University, Hiroshima, Japan
⁎ Corresponding author.E-mail address: [email protected] (C. Munoz
http://dx.doi.org/10.1016/j.jvolgeores.2015.01.0020377-0273/© 2015 Elsevier B.V. All rights reserved.
a b s t r a c t
a r t i c l e i n f oArticle history:Received 28 September 2014Accepted 15 January 2015Available online 24 January 2015
Keywords:GeysersEruptionsGeothermal systemsBubble trapConduitChoked flow
Despite more than 200 years of scientific study, the internal dynamics of geyser systems remain poorly charac-terized. As a consequence, there remain fundamental questions about what processes initiate and terminateeruptions, and where eruptions begin. Over a one-week period in October 2012, we collected down-hole mea-surements of pressure and temperature in the conduit of an exceptionally regular geyser (132 s/cycle) locatedin the Chilean desert. We identified four stages in the geyser cycle: (1) recharge of water into the conduit afteran eruption, driven by the pressure difference between water in the conduit and in a deeper reservoir; (2) apre-eruptive stage that follows the recharge and is dominated by addition of steam from below; (3) the eruption,which occurs by rapid boiling of a large mass of water at the top of the water column, and decompression thatpropagates boiling conditions downward; and (4) a relaxation stage duringwhich pressure and temperature de-crease until conditions preceding the recharge stage are restored. Eruptions are triggered by the episodic additionof steam coming from depth, suggesting that the dynamics of the eruptions are dominated by geometrical andthermodynamic complexities in the conduit and reservoir. Further evidence favoring the dominance of internalprocesses in controlling periodicity is also provided by the absence of responses of the geyser to environmentalperturbations (air pressure, temperature and probably also Earth tides).
© 2015 Elsevier B.V. All rights reserved.
1. Introduction
Geysers are springs that produce discrete eruptions of steam, liquidwater, and non-condensable gases. Their eruptions are smaller and typ-ically more frequent than volcanoes and hydrothermal eruptions, pro-viding a natural laboratory to study eruptive processes (Kieffer, 1984).Geysers are uncommon; less than 1000 have been described world-wide, and this number is decreasing due to geothermal energy develop-ment (Bryan, 1995). Special conditions are needed for their formation: asupply of water, a source of heat, and a particular system of fracturesand/or porous rocks to permit episodic discharge (e.g., White, 1967;Fournier, 1969; Kieffer, 1989; Ingebritsen and Rojstaczer, 1993, 1996;Kedar et al., 1998; Kiryukhin et al., 2012; Belousov et al., 2013;Karlstrom et al., 2013; Shteinberg et al., 2013; Vandemeulebroucket al., 2013; Namiki et al., 2014; Vandemeulebrouck et al., 2014).
There are several open questions about processes and conditions be-fore, during and after the eruption: how is heat transported to and
-Saez).
within the geyser system? Do eruptions begin in a conduit as observedin some laboratory experiments (Adelstein et al., 2014)?, or in a deeperreservoir as proposed from limited observations in natural systems(Belousov et al., 2013; Vandemeulebrouck et al., 2013) and experiments(Steinberg et al., 1982)? What is the geometry of subsurface fracturesand howdo they affect the eruption process? Previous studies of naturalgeysers provide at least partial answers to these questions. Some obser-vations indicate that prior to an eruption, temperature in the water col-umn is below boiling, and the boiling is caused by ascent-drivendecompression (e.g., Bunsen, 1847, Fukutomi, 1942a,b; Kieffer, 1984).Conversely, some studies in YellowstoneNational Park (USA) suggestedthat intermittent injection of superheated water leads to eruption(Rinehart, 1972, 1980), assuming hydrostatic conditions and that thedepth of the measurements (23 m) was accurate. White (1967) pro-posed that eruptions begin with the discharge of water below the boil-ing temperature (Tboil), progress to a liquid-dominated fountain thatbecomes steam-rich, and end with a quiescent phase. Seismic observa-tions suggest that steambubbles are crucial in transferringheat towaterin the conduit and in driving the eruption (Kieffer, 1984, 1989). Under-ground cavities at some geysers may create a “bubble trap” that allows

42 C. Munoz-Saez et al. / Journal of Volcanology and Geothermal Research 292 (2015) 41–55
for the accumulation of a two-phase fluid (liquid + steam) in the sys-tem and the episodic release of this fluid (Mackenzie, 1811; Belousovet al., 2013; Vandemeulebrouck et al., 2013, 2014; Adelstein et al.,2014).
The response of geyser eruptions to external influences provides ad-ditional insight into how they work. Some geysers in Yellowstone re-spond to local and remote earthquakes (Marler, 1964; Rinehart andMurphy, 1969; Marler and White, 1975; Hutchinson, 1985; Husenet al., 2004a,b; Manga and Brodsky, 2006; Hurwitz et al., 2014). The re-sponses of geysers to non-seismic strain (Earth tides, barometricpressure), and weather (atmospheric temperature, rainfall and wind)vary between geysers (e.g., Rinehart, 1972; White and Marler, 1972;Rojstaczer et al., 2003; Hurwitz et al., 2008, 2012, 2014).
Most data used to study geysers comes from observations made atthe surface. Data on processes in the ground subsurface of geysers arelimited due to the complexity of taking measurements in situ. Activeand passive field experiments inside conduits have been performed atYellowstone National Park (Birch and Kennedy, 1972; Rinehart, 1972;Hutchinson et al., 1997; Kedar et al., 1998), and Kamchatka (Belousovet al., 2013; Shteinberg et al., 2013). Data from these experiments pro-vided a better understanding of conduit geometry (Hutchinson et al.,1997; Belousov et al., 2013), thermodynamic conditions (Hutchinsonet al., 1997; Kedar et al., 1998), and recharge processes (Shteinberget al., 2013).
We obtained continuous time series of pressure and temperature in-side the conduit of a geyser located in El Tatio, northern Chile (Fig. 1a).This geyser does not have an official name, so we nicknamed it “El Jefe”(Fig. 1b,c) and use this name throughout the manuscript. This geysercorresponds to feature T35 described in Glennon and Pfaff (2003) asone of the more significant and periodic geysers in the basin. One un-usual aspect of the El Tatio geysers is that they are located in themiddleof a very dry area, the Atacama Desert, in contrast to other geyser fieldsin the world (Yellowstone National Park, Kamchatka, Iceland, and NewZealand). The marked daily variation in air pressure and temperature,very high evaporation rates, and the limited meteoric water recharge,make El Tatio's geysers ideal for examining the sensitivity of multiphasesystems to external perturbations. A better understanding of “cause and
Fig. 1. El Tatio geyser field. (a)Map of South America showing the location of El Tatio in Northerwhite boxes show theUpper,Middle, and Lower geyser basins. In theupper basin, El JefeGeyserline indicates the normal fault that bounds the El Tatio half-graben. El Jefe geyser is located in
effect” relationship between external conditions and geyser cycle mayhelp to constrain and quantify the processes governing the eruptions.
Down-hole measurements of pressure and temperature from 3531eruptions of El Jefe geyser during one week in October 2012 providean extensive record of thermodynamic conditions during the entiregeyser cycle. We combined these data with measurements at the sur-face to: 1) examine the geyser's response to environmental forcing,and; 2) better understand the thermodynamics within the geyserconduit.
We begin with a description of the study area. Then, we describe thefield measurements and instruments, followed by a compilation of ob-servations and results. We end with an interpretation of the measure-ments and evaluate proposed hypotheses for the mechanisms leadingto geyser eruptions.
2. El Tatio geyser field
The El Tatio geyser field contains more than 80 active geysers(Glennon and Pfaff, 2003). It is located in northern Chile at an elevationof 4200 to 4300 m. The field is situated among Holocene andesitic stra-tovolcanoes, which provide the heat for the geothermal system, but nohistorical eruptionswere documented (Lahsen, 1976a,b). Thermalman-ifestations develop in the hanging wall of a NS trending half-graben(Fig. 1a), that is filled with ~1000 m of sub-horizontal ignimbrites,tuffs and lavas, and covered by Holocene alluvial and glacial deposits(Healy, 1974; Lahsen and Trujillo, 1975). According to the distributionof the geothermal features, the field is divided into a Lower, Middleand Upper Basin (Glennon and Pfaff, 2003) (Fig. 1a). Data from geother-mal wells suggest that the permeability is dominated by open fracturesin the ignimbrite layers (Cusicanqui et al., 1975, 1976). The maximumtemperature measured at the bottom of a 600 m deep geothermalwell was 253 °C (Lahsen and Trujillo, 1976).
At El Tatio in October 2012, we measured the average daily air tem-perature and pressure, which vary between approximately−5 °C to 20°C and 6.07× 10⁴ to 6.10 × 10⁴ Pa, respectively. The boiling temperature(Tboil) of purewater at these air pressures ranges between 86.2 and 86.4
n Chile. (b) Aerial photograph of El Tatio Geyser Field (GLCF: Earth Science Data Interface);(UTMcoordinates 601768E; 7530174S,WGS84, 19S) ismarkedby thewhite star. The bluethe hanging wall of that fault. (c) El Jefe geyser erupting.

Fig. 2. (a) Illustration of the conduit and the locations of the deployed temperature (T) andpressure (P) sensors. (b) Photograph of the conduit mouth, while the water level was de-creasing, showing the string of sensors; distance between the red marks is 30 cm.(c) Photograph of the conduit at the air–water interface (0.6 m) showing the irregularconduit, with constrictions and cracks that intersect the conduit.
43C. Munoz-Saez et al. / Journal of Volcanology and Geothermal Research 292 (2015) 41–55
°C (http://webbook.nist.gov/chemistry/fluid/). Evaporation is extreme-ly high, leading to rapid silica deposition (Nicolau et al., 2014).
Most water feeding the geyser field is recharged in the BolivianAltiplano, 15 to 20 km to the east (Cusicanqui et al., 1976; Lahsen,1976a,b; Giggenbach, 1978; Munoz and Hamza, 1993; Cortecci et al.,2005). Discharged thermal waters in the El Tatio area have a pH of 6to 8, and a conductivity of ~20 mS/cm. Most discharged waters havehigh concentrations of Cl− (6000 to 8000 mg/l), Na+ (N3500 mg/l),SiO2 (N220 mg/l), and As3− (N30 mg/l), and low SO4− (b50 mg/l),(e.g., Cusicanqui et al., 1976; Cortecci et al., 2005; Fernandez-Turielet al., 2005; Landrum et al., 2009; Tassi et al., 2010; Nicolau et al.,2014). Chemical and isotopic characteristics of thermal waters indicatecomplex mixing between magmatic, meteoric and hydrothermalsources (Cusicanqui et al., 1975; Giggenbach, 1978; Tassi et al., 2005,2010).
3. Instrumentation and measurements
Between October 20 and 27, 2012, we deployed a set of instrumentsat the surface and within the conduit of “El Jefe” geyser (Fig. 1 b,c). Tosynchronize instruments we used a GPS clock (GlobalSat BU-353 USBGPS Receiver) connected to the computer (HP mini 1000) that startedthe temperature data loggers.
At the surface, we recorded daytime eruptions simultaneously witha video camera (GoPro, ~30 frames per second) and an infrared videocamera (FLIR model A320, ~15 frames per second) for 50 min onOctober 20, 2012. To detect eruptions throughout the experiment, onethermocouple was placed at the geyser “mouth” (top of the geyser con-duit at the ground surface) and a second thermocouple was placed30 cm above the ground surface. Sensors were attached to a rigidsteel rod so that they would not move during eruptions. These pre-calibrated type K thermocouples recorded temperature every 1 s andwere in contact with water only during the eruption; between erup-tions they recorded air temperature. QuadTemp 2000 (MadgeTech)four channel temperature recorders were used to collect all tempera-ture measurements. Air pressure (Pair) was measured every 10 minwith a barometer (Setra Model 278).
To measure discharge of the erupted water we placed a rectangularwooden flume (length 65 cm, width 15 cm, height 10 cm) in the wideoutflow channel of the geyser. Water discharge was calculated bymea-suring the velocity offloating objects along theflumeusing a video cam-era (videos in electronic supplementary material), and water level inthe flume with a ruler. We made measurements during 6 consecutivegeyser cycles. Image analysis obtained from the videos was used to esti-mate the average discharge. Visual observations suggested that theflume captured only ~40–60% of erupted water, with the rest of thewater flowing from the pool at the surface back into the conduit. Wewere unable to better quantify the fate of erupted water.
A GoPro video camera in a custom-built waterproof and insulatedhousing was lowered into the upper part of the conduit (up to ~0.5 mdepth) for one complete geyser cycle to obtain visual images of the con-duit geometry and the level of the water during the cycle (videos inelectronic supplementary material). However, we observed only theupper conduit (depth up to ~0.7 to 0.8 m) because of the diminutionof conduit diameter at depth, and lack of light. We were able to intro-duce a rigid measuring stick 1.52 cm below the surface.
Inside the conduit, we deployed six pre-calibrated type K thermo-couples spaced 30 cm apart, between the conduit mouth and the bot-tom of the accessible conduit at a depth of 1.5 m (Fig. 2). Temperaturewas measured every 1 s. The error in the temperature measurementsspecified by the manufacturer is less than 1.1 °C (http://www.omega.com/thermocouples.html). We attached three absolute pressure trans-ducers mounted in watertight housings (Honeywell models19C050PA4K and 19C030PA4K) to a rigid metal rod and located themadjacent to the three deeper temperature sensors at 0.9 m, 1.2 m and1.5 m below the surface (Fig. 2). Measurements were collected at a
frequency of 100 Hz with a 24-bit Nanometrics Taurus logger. Thedata logger had an internal GPS clock to synchronize themeasurements.The transducers were calibrated in the laboratory under conditions re-sembling the down-hole pressures and temperatures at El Jefe. Wemeasured the ground deformation using a surface tiltmeter with a cali-brated resolution of 0.23 μrad/mV (Applied Geomechanics Inc. SurfaceMount Tiltmeter Model No. 701-2), at a frequency of 2 Hz from October20 to 22, 2012. The tiltmeter was located 5m to the East of the vent.Weremoved the long-term fluctuations with periods greater than the gey-ser cycle by using a high pass filter N2 × 10−3 Hz. We used data only atrestricted time periods (October 20th, 22:00–24:00, October 21st23:00–24:00, October 22nd 00:00–01:00, 04:00–05:00, UTC time) dur-ingwhich the amplitude of noisewas relatively small. Even during theseshort periods the signals were noisy, and we only used data when themaximum tilt within three eruptions was smaller than 10 μrad.
4. Data analysis and results
4.1. Pressure and temperature time series and the interval betweeneruptions (IBE)
The evolution of both pressure and temperature in the conduit isvery repeatable between eruptions (Fig. 3a). We calculated the intervalbetween eruptions (IBE) for every geyser cycle using pressure and tem-peraturemeasurements. To understand the temporal evolution of a sin-gle cycle, we compare time series and video observations of the fountainat the surface. We established seven reference points in time (Fig. 3a;green stars numbered 1 to 7), which identify different key stages inthe eruption.
(1) Point 1 indicates the beginning of the geyser cycle; it is coinci-dent with the minimum water pressure inside the conduit.After this point, pressure increases while the conduit refills.
(2) Point 2 shows the beginning of a rapid pressure increase, beforean eruption.
(3) Point 3 indicates a sudden increase in pressure and temperature.The beginning of fountaining occurs between points 3 and 4.

Fig. 3. a) Pressure and temperature time series for a subset offive eruption cycles, at a depth of 1.5m, onOctober 20th, 2012. Temperature (red) andpressure (blue) data are plotted on they-axis, while time is on the x-axis. The box highlights a single cycle. Stars labeled from 1 to 7 identify key stages in the cycle. The green line showsmean boiling temperature (Tboil ~86.4 °C)at average local atmospheric pressure. Lower panel shows histograms of the duration of stages of the eruption cycles: (b) eruption duration (points 3 to 7), (c) quiescent period (includingrelaxation stage, recharge, and pre-eruptive stage, points 7 to 3), and (d) interval between eruptions (IBE).
44 C. Munoz-Saez et al. / Journal of Volcanology and Geothermal Research 292 (2015) 41–55
(4) Point 4 indicates themaximumpressure in the conduit; after thispoint, pressure decreases at an approximately constant rate.
(5) Point 5 indicates the maximum water temperature; after thispoint, temperature decreases at an approximately constant rate.
(6) At Point 6 the rate of pressure decrease changes, and correspondsto the end of fountaining at the surface.
(7) Point 7 identifies an increase in the rate of pressure decrease, andthe end of the geyser cycle.
During the week of measurements, the mean interval between the3531 eruptions (IBE) was 132.2 ± 2.4 s (Fig. 3b–d): the eruption itself(points 3 to 7) lasted 51.9 ± 2.5 s, and the quiescent period (includingthe time from points 1 to 3 and from 7 to 1) was 80.3 ± 3.0 s. Uncer-tainties shown here and elsewhere are one standard deviation.
In the next sections, we summarize the observations, beginning atthe surface and moving progressively downward in the conduit.
4.2. Surface measurements
4.2.1. Geometry of the conduitThe sinter-lined conduit is located in the center of a small depres-
sion. The diameter of the conduit opening at the surface is 0.25 m to0.30 m (the geyser's “mouth” — Fig. 2b). The conduit remains approxi-mately cylindrical to a depth of 0.8 m, below which it narrows. Becausewe could insert a metal rod to depths of 1.52 m, at greater depth theconduit either has a constriction with a diameter less than ~2 cm, or itbends (Fig. 2). Fissures and other cavities of unknown dimensions inter-sect the conduit (Fig. 2c). Video observations inside the conduit suggestthat during the quiescent period the conduit is partially full of waterwith the minimum water level (air–water interface) at ~0.75 to0.80m of depth. The depth of air–water interface varied during the gey-ser cycle; it increases by ~0.25 m during the quiescent period.
4.2.2. Environmental perturbationsFig. 4 shows the power spectra for water pressure and temperature
inside the geyser, air temperature and pressure, and Earth tides. At
high frequencies we recognized a strong and sharp peak in water pres-sure and temperature, which corresponds to the IBE (Fig. 4a). At lowerfrequencies we identify the daily signals of barometric pressure, atmo-spheric temperature and tides. The phase and amplitude of solid Earthtides were calculated theoretically using the SPOTL software package(Agnew, 2012).
4.2.3. Temperature measurements above the ground surfaceWeoverlapped the time series of temperature above the ground sur-
face (for 2 eruptions) with the infrared video (FLIR) recording. We ob-served the eruptions of hot water at the surface for only ~35 s (Fig. 5,points 3 to 6), while at depth the water stays hot for longer (Fig. 5,points 3 to 7). The maximum water ejection height (2 m) observed inthe FLIR images coincided with the highest temperature measured bythe thermocouple at the ground surface (~83 °C), which remained al-most constant during the eruption, a few degrees below Tboil, due tocooling in the atmosphere (Fig. 5, points 4 to 5). At the end of the erup-tion (Fig. 5, between points 5 and 6), the temperature at the surface sen-sor decreased rapidly, recording air temperature.
4.2.4. Discharge measurementsFrom discharge measurements we obtained an average volumetric
flow rate of 1.9 × 10⁻³ m3/s during the eruption, corresponding to amass flow rate of 1.8 kg/s (using a hot water density of 970 kg/m3).Thewaterflowed through theflume for ~35 s (theduration of eruptionsat the surface). Themeasured discharge is a lower bound on the eruptedvolume sincewe estimated visually that 40–60% of thewater flows backinto the geyser rather than flowing through the flume. There are holesin the ground close to the vent that also drained water back to the con-duit (videos in electronic supplementary material). The volume mea-sured flowing through the flume is still probably representative of theaverage net mass discharge from the system. Given the calculatedmass flow rate, the net erupted mass is 66 kg. As this value is perhapsb60% of the total amount of water erupted, we expect that total masserupted is N110 kg per cycle. The mean net mass flow rate for a geysercycle is 0.83 kg/s (total erupted mass divided by IBE).

Fig. 4. (a) Power spectra of pressure (blue) and temperature (red) inside the geyser (1.5 m), and external periodic daily signals: air temperature (Tair), atmospheric pressure (Pair), andcalculated solid Earth tides (Tidal). Values on the y-axiswere normalized to have the same scale. One day period observed in thewater temperature (1.5m) data is an instrumental artifactand not a real signal. (b) Time series for 3.5 days showing daily variations of air temperature, atmospheric pressure and solid Earth tides. Values shown on y-axis were normalized((Value−mean(Value)) / Std(Value)). (c) and (d) are 2-D histograms: white dots show the data, and colors show number of dots plotting in that region (color bar). (c) IBE as a functionof air temperature, the coefficient of correlation is r2 = 0.01 (d) IBE as a function of atmospheric pressure, the coefficient of correlation is r2 = 0.02.
45C. Munoz-Saez et al. / Journal of Volcanology and Geothermal Research 292 (2015) 41–55
4.2.5. Ground deformationFig. 6a shows water pressure in the conduit, and Fig. 6b and c show
the corresponding tilt of the ground surface. We stacked tilt data of~130 eruptions and calculated the average shown by black curves inFig. 6b and c. Both tilt vectors indicate that eruptions produce measur-able ground deformation. Fig. 6b shows a small tilt increase during theresting time and a large increase during the eruption, followed by a de-crease at the end of eruption. Fig. 6c for the tangential direction showsan increase of the tilt during the quiescent time; but it does not showa signal at the beginning of the eruption. We cannot exclude the possi-bility that the temporal tilt pattern could be a result of water ponding inthe pool during the eruption rather than subsurface sources of pressurechanges.
4.3. Measurements in the conduit
Because the temperature and pressure waveforms of all the erup-tions are very similar (Figs. 2 and 3), we stacked the waveforms of all3531 eruptions and calculated the average value of temperature andpressure throughout an “average” eruption (Figs. 7 and 8).
We define the upper conduit as the part of the conduit withoutwater during quiescent period, from the surface to the air–water inter-face right before an eruption (~0.6 m from surface). Once water at theair–water interface reaches Tboil (Fig. 7c, points 3 to 4) the eruptionstarts, and boiling water moves rapidly upward through the conduit,reaching the upper sensors in the conduit (Fig. 7ab, points 3 to 4), andthe surface (Fig. 5, points 3 to 4). After the ~35 second duration of theeruption (Fig. 7ab points 3 to 5), temperature decreases continuouslyas the water level decreases.
The temperature at the top of the water column remains constant atTboil for ~45 s (Fig. 7c, points 3 to 7). Subsequently, the temperaturedrops ~15 °C as cooled erupted water from the surface, and air enterinto the conduit (Fig. 7c, points 7 to 1, video in electronic supplementarymaterial). The high concentration of dissolved ions in the water doesnot increase the boiling temperature significantly (b0.15 °C for concen-trations of 8 g/l of NaCl dissolved in water).
Wedefine the lower conduit as the part of the conduit below the air–water interface before the eruption, to a depth of 1.52 m. We observethat before the eruption (points 1 to 3), the temperature of the wateris almost constant at all depths, close to Tboil. Temperature in thelower conduit then increases (Fig. 8, from points 3 to 5) once the geyser

Fig. 5. (a) A sub-sample of the temperature time series for two sensors at the surface. Every peak represents an eruption. Sensor 1 is located at the geyser mouth. Sensor 2 is located 0.3 mabove the conduitmouth. Sensorswere in the air before eruptions occur. During the eruption, temperature increased because hot eruptedwater reached the sensors. (b) Zoomon35 s of asingle eruption (box). Stars with numbers are the key stages in the eruption cycle defined in Fig. 3, but for a different eruption. Images (c) to (g) were takenwith a FLIR camera (extractedfrom the video every ~6 s) during the same eruption. High temperature, in red, is related to boilingwater coming out of the conduit during the eruption. Image (c) was taken shortly afterthe start of the eruption at point 3, and it shows thehigh temperature in themouth of the conduit. Between points 4 and 6, temperature remains close to Tboil, the boiling point; subsequentimages (d), (e), and (f) show a high volume of hot water coming out of the conduit. At point 6, temperature decreases (sensor in contact with air). The volume of hot water drops (image(g)) identifying the end of the eruption at the surface.
46 C. Munoz-Saez et al. / Journal of Volcanology and Geothermal Research 292 (2015) 41–55
is erupting at the surface (Figs. 5 and 7). Pressures at depths of 0.9mand1.2 m reach maximum values (Fig. 8ab) during the first half of the sur-face eruption (Figs. 5 and 7, from points 3 to 4). However, at a depth of1.5 m, pressure between points 3 to 4 is almost constant, with a slightlynoticeable maximum between these points. Temperature increases 3±1 °C. The very small change in pressure, and comparably larger changein temperature between points 3 and 4, suggests that heat is added,but with little additional mass.
Pressure decreases from points 4 to 7 (Fig. 8abc), and temperaturecontinues to increase until point 5. Water at a depth of 0.9 m reachesboiling conditions at point 5 (Fig. 8a). Small changes in temperatureand a large decrease in pressure around point 5 are consistent with adi-abatic decompression of water in the conduit.Water at the deepest sen-sors reaches boiling conditions close to point 6 (Fig. 8bc), suggesting adownward propagation of the boiling front into the conduit (Figs. 5, 7,and 8). At a depth of 0.9 m, boiling conditions (Fig. 8a, points 5 to7) are maintained beyond the end of the eruption at the surface(Figs. 5 and 7, point 6).
Fig. 8 shows that from points 6 to 7, changes in pressure are small;the pressures at 0.9 m and 1.2 m decrease slightly but at a depth of1.5 m pressure increases slightly. The temperature shows a marked
decrease of about 1 °C at all sensors, suggesting heat loss or exchangewith cooler water. After that, pressure and temperature from points 7to 1 decrease and remain close to the boiling curve until the systemreturns to the initial conditions (close to Tboil).
Fluctuations in pressure from points 3 to 7 (Figs. 3, 6, and 8) are co-incident with Tboil at a depth of 0.6 m (Fig. 7c). Considering the uncer-tainties in the temperature, there is no clear evidence of superheatedfluid; if superheated fluid is present (points that are to the right of theboiling curve in Fig. 8), superheating is not sustained in time.
5. Discussion
5.1. Modulation of the IBE
An important observation made at El Jefe was the consistent timingand evolution of the eruptions (at least within the week of measure-ments) despite the fact that a large amount of the erupted water coolsat the surface and recharges the geyser system. Lengthening of geyserIBE, as a result of decreases in the air temperature, has been reportedin pool geysers (Merzhanov et al., 1990; Hurwitz et al., 2014). Thislengthening occurs because the large surface area of pool geysers
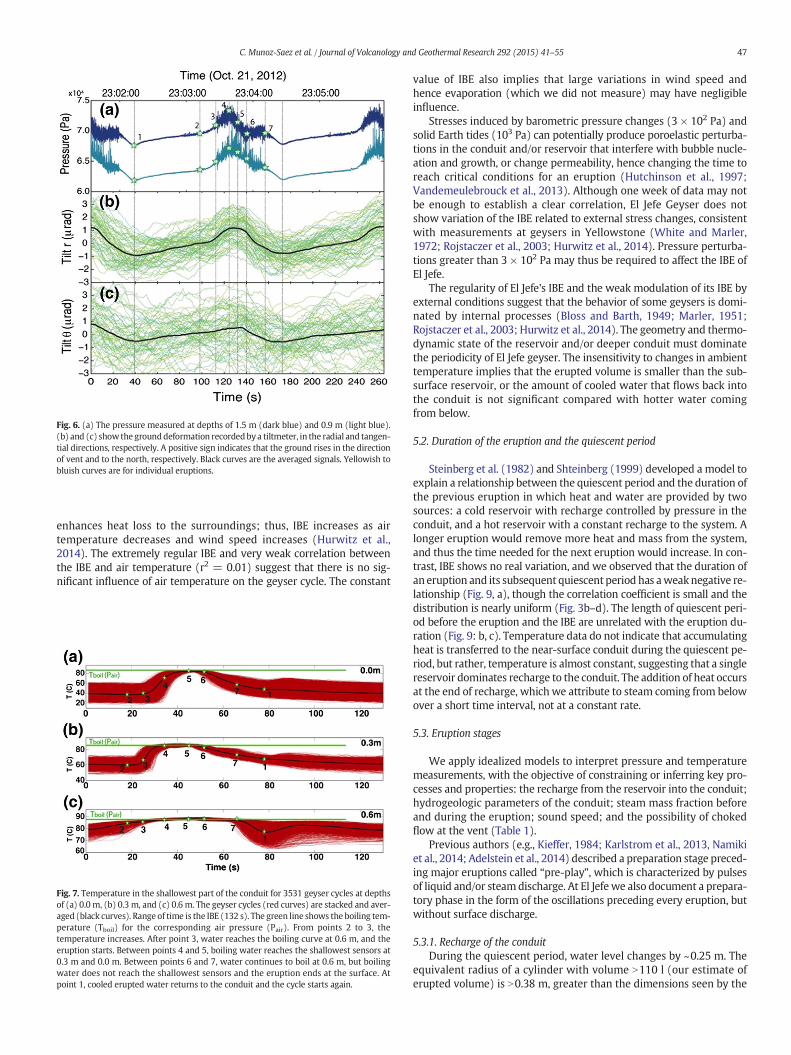
Fig. 6. (a) The pressure measured at depths of 1.5 m (dark blue) and 0.9 m (light blue).(b) and (c) showthe grounddeformation recordedbya tiltmeter, in the radial and tangen-tial directions, respectively. A positive sign indicates that the ground rises in the directionof vent and to the north, respectively. Black curves are the averaged signals. Yellowish tobluish curves are for individual eruptions.
47C. Munoz-Saez et al. / Journal of Volcanology and Geothermal Research 292 (2015) 41–55
enhances heat loss to the surroundings; thus, IBE increases as airtemperature decreases and wind speed increases (Hurwitz et al.,2014). The extremely regular IBE and very weak correlation betweenthe IBE and air temperature (r2 = 0.01) suggest that there is no sig-nificant influence of air temperature on the geyser cycle. The constant
Fig. 7. Temperature in the shallowest part of the conduit for 3531 geyser cycles at depthsof (a) 0.0 m, (b) 0.3 m, and (c) 0.6 m. The geyser cycles (red curves) are stacked and aver-aged (black curves). Range of time is the IBE (132 s). The green line shows the boiling tem-perature (Tboil) for the corresponding air pressure (Pair). From points 2 to 3, thetemperature increases. After point 3, water reaches the boiling curve at 0.6 m, and theeruption starts. Between points 4 and 5, boiling water reaches the shallowest sensors at0.3 m and 0.0 m. Between points 6 and 7, water continues to boil at 0.6 m, but boilingwater does not reach the shallowest sensors and the eruption ends at the surface. Atpoint 1, cooled erupted water returns to the conduit and the cycle starts again.
value of IBE also implies that large variations in wind speed andhence evaporation (which we did not measure) may have negligibleinfluence.
Stresses induced by barometric pressure changes (3 × 10² Pa) andsolid Earth tides (103 Pa) can potentially produce poroelastic perturba-tions in the conduit and/or reservoir that interfere with bubble nucle-ation and growth, or change permeability, hence changing the time toreach critical conditions for an eruption (Hutchinson et al., 1997;Vandemeulebrouck et al., 2013). Although one week of data may notbe enough to establish a clear correlation, El Jefe Geyser does notshow variation of the IBE related to external stress changes, consistentwith measurements at geysers in Yellowstone (White and Marler,1972; Rojstaczer et al., 2003; Hurwitz et al., 2014). Pressure perturba-tions greater than 3 × 10² Pa may thus be required to affect the IBE ofEl Jefe.
The regularity of El Jefe's IBE and the weak modulation of its IBE byexternal conditions suggest that the behavior of some geysers is domi-nated by internal processes (Bloss and Barth, 1949; Marler, 1951;Rojstaczer et al., 2003; Hurwitz et al., 2014). The geometry and thermo-dynamic state of the reservoir and/or deeper conduit must dominatethe periodicity of El Jefe geyser. The insensitivity to changes in ambienttemperature implies that the erupted volume is smaller than the sub-surface reservoir, or the amount of cooled water that flows back intothe conduit is not significant compared with hotter water comingfrom below.
5.2. Duration of the eruption and the quiescent period
Steinberg et al. (1982) and Shteinberg (1999) developed a model toexplain a relationship between the quiescent period and the duration ofthe previous eruption in which heat and water are provided by twosources: a cold reservoir with recharge controlled by pressure in theconduit, and a hot reservoir with a constant recharge to the system. Alonger eruption would remove more heat and mass from the system,and thus the time needed for the next eruption would increase. In con-trast, IBE shows no real variation, and we observed that the duration ofan eruption and its subsequent quiescent period has aweaknegative re-lationship (Fig. 9, a), though the correlation coefficient is small and thedistribution is nearly uniform (Fig. 3b–d). The length of quiescent peri-od before the eruption and the IBE are unrelated with the eruption du-ration (Fig. 9: b, c). Temperature data do not indicate that accumulatingheat is transferred to the near-surface conduit during the quiescent pe-riod, but rather, temperature is almost constant, suggesting that a singlereservoir dominates recharge to the conduit. The addition of heat occursat the end of recharge, which we attribute to steam coming from belowover a short time interval, not at a constant rate.
5.3. Eruption stages
We apply idealized models to interpret pressure and temperaturemeasurements, with the objective of constraining or inferring key pro-cesses and properties: the recharge from the reservoir into the conduit;hydrogeologic parameters of the conduit; steam mass fraction beforeand during the eruption; sound speed; and the possibility of chokedflow at the vent (Table 1).
Previous authors (e.g., Kieffer, 1984; Karlstrom et al., 2013, Namikiet al., 2014; Adelstein et al., 2014) described a preparation stage preced-ing major eruptions called “pre-play”, which is characterized by pulsesof liquid and/or steamdischarge. At El Jefe we also document a prepara-tory phase in the form of the oscillations preceding every eruption, butwithout surface discharge.
5.3.1. Recharge of the conduitDuring the quiescent period, water level changes by ~0.25 m. The
equivalent radius of a cylinder with volume N110 l (our estimate oferupted volume) is N0.38 m, greater than the dimensions seen by the
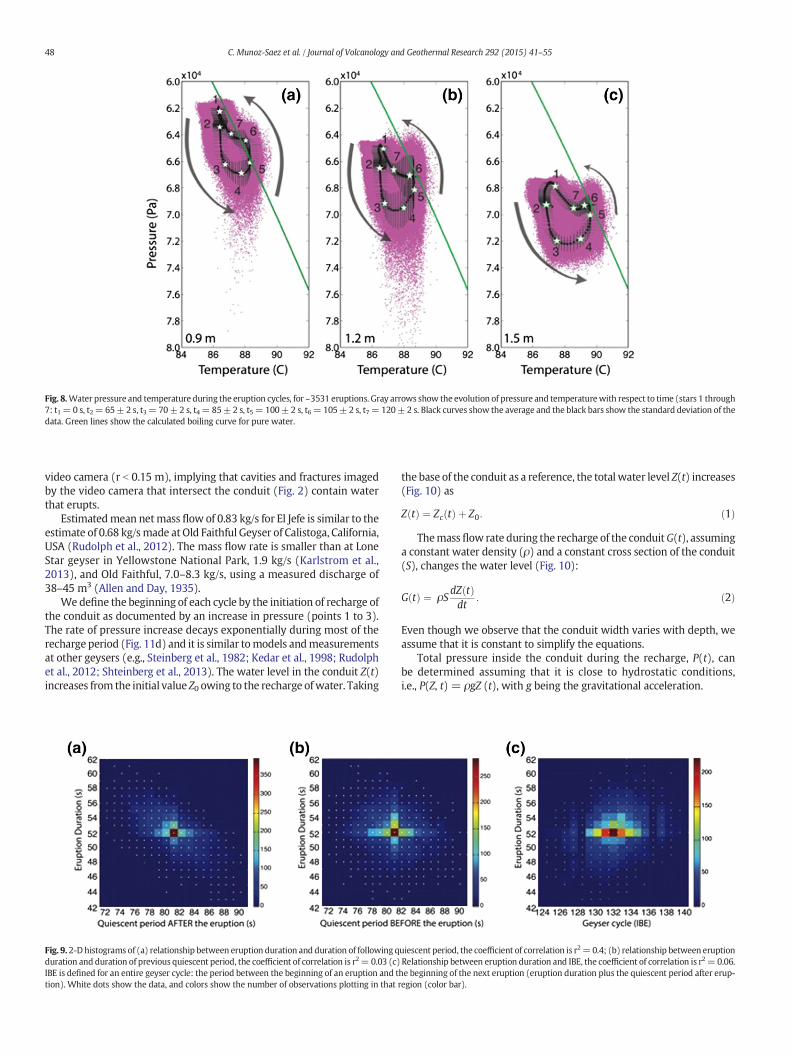
Fig. 8.Water pressure and temperature during the eruption cycles, for ~3531 eruptions. Gray arrows show the evolution of pressure and temperaturewith respect to time (stars 1 through7: t1= 0 s, t2 = 65± 2 s, t3= 70± 2 s, t4= 85± 2 s, t5 = 100± 2 s, t6 = 105± 2 s, t7 = 120± 2 s. Black curves show the average and the black bars show the standard deviation of thedata. Green lines show the calculated boiling curve for pure water.
48 C. Munoz-Saez et al. / Journal of Volcanology and Geothermal Research 292 (2015) 41–55
video camera (r b 0.15 m), implying that cavities and fractures imagedby the video camera that intersect the conduit (Fig. 2) contain waterthat erupts.
Estimatedmean netmass flow of 0.83 kg/s for El Jefe is similar to theestimate of 0.68 kg/smade at Old Faithful Geyser of Calistoga, California,USA (Rudolph et al., 2012). The mass flow rate is smaller than at LoneStar geyser in Yellowstone National Park, 1.9 kg/s (Karlstrom et al.,2013), and Old Faithful, 7.0–8.3 kg/s, using a measured discharge of38–45 m3 (Allen and Day, 1935).
We define the beginning of each cycle by the initiation of recharge ofthe conduit as documented by an increase in pressure (points 1 to 3).The rate of pressure increase decays exponentially during most of therecharge period (Fig. 11d) and it is similar tomodels andmeasurementsat other geysers (e.g., Steinberg et al., 1982; Kedar et al., 1998; Rudolphet al., 2012; Shteinberg et al., 2013). The water level in the conduit Z(t)increases from the initial value Z0 owing to the recharge ofwater. Taking
Fig. 9. 2-Dhistograms of (a) relationship between eruption duration and duration of following qduration and duration of previous quiescent period, the coefficient of correlation is r2= 0.03 (c)IBE is defined for an entire geyser cycle: the period between the beginning of an eruption and ttion). White dots show the data, and colors show the number of observations plotting in that
the base of the conduit as a reference, the total water level Z(t) increases(Fig. 10) as
Z tð Þ ¼ Zc tð Þ þ Z0: ð1Þ
Themassflow rate during the recharge of the conduitG(t), assuminga constant water density (ρ) and a constant cross section of the conduit(S), changes the water level (Fig. 10):
G tð Þ ¼ ρSdZ tð Þdt
: ð2Þ
Even though we observe that the conduit width varies with depth, weassume that it is constant to simplify the equations.
Total pressure inside the conduit during the recharge, P(t), canbe determined assuming that it is close to hydrostatic conditions,i.e., P(Z, t) = ρgZ (t), with g being the gravitational acceleration.
uiescent period, the coefficient of correlation is r2=0.4; (b) relationship between eruptionRelationship between eruption duration and IBE, the coefficient of correlation is r2= 0.06.he beginning of the next eruption (eruption duration plus the quiescent period after erup-region (color bar).

Table 1Summary of parameters.
Parameter Value Unit Description
A – m2 Cross-sectional area of flow of water fromthe aquifer to the conduit
α – m × s Constant of proportionality between massflow rate and pressure inside conduit
Cp – Jkg K
Heat capacity of water
f – Hz Frequency of resonanceg 9.8 m
s2 Acceleration of gravityGo kg
sInitial and constant mass flow rate of watercoming from hypothesized reservoir or aquifer
G(t) – kgs
Total mass flow rate of water during therecharge
h – m Height of the eruptive columnH(t) – J
sHeating rate during the recharge calculatedfrom model
Herupted – J Heat needed to generate an eruptionk – m2 Permeability of the conduitK – m
s Hydraulic conductivityL – m Distance over which water flows from the
aquifer to the conduitm – kg Total mass of water eruptedM(t) – kg Mass of water in the conduit during rechargen 1 – Fundamental mode of resonancePair 6.07 × 10⁴ to
6.1 × 10⁴Pa Atmospheric pressure measured at El Tatio,
4200 m of elevationP0 – Pa Initial hydrostatic pressure in the conduitP0 _ in – Pa Initial hydrostatic pressure inside of the
conduit, below the sensor.P0 _ sen – Pa Initial hydrostatic pressure inside of the
conduit, above the sensor.P(t) = P(Z, t) – Pa Total hydrostatic pressurePc(t) Pa Hydrostatic pressure above Z0Psen(t) Pa Hydrostatic pressure above the sensorP∞ – Pa Pressure in the hypothesized reservoirQ(t) – m3
sVolumetric flow rate into the conduit
r 0.15–0.38 m Radius of the conduit, assuming a cylindricalshape
ρ ~970 kgm3
Density of water at Tboil
S – m2 Cross section area of the conduit with radius rt – s TimeTair −5 to 25 °C Measured atmospheric temperatureTboil 86.2–86.4 °C Boiling temperature at PairT0 – °C Initial temperature at the bottom of conduit
before rechargeT(t) – °C Temperature inside the conduit during the
rechargeT∞ – °C Temperature in the hypothesized reservoir
or aquiferU – m
s Sound speed of waterv – m
s Exit velocity from the conduit to the surfaceμ 0.335 × 10⁻³ Pa s Dynamic viscosity of water at TboilZ0 m Initial water level into the conduit at the
beginning of the rechargeZ0_in – m Initial water level into the conduit, below
the sensorZ0_sen m Initial water level into the conduit, above
the sensorZ(t) – m Water level in the conduit during the rechargeZsen(t) – m Water level into the conduit during the
recharge, above the sensorZc(t) – m Water level into the conduit during the
recharge, above the Z0_sen
Fig. 10. Schematic illustration of the geyser subsurface showing parameters used in the re-charge model.
49C. Munoz-Saez et al. / Journal of Volcanology and Geothermal Research 292 (2015) 41–55
Following previous approaches (Steinberg et al., 1982; Kedar et al.,1998; Rudolph et al., 2012; Shteinberg et al., 2013), we assume that re-charge G(t) into the conduit is linearly proportional to the pressure dif-ference between the reservoir (P∞) and the conduit (Fig. 9),
G tð Þ ¼ −α P tð Þ−P∞ð Þ: ð3Þ
This expression is analogous to Darcy's law if we neglect pressurediffusion in the system providing the recharge. By analogy to Darcy'slaw, the constant of proportionality, α, depends on the hydraulic
conductivity K, the distance L to the reservoir, and the surface area, A,over which recharge occurs. Here, A is again assumed to be constant,and not dependent on water level. The constant α in Eq. (3) can be re-lated to equivalent quantities in previous models (Steinberg et al.,1982; Kedar et al., 1998; Rudolph et al., 2012):
α ¼ αSteinberg ¼ Sρ=αKedar ¼ αRudoph=ρ:
From Eqs. (2) and (3), we obtain
Sg
� �dP tð Þdt
¼ −α P tð Þ−P∞ð Þ: ð4Þ
Integrating, and applying the initial condition P0 at t = 0
P tð Þ ¼ P∞ þ P0−P∞ð Þ e−tαg
S
� �: ð5Þ
The pressure measured at the sensor Psen(t) is related to the total pres-sure by
Psen tð Þ ¼ P tð Þ−P0 in ð6Þ
where P0 _ in is the difference of hydrostatic pressure between the reser-voir and the sensor (Fig. 10)
Psen tð Þ ¼ P∞−P0 inð Þ− P∞−P0ð Þ e−tαg
S
� �: ð7Þ
Fitting the data from the sensor located at a depth of 1.5 m withEq. (7), from points 1 to 2, we obtain
P∞−P0in
� �¼ 6:97 x104 � 4 x10² Pa ð8Þ
P∞−P0ð Þ ¼ 2:10 x103 � 2 x10² Pa ð9Þ
Sαg
¼ 43 � 4 s: ð10Þ
Considering that P0 = P0 _ sen + P0 _ in, from Eqs (8) and (9) weobtain
P0 sen ¼ 6:76 x 104 � 1 x 10² Pa: ð11Þ

50 C. Munoz-Saez et al. / Journal of Volcanology and Geothermal Research 292 (2015) 41–55
The reasonable fit between the observed andmodeled pressure sug-gests that recharge is dominated by thewater level in the conduit. How-ever, toward the end of recharge (Fig. 11, points 2 to 3), the rate ofpressure increase is greater than predicted by the model and deviatesfrom the exponential fit. This misfit may be the result of the decreasein diameter of the upper conduit. Additionally, we calculated the expo-nential fit between points 2 and 3. Using Eq. (10)and the new fitting(considering the same αg), we infer that the surface area betweenpoints 1 and 2 is 4.5 times greater than the surface area between points2 and 3. By the end of the recharge period, water reaches the upper con-duit where the radiuswas ~0.15m, whereas the lower conduit radius isestimated to be ~0.32 m. From the total erupted volume, the equivalentradius was estimated to be ~0.38 m. Assuming S for a conduit of con-stant radius (r ~ 0.38 m) (Fig. 10), from Eq. (10) we calculate
α ¼ 3:40 � 10−4: ð12Þ
If we treat the rock around the conduit as a porousmedium, the vol-umetric flow Q(t) is given by
Q tð Þ ¼ −KAL
Z tð Þ− Z0ð Þ: ð13Þ
Fig. 11.Data from sensors located at (a) 0.9 m, (b) 1.2m, and (c) 1.5 m. Pressure (blue) and temline shows the boiling temperature at atmospheric conditions Tboil (86.4 °C). Numbers 1, 2 andresting time. Fitting curves of the data are the black lines, and vertical gray lines show±1 stanand the red vertical lines show ±1 standard deviation.
Then, Eq. (4) is written as
Q tð Þ ¼ −gα Z tð Þ− Z0ð Þ ð14Þ
α ¼ −Kg
AL
� �: ð15Þ
Wecan estimate the ratioAL as a functionof permeability, k=Kμ/ρg. If
the recharging system has k N10−9 m2, AL b0.1 m (using a viscosity
of 0.335 × 10⁻³ Pa s at Tboil), which implies a thin and long fracture. Ifk b10−11 m2, AL N12 m, and a much thicker region provides recharge.
Previous models considering two sources of water suggestedthat hot water from below provide a constant heat input (Steinberg etal., 1982; Kedar et al., 1998). Those models predict an exponentialincrease of temperature in the conduit during the recharge. To testthose models, we consider a constant heat input H(t) of liquid water
coming from below with mass flow rate in the conduit G ¼ dM tð Þdt ,
where M is the mass
H tð Þ ¼ CP G tð Þ T tð Þ−T0ð Þ: ð16Þ
perature (red) data on the y-axes, and time for a single eruption cycle on the x-axis. Green3 are the same key points described in previous figures. (d) Shows the pressure during thedard deviation. (e) Temperature during the same period. Fitting curves are the black lines,

51C. Munoz-Saez et al. / Journal of Volcanology and Geothermal Research 292 (2015) 41–55
If the initial temperature (T0) is constant
T tð Þ ¼ T0 þH tð Þ
G tð Þ CP: ð17Þ
From Eqs. (3) and (7) we obtain the total mass flow G tð Þ ¼ G0 e−tαg
S
� �,
and with H(t) = H,
T tð Þ ¼ T0 þH
G0CPð Þ etαgS : ð18Þ
Fitting an exponential curve to the temperature data (Fig. 11e):
HG0CPð Þ ¼ 0:014 � 0:003�C ð19Þ
Sαg
¼ 20 � 5 s: ð20Þ
The constant given in Eq. (20) is different from the equivalentone obtained from pressure data in Eq. (10). Temperature at adepth of 1.5 m is nearly constant, and increases only toward theend of the recharge period (Fig. 11c). It is this increase that drivesthe fit in Eq. (18). We propose next that the discrepancy betweenthe two values implies that heat input is not constant, and thatthere is an additional source of heat provided by steam during thelater stages of recharge.
Fig. 12. (a) Spectrogram of four eruption cycles (pressure sensor at 1.5m).We observe the sambeginning of the eruption. Spectrograms of pressure at (c) 1.2m, and (d) 0.9m show that themaline) in (c) and (d) show the single-sided amplitude spectrum based on fast Fourier transform
5.3.2. Pre-eruptive pressure signalThe pressure difference between the sensors at 0.9 and 1.2 m be-
tween the beginning (point 1) and the end of the recharge period(point 3) decreases by 2.5 × 10² Pa. This decrease implies that some liq-uid water is replaced by steam. Assuming that initially the conduit hadonly liquid water with a density of ~970 kg/m3, by the end of rechargethe density decrease is ~80 kg/m3. This value would arise if ~8 vol.% ofthe liquid is replaced by vapor, equivalent to a steam mass fraction of~5 × 10⁻⁵.
We observe a water pressure signal with a period of 1 to 2 s during ageyser cycle (Fig. 12). One possible source of such periodic signals is res-onance within the geyser conduit. Periodic signals were documented atother geysers (e.g. Kieffer, 1984; Lu andKieffer, 2009) and seismic trem-or is widely documented at magmatic volcanoes (e.g., Chouet, 1992;Johnson and Ripepe, 2011; Denlinger and Moran, 2014).
Resonance and damping of the perturbations are controlled by thegeometry of the conduit, and the sound speed in the fluid U. In a pipeclosed at one end, resonant frequencies f of a water columnwith heightZ are (e.g., Kinsler et al., 1982)
f ¼ nU4Z
; ð21Þ
where n is the mode (odd integer values, with n = 1 being the funda-mental mode and higher values being overtones), and we assume Uconstant. The equilibrium sound speed of water + steam mixtureswith a vapor mass fraction of 5 × 10⁻⁵ is U ~ 1 m/s (the non-equilibrium sound speed is N40m/s; Karlstrom et al., 2013). The funda-mental mode for a water column height of 0.85 m (approximate waterlevel from the bottom of the conduit before eruption) is then ~3.4 s
e pre-eruption signal in every cycle. (b) Time series of pressure during the resting time andin frequency in the pre-eruptive signal is 0.5 Hz. Plots below the spectrograms (dark green(FFT).
52 C. Munoz-Saez et al. / Journal of Volcanology and Geothermal Research 292 (2015) 41–55
(0.3 Hz). Our estimate is highly uncertain (the steam mass fraction isuncertain and is not likely to be uniform inside the conduit), and thevalue only differs by a factor of 2 to 3 from the 0.5 to 1 Hz signal thatwe see. We do not favor a resonance origin, however, because we donot see any overtones, nor any frequency gliding that might arise fromtemporal changes in steam mass fraction or water depth. Kedar et al.(1998) did not find evidence for conduit resonance at Old Faithful, Yel-lowstone either.
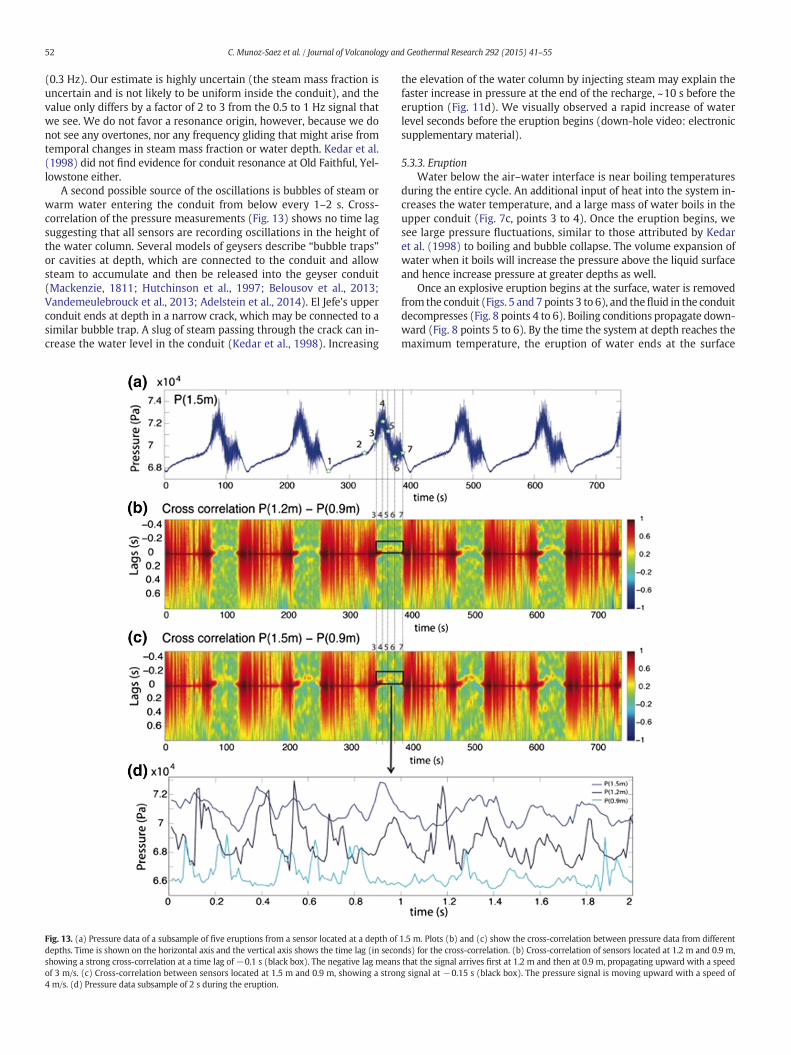
A second possible source of the oscillations is bubbles of steam orwarm water entering the conduit from below every 1–2 s. Cross-correlation of the pressure measurements (Fig. 13) shows no time lagsuggesting that all sensors are recording oscillations in the height ofthe water column. Several models of geysers describe “bubble traps”or cavities at depth, which are connected to the conduit and allowsteam to accumulate and then be released into the geyser conduit(Mackenzie, 1811; Hutchinson et al., 1997; Belousov et al., 2013;Vandemeulebrouck et al., 2013; Adelstein et al., 2014). El Jefe's upperconduit ends at depth in a narrow crack, which may be connected to asimilar bubble trap. A slug of steam passing through the crack can in-crease the water level in the conduit (Kedar et al., 1998). Increasing
Fig. 13. (a) Pressure data of a subsample of five eruptions from a sensor located at a depth ofdepths. Time is shown on the horizontal axis and the vertical axis shows the time lag (in secoshowing a strong cross-correlation at a time lag of−0.1 s (black box). The negative lag meansof 3 m/s. (c) Cross-correlation between sensors located at 1.5 m and 0.9 m, showing a stron4 m/s. (d) Pressure data subsample of 2 s during the eruption.
the elevation of the water column by injecting steam may explain thefaster increase in pressure at the end of the recharge, ~10 s before theeruption (Fig. 11d). We visually observed a rapid increase of waterlevel seconds before the eruption begins (down-hole video: electronicsupplementary material).
5.3.3. EruptionWater below the air–water interface is near boiling temperatures
during the entire cycle. An additional input of heat into the system in-creases the water temperature, and a large mass of water boils in theupper conduit (Fig. 7c, points 3 to 4). Once the eruption begins, wesee large pressure fluctuations, similar to those attributed by Kedaret al. (1998) to boiling and bubble collapse. The volume expansion ofwater when it boils will increase the pressure above the liquid surfaceand hence increase pressure at greater depths as well.
Once an explosive eruption begins at the surface, water is removedfrom the conduit (Figs. 5 and 7 points 3 to 6), and thefluid in the conduitdecompresses (Fig. 8 points 4 to 6). Boiling conditions propagate down-ward (Fig. 8 points 5 to 6). By the time the system at depth reaches themaximum temperature, the eruption of water ends at the surface
1.5 m. Plots (b) and (c) show the cross-correlation between pressure data from differentnds) for the cross-correlation. (b) Cross-correlation of sensors located at 1.2 m and 0.9 m,that the signal arrives first at 1.2 m and then at 0.9 m, propagating upward with a speedg signal at −0.15 s (black box). The pressure signal is moving upward with a speed of

53C. Munoz-Saez et al. / Journal of Volcanology and Geothermal Research 292 (2015) 41–55
(Figs. 5 and 8, point 6). Temperature decreases at depth (Fig. 8 points 6to 7), suggesting that heat is lost, however boiling continues in theupper part of the water column because pressure continues to decrease(points 6 to 7 in Figs. 7c and 8a). However, in the deeper part of the con-duit (Fig. 8c) there is a slight increase of pressure that can be explainedby lesser amounts of steam at depth. These observations suggest a non-uniform distribution of steam through the conduit.Water at depth staysbelow the boiling curve (Fig. 8, points 6 to 7c). Refilling by eruptedwater cools the conduit and ends the cycle (Fig. 7c, points 7 to 1).
Boiling conditions alone are not sufficient to cause an explosiveeruption as boiling conditions persist after the eruption ends. The addi-tion of steam from below the conduit, combined with a small enoughvolume of the cavity above the boiling surface, may be necessary to cre-ate pressures from boiling sufficient to initiate and sustain the eruption.
We performed a moving-window cross-correlation between pres-sure fluctuations recorded at different depths during the eruption. Wefind that pressure fluctuations propagate upward with a speed of 3 to4m/s (Fig. 13). This measured speed is the sum of the upward propaga-tion velocity of pressure waves and upward velocity of the fluid in theconduit. Speeds of a few m/s would empty the conduit very rapidly, sowe assume that at depth the propagation speed is close to 3–4 m/s.Using the model for the sound speed of liquid + steam mixturesunder conditions of thermodynamic equilibrium (Kieffer, 1984; Luand Kieffer, 2009), the implied steammass fraction during the eruptionis of the order of 1.2 × 10⁻³ (U = 3 m/s) to 1.7 × 10⁻³ (U = 4 m/s),using the formulation presented in Karlstrom et al. (2013); the equiva-lent volume fraction of steam is between 0.75 and 0.80 (using steamdensity of 0.4 kg/m3 and liquid water density of 970 kg/m3 for Pair andTboil). These values suggest that the steam mass fraction during theeruption is two orders of magnitude higher than the amount of steampresent in the conduit during recharge (inferred from the pressurechanges described in the previous section).
The exit velocity v of the steam + liquid mixture can be estimatedfrom the eruption height h by converting kinetic energy to potential en-ergy, v=
ffiffiffiffiffiffiffiffiffi2gh
p. The value of h varies during the eruption; using FLIR im-
ages and video recording we estimated the maximum h b 2 m (Fig. 5),thus v b 6 m/s. This value is higher than, but still close to, the soundspeed inferred from propagating pressure signals, suggesting that theflow may in fact be choked to the equilibrium sound speed at thevent. However, uncertainties on the mass fraction of steam are toolarge to make this inference robust. Considering v and the size of thegeysermouth (r ~ 0.15m), the exiting volume flux of liquid–steammix-ture is 0.42 m3/s, which is 3 orders of magnitude higher than dischargeof liquid water measured at the surface.
Fig. 14. Conceptual model for El Jefe geyser showing the different stages of the eruption cycle: radding steam to the conduit. Blue dots inside the conduit represent bubbles of steam. Blue backgand mass flow (G) inside the conduit evolve with time. The progression from t1 to t7 correspo
During the eruption, the temperature at depth increases by ~3 °C(Fig. 7, points 3 to 4). We calculated the heat added to the system thatis needed to increase the temperature of the columnwater by 3 °C. Con-sidering an average mass of the erupted water of N110 kg, we obtain~1.4 × 10⁶ kJ, using Herupted = CpmT, and Cp = 4.2 kJ/kg °C. The amountof vapor condensation needed to heat this water is ~0.52 kg, using a la-tent heat of 2660 kJ/kg (for Pair and Tboil). The implied volume of steamrequired is ~1.24 m3 (steam density 0.4 kg/m3), equivalent to a cavity~1 m in diameter. ~0.52 kg of steam in 110 kg of water is equivalentto a steammass fraction of 4.7 × 10⁻³, consistent with the previous es-timates given the large uncertainty associated with the inferred soundspeed (again, using the equilibrium sound speed).
The tilt data are noisy and likely influenced by the ponding andflow of water at the surface. However, when the tilt data are stacked,we do see a correlation with pressure in the conduit (Fig. 6ab). At ElJefe we see deformation, as recorded by the tilt that tracks the pres-sure in the conduit. Large increases of the tilt occur at the beginningof the eruption. In contrast, previous studies of geysering wells doc-umented rapid decrease of the tilt during the eruption and gradualrecovery during the quiescent period associated with recharge ofwater (Nishimura et al., 2006; Rudolph et al., 2012). The nature ofthe conduit may explain the difference: the previous studies wereconducted at the Onikobe geyser, Japan and Old Faithful Geyser ofCalistoga, California, which are artificial geysers whose conduits aremetal pipes that isolate processes within the conduit from grounddeformation.
5.3.4. RelaxationAt the end of the eruption, the large amplitude pressure fluctuations
end. Boiling ends, and colder eruptedwater enters the conduit. Pressureand temperature smoothly decrease until the cycle starts again.
5.3.5. Conceptual modelFig. 14 illustrates the conceptual model for all the key stages in the
geyser cycle:
(1) Recharge: A single reservoir dominates recharge to the conduit.The pressure P∞ in the reservoir is constant, and exceeds thepressure inside the conduit P(t). The temperature of the reservoiris constant, T∞. Thefilling process is adiabatic, and reaches boilingconditions at the top of the water column T(t) ~ Tboil. The rate ofrecharge G(t) and pressure increase P(t) inside the conduit de-crease over time. Pressure in the conduit is close to hydrostaticand depends on the water level.
echarge, pre-eruption, eruption, and relaxation. Themodel includes a bubble trap or cavityround represents liquidwater. Conditions of pressure (P), temperature (T), water level (Z),nds to the key stages in the cycle (Fig. 3).
54 C. Munoz-Saez et al. / Journal of Volcanology and Geothermal Research 292 (2015) 41–55
(2) Pre-eruptive stage: At the end of the recharge, steam bubblesfrom below (bubble trap) add latent heat to the system. P(t)and T(t) increase rapidly, and initiate explosive boiling at thetop of the conduit.
(3) Eruption: During the eruption there is explosive discharge ofwater at the surface driven by rapid expansion of steam. Theeruption column increases in height. Boiling conditions propa-gate downward in the conduit, as pressure decreases and tem-perature reaches a maximum value. The eruption at the surfaceends but the columnofwater in the conduit is still at boiling con-ditions. Cooler erupted water enters the conduit, cooling the topof the water column (Fig. 7c). Large amplitude pressure fluctua-tions are caused by some combination of boiling, cavitation, andbursting of steam bubbles at the liquid surface.
(4) Relaxation: Once the eruption stops, temperature and pressureinside the conduit continue decreasing, remaining close to theboiling curve until initial conditions are restored.
6. Conclusions
Ourwork at El Jefe geyser provides a unique dataset,with a completerecord of pressure and temperature inside a geyser conduit during com-plete geyser cycles over a large number of eruptions. We document thedifferent stages of the geyser cycle, we calculate the fluid propertiesduring an eruption, and we infer thermodynamic conditions at depth.Rapid boiling of a largemass of water occurs at the top of the water col-umn.Water is then removed from the conduit and the remainingwaterdecompresses, causing the boiling front to propagate downward. Erup-tion terminates when the addition of steam has ceased.
In the introduction we highlighted a few outstanding questions thatour measurements allow us to address:
(1) How is heat transported? Steam ascending from depth providesthermal energy used in boiling during the eruption at El Jefe gey-ser. A small mass fraction of steam (order of ~10−3) is enough toproduce an eruption. We infer sound speeds for liquid + steammixtures between 3 and 5 m/s. There is a possibility that flowmay be choked at the vent, but uncertainties are too large to beconclusive.
(2) What is the geometry of the subsurface and its role? The dynam-ics of the eruptions are dominated by geometrical and thermody-namic complexities in the conduit and reservoir system belowthe near-surface conduit, allowing the accumulation and period-ic release of steam in a reservoir that acts as a “bubble trap”.
(3) How do geysers respond to external influences? Data do notshow modulation of the interval between eruption (IBE) by ex-ternal perturbations, implying an internal control on the geysercycle. It also suggests that the thermal reservoir is very large rel-ative to the amount of water erupted for this geyser.
El Jefe geyser had an extremely regular eruptive cycle at least duringtheweek it wasmonitored, which contradicts the long-standing legendthat the El Tatio geysers erupt when the sun rises.
Acknowledgments
This research was supported by the National Science Foundation(EAR1114184), and CEGA, University of Chile. We thank El Tatio teammembers who provided essential help in the laboratory and in thefield: Fred Murphy, Ameeta Patel, Angello Negri, Pablo Ortega, AlbertoArdid, Cyndi Kelly, and Sarah Barrett. Eric King built the video camerasystem and took videos in the field. The fieldwork was performedwith the permission of the Amayras Communities of Caspana andToconce. We also thank Professor Lionel Wilson, Editor of Journal of
Volcanology and Geothermal Research, the reviewers Dr. AtsushiToramaru, Dr. Alexander Belousov, Fred Murphy, internal reviewer forUSGS, and Jenny Baca for first edition. Any use of trade, firm, or productnames is for descriptive purposes only and does not imply endorsementby the U.S. Government.
Appendix A. Supplementary data
Supplementary data to this article can be found online at http://dx.doi.org/10.1016/j.jvolgeores.2015.01.002.
References
Adelstein, E., Tran, A., Muñoz-Saez, C., Shteinberg, A., Manga,M., 2014. Geyser preplay anderuption in a laboratory model with a bubble trap. J. Volcanol. Geotherm. Res. 285,129–135. http://dx.doi.org/10.1016/j.jvolgeores.2014.08.005.
Agnew, D.C., 2012. SPOTL: Some Programs for Ocean-Tide Loading.Allen, E., Day, A., 1935. Hot springs of the Yellowstone National Park. Carnegie Inst. Wash.
Publ. 466, 525.Belousov, A., Belousova, M., Nechayev, A., 2013. Video observations inside conduits of
erupting geysers in Kamchatka, Russia, and their geological framework: implicationsfor the geysermechanism. Geology 41, 387–390. http://dx.doi.org/10.1130/G33366.1.
Birch, F., Kennedy, G.C., 1972. Note on geyser temperatures in Iceland and YellowstoneNational Park. In: Heard, H.C., Borg, I.Y., Rayleigh, C.B. (Eds.), Flow and Fracture ofRocks. American Geophysical Union Geophysical Monograph Series 16, pp. 329–336.
Bloss, F.D., Barth, T.F.W., 1949. Observations on some Yellowstone geysers. Geol. Soc. Am.Bull. 60, 861–886.
Bryan, T.S., 1995. The Geysers of Yellowstone. Univ. Press of Colorado, Boulder, Colorado(463 pp.).
Bunsen, R.W., 1847. Physikalische Beobachtungen uber die hauptsachlichsten GeysirIslands. Ann. Phys. Chem. 83, 159–170.
Chouet, B., 1992. A seismic model for the source of long-period events and harmonictremor. Volcanic seismology. Springer, Berlin Heidelberg, pp. 133–156.
Cortecci, G., Boschetti, T., Mussi, M., Lameli, C.H., Mucchino, C., Barbieri, M., 2005. Newchemical and original isotopic data on waters from El Tatio geothermal field, north-ern Chile. Geochem. J. 39 (6), 547–571.
Cusicanqui, H., Mahon,W.A.J., Ellis, A.J., 1975. The geochemistry of the El Tatio geothermalfield, Northern Chile. Second United Nations Symposium on the Development andUtilization of Geothermal Resources, pp. 703–711 (San Francisco).
Cusicanqui, H., Mahon,W.A.J., Ellis, A.J., 1976. The geochemistry of the El Tatio geothermalfield, northern Chile. Proc. 2nd U.N. Symposium on Geothermal Fields, Berkeley,California, pp. 140–156.
Denlinger, R.P., Moran, S.C., 2014. Volcanic tremor masks its seismogenic source: resultsfrom a study of noneruptive tremor recorded at Mount St. Helens, Washington.J. Geophys. Res. Solid Earth 119 (3), 2230–2251.
Fernandez-Turiel, J.L., Garcia-Valles, M., Gimeno-Torrente, D., Saavedra-Alonso, J.,Martinez-Manent, S., 2005. The hot spring and geyser sinters of El Tatio, NorthernChile. Sediment. Geol. 180 (3), 125–147.
Fournier, R.O., 1969. Old faithful: a physical model. Science 163, 304–305.Fukutomi, T.A., 1942a. Newmechanism of the geyser I. Bull. Seism. Soc. Jpn. 14, 157–174.Fukutomi, T.A., 1942b. Newmechanism of the geyser II. Bull. Seism. Soc. Jpn. 14, 189–202.Giggenbach, W.F., 1978. The isotopic composition of waters from the El Tatio geothermal
field, Northern Chile. Geochim. Cosmochim. Acta 42, 979–988.Glennon, J.A., Pfaff, R.M., 2003. The extraordinary thermal activity of El Tatio Geyser Field,
Antofagasta Region, Chile. GOSA Trans. 8, 31–78.Healy, J., 1974. Geological report on El Tatio geothermal field, Antofagasta province, Chile.
UNDP-Report.Hurwitz, S., Kumar, A., Taylor, R., Heasler, H., 2008. Climate-induced variations of geyser
periodicity in Yellowstone National Park, USA. Geology 36, 451–454.Hurwitz, S., Hunt, A.G., Evans, W.C., 2012. Temporal variations of geyser water chemistry
in the Upper Geyser Basin, Yellowstone National Park, USA. Geochem. Geophys.Geosyst. 13, Q12005. http://dx.doi.org/10.1029/2012GC004388.
Hurwitz, S., Sohn, R.A., Luttrell, K., Manga, M., 2014. Triggering and modulation of geysereruptions in Yellowstone National Park by earthquakes, earth tides, and weather.J. Geophys. Res. 119, 1718–1737. http://dx.doi.org/10.1002/2013JB010803.
Husen, S.,Wiemer, S., Smith, R.B., 2004a. Remotely triggered seismicity in the YellowstoneNational Park region by the 2002 Mw 7.9 Denali Fault earthquake, Alaska. Bull.Seismol. Soc. Am. 94, S317–S331.
Husen, et al., 2004b. Changes in geyser eruption behavior and remotely triggered seismic-ity in Yellowstone National Park produced by the 2002 M 7.9 Denali Fault earth-quake, Alaska. Geology 32, 537–540. http://dx.doi.org/10.1130/G20381.
Hutchinson, R.A., 1985. Hydrothermal changes in the upper Geyser Basin, YellowstoneNational Park, after the 1983 Borah Peak, Idaho, earthquake. In: Stein, R.S.,Bucknam, R.C. (Eds.), Proceedings of Workshop 28—On the Borah Peak, Idaho, earth-quake: U.S. Geological Survey Open-File Report OF 85-0290-A, pp. 612–624.
Hutchinson, R.A., Westphal, J.A., Kieffer, S.W., 1997. In situ observations of Old FaithfulGeyser. Geology 25, 875–878.
Ingebritsen, S.E., Rojstaczer, S.A., 1993. Controls on geyser periodicity. Science 262,889–892. http://dx.doi.org/10.1126/science.262.5135.889.
Ingebritsen, S.E., Rojstaczer, S.A., 1996. Geyser periodicity and the response of geysers todeformation. J. Geophys. Res. 101, 21,891–21,905. http://dx.doi.org/10.1029/96JB02285.

55C. Munoz-Saez et al. / Journal of Volcanology and Geothermal Research 292 (2015) 41–55
Johnson, J.B., Ripepe, M., 2011. Volcano infrasound: a review. J. Volcanol. Geotherm. Res.206 (3), 61–69.
Karlstrom, L., Hurwitz, S., Sohn, R.A., Vandemeulebrouck, J., Murphy, F., Rudolph, M.L.,Johnston, M.J.S., Manga, M., McCleskey, R.B., 2013. Eruptions at Lone Star Geyser,Yellowstone National Park, USA, Part 1: energetics and eruption dynamics.J. Geophys. Res. Solid Earth 118, 1–15. http://dx.doi.org/10.1002/jgrb.50251.
Kedar, S., Kanamori, H., Sturtevant, B., 1998. Bubble collapse as the source of harmonictremor at Old Faithful Geyser. J. Geophys. Res. 103, 24,283–224,299. http://dx.doi.org/10.1029/98JB01824.
Kieffer, S.W., 1984. Seismicity at Old Faithful Geyser: an isolated source of geothermalnoise and possible analogue of volcanic seismicity. J. Volcanol. Geotherm. Res. 22,59–95.
Kieffer, S.W., 1989. Geologic nozzles. Rev. Geophys. 27, 3–38. http://dx.doi.org/10.1029/RG027i001p00003.
Kinsler, L.E., Frey, A.R., Coppens, A.B., Sanders, J.V., 1982. Fundamentals of Acoustics. 3rdedition. Wiley, New York.
Kiryukhin, A.V., Rychkova, T.V., Dubrovskaya, I.K., 2012. Formation of the HydrothermalSystem in Geysers Valley (Kronotsky Nature Reserve, Kamchatka) and Triggers ofthe Giant Landslide. Appl. Geochem. 27, 1753–1766. http://dx.doi.org/10.1016/j.apgeochem.2012.02.011.
Lahsen, A., 1976a. La actividad geotermal y sus relaciones con la tectónica y el volcanismoen el norte de Chile. I Congreso Geológico Chileno, Actas. Antofagasta, pp. B105–B127.
Lahsen, A., 1976b. Geothermal exploration in Northern Chile. Proceedings of the CircumPacific Energy and Mineral Resources Conference, Honolulu Memoir 25, pp. 169–175.
Lahsen, A., Trujillo, P., 1975. El Tatio geothermal field. Proceedings of the Second UnitedNations Symposium on the Development and Use of Geothermal Resources, SanFrancisco, CA, Memoir 1, pp. 157–178.
Lahsen, A., Trujillo, P., 1976. El campo geotermico de El Tatio, Chile. Proyecto GeotermicoCORFO-ONU. Internal Report.
Landrum, J.T., Bennett, P.C., Engel, A.S., Alsina, M.A., Pastén, P.A., Milliken, K., 2009.Partitioning geochemistry of arsenic and antimony, El Tatio Geyser Field, Chile.Appl. Geochem. 24, 664–676.
Lu, X., Kieffer, S.W., 2009. Thermodynamics and mass transport in multicomponent mul-tiphase H2O systems of planetary interest. Ann. Rev. Earth Planet. Sci. 37, 449–477.
Mackenzie, G., 1811. Travels in the Island of Iceland, Edinburgh vol. 27. Alam and Compa-ny, Edinburgh.
Manga, M., Brodsky, E.E., 2006. Seismic triggering of eruptions in the far field: volcanoesand geysers. Ann. Rev. Earth Planet. Sci. 34, 263–291.
Marler, G.D., 1951. Exchange of function as a cause of geyser irregularity [Wyoming]. Am.J. Sci. 249, 329–342. http://dx.doi.org/10.2475/ajs.249.5.329.
Marler, G.D., 1964. Effects of the Hebgen Lake earthquake of August 17, 1959 on the hotsprings of the Firehole geyser basins, Yellowstone National Park. U.S. Geol. Surv.Prof. Pap. 435, 185.
Marler, G.D., White, D.E., 1975. Seismic geyser and its bearing on the origin and evolutionof geysers and hot springs of Yellowstone National Park. Geol. Soc. Am. Bull. 86,749–759.
Merzhanov, A.G., Shteinberg, A.S., Shteinberg, G.S., 1990. Heat and mass exchange in gey-ser systems. In: Hestroni, G. (Ed.), Proceedings of the 9th International Heat TransferConference, pp. 323–328.
Munoz, M., Hamza, V., 1993. Heat cihttp:dients in Chile. Stud. Geophys. Geod. 37,315–348. http://dx.doi.org/10.1007/BF01624604.
Namiki, A., Munoz-Saez, C., Manga,M., 2014. El Cobreloa: a geyserwith two distinct erup-tion styles. J. Geophys. Res. 119. http://dx.doi.org/10.1002/2014JB11009.
Nicolau, C., Reich, M., Lynne, B., 2014. Physico-chemical and environmental controls on si-liceous sinter formation at the high-altitude El Tatio geothermal field, Chile.J. Volcanol. Geotherm. Res. 282, 60–76. http://dx.doi.org/10.1016/j.jvolgeores.2014.06.012.
Nishimura, T., Ichihara, M., Ueki, S., 2006. Investigation of the Onikobe geyser, NE Japan,by observing the ground tilt and flow parameters. Earth Planets Space 58, e21–e24.
Rinehart, J.S., 1972. Fluctuations in geyser activity caused by variations in Earth tidalforces, barometric pressure, and tectonic stresses. J. Geophys. Res. 77, 342–350.http://dx.doi.org/10.1029/JB077i002p00342.
Rinehart, J.S., 1980. Geysers and Geothermal Energy. Springer-Verlag, New York.Rinehart, J.S., Murphy, A., 1969. Observations on pre- and post-earthquake performance
of Old Faithful geyser. J. Geophys. Res. 74, 574–575.Rojstaczer, S., Galloway, D.L., Ingebritsen, S.E., Rubin, D.M., 2003. Variability in geyser
eruptive timing and its causes; Yellowstone National Park. Geophys. Res. Lett. 30(18), 1953. http://dx.doi.org/10.1029/2003GL017853.
Rudolph, M.L., Manga, M., Hurwitz, S., Johnston, M.J., Karlstrom, L., Wang, C.-Y., 2012.Mechanics of old faithful Geyser, Calistoga, California. Geophys. Res. Lett. 39,L24308. http://dx.doi.org/10.1029/2012GL054012.
Shteinberg, A.S., 1999. An experimental study of geyser eruption periodicity. Power Eng.366, 47–50.
Shteinberg, A., Manga, M., Korolev, E., 2013. Measuring pressure in the source region forgeysers, Geyser Valley, Kamchatka. J. Volcanol. Geotherm. Res. 264, 12–16.
Steinberg, G.S., Merzhanov, A.G., Steinberg, A.S., 1982. Geyser process: its theory, model-ing and field experiment. Part 4. On seismic influence on geyser regime. Mod. Geol. 8,79–86.
Tassi, F., Martinez, C., Vaselli, O., Capaccioni, B., Viramonte, J., 2005. Light hydrocarbons asredox and temperature indicators in the geothermal field of El Tatio (northern Chile).Appl. Geochem. 20, 2049–2062.
Tassi, F., Aguilera, F., Darrah, T., Vaselli, O., Capaccioni, B., Poreda, R.J., Delgado Huertas, A.,2010. Fluid geochemistry of hydrothermal systems in the Arica-Parinacota, Tarapacáand Antofagasta regions (northern Chile). J. Volcanol. Geotherm. Res. 192, 1–15.
Vandemeulebrouck, J., Roux, P., Cros, E., 2013. The plumbing of Old Faithful Geyser re-vealed by hydrothermal tremor. Geophys. Res. Lett. 40, 1989–1993. http://dx.doi.org/10.1002/grl.50422.
Vandemeulebrouck, J., Sohn, R., Rudolph, M., Hurwitz, S., Manga, M., Johnston, M., Soule,A., McPhee, D., Glen, J., Karlstrom, L., Murphy, F., 2014. Eruptions at Lone Star geyser,Yellowstone National Park, USA: 2. Constraints on subsurface dynamics. J. Geophys.Res. Solid Earth 119. http://dx.doi.org/10.1002/2014JB011526.
White, D.E., 1967. Some principles of geyser activity, mainly from Steamboat Springs,Nevada. Am. J. Sci. 265, 641–684.
White, D.E., Marler, G.D., 1972. Fluctuations in geyser activity caused by Earth tidal forces,barometric pressure, and tectonic stresses. Comment. J. Geophys. Res. 77, 5825–5829.http://dx.doi.org/10.1029/JB077i029p05825.
Online References
Omega Thermocouple Home Page. Thermocouple Probes. N.p., n.d. Web. 09 Aug. 2014.http://www.omega.com/thermocouples.html.
Webbook Thermophysical Properties of Fluid Systems. N.p., n.d. Web. 07 Aug. 2014.http://webbook.nist.gov/chemistry/fluid/.


