Journal of The Electrochemical Society, B1081 0013-4651 ...siegeljb/My_Papers/JES0B1081.pdf ·...
13
Nitrogen Front Evolution in Purged Polymer Electrolyte Membrane Fuel Cell with Dead-Ended Anode Jason B. Siegel, a, * ,z Stanislav V. Bohac, b Anna G. Stefanopoulou, b and Serhat Yesilyurt c a Electrical Engineering and Computer Science, and b Mechanical Engineering, University of Michigan, Ann Arbor, Michigan 48109, USA c Sabancı University, Orhanli-Tuzla, 34956 Istanbul, Turkey In this paper, we model and experimentally verify the evolution of liquid water and nitrogen fronts along the length of the anode channel in a proton exchange membrane fuel cell operating with a dead-ended anode that is fed by dry hydrogen. The accumu- lation of inert nitrogen and liquid water in the anode causes a voltage drop, which is recoverable by purging the anode. Experi- ments were designed to clarify the effect of N 2 blanketing, water plugging of the channels, and flooding of the gas diffusion layer. The observation of each phenomenon is facilitated by simultaneous gas chromatography measurements on samples extracted from the anode channel to measure the nitrogen content and neutron imaging to measure the liquid water distribution. A model of the accumulation is presented, which describes the dynamic evolution of a N 2 blanketing front in the anode channel leading to the development of a hydrogen starved region. The prediction of the voltage drop between purge cycles during nonwater plugging channel conditions is shown. The model is capable of describing both the two-sloped behavior of the voltage decay and the time at which the steeper slope begins by capturing the effect of H 2 concentration loss and the area of the H 2 starved region along the anode channel. © 2010 The Electrochemical Society. DOI: 10.1149/1.3425743 All rights reserved. Manuscript submitted March 8, 2010; revised manuscript received April 12, 2010. Published May 27, 2010. The dynamic behavior of fuel cell FC operation under dead- ended anode DEA conditions are modeled and measured in this paper. Although a flow-through operation is used on both the anode and cathode of most laboratory/experimental hydrogen proton ex- change membrane fuel cell PEMFC systems, the fuel utilization of the anode flow-through operation is too low for commercial and portable systems. To increase the flow-through utilization, anode recirculation is employed but the required hydrogen grade plumbing and hardware ejector/blower adds weight, volume, and expense to the system. 1,2 Additional complexity is also added to the balance of plant with the use of external humidification to prevent overdrying of the membrane. However, a DEA can be fed with dry hydrogen, which is regulated to maintain anode pressure. In this configuration, hydrogen is supplied at exactly the rate needed to support the reac- tion. FC operation with dry hydrogen in a dead-ended system archi- tecture is possible because water crossing through the membrane is enough to humidify the fuel. The use of a pressure regulator instead of a mass flow controller and lack of anode inlet humidification can yield a system with lower cost and weight. The only problem with this architecture is that nitrogen, from air fed into the cathode, can also cross the membrane, driven by the gradient in partial pressure, creating a blanket of N 2 . Water vapor gradients between the humidified cathode and the dry fed anode also drives excess water into the anode, which can cause significant liq- uid water accumulation. Unlike water vapor whose maximum partial volume is dictated by temperature, liquid can fill the entire free space and block the flow of reactants, also known as channel plug- ging. The accumulation of liquid water and nitrogen in the anode channel AN CH is first observed near the outlet of the channel. Both gravity and gas velocity driven by consumption of hydrogen pull these heavier molecules toward the bottom of the channel. As the mass accumulation continues, a stratified pattern, which is sta- bilized by the effect of gravity, develops in the channel with a hydrogen-rich area sitting above a hydrogen depleted region. The boundary between these regions is a time-varying front, which pro- ceeds upward toward the inlet. 3 The mass accumulation physically blocks hydrogen gas from reaching the anode catalyst sites, which is the mechanism for the experimentally observed and recoverable voltage degradation. 4-6 We propose that the accumulation of N 2 and H 2 O initially leads to larger concentration losses due to decreasing hydrogen concentration near the bottom of the AN CH. When a critical amount of N 2 accumulates in the channel, it completely blocks H 2 from reaching the catalyst, effectively shrinking the active area of the cell causing larger activation potential in the cathode. This two-stage mechanism is clearly visible in all experimental con- ditions and scales with operating conditions such as load current density, relative humidity RH, and stoichiometric ratio SR in the cathode. Purges of the AN CH volume are necessary to clear the reaction product and inert gas from the channel. An anode purge event con- sists of opening a downstream solenoid valve, which creates a brief, high velocity flow-through the anode, removing liquid water and nitrogen. After the purge, the catalyst area contributing to the reac- tion increases and, hence, the measured voltage increases. Under- standing, modeling, and predicting the front evolution and overall dynamics in DEA FC would allow judicious choice of purging in- terval and duration. Better purging strategy can reduce the H 2 wasted during purges and avoid overdrying the membrane. The op- eration of a PEMFC with hydrogen starved areas can also lead to carbon corrosion; 7-9 therefore, the study of these operating condi- tions and the derivation of controllers to schedule anode purges are critical for DEA operation and prolonging stack life. For a fixed purge period and duration, the FC reaches a stable cyclic behavior, typically within a few purge periods, with both consistently repeatable voltage degradation rates between purges and voltage recovery with each purge. We verified the repeatability of the front evolution with in situ neutron imaging, measuring the liquid water front, and gas chromatography GC, measuring the hydrogen and nitrogen concentrations at a specific location in the AN CH, as shown in Fig. 1, which is discussed later. Gravity, buoy- ancy, and channel orientation help establish these statistically repeat- able and large spatiotemporal variations with hydrogen starvation fronts. Figure 2 shows typical spatial and temporal patterns of liquid water thickness and associated measurements during DEA operation with infrequent anode purging events. The stratification of the hydrogen/nitrogen fronts and the gravity-driven liquid water in the channels also provide a unique modeling paradigm and distinct con- ditions augmenting an earlier work 6,10-14 that has not been studied extensively before despite several strictly experimental results. 15-17 This paper elucidates the DEA hydrogen PEMFC behavior; spe- cifically, we first introduce the experimental setup, examine the data, and then propose a simple along-the-channel model. We use the model to explain the observed voltage behavior during DEA opera- tion. Because accumulation of both liquid water and nitrogen in the * Electrochemical Society Student Member. z E-mail: [email protected] Journal of The Electrochemical Society, 157 7 B1081-B1093 2010 0013-4651/2010/1577/B1081/13/$28.00 © The Electrochemical Society B1081 Downloaded 22 Sep 2010 to 141.212.134.235. Redistribution subject to ECS license or copyright; see http://www.ecsdl.org/terms_use.jsp
Transcript of Journal of The Electrochemical Society, B1081 0013-4651 ...siegeljb/My_Papers/JES0B1081.pdf ·...

Journal of The Electrochemical Society, 157 �7� B1081-B1093 �2010� B1081
D
Nitrogen Front Evolution in Purged Polymer ElectrolyteMembrane Fuel Cell with Dead-Ended AnodeJason B. Siegel,a,*,z Stanislav V. Bohac,b Anna G. Stefanopoulou,b andSerhat Yesilyurtc
aElectrical Engineering and Computer Science, and bMechanical Engineering, University of Michigan, AnnArbor, Michigan 48109, USAcSabancı University, Orhanli-Tuzla, 34956 Istanbul, Turkey
In this paper, we model and experimentally verify the evolution of liquid water and nitrogen fronts along the length of the anodechannel in a proton exchange membrane fuel cell operating with a dead-ended anode that is fed by dry hydrogen. The accumu-lation of inert nitrogen and liquid water in the anode causes a voltage drop, which is recoverable by purging the anode. Experi-ments were designed to clarify the effect of N2 blanketing, water plugging of the channels, and flooding of the gas diffusion layer.The observation of each phenomenon is facilitated by simultaneous gas chromatography measurements on samples extracted fromthe anode channel to measure the nitrogen content and neutron imaging to measure the liquid water distribution. A model of theaccumulation is presented, which describes the dynamic evolution of a N2 blanketing front in the anode channel leading to thedevelopment of a hydrogen starved region. The prediction of the voltage drop between purge cycles during nonwater pluggingchannel conditions is shown. The model is capable of describing both the two-sloped behavior of the voltage decay and the timeat which the steeper slope begins by capturing the effect of H2 concentration loss and the area of the H2 starved region along theanode channel.© 2010 The Electrochemical Society. �DOI: 10.1149/1.3425743� All rights reserved.
Manuscript submitted March 8, 2010; revised manuscript received April 12, 2010. Published May 27, 2010.
0013-4651/2010/157�7�/B1081/13/$28.00 © The Electrochemical Society
The dynamic behavior of fuel cell �FC� operation under dead-ended anode �DEA� conditions are modeled and measured in thispaper. Although a flow-through operation is used on both the anodeand cathode of most laboratory/experimental hydrogen proton ex-change membrane fuel cell �PEMFC� systems, the fuel utilization ofthe anode flow-through operation is too low for commercial andportable systems. To increase the flow-through utilization, anoderecirculation is employed but the required hydrogen grade plumbingand hardware �ejector/blower� adds weight, volume, and expense tothe system.1,2 Additional complexity is also added to the balance ofplant with the use of external humidification to prevent overdryingof the membrane. However, a DEA can be fed with dry hydrogen,which is regulated to maintain anode pressure. In this configuration,hydrogen is supplied at exactly the rate needed to support the reac-tion. FC operation with dry hydrogen in a dead-ended system archi-tecture is possible because water crossing through the membrane isenough to humidify the fuel. The use of a pressure regulator insteadof a mass flow controller and lack of anode inlet humidification canyield a system with lower cost and weight.
The only problem with this architecture is that nitrogen, from airfed into the cathode, can also cross the membrane, driven by thegradient in partial pressure, creating a blanket of N2. Water vaporgradients between the humidified cathode and the dry fed anode alsodrives excess water into the anode, which can cause significant liq-uid water accumulation. Unlike water vapor whose maximum partialvolume is dictated by temperature, liquid can fill the entire freespace and block the flow of reactants, also known as channel plug-ging. The accumulation of liquid water and nitrogen in the anodechannel �AN CH� is first observed near the outlet of the channel.Both gravity and gas velocity driven by consumption of hydrogenpull these heavier molecules toward the bottom of the channel. Asthe mass accumulation continues, a stratified pattern, which is sta-bilized by the effect of gravity, develops in the channel with ahydrogen-rich area sitting above a hydrogen depleted region. Theboundary between these regions is a time-varying front, which pro-ceeds upward toward the inlet.3 The mass accumulation physicallyblocks hydrogen gas from reaching the anode catalyst sites, which isthe mechanism for the experimentally observed and recoverablevoltage degradation.4-6 We propose that the accumulation of N2 andH2O initially leads to larger concentration losses due to decreasing
* Electrochemical Society Student Member.z E-mail: [email protected]
ownloaded 22 Sep 2010 to 141.212.134.235. Redistribution subject to E
hydrogen concentration near the bottom of the AN CH. When acritical amount of N2 accumulates in the channel, it completelyblocks H2 from reaching the catalyst, effectively shrinking the activearea of the cell causing larger activation potential in the cathode.This two-stage mechanism is clearly visible in all experimental con-ditions and scales with operating conditions such as load currentdensity, relative humidity �RH�, and stoichiometric ratio �SR� in thecathode.
Purges of the AN CH volume are necessary to clear the reactionproduct and inert gas from the channel. An anode purge event con-sists of opening a downstream solenoid valve, which creates a brief,high velocity flow-through the anode, removing liquid water andnitrogen. After the purge, the catalyst area contributing to the reac-tion increases and, hence, the measured voltage increases. Under-standing, modeling, and predicting the front evolution and overalldynamics in DEA FC would allow judicious choice of purging in-terval and duration. Better purging strategy can reduce the H2wasted during purges and avoid overdrying the membrane. The op-eration of a PEMFC with hydrogen starved areas can also lead tocarbon corrosion;7-9 therefore, the study of these operating condi-tions and the derivation of controllers to schedule anode purges arecritical for DEA operation and prolonging stack life.
For a fixed purge period and duration, the FC reaches a stablecyclic behavior, typically within a few purge periods, with bothconsistently repeatable voltage degradation rates between purgesand voltage recovery with each purge. We verified the repeatabilityof the front evolution with in situ neutron imaging, measuring theliquid water front, and gas chromatography �GC�, measuring thehydrogen and nitrogen concentrations at a specific location in theAN CH, as shown in Fig. 1, which is discussed later. Gravity, buoy-ancy, and channel orientation help establish these statistically repeat-able and large spatiotemporal variations with hydrogen starvationfronts. Figure 2 shows typical spatial and temporal patterns of liquidwater thickness and associated measurements during DEA operationwith infrequent anode purging events. The stratification of thehydrogen/nitrogen fronts and the gravity-driven liquid water in thechannels also provide a unique modeling paradigm and distinct con-ditions augmenting an earlier work6,10-14 that has not been studiedextensively before despite several strictly experimental results.15-17
This paper elucidates the DEA hydrogen PEMFC behavior; spe-cifically, we first introduce the experimental setup, examine the data,and then propose a simple along-the-channel model. We use themodel to explain the observed voltage behavior during DEA opera-tion. Because accumulation of both liquid water and nitrogen in the
CS license or copyright; see http://www.ecsdl.org/terms_use.jsp

B1082 Journal of The Electrochemical Society, 157 �7� B1081-B1093 �2010�B1082
D
AN CH of a PEMFC operating under dead-ended conditions con-tribute to the recoverable voltage degradation, we devised experi-ments to characterize the relative effects of both constituents usingsimultaneous in situ measurements of both nitrogen and liquid wa-ter. Anode purges and cathode surges when coupled with voltagemeasurement can be used as a diagnostic tool for determining thelocation of water flooding and the impact of nitrogen blanketing inthe AN CH. An anode purge, which is a short duration, high flowrate of gas though the anode initiated by opening a downstreamvalve, removes both liquid water and nitrogen gas from the AN CHand recovers the voltage drop caused by a reduced active area on theanode side. A cathode surge is a momentary increase in the air flowrate supplied to the cathode. The excess air increases the partialpressure of oxygen in the channel, which leads to increased voltagefor the duration of the surge. The excess air flow rate can alsoremove water from the cathode channel �CA CH� and cathode GDL,which leads to an improvement of the FC voltage after the surgerelative to the value before initiating the surge.
Finally, we compare the data with a model that captures therelative impact of each process on the measured cell voltage. In Ref.3, the effects of nitrogen accumulation driven by convection wereinvestigated, which we improve upon this work by inclusion of dif-fusive terms in the AN CH and a physics based voltage model,which accounts for membrane water content with a distributed cur-rent density. By correlating measurements of voltage, liquid watermass, and AN CH gas concentration, we aim to develop and validatea model of PEMFC under DEA operating conditions. Once properlycalibrated, this model can be used for anode purge scheduling andstack health monitoring. Snapshots of the data are presented to dem-onstrate the repeatability of the observed phenomena and to providecomparisons with the model. To prevent confusion and clarify theobserved phenomena, the term flooding is used to describe the ac-cumulation of liquid water in the GDL or catalyst layer, and the termplugging is used to refer to liquid water in the channels, whichblocks or hinders the flow of gas through the channels.18 The termblanketing is used to designate N2 mass accumulation in the AN CH,which prevents hydrogen from reaching the catalyst layer.
A
B
Capillary Tube
��� −������
Figure 1. Illustration of anode flow-field orientation and GC setup withsix-port rotating valve. In position A, the flow-through of the SL is from rightto left, the FC is connected to the SL and SV, whereas the carrier gas flowsto the GC. In position B, the flow-through of the SL is from top to bottom,the carrier gas is connected to the SL and GC, whereas the FC is connectedto the SV.
ownloaded 22 Sep 2010 to 141.212.134.235. Redistribution subject to E
Experimental Setup
A Shimadzu GC-17A gas chromatograph was used to measurethe hydrogen, nitrogen, and oxygen content of gas samples takenfrom the AN CH of a PEMFC during dead-ended operation. Simul-taneous measurement of the liquid water distribution inside the FCwas acquired via neutron imaging at the National Institute for Stan-dards and Technology in Gaithersburg, MD.6,19
Configuration and operating conditions.— The tested FC had anactive area of 50 cm2. The anode gas flow path consisted of 25parallel straight channels with a depth of 1.78 mm and a width of2.08 mm. The anode land width was 0.838 mm, and the channellength was 7.3 cm. The AN CHs were oriented on a 45° angle andconnected at the top and bottom of each channel by a manifold, asshown in Fig. 1. A supply of dry pressure regulated hydrogen at 4.5psig was fed to the DEA. As hydrogen was consumed in the reac-tion, the pressure regulator maintained constant pressure in the ANCH, effectively maintaining operation at hydrogen utilization of one.A solenoid valve located downstream of the FC anode can be peri-odically opened to purge the anode volume, as shown in Fig. 1. Thisvalve was referred to as the purge valve �PV�. An adjustable valve islocated downstream from the anode PV to reduce the pressure dropand flow during a purge. The valve was adjusted before starting theexperiment and remained fixed. The steady-state flow rate duringpurging was measured to be �1 slpm of hydrogen. The value�Npurge� listed in Table I was used to model this outlet flow. Due tothe small diameter passageway between the AN CHs and the outletmanifold of the FC, liquid water may impede the flow of gasesduring the initial portion of a purge. Another solenoid valve waslocated downstream, connected by capillary tubing, to allow gassampling from the AN CH. This solenoid valve was referred to asthe sampling valve �SV� and is described in the gas chromatographysetup section. A microcontroller was used to actuate the solenoidvalves precisely in time and control the purge event period andduration.
A traditional flow-through architecture with air was used on thecathode side with a bubbler-type humidifier. A backpressure regula-tor downstream from the cathode maintained the pressure between3.5 and 4.5 psig depending on the flow rate. The CA CHs had anine-pass semiserpentine flow path consisting of five parallel chan-nels. Typical cathode flow rates ranged from SR 1.5–3 �oxygensupplied/oxygen consumed�. Due to the use of air on the cathode,the gas velocities in the channel were much higher than a systemrunning on pure oxygen at the same SR. The RH of the gas streamwas varied between 50 and 100%. Cathode surges, which are shortduration �1–2 s� increases in the air flow rate �up to SR 10�, wereused during the experiment to remove liquid water from the CA CHsand to diagnose the extent of CA CH plugging. The cathode flowfield was aligned perpendicular to the AN CHs, but the inlets andoutlets were colocated at the upper and lower corners of the cell,respectively. As a result, the system behavior can be approximatedby an equivalent coflow model, as discussed in the Modeling sec-tion.
GC setup.— The setup shown in Fig. 1 illustrates the intercon-nection of the GC equipment and FC. A heated capillary tube wasinserted into the last AN CH �near the edge of the cell�, 3 cm fromthe bottom corner, as shown in Fig. 1. The 0.005 in. diameter cap-illary tube was connected to an electrically actuated six-port rota-tional valve. The SV was placed downstream from the six-port valvewhich, when opened, allows for filling of the sample loop �SL� fromthe FC AN CH when the six-port valve is in position A. After asample was collected in the SL and the SV was closed, the six-portvalve was rotated to position B, and the high pressure carrier gas�helium� pushed the sample into the GC for analysis.
Ultrahigh purity helium was used as the carrier gas and suppliedat a pressure of 200 kPa gauge. This produced a steady flow of 12mL/min to the GC. A thermal conductivity detector �TCD� was usedfor gas detection. As a result of the choice of column �Heyesep D
CS license or copyright; see http://www.ecsdl.org/terms_use.jsp
�
�
�
�
�
�
�
�
�
�
�
�
B1083Journal of The Electrochemical Society, 157 �7� B1081-B1093 �2010� B1083
D
column Restek, 100/120 mesh, 3 m length, 1 mm inner diameter�,the measurement of water vapor was not possible due to the verylong elution time for water in the column. The difference in reten-tion times of the GC for hydrogen and nitrogen measurement con-strained the maximum sampling rate at one sample every 40 s. TheSV was opened for 1 s, during which �300 �L of gas was removedfrom the AN CH �hence, the sample volume was less than 5% of thetotal anode volume�. The total anode volume was 6500 �L. Onlythe last 5 �L of the sample was trapped in the SL and then pushedinto the GC when the six-port valve was rotated. The capillary tub-ing, six-port SV, and SL were maintained at a constant temperatureof 110°C to ensure that a consistent sample concentration was de-livered to the GC and to prevent condensation in the tubing. Detailson the GC calibration can be found in the Appendix.
�������
� ��� ��� ��� ���
��
��
��
��
��
��
��
�� �
��
���
��
���
���
���
���
���
��
(a) Before Purge
� ���
��
���
��
���
���
���
���
���
�������
� ��� ��� ��� ���
��
��
��
��
��
��
��
�� �
��
���
��
���
���
���
���
���
��
(c) Low Voltage
� ���
��
���
��
���
���
���
���
���
��� ���
� ��� ��� ��� ���
��
���
��
���
���
���
���
��� �
��
���
��
���
���
���
���
���
��
(e) After Purge / Before Surge
� ���
��
���
��
���
���
���
���
���
ownloaded 22 Sep 2010 to 141.212.134.235. Redistribution subject to E
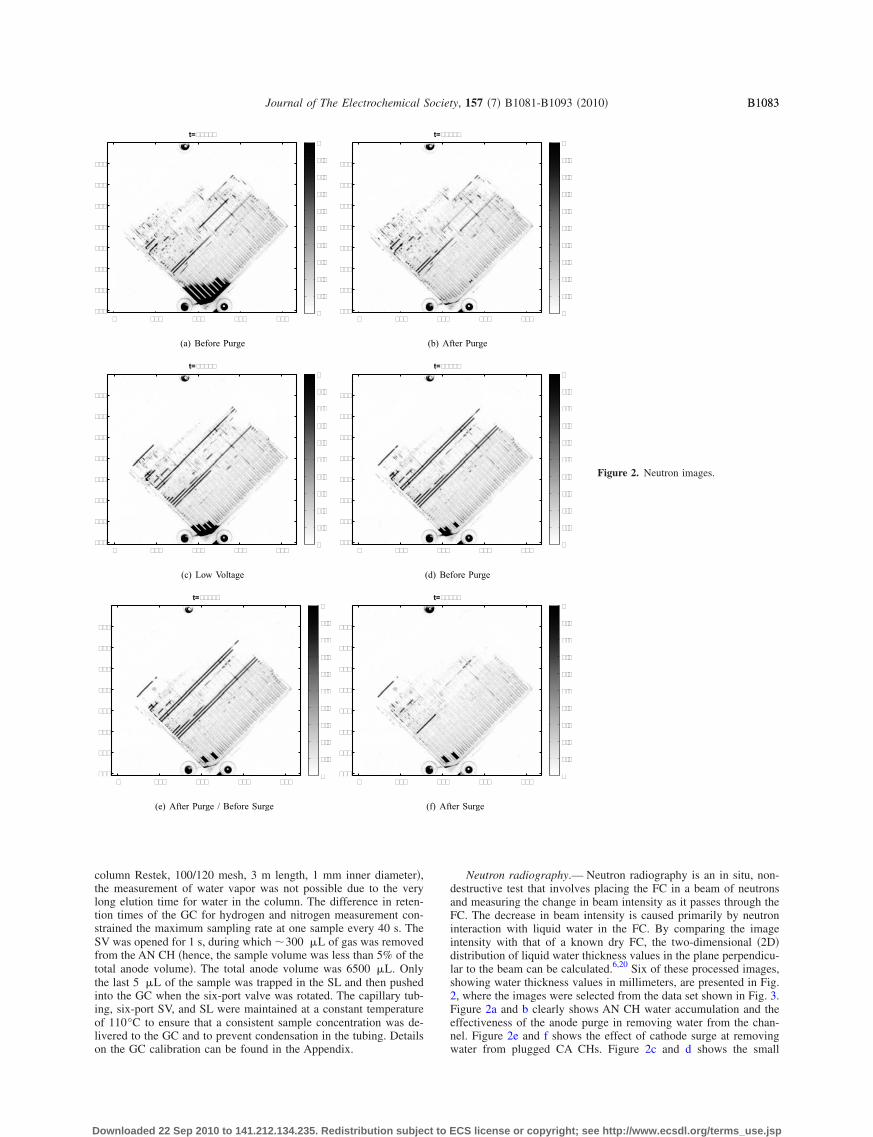
Neutron radiography.— Neutron radiography is an in situ, non-destructive test that involves placing the FC in a beam of neutronsand measuring the change in beam intensity as it passes through theFC. The decrease in beam intensity is caused primarily by neutroninteraction with liquid water in the FC. By comparing the imageintensity with that of a known dry FC, the two-dimensional �2D�distribution of liquid water thickness values in the plane perpendicu-lar to the beam can be calculated.6,20 Six of these processed images,showing water thickness values in millimeters, are presented in Fig.2, where the images were selected from the data set shown in Fig. 3.Figure 2a and b clearly shows AN CH water accumulation and theeffectiveness of the anode purge in removing water from the chan-nel. Figure 2e and f shows the effect of cathode surge at removingwater from plugged CA CHs. Figure 2c and d shows the small
��
��� ����
��
���
��
���
���
���
���
���
��
ter Purge
��
��� ����
��
���
��
���
���
���
���
���
��
fore Purge
�
��� ����
��
���
��
���
���
���
���
���
��
er Surge
Figure 2. Neutron images.
�����
���
(b) Af
���
���
(d) Be
��� �
���
(f) Aft
CS license or copyright; see http://www.ecsdl.org/terms_use.jsp
B1084 Journal of The Electrochemical Society, 157 �7� B1081-B1093 �2010�B1084
D
reduction of the AN CH water plugging, which occurred duringrepeated anode sampling. During this period, the voltage continu-ously improved, as shown in Fig. 3, which was the combined effectof nitrogen and liquid water removal from the channel. Nitrogenwas removed with the gas sample, and liquid water droplets weredislodged by the pressure variations in the channel due to the sam-pling and fell to the bottom of the channel via gravity.
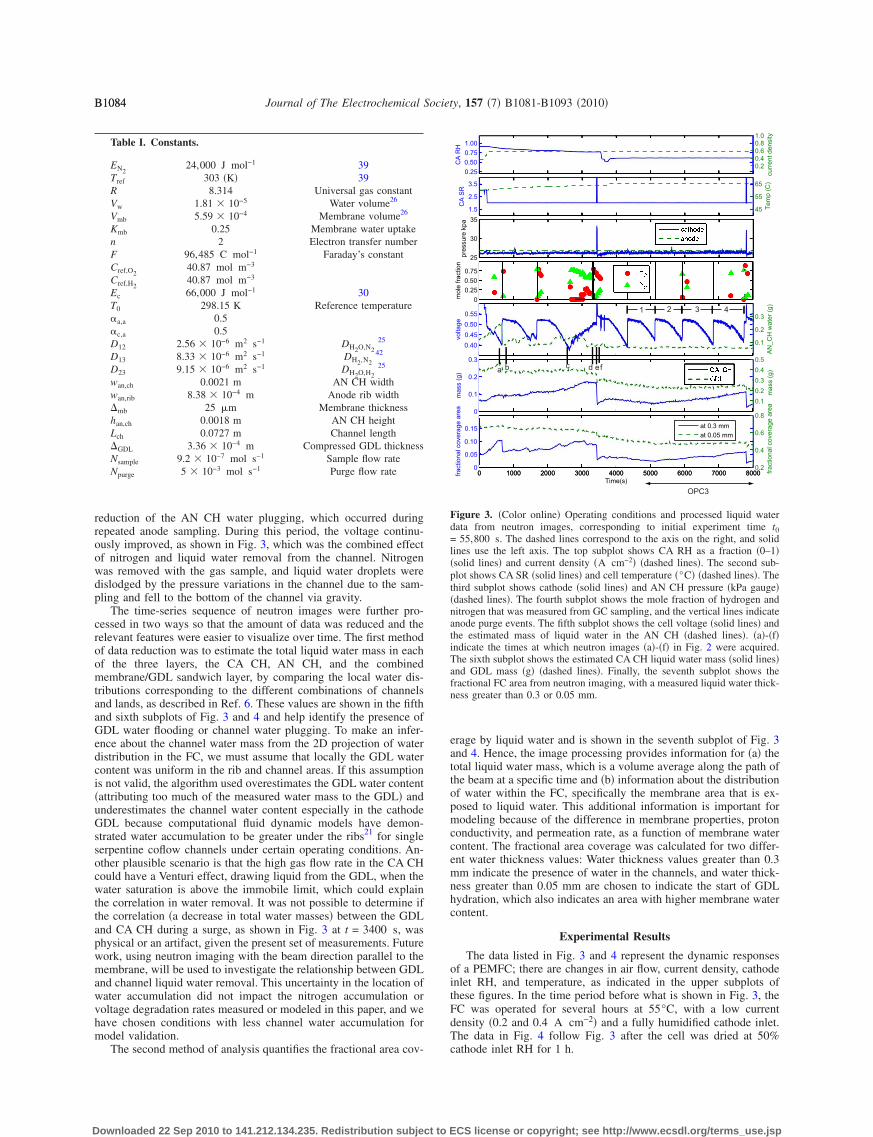
The time-series sequence of neutron images were further pro-cessed in two ways so that the amount of data was reduced and therelevant features were easier to visualize over time. The first methodof data reduction was to estimate the total liquid water mass in eachof the three layers, the CA CH, AN CH, and the combinedmembrane/GDL sandwich layer, by comparing the local water dis-tributions corresponding to the different combinations of channelsand lands, as described in Ref. 6. These values are shown in the fifthand sixth subplots of Fig. 3 and 4 and help identify the presence ofGDL water flooding or channel water plugging. To make an infer-ence about the channel water mass from the 2D projection of waterdistribution in the FC, we must assume that locally the GDL watercontent was uniform in the rib and channel areas. If this assumptionis not valid, the algorithm used overestimates the GDL water content�attributing too much of the measured water mass to the GDL� andunderestimates the channel water content especially in the cathodeGDL because computational fluid dynamic models have demon-strated water accumulation to be greater under the ribs21 for singleserpentine coflow channels under certain operating conditions. An-other plausible scenario is that the high gas flow rate in the CA CHcould have a Venturi effect, drawing liquid from the GDL, when thewater saturation is above the immobile limit, which could explainthe correlation in water removal. It was not possible to determine ifthe correlation �a decrease in total water masses� between the GDLand CA CH during a surge, as shown in Fig. 3 at t = 3400 s, wasphysical or an artifact, given the present set of measurements. Futurework, using neutron imaging with the beam direction parallel to themembrane, will be used to investigate the relationship between GDLand channel liquid water removal. This uncertainty in the location ofwater accumulation did not impact the nitrogen accumulation orvoltage degradation rates measured or modeled in this paper, and wehave chosen conditions with less channel water accumulation formodel validation.
The second method of analysis quantifies the fractional area cov-
Table I. Constants.
EN224,000 J mol−1 39
Tref 303 �K� 39R 8.314 Universal gas constantVw 1.81 � 10−5 Water volume26
Vmb 5.59 � 10−4 Membrane volume26
Kmb 0.25 Membrane water uptaken 2 Electron transfer numberF 96,485 C mol−1 Faraday’s constantCref,O2
40.87 mol m−3
Cref,H240.87 mol m−3
Ec 66,000 J mol−1 30T0 298.15 K Reference temperature�a,a 0.5�c,a 0.5D12 2.56 � 10−6 m2 s−1 DH2O,N2
25
D13 8.33 � 10−6 m2 s−1 DH2,N2
42
D23 9.15 � 10−6 m2 s−1 DH2O,H2
25
wan,ch 0.0021 m AN CH widthwan,rib 8.38 � 10−4 m Anode rib width�mb 25 �m Membrane thicknesshan,ch 0.0018 m AN CH heightLch 0.0727 m Channel length�GDL 3.36 � 10−4 m Compressed GDL thicknessNsample 9.2 � 10−7 mol s−1 Sample flow rateNpurge 5 � 10−3 mol s−1 Purge flow rate
ownloaded 22 Sep 2010 to 141.212.134.235. Redistribution subject to E
erage by liquid water and is shown in the seventh subplot of Fig. 3and 4. Hence, the image processing provides information for �a� thetotal liquid water mass, which is a volume average along the path ofthe beam at a specific time and �b� information about the distributionof water within the FC, specifically the membrane area that is ex-posed to liquid water. This additional information is important formodeling because of the difference in membrane properties, protonconductivity, and permeation rate, as a function of membrane watercontent. The fractional area coverage was calculated for two differ-ent water thickness values: Water thickness values greater than 0.3mm indicate the presence of water in the channels, and water thick-ness greater than 0.05 mm are chosen to indicate the start of GDLhydration, which also indicates an area with higher membrane watercontent.
Experimental Results
The data listed in Fig. 3 and 4 represent the dynamic responsesof a PEMFC; there are changes in air flow, current density, cathodeinlet RH, and temperature, as indicated in the upper subplots ofthese figures. In the time period before what is shown in Fig. 3, theFC was operated for several hours at 55°C, with a low currentdensity �0.2 and 0.4 A cm−2� and a fully humidified cathode inlet.The data in Fig. 4 follow Fig. 3 after the cell was dried at 50%cathode inlet RH for 1 h.
C
OPC3
a b c d ef
1 2 3 4
Figure 3. �Color online� Operating conditions and processed liquid waterdata from neutron images, corresponding to initial experiment time t0= 55,800 s. The dashed lines correspond to the axis on the right, and solidlines use the left axis. The top subplot shows CA RH as a fraction �0–1��solid lines� and current density �A cm−2� �dashed lines�. The second sub-plot shows CA SR �solid lines� and cell temperature �°C� �dashed lines�. Thethird subplot shows cathode �solid lines� and AN CH pressure �kPa gauge��dashed lines�. The fourth subplot shows the mole fraction of hydrogen andnitrogen that was measured from GC sampling, and the vertical lines indicateanode purge events. The fifth subplot shows the cell voltage �solid lines� andthe estimated mass of liquid water in the AN CH �dashed lines�. �a�-�f�indicate the times at which neutron images �a�-�f� in Fig. 2 were acquired.The sixth subplot shows the estimated CA CH liquid water mass �solid lines�and GDL mass �g� �dashed lines�. Finally, the seventh subplot shows thefractional FC area from neutron imaging, with a measured liquid water thick-ness greater than 0.3 or 0.05 mm.
CS license or copyright; see http://www.ecsdl.org/terms_use.jsp

B1085Journal of The Electrochemical Society, 157 �7� B1081-B1093 �2010� B1085
D
The repeatable and recoverable voltage decay, which is causedby mass accumulation in the anode, can be seen in the voltage plot,with the solid line type in the fifth subplot of Fig. 3 and 4. The anodepurge events indicated by the black vertical lines in the fourth sub-plot precede each of the largest voltage improvements. Cathodesurges are also correlated with voltage improvement, as discussed inthe following section.
An important feature of the observed voltage dynamic is thetwo-sloped decay. A slow initial decay, which can be attributed tothe dilution of hydrogen in the anode, is followed by a steeper lineardecay, which marks the development of a hydrogen depleted regionthat is covered by a blanketing N2 front moving upward toward theinlet. Various operating conditions are selected to demonstrate thecomplex phenomena occurring during the DEA operation.
Table II summarizes the operating conditions depicted in the fol-lowing figures and discussion. The operating conditions are de-scribed using the following notation: �i # _ T # _ SR # _ RH#�,
����
����
����
�����
���
��
���
�����������
�
�
��
��������
�� ������
����
�
�� �
����
�� �
!���"���#��
�
�
�� �
����
�� �
����
��$�
��
��%
���
��&
���
�����������#�'
���
��
���
��($
%�
��
��
)�!��C�
���
���
���
!����
���
���
���
��
��*
�����
+,-
� ���� ��� ���� %��� ���� ���� ��� &��� *����
���
��
���
"���#�����������
)#!����
� ���� ��� ���� %��� ���� ���� ��� &��� *�����
��%
���
��&
���
� ��� !!
� ���� !!
OPC5 OPC6
!����
"���#�����������
Figure 4. �Color online� Selected data set 2 beginning at t0 = 67,800 s,which shows the transition from subsaturated cathode inlet conditions tofully humidified conditions and the onset of channel plugging.
Table II. Select cases from data set for model comparison.
RH/SR Low �2� High �3�
T = 50°CFull �1�, 8 �6�, �7�Mid
T = 60°CFull 11 �2�, �9�, �10�Mid
T = 65°CFullMid 3, �4� �5�
OPC x Current density�x� 0.2 A cm−2
�x� 0.4 A cm−2
x 0.6 A cm−2
ownloaded 22 Sep 2010 to 141.212.134.235. Redistribution subject to E
where the number following i denotes the current density inA cm−2, T represents temperature �°C�, SR is the cathode stoichi-ometry, and RH is the cathode inlet RH. The data sets are availableonline at http://orion.engin.umich.edu.
Both N2 blanketing and liquid water plugging could displace H2,preventing it from reaching the catalyst sites. To study the relativeeffects of both constituents, we identify portions of the data setcorresponding to conditions with and without anode water accumu-lation. In this work, lower cathode inlet RH �60%� cases are used forthe investigation of a single phase channel model; hence, the influ-ence of N2 accumulation on voltage can be separately identified. Thelack of AN CH plugging is verified from the neutron radiographydata.
The operating conditions for case 5 are�i0.4 _ T60 _ SR3 _ RH60�, as shown in Table II, which are me-dium current density, 60°C, and high flow rate of subsaturated airsupplied to the cathode. This case is shown in Fig. 4 and is chosento represent a single phase condition for model comparison in theModeling results section.
Cathode surges vs anode purges.— In the DEA operation ofPEMFCs, anode purges and cathode surges, when coupled with volt-age measurement, can be used as a diagnostic tool for determiningthe location of water flooding and the impact of nitrogen blanketingin the AN CH. An anode purge, which is a short duration, high flowrate of gas through the anode initiated by opening the PV, removesboth liquid water and nitrogen gas from the AN CH and recovers thevoltage drop caused by the reduced active area on the anode side. Arepresentative section of our experiments is shown in Fig. 3. Thefirst anode purge at t = 680 s removes �0.19 g of liquid waterfrom the AN CH and the voltage improves by �130 mV followingthe anode purge, as shown in the fifth subplot of Fig. 3. Neutronimages from before �Fig. 2a�, and after �Fig. 2b� the purge confirmthe removal of liquid water from the AN CH.
A cathode surge is a momentary increase in the air flow ratesupplied to the cathode. The excess air increases the partial pressureof oxygen in the channel, which leads to an increase in the measuredcell voltage for the duration of the surge. The excess air flow ratealso removes water from the CA CH and cathode GDL, which leadsto an improvement of the FC voltage after the surge relative to thevalue before initiating the surge. This change in voltage should berelated to the amount of water removed from the CA CH, GDL, orcatalyst layer. Also, the resistance to O2 transport between the chan-nel and the cathode catalyst layer is reported to be large especiallyfor carbon cloth GDLs,22 and cathode purges effectively enhance theO2 transport to those areas, especially under the rib. Cathode surgesat t = 3400 s and t = 7800 s, indicated by the short duration spikesin the cathode stoichiometric ratio �CA SR� in the second subplot ofFig. 3, cause a temporary increase in cathode back-pressure andvoltage during the duration of the surge, as shown in the third andfifth subplots of Fig. 3, respectively.
The surge at t = 3700 s recovers 36 mV of voltage, and theremoval of liquid water from the CA CH can be clearly seen bycomparing Fig. 2e from before the surge to Fig. 2f after. A largervoltage recovery from both surges and purges is expected at a highcurrent density �0.6 A cm−2�, both because of the higher amount ofcathode flooding and the greater effect the accumulated water has onvoltage output because a higher local current density leads to loweroverall electrochemical efficiency. The fractional coverage area at0.3 mm, shown as the solid lines in the last subplot of Fig. 3, de-creases with both anode purges and cathode surges that remove wa-ter from the channels because water thickness values above thisthreshold are attributed to channel accumulation. The estimates ofchannel water mass shown in the above subplots are well correlatedwith the surges, purges, and voltage recoveries.
Temperature effects.— The overall effect of temperature on FCvoltage is difficult to quantify because temperature influences sev-eral competing factors. For example, an increased temperature leads
CS license or copyright; see http://www.ecsdl.org/terms_use.jsp

B1086 Journal of The Electrochemical Society, 157 �7� B1081-B1093 �2010�B1086
D
to faster reaction kinetics and increased proton conductivity, whichboth increase voltage. However, the increase in vapor pressure alsodecreases the oxygen partial pressure, which decreases voltage. So,the overall effect may be a decrease in voltage. Temperature alsoimpacts the nitrogen crossover rate though the membrane. The ni-trogen permeation rate, KN2
in Eq. 30, increases exponentially withtemperature. Saturation pressure also increases exponentially withtemperature, so the partial pressure of water vapor is small at lowertemperatures.
The slow decrease in cathode inlet RH, shown in Fig. 3, fromt = 200 s to t = 3200 s following the increase in current density,can be attributed to the increased heat generation that leads to ahigher cell temperature than the set point value �60°C�, whereas thedew point of the inlet air stream remained constant. This subsatu-rated cathode air feed leads to a slight recession of the two-phasefront location, as shown in the seventh subplot by the fractionalcoverage area, even though the decrease in CA SR keeps the gasvelocity in the channel close to the previous value after consideringthe increase in current density.
Finally, the decrease in CA RH and increased cell temperature atthe beginning at t = 3800 s leads to a more rapid drying of the FC.
The high temperature and low cathode inlet RH conditionsshown in the first half of Fig. 4 lead to a dry condition within theFC. The total water mass is very low and the fractional water cov-erage is also low, indicating that the transition from subsaturated tosaturated conditions along the length of the coflow channels is nearthe outlet. After the transition to lower cell temperature at t= 3700 s, which increases the cathode inlet RH from 60 to 100%,the two-phase front moves back toward the inlet, as indicated by theincrease in the fractional area coverage ��0.05 mm�. This leads tothe onset of both AN CH plugging and CA CH plugging. When thechannels are not plugged, the cathode surge at t = 3500 s has nosustained effect on voltage, but the surges following the increase tofully humidified cathode inlet conditions at t = 5100 s and t= 7000 s see voltage improvement that is well correlated with thewater removal from the CA CH. Data indicate that GDL water ac-cumulation �data points taken from under the lands� precedes theaccumulation of water in the channels.
GC sampling effects.— The intent of GC sampling was to mea-sure nitrogen accumulation in the AN CH. The measurement, how-ever, modifies the system behavior. Specifically, the effect of GCsampling, that is, the removal of gas from the AN CH, can improvethe FC voltage. When a sample removes accumulated nitrogen orwater from near the end of the AN CH, it is replaced by a purehydrogen flow from the inlet.
GC samples were initiated typically right before and after eachpurge event and sometimes in the middle of a purge period, asshown in the fourth subplot of Fig. 3. Individual GC samplingevents are correlated with the small voltage increases shown in thefifth subplot of Fig. 3. A series of samples, between t = 2700 and3500 s, was taken at the fastest sampling rate of the GC detector.
The effect of sampling has more impact on voltage with increas-ing time since the last anode purge event. This can be explained bythe nitrogen accumulation model presented in the Modeling section.Samples taken from later in the cycle allow more nitrogen to accu-mulate in the AN CH, see for example the sample taken at t= 350 s in Fig. 3. If nitrogen does not have sufficient time to accu-mulate, the sample removes primarily hydrogen from the channeland no voltage improvement is observed, see for example thesample taken at t = 700 s immediately following an anode purge.
The continuous sampling, at one sample every 40 s, observedbetween t = 2700 and 3500 s in Fig. 3, is responsible for the voltagerecovery observed over that time interval. If the sampling rate is fastenough to remove more volume than the amount of nitrogen thatcrosses over through the membrane in that time, then the measuredvoltage increases with each subsequent sample. The fluctuations inanode pressure, due to the repeated sampling, also enhance liquidwater removal from the AN CH by allowing liquid water to escape
ownloaded 22 Sep 2010 to 141.212.134.235. Redistribution subject to E
from the channel into the outlet manifold. During normal operation,the outlet manifold is at the same pressure at the channel, so there isno flow between these volumes. This explains the drop in AN CHliquid water mass observed between Fig. 2c and d.
Voltage repeatability.— The repeatability of several purgecycles, from the end of the larger data set shown in Fig. 3, can beseen by plotting each cycle vs the time since the previous purge, asshown in Fig. 5, creating an overlay of the voltage decays with time.The repeatability of the voltage decay characteristics between cyclesis remarkable, given the fact that some purge cycles contain surgeevents. Similarly, the repeatability and consistency of the measuredmole fractions every purge cycle is very important for modeling andunderstanding the underlying phenomena. This analysis is useful,considering the impact of GC sampling on voltage and nitrogendistribution in the AN CH. The composition of several samples fromdifferent points in time during the purge cycle and from differentcycles allows us to form an accurate representation of nitrogen ac-cumulation and voltage decay. Notice that the nitrogen mole frac-tion, shown in the bottom subplot of Fig. 5, saturates at around 0.8;the remaining 20% of the gas is saturated water vapor in the AN CH.
Modeling
In this section, a one-dimensional model of nitrogen crossoverand accumulation in the AN CH of a DEA PEMFC is presented. Themodeling domain for this work is the AN CH and membrane. Ni-trogen crossing though the membrane into the AN CH is pushed tothe end of the channel by the convective velocity.3 The convectivevelocity is the result of hydrogen consumption and, therefore, thevelocity is greatest near the anode inlet, decreasing along the lengthof the channel. Due to the high diffusivity of hydrogen in the ANCH, we use the Stefan–Maxwell equation to describe the nitrogendistribution along the channel, resulting from both convection anddiffusion, for comparison with the measured mole fractions fromGC sampling. A physics based voltage model is used to account forthe distributed current density and hydrogen consumption rate. Thevoltage model includes the effect of membrane water content andproton concentration. We consider an isothermal modeling ap-proach, and the measured cell end plate temperature is used for T.
The important dimensions for channel modeling are x, thethrough-membrane direction, and y, the along-the-channel direction,as shown in Fig. 6. For the anode, the spatial variation of gas con-centrations in the x-direction is considered, but the steady-state gasdiffusion profiles are calculated and used to propagate the channel
0 100 200 300 400 500 600 700 800 9000.4
0.45
0.5
0.55
0.6
voltage
0 100 200 300 400 500 600 700 800 9000
0.2
0.4
0.6
0.8
1
time (s)
molefraction H2
N2
5
5
2
3
44
Figure 5. �Color online� Subsequent purge cycles are plotted vs time sincethe previous purge. The data corresponds to operating condition 3 from thelarger data set shown in Fig. 3. The numbers 1–5 on the bottom subplotindicate during which purge cycle each GC sample was taken.
CS license or copyright; see http://www.ecsdl.org/terms_use.jsp

To
B1087Journal of The Electrochemical Society, 157 �7� B1081-B1093 �2010� B1087
D
values �which are modeled as dynamic states� across the GDL to thesurface of the membrane. A similar decoupling between the x and ydistributions is proposed in Ref. 23 to address the computationalcomplexity and to take advantage of the very different length scales.On the cathode, only the steady-state profiles are considered formodeling both the x- and y-dimensions. The approximation ofsteady-state distributions is appropriate for the cathode gas channeldue to the high gas flow rate and the large time scales over whichthe anode dynamics evolve.
The constants, listed in Table I, and equations describing the gasconstituents in the channels are written using SI units. The excep-tions are the related parameters in the voltage model �Table III�,which use A cm−2 consistent with the FC literature. In the along-the-channel model, the fluxes n have units �mol m−1 s−1� and flowsN �mol s−1�.
Nitrogen accumulation (single phase along the channel model).—consider both water and nitrogen transport though the membrane,our modeling effort requires consideration of a ternary system forthe anode. The Stefan–Maxwell model describes convection, diffu-sion, and reactions in the gas channel
Pan
RT
� xi
� t= −
�
� y�Ji + xiNt� + ri �1�
for i = �1,2�, where Nt is the total gas flux, Ji is the diffusive flux,and ri denotes the reaction terms. Only two of the three components
nH2,rct
nN2,crs
∆mb12wan,ribwan,ch
∆GDL
han,ch
Lchysample
a)
b)
Figure 6. �Color online� �a� One-dimensional FC modeling domain; y de-notes the distance along the channel from inlet to outlet �not drawn to scale�.�b� FC channel dimensions.
Table III. Tuned parameters.
io,ref,ca 7 � 10−8 A cm−2 Cathode exchange currentio,ref,an 0.05 A cm−2 Anode exchange currentiloss 1 � 10−3 A cm−2 Crossover currentDeff 0.35 Effective diffusivity in GDLRGDL 0.275 � cm2 Contract resistance� 2 N perm scale factor
N2 2ownloaded 22 Sep 2010 to 141.212.134.235. Redistribution subject to E
are independent in this modeling framework. We chose the molefractions of nitrogen, xN2
= x1, and water vapor, xH2O = x2, as ourdynamics states. Because the mole fractions must sum to one
� xi = 1 �2�
we can calculate the hydrogen from the other gases xH2�y� = 1
− xN2�y� − xH2O�y�. xH2
= min�x2,Psat�T�/Pan,in� is used for all thefollowing calculations, including Ji. The remaining water is assumedto be liquid water and is tracked separately; we are assuming instantcondensation.
The convective flux Nt is driven by the consumption of hydrogen�Eq. 7�. In Eq. 1, a constant pressure is used as an approximationbecause the anode volume is fed via pressure regulation and thestraight channel geometry introduces minimal pressure drop alongthe length of the channel. Although a pressure gradient, correspond-ing to the convective flux, develops along the length of the channel,the pressure drop is less than 1 Pa at 1 A cm−2, so a constantpressure is valid for calculating the concentrations. The ideal gaslaw, PV = nRT or P = cRT, is used to relate pressure and molefraction of gas species in the channel.
A causal formulation for the diffusive fluxes is used24
�J1
J2� = −
Pan
RT��x��D1�x1� , D2�x1�D3�x2� , D4�x2� �
� x1
� y
� x2
� y �3�
where
D1�x1� = �1 − x1�D13D12 + x1D23D13
D2�x1� = − x1�D23D12 − D23D13�
D3�x2� = − x2�D13D12 − D23D13�
D4�x2� = �1 − x2�D23D12 + x2D23D13 �4�
and Dij are the temperature-dependent binary diffusion coefficientsfrom Ref. 25. ��x� is given by
��x� = �D23 − D12�x1 + �D13 − D12�x2 �5�
Conservation of mass allows solving of Eq. 1 for Nt�y�, assumingthe outlet flow is known Nt�L� = Nout. The equation for conservationof mass can be written as
� Nt
� y= � ri �6�
because �Ji = 0 by definition. Then the convective flux along thechannel can be found from Eq. 6 by integrating backward in spacealong the channel
Nt�y� = Nt�L� + �y
L
�nH2,rct�y� + nN2,crs�y� + nH2O,crs�y��dy �7�
Because the anode is dead-ended, Nout = 0 unless the downstreamsolenoid valve is open and the anode is purging, in which caseNout = Npurge, a constant.
The source term for nitrogen in the AN CH is membrane cross-over, which is calculated from the difference in nitrogen partial pres-sure across the membrane of thickness �mb
nN2,crs�y� = − KN2�T,�mb��wan,ch + wan,rib�
��PN2,ca,mb�y� − PN2,an,mb�y��
�mb�8�
We assume that the permeation takes place both over the ribs andchannels �wan,ch + wan,rib�, where w� indicates the width of each.The partial pressure of nitrogen at each membrane surface is calcu-lated using the following expressions, P �y� = x �y�P
N2,an,mb N2 an,inCS license or copyright; see http://www.ecsdl.org/terms_use.jsp

B1088 Journal of The Electrochemical Society, 157 �7� B1081-B1093 �2010�B1088
D
and PN2,ca,mb�y� = Pca,in − Pv�T� − PO2,ca,mb�y�, assuming uniformpressure and saturated water vapor everywhere. This is reasonable,considering the water generation rate, especially when humidifiedinlets are used at low to mid temperatures. The oxygen concentra-tion at the cathode surface of the membrane, PO2,ca,mb�y�, is calcu-lated using Eq. 26. The nitrogen permeation rate, KN2
�T,�mb�, isgiven by Eq. 30, and depends both on temperature and membranewater content.
The hydrogen reaction rate is calculated from the local currentdensity
nH2,rct�y� =ifc�y�2F
�wan,ch + wan,rib� �9�
where F is Faraday’s constant.The source term for water vapor in the AN CH is also membrane
crossover, which is calculated from the diffusion and electro-osmotic drag
nH2O,crs = − ��ca − �an
Rw,mb− nd��mb�
ifc
F��wan,ch + wan,rib� �10�
where Rw,mb is the resistance to membrane transport
Rw,mb =�mb
Dw��mb,T�+
1
kads+
1
kdes�11�
arising from diffusion, where Dw��mb,T� is the water diffusion co-efficient for water in the membrane26 and interfacial mass transferattributed to membrane adsorption kads and desorption kdes.
26-28 Thecoefficient of electro-osmotic drag, nd��mb�, can also be found inRef. 26. Both Dw and nd are �mb-dependent and increase with mem-brane water content.
The membrane water content is the final dynamic state in themodel and is calculated from the difference between the anode andcathode equilibrium lambda values
� �mb�y�� t
= Kmb��an�y� + �ca�y� − 2�mb�y�� �12�
where Kmb = kads/Amb = 0.25 is the membrane water uptake rate.Other, more recent models for membrane water uptake27,28 will beinvestigated in a future work but should not impact the results fornitrogen accumulation presented here.
The equilibrium membrane water content is calculated from thewater activity using the uptake isotherm26
�an�y� = c0�T� + c1�T�aH2O,an + c2�T�aH2O,an2 + c3�T�aH2O,an
3
�13�
where aH2O,an�y� = xH2O�y�Pan,in/Psat�T�.There exists a coupling between membrane water content,
�mb�y�, the current density distribution, ifc�y�, and nitrogen cross-over rate, KN2
�T,�mb�. The nitrogen permeation rate depends onmembrane water content, and the nitrogen accumulation rate de-pends on both the permeation rate and current density distribution�convective vs diffusive flow�. The current density distribution de-pends on nitrogen accumulation �through blanketing of H2� and themembrane water content for proton transport losses in the mem-brane. Finally, the membrane water content depends on the localcurrent density and channel/GDL conditions.
Modeling the GC sample location.— The flow of gas removedfrom the AN CH during sampling is modeled by modifying Eq. 7 toinclude the sample flow
ownloaded 22 Sep 2010 to 141.212.134.235. Redistribution subject to E
Nt�y� = Nt�L� + �y
L
�nH2,rct�y� + nN2,crs�y� + nH2O,crs�y��dy
+ �Nsample for �y ysample�0 for �y � ysample�
�14�
where ysample is the location of the sampling port along the equiva-lent channel.
Because the FC is on a 45° angle and each of the AN CHs isconnected at the top and bottom, as shown in Fig. 1, the N2 blan-keting front propagation needs to be transformed for comparisonwith an equivalent straight single channel. The nitrogen coveragearea, however, can be directly related to the coverage area in thesingle channel equivalent model. Hence, we use the following rela-tionship for the virtual single channel FC sampling location ysample
�Lch − ysample�Lch
=�Lch − lsample�2
2Afc�15�
This equation relates the fractional area below the sampling locationfor the FC placed in the diagonal orientation �right�, as shown inFig. 7, to the fractional area below the sampling location in theequivalent model �left�, as shown in Fig. 6. The physical nitrogensampling location is 3 cm from the bottom edge of the FC along thelast channel, Lch − lsample = 0.03, as shown in Fig. 7.
Distributed current density.— In a previous work, the voltagewas calculated based on a uniform apparent current density,29 whichis related to the catalyst area with sufficient reactants to support thereaction, i.e., the channel length not covered by nitrogen3 or water.29
In this work, we consider the distributed current density, which iscalculated directly from the reactant concentrations. Although theapparent area modeling technique captured the correct voltage out-put behavior of the system, the full distributed current density ap-proach is chosen for this work to match internal model states and themeasurement of nitrogen molar fraction during sampling from theAN CH at the fixed sampling location �lsample�. The diffusion ofhydrogen and nitrogen in the AN CH affects both the current densitydistribution and GC measurement.
The inputs to the voltage model are total current Ifc�A�, tempera-ture T�K�, membrane water content distribution �mb�y�, hydrogenpartial pressure at the membrane surface PH2,an,mb�y�= RTcH2,an,mb�y� �Pa�, and oxygen partial pressure at the cathodemembrane surface PO2,ca,mb�y� �Pa�, which is calculated in Eq. 26.The cell terminal voltage is calculated from the open-circuit poten-tial minus the concentration, overpotential, and ohmic losses
��� −������
���−�����
Figure 7. �Color online� Mapping AN CHs to equivalent single channel. Thepath length, in the 45° orientation, to nitrogen front location is the same forall channels.
CS license or copyright; see http://www.ecsdl.org/terms_use.jsp

B1089Journal of The Electrochemical Society, 157 �7� B1081-B1093 �2010� B1089
D
Ecell = Erev�y� − mb�y� − GDL�y� − act,ca�y� − act,an�y��16�
The calculation of the FC terminal voltage and current density dis-tribution requires the additional computation effort to solve N + 1simultaneous nonlinear algebraic constraint equations, where N isthe number of discretized sections used to solve the partial differen-tial equation �PDE� system. The distributed current density is re-solved by solving the set of N �Eq. 16� for a uniform potential Ecelland one equation for the conservation of current
Ifc
Afc=
1
Lch�
0
Lch
ifc�y�dy �17�
The reversible voltage is given by
Erev�y� = E0 −RT
nFlog� aH2O�y�
aH2�y���aO2�y�� �18�
where E0 = 1.229 − �T − T0�2.304 � 10−4.30 The reactant andproduct activities are calculated from the concentrations aH2�y�= cH2,an,mb�y�/Cref,H2
, aO2�y� = cO2,ca,mb�y�/Cref,O2, and aH2O = 1
because the liquid water product is assumed. The subscript ref refersto the reference quantity, and subscript ca,mb refers to the cathodemembrane surface.
To simplify the calculation of cell voltage, a hyperbolic sinefunction is used for the calculation of overpotentials, act,ca andact,an, from the exchange current density, io,ca�y� and io,an�y�
act,ca�y� =RT
�c,anFa sinh� kunitsifc�y� + iloss
2io,ca�y� � �19�
where kunits = 100−2 m2/cm2 is for units conversion, ifc�y� is thedistributed current density from Eq. 17, and iloss is the lost currentdensity due to hydrogen crossover, a tuned parameter which is listedin Table III. The hyperbolic sine is equivalent to the Butler–Volmerequation when the forward and reverse reaction coefficients ��c,a= �c,c� are equal.31
Although the cathode reaction depends on the oxygen concentra-tion as well as the activity of protons in the membrane,32 the protonactivity term is typically neglected because there are sufficientlymany protons under the FC normal operation. Because we expect alow hydrogen concentration in the anode near the end of the chan-nel, we include the proton effect on the exchange current density
io,ca�y� = io,ref,ca� cO2,ca,mb�y�
Cref,O2
��O2� cHca,mb+ �y�
Cref,H+��H+
�exp�− Ec
R� 1
T−
1
T0�� �20�
where io,ref,ca is the reference current density, c� is the reactant con-centration, � is the concentration parameter, and Ec in the Arrheniusterm is the activation energy for hydrogen oxidation on platinum.33
The cathode concentration parameter for the local proton activity��H+ = 0.5� is given by Ref. 34. The inclusion of proton concentra-tion is required to capture the effect of nitrogen blanketing in the ANCH, which prevents hydrogen from reaching the catalyst layer tosupply protons for the reaction. The cathode exchange current den-sity is proportional to the square root of the local proton activity atthe cathode catalyst layer and the proton activity in the cathodecatalyst layer depends on the concentration of protons dissolved inthe aqueous phase in the membrane, which is proportional to thesquare root of the hydrogen pressure at the anode membrane surfacefor low PH2
;35 therefore, we approximate this relationship with ahyperbolic tangent function
ownloaded 22 Sep 2010 to 141.212.134.235. Redistribution subject to E
� cHca,mb+
Cref,H+��H+
= KH2tanh�100
cH2,an,mb
cref,H2
� �21�
The constant KH2is absorbed into the reference current density
io,ref,ca. At the limit, when the hydrogen concentration is zero, theproton activity at the anode drops to zero. Thus, when the anode issubjected to local fuel starvation, the hydrogen partial pressuredrops; hence, the proton concentration in the cathode decreases. Fur-thermore, the membrane electrolyte conductivity also decreases dueto lower contribution from the proton conduction in the bulk phaseakin to increasing electrolyte resistance due to decreasing ionicconcentration.32 The overall reduction of proton activity at the cath-ode ultimately leads to a drop in the local current density near thedead-ended exit of the anode. For constant load current �galvano-static� conditions, as the power production near the outlet shutsdown, the current density increases near the anode inlet, where themembrane is relatively dry, which may lead to higher losses andincreased temperature.
Similarly, for the anode side
act,an�y� =RT
�a,anFa sinh� kunitsifc�y� + iloss
2io,an�y� � �22�
where the anode exchange current density is
io,an = io,ref,an� cH2,an,mb
Cref,H2
��H2
exp�− Ec
R� 1
T−
1
T0�� �23�
The membrane resistance is calculated as follows
mb�y� =kunitsifc�y��mb
�mb��mb,T�tanh�100cH2,an,mb/Cref,H2�
�24�
Again, the hyperbolic tangent is used to approximate the relation-ship between conductivity and proton concentration35 and to reflectthe effect of increasing electrolyte resistance due to decreasing ionconcentration.32 The membrane conductivity �mb��mb,T� is a func-tion of water content using the standard relationship from Springeret al.36
Finally, the GDL and contact resistances are lumped into RGDLfor the ohmic loss term
GDL�y� = kunitsifc�y�RGDL �25�
The voltage model was tuned using flow-through data from the FCthen compared with the experimental voltage degradation rates un-der dead-ended operating conditions. For model tuning with flow-through data, it is assumed that the membrane is fully humidified��y� = ��T,a = 1�, where ��T,a = 1� can be found in Ref. 37, andthe effects of GDL and cathode catalyst layer flooding are ignoreddue to the low current density operation.
Along the channel distributions, because the oxygen partial pres-sure in the CA CH is not presently considered as one of the dynamicstates in the model, it is calculated simultaneously with the currentdensity distribution ifc�y� �A/cm−2� from the cathode inlet pressureand SR using
PO2,ca,mb�y� = PO2,ca,in −RT
4F� ifc�y�hm
+ifc�y��GDL
DO2,eff
+ �0
yifc�y�
uca,inhca,chdy��wca,ch + wca,rib�
�wca,ch��26�
where hca,ch is the CA CH height, wca,ch is the CA CH width, andwca,rib is the cathode rib width. hm is the interfacial mass-transfercoefficient,31 and uca,in is the cathode inlet gas velocity �assumedconstant along the length of the CA CH for simplicity�
CS license or copyright; see http://www.ecsdl.org/terms_use.jsp

B1090 Journal of The Electrochemical Society, 157 �7� B1081-B1093 �2010�B1090
D
uca,in =SRcaIfc�wca,ch + wca,rib�Lca,ch�RT�
�4F�AfcPO2,ca,in�hca,chwca,ch��27�
where the partial pressure of oxygen at the cathode inlet is given byPO2,ca,in = OMFca,in�Pca,in − Pv,ca,in�. Pca,in is the cathode inlet pres-sure, Pv,ca,in is the cathode inlet vapor pressure, and OMFca,in= 0.21 is the oxygen molar fraction. SRca is the cathode stoichiom-etry.
The cathode vapor pressure along the length of the channel iscalculated similarly
PH2O,ca�y� � min�Psat�T�,PH2O,ca,in
+RT
4F�0
yifc�y�
uca,inhca,chdy
�wca,ch + wca,rib��wca,ch�
� �28�
This equation actually needs +�nH2O,crs� y�dy to be correct, but thenit becomes difficult to solve for the steady-state cathode vapor dis-tribution analytically. At high cathode SR, this should not be a prob-lem, but it may affect the O2 distribution in low SR; however, thisstill should be a second order effect compared to variations in theanode.
The AN CH hydrogen concentration is propagated to the mem-brane surface assuming a simple diffusion model
cH2,an,mb�y� =xH2
�y�Pan,ch
RT−
ifc�y�2F
�GDL
DH2,eff
�wan,ch + wan,rib�wan,ch
�29�
based on the effective diffusivity DH2,eff = DeffDH2,N2.38
Nitrogen crossover rate.— Kocha et al.4 reported a large rangeof nitrogen permeability, over 1 order of magnitude. The permeationincreases with both membrane water content and temperature. Tem-perature has a larger effect on permeability when the membrane iswell hydrated. In this case, the permeability can change by a factorof 2–5 over the normal range of operating temperatures 30–60°C.The nitrogen permeation model includes the effects of membranewater content and temperature39
KN2�T,�mb� = �N2
�0.0295 + 1.21fv − 1.93fv2� � 10−14
� exp�EN2
R� 1
Tref−
1
T�� �30�
where EN2= 24,000 J mol−1, Tref = 303, R is the universal gas
constant, and fv is the volume fraction of water in the membranegiven by
fv =�mbVw
Vmb + �mbVw�31�
where Vmb = EW/ mb,dry is the dry membrane volume, equivalentweight divided by density, and Vw is the molar volume of water. �mbis the membrane water content.
A change in permeability could account for the different nitrogenaccumulation rates observed via different voltage drop rates, assum-ing the voltage degradation is caused by nitrogen accumulation. Thecurrent density would tend to shift toward the inlet, where the mem-brane is dry and has lower proton conductivity; hence, there wouldbe increased resistive losses when N2 accumulates in the end of thechannel.
Modeling Results
The PDE �Eq. 1� is discretized using a central difference in spaceinto N = 50 sections and solved using an ode solver. The AN CHmodel is solved using MATLAB “ode15s,” which supports differen-tial algebraic equations of the form
ownloaded 22 Sep 2010 to 141.212.134.235. Redistribution subject to E
Mz = f�z� �32�
where z = �xN2,an,xH2O,an,�mb,ifc,Ecell�T, M = diag�IN,IN,IN,0N,0�,and IN is the N � N identity matrix.
Three simulation plots are shown in Fig. 8, 10, and 11, corre-sponding to operating conditions 3, 5, and 6, respectively. Theseportions of data are contained within the large data sets shown inFig. 3 and 4. The first two data sets are chosen to match the modelassumptions of humidified channel conditions but no channel liquidwater plugging. The third condition shows some flooding and henceerror in the model prediction of voltage, but the overall dynamicvoltage behavior is captured quite well by the model ignoring theoffset. The first plot in Fig. 8 corresponding to condition 3 shows themeasured and predicted voltage in the top subplot and the GC mea-surement and simulated mole fraction at the sampling location in thebottom subplot. The model agrees very well with the data at thisoperating condition because no AN CH liquid water accumulationwas observed during this period. Figure 9 shows the time evolution
0 500 1000 1500 2000 2500 3000 3500
0.45
0.5
0.55
0.6
Voltage
0 500 1000 1500 2000 2500 3000 35000
0.2
0.4
0.6
0.8
1
Time (s)
MoleFraction
xH2
xN2
xH2model
xN2model
xH2O model
modeldata
Figure 8. �Color online� Operating condition 3 �i0.6 _ T65 _ SR2 _ RH60�shows very good results with model matching because the assumption ofnonwater plugging conditions in the channels is satisfied.
0 0.1 0.2 0.3 0.4 0.5 0.6 0.7 0.8 0.9 12
4
6
8
10
12
λm
b
0 0.1 0.2 0.3 0.4 0.5 0.6 0.7 0.8 0.9 10
0.5
1
xH
2
0 0.1 0.2 0.3 0.4 0.5 0.6 0.7 0.8 0.9 10
0.5
1
Fractional Channel Length
ifc
(Acm
−2)
t=1700
t=2000
t=2400
Figure 9. �Color online� The first subplot shows a snapshot of the membranewater content along the length of the channel for three times, as shown inFig. 8; after a purge, midcycle, and before the next purge. The second sub-plot shows the hydrogen mole fraction along the length of the channel. Thefinal subplot shows the current density distributions. The front is fully de-veloped at t = 2400 s, leading to hydrogen starved region covering nearly20% of the channel.
CS license or copyright; see http://www.ecsdl.org/terms_use.jsp
B1091Journal of The Electrochemical Society, 157 �7� B1081-B1093 �2010� B1091
D
of the hydrogen mole fraction distribution and membrane water con-tent over a purge cycle. Three snapshots of the distributions, corre-sponding to t = 1700 s, t = 2000 s, and t = 2400 s, from the thirdcycle in Fig. 8 are shown. The “corner” in the voltage trace at t= 2000 s, where the rate of voltage degradation increases, indicatesthat a sufficient amount of nitrogen has accumulated in the channelto create a stratified front and a hydrogen starved region develops atthe outlet. Finally, at t = 2400 s, the nitrogen front has evolved tocover nearly 20% of the AN CH. At this time, the effect of nitrogenblanketing is clear as the current density �the dashed-dotted line inthe third subplot� is shifted.
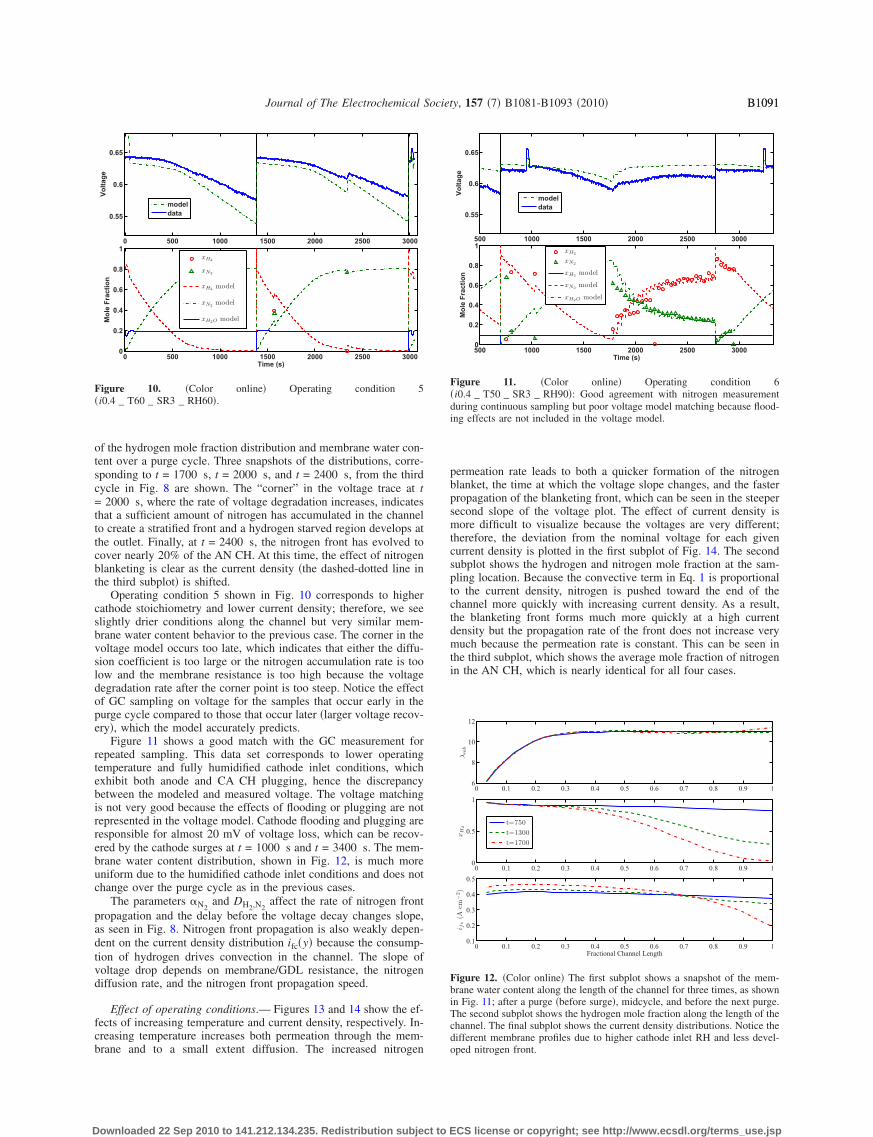
Operating condition 5 shown in Fig. 10 corresponds to highercathode stoichiometry and lower current density; therefore, we seeslightly drier conditions along the channel but very similar mem-brane water content behavior to the previous case. The corner in thevoltage model occurs too late, which indicates that either the diffu-sion coefficient is too large or the nitrogen accumulation rate is toolow and the membrane resistance is too high because the voltagedegradation rate after the corner point is too steep. Notice the effectof GC sampling on voltage for the samples that occur early in thepurge cycle compared to those that occur later �larger voltage recov-ery�, which the model accurately predicts.
Figure 11 shows a good match with the GC measurement forrepeated sampling. This data set corresponds to lower operatingtemperature and fully humidified cathode inlet conditions, whichexhibit both anode and CA CH plugging, hence the discrepancybetween the modeled and measured voltage. The voltage matchingis not very good because the effects of flooding or plugging are notrepresented in the voltage model. Cathode flooding and plugging areresponsible for almost 20 mV of voltage loss, which can be recov-ered by the cathode surges at t = 1000 s and t = 3400 s. The mem-brane water content distribution, shown in Fig. 12, is much moreuniform due to the humidified cathode inlet conditions and does notchange over the purge cycle as in the previous cases.
The parameters �N2and DH2,N2
affect the rate of nitrogen frontpropagation and the delay before the voltage decay changes slope,as seen in Fig. 8. Nitrogen front propagation is also weakly depen-dent on the current density distribution ifc�y� because the consump-tion of hydrogen drives convection in the channel. The slope ofvoltage drop depends on membrane/GDL resistance, the nitrogendiffusion rate, and the nitrogen front propagation speed.
Effect of operating conditions.— Figures 13 and 14 show the ef-fects of increasing temperature and current density, respectively. In-creasing temperature increases both permeation through the mem-brane and to a small extent diffusion. The increased nitrogen
0 500 1000 1500 2000 2500 3000
0.55
0.6
0.65
Voltage
0 500 1000 1500 2000 2500 30000
0.2
0.4
0.6
0.8
1
Time (s)
MoleFraction
xH2
xN2
xH2model
xN2model
xH2O model
modeldata
Figure 10. �Color online� Operating condition 5�i0.4 _ T60 _ SR3 _ RH60�.
ownloaded 22 Sep 2010 to 141.212.134.235. Redistribution subject to E
permeation rate leads to both a quicker formation of the nitrogenblanket, the time at which the voltage slope changes, and the fasterpropagation of the blanketing front, which can be seen in the steepersecond slope of the voltage plot. The effect of current density ismore difficult to visualize because the voltages are very different;therefore, the deviation from the nominal voltage for each givencurrent density is plotted in the first subplot of Fig. 14. The secondsubplot shows the hydrogen and nitrogen mole fraction at the sam-pling location. Because the convective term in Eq. 1 is proportionalto the current density, nitrogen is pushed toward the end of thechannel more quickly with increasing current density. As a result,the blanketing front forms much more quickly at a high currentdensity but the propagation rate of the front does not increase verymuch because the permeation rate is constant. This can be seen inthe third subplot, which shows the average mole fraction of nitrogenin the AN CH, which is nearly identical for all four cases.
500 1000 1500 2000 2500 3000
0.55
0.6
0.65
Voltage
500 1000 1500 2000 2500 30000
0.2
0.4
0.6
0.8
1
Time (s)
MoleFraction
modeldata
xH2
xN2
xH2model
xN2model
xH2O model
Figure 11. �Color online� Operating condition 6�i0.4 _ T50 _ SR3 _ RH90�: Good agreement with nitrogen measurementduring continuous sampling but poor voltage model matching because flood-ing effects are not included in the voltage model.
0 0.1 0.2 0.3 0.4 0.5 0.6 0.7 0.8 0.9 16
8
10
12
λm
b
0 0.1 0.2 0.3 0.4 0.5 0.6 0.7 0.8 0.9 10
0.5
1
xH
2
0 0.1 0.2 0.3 0.4 0.5 0.6 0.7 0.8 0.9 10.1
0.2
0.3
0.4
0.5
Fractional Channel Length
ifc
(Acm
−2)
t=750
t=1300
t=1700
Figure 12. �Color online� The first subplot shows a snapshot of the mem-brane water content along the length of the channel for three times, as shownin Fig. 11; after a purge �before surge�, midcycle, and before the next purge.The second subplot shows the hydrogen mole fraction along the length of thechannel. The final subplot shows the current density distributions. Notice thedifferent membrane profiles due to higher cathode inlet RH and less devel-oped nitrogen front.
CS license or copyright; see http://www.ecsdl.org/terms_use.jsp

B1092 Journal of The Electrochemical Society, 157 �7� B1081-B1093 �2010�B1092
D
Conclusions
The one-dimensional AN CH model presented in this paper isable to capture and explain the observed two-sloped voltage dropbetween purges in a PEMFC with DEA. The model shows verygood results when the assumption of nonwater plugging conditionsare met in the channels. The evolution of a nitrogen blanketing front,which leads to a hydrogen depleted region in the AN CH, explainsthe voltage loss. Although distributed current densitymeasurements40,41 were not acquired, we can observe the effect ofmass accumulation on current density distribution through the cellpotential by measuring the terminal voltage. Specifically, the massaccumulation affects both the rate of voltage drop and the time atwhich the steeper slope begins.
The ability of the model to predict voltage is limited because theaccumulation of liquid water in the AN CH �plugging� and cathodecatalyst layer �flooding� are not included in the model, but the volt-age degradation and nitrogen accumulation rates match well whenthe assumption of nonflooding and nonplugging conditions arevalid. In the future, we plan to incorporate these effects into themodel. The effects of nitrogen and liquid water accumulation can beparameterized by utilizing the measurement of liquid water fromneutron imaging along with the GC measurements for combinationsof wet and dry channel conditions. The data set corresponding tooperating condition 6, shown Fig. 11, could be used for parameter-
100 200 300 400 500 600 700 8000.35
0.4
0.45
0.5
0.55
Voltage
100 200 300 400 500 600 700 8000
0.5
1
xN
2sa
mple
100 200 300 400 500 600 700 8000
0.1
0.2
0.3
0.4
xN
2aver
age
Time (s)
T=45T=55T=65T=75
Figure 13. �Color online� Model temperature effects.
100 200 300 400 500 600 700 800
−0.15
−0.1
−0.05
0
∆V
oltage
100 200 300 400 500 600 700 8000
0.5
1
xN
2sa
mple
100 200 300 400 500 600 700 8000
0.1
0.2
0.3
0.4
xN
2aver
age
Time (s)
i=0.2i=0.4i=0.6i=0.9
Figure 14. �Color online� Model current density effects.
ownloaded 22 Sep 2010 to 141.212.134.235. Redistribution subject to E
izing the liquid water effect using the model of nitrogen accumula-tion, which is calibrated for drier �nonflooding/plugging� conditions.
Acknowledgments
This work was supported by The National Science Foundationthrough CBET-0932509 and the National Institute for Standards andTechnology Center for Neutron Research �NCNR�. James Marcickiassisted with the data collection. The authors are also grateful for thehelp they received collecting and analyzing data from Daniel S.Hussey and David L. Jacobson at the NCNR.
University of Michigan assisted in meeting the publication costs of thisarticle.
Appendix: Nomenclature and Constants
GC calibration.— The injection port inside the GC was maintained at 100°C andthe column at 30°C. A TCD was used for gas detection. The TCD was operated at100°C and 90 mA current.
Two mass flow controllers were used to create dry gas mixtures of a known�H2/N2� concentration in the AN CH for the calibration of the GC detector. Calibrationdata were collected with the AN CH at 4.5 psig operating pressure and a nominaltemperature of T = 60°C. A six-point calibration was used, with five samples repeatedfor each point. Figure 15 demonstrates the linearity of the GC measurement. The de-tector is much more sensitive to nitrogen due to the choice of carrier gas. The averageN2 response is 1,163,897 �area units/xN2
�, and the average hydrogen response is 24,416�area units/xH2
�. Because the measurement of H2O was not possible during FC opera-tion, we assume that the concentration of vapor in the anode is equal to the saturationvalue and hence only temperature-dependent.
References1. A. Karnik, J. Sun, and J. Buckland, in American Control Conference, American
Automatic Council �AACC�, p. 6 �2006�.2. R. K. Ahluwalia and X. Wang, J. Power Sources, 177, 167 �2008�.3. E. A. Müller, F. Kolb, L. Guzzella, A. G. Stefanopoulou, and D. A. McKay, J. Fuel
Cell Sci. Technol., 7, 021013 �2010�.4. S. S. Kocha, J. D. Yang, and J. S. Yi, AIChE J., 52, 1916 �2006�.5. A. Z. Weber, J. Electrochem. Soc., 155, B521 �2008�.6. J. B. Siegel, D. A. McKay, A. G. Stefanopoulou, D. S. Hussey, and D. L. Jacobson,
J. Electrochem. Soc., 155, B1168 �2008�.7. C. A. Reiser, L. Bregoli, T. W. Patterson, J. S. Yi, J. D. Yang, M. L. Perry, and T.
D. Jarvi, Electrochem. Solid-State Lett., 8–6, A273 �2005�.8. J. P. Meyers and R. M. Darling, J. Electrochem. Soc., 153, A1432 �2006�.9. R. Borup, J. Meyers, B. Pivovar, Y. S. Kim, R. Mukundan, N. Garland, D. Myers,
M. Wilson, F. Garzon, D. Wood, et al., Chem. Rev. (Washington, D.C.), 107, 3904�2007�.
10. E. Kimball, T. Whitaker, Y. G. Kevrekidis, and J. B. Benziger, AIChE J., 54, 1313�2008�.
11. C. H. Woo and J. Benziger, Chem. Eng. Sci., 62, 957 �2007�.12. E. Kumbur, K. Sharp, and M. Mench, J. Power Sources, 161, 333 �2006�.13. F. Y. Zhang, X. G. Yang, and C. Y. Wang, J. Electrochem. Soc., 153, A225 �2006�.14. J. Benziger, AIChE J., 55, 3034 �2009�.15. L. Dumercy, M.-C. Pra, R. Glises, D. Hissel, S. Hamandi, F. Badin, and J.-M.
Kauffmann, Fuel Cells, 4, 352 �2004�.16. W. Baumgartner, P. Parz, S. D. Fraser, E. Wallnöfer, and V. Hacker, J. Power
Sources, 182, 413 �2008�.17. S. Hikita, F. Nakatani, K. Yamane, and Y. Takagi, JSAE Rev., 23, 177 �2002�.18. H. Li, Y. Tang, Z. Wang, Z. Shi, S. Wu, D. Song, J. Zhang, K. Fatih, J. Zhang, H.
Wang, et al., J. Power Sources, 178, 103 �2008�.19. D. Hussey, D. Jacobson, and M. Arif, in Proceedings of the ASME International
Conference on Fuel Cell Science, Engineering and Technology, ASME �2007�.
0 0.2 0.4 0.6 0.8 10
0.5
1
1.5
2
2.5
3x 10⁴
Hydrogen molar fraction xH2
H2AreaUnits(−)
0 0.2 0.4 0.6 0.8 10
2
4
6
8
10
12x 105
Nitrogen molar fraction xN2
N2AreaUnits(−)
Figure 15. �Color online� GC calibration data.
CS license or copyright; see http://www.ecsdl.org/terms_use.jsp
B1093Journal of The Electrochemical Society, 157 �7� B1081-B1093 �2010� B1093
D
20. D. Kramer, J. Zhang, R. Shimoi, E. Lehmann, A. Wokaun, K. Shinohara, and G. G.Scherer, Electrochim. Acta, 50, 2603 �2005�.
21. S. Basu, C.-Y. Wang, and K. S. Chen, J. Electrochem. Soc., 156, B748 �2009�.22. R. Fluckiger, S. A. Freunberger, D. Kramer, A. Wokaun, G. G. Scherer, and F. N.
Buchi, Electrochim. Acta, 54, 551 �2008�.23. P. Chang, G.-S. Kim, K. Promislow, and B. Wetton, J. Comput. Phys., 223, 797
�2007�.24. N. R. Amundson, T.-W. Pan, and V. I. Paulsen, AIChE J., 49, 813 �2003�.25. T. Berning and N. Djilali, J. Electrochem. Soc., 150, A1589 �2003�.26. S. Ge, X. Li, B. Yi, and I.-M. Hsing, J. Electrochem. Soc., 152, A1149 �2005�.27. M. Adachi, T. Navessin, Z. Xie, B. Frisken, and S. Holdcroft, J. Electrochem. Soc.,
156, B782 �2009�.28. P. W. Majsztrik, M. B. Satterfield, A. B. Bocarsly, and J. B. Benziger, J. Membr.
Sci., 301, 93 �2007�.29. D. A. McKay, J. B. Siegel, W. Ott, and A. G. Stefanopoulou, J. Power Sources,
178, 207 �2008�.30. R. P. O’Hayre, S.-W. Cha, W. Colella, and F. B. Prinz, Fuel Cell Fundamentals,
John Wiley & Sons, Hoboken, NJ �2006�.31. M. M. Mench, Fuel Cell Engines, John Wiley & Sons, Hoboken, NJ �2008�.
ownloaded 22 Sep 2010 to 141.212.134.235. Redistribution subject to E
32. J. S. Newman, Electrochemical Systems, 2nd ed., Prentice Hall, Englewood Cliffs,NJ �1991�.
33. F. Barbir, PEM Fuel Cells: Theory and Practice, Elsevier, Burlington, MA �2005�.34. D. M. Bernardi and M. W. Verbrugge, J. Electrochem. Soc., 139, 2477 �1992�.35. A. Katsaounis, S. Balomenou, D. Tsiplakides, M. Tsampas, and C. Vayenas, Elec-
trochim. Acta, 50, 5132 �2005�.36. T. Springer, T. Zawodzinski, and S. Gottesfeld, J. Electrochem. Soc., 138, 2334
�1991�.37. J. B. Siegel, S. Yesilyurt, and A. G. Stefanopoulou, in Proceedings of Fuel Cell
2009 Seventh International Fuel Cell Science, Engineering and Technology Con-ference, ASME, p. 439 �2009�.
38. J. Nam and M. Kaviany, Int. J. Heat Mass Transfer, 46, 4595 �2003�.39. R. Ahluwalia and X. Wang, J. Power Sources, 171, 63 �2007�.40. H. Ju and C. Wang, J. Electrochem. Soc., 151, A1954 �2004�.41. S. A. Freunberger, M. Reum, J. Evertz, A. Wokaun, and F. N. Buchi, J. Electro-
chem. Soc., 153, A2158 �2006�.42. R. Taylor and R. Krishna, Multicomponent Mass Transfer, John Wiley & Sons,
New York �1993�.
CS license or copyright; see http://www.ecsdl.org/terms_use.jsp