Journal of Sound and Vibration - s3-eu-west-1.amazonaws.com
18
A transient tribodynamic approach for the calculation of internal combustion engine piston slap noise N. Dolatabadi, B. Littlefair, M. De la Cruz, S. Theodossiades n,1 , S.J. Rothberg, H. Rahnejat Wolfson School of Mechanical and Manufacturing Engineering, Loughborough University, Loughborough LE113TU, UK article info Article history: Received 13 November 2014 Received in revised form 24 March 2015 Accepted 15 April 2015 Handling Editor: P. Joseph Available online 27 May 2015 abstract An analytical/numerical methodology is presented to calculate the radiated noise due to internal combustion engine piston impacts on the cylinder liner through a film of lubricant. Both quasi-static and transient dynamic analyses coupled with impact elasto- hydrodynamics are reported. The local impact impedance is calculated, as well as the transferred energy onto the cylinder liner. The simulations are verified against experi- mental results for different engine operating conditions and for noise levels calculated in the vicinity of the engine block. Continuous wavelet signal processing is performed to identify the occurrence of piston slap noise events and their spectral content, showing good conformance between the predictions and experimentally acquired signals. & 2015 The Authors. Published by Elsevier Ltd. This is an open access article under the CC BY license (http://creativecommons.org/licenses/by/4.0/). 1. Introduction Internal combustion (IC) engines have been extensively deployed in various configurations for transportation (vehicles, ships, motorcycles etc.). There have been ever increasing concerns with regard to their radiated noise levels, fuel consumption and emissions. These concerns, together with the growing competition have forced industry to increase investment in research and development. As the parasitic losses of piston cylinder system account for 6–9 percent of fuel consumption [1], including friction and errant dynamics, their investigation has been regarded as beneficial. One effect of errant dynamic behaviour is the induced noise, which is regarded as a sign of poor quality. Piston slap due to secondary piston inertial dynamics is one such noise propagating concern. The generated noise is due to piston impact on the cylinder liner, which has been a problem for the research community for a long time. The noise generation mechanism can be analysed in three phases: (i) vibration excitation at the source, (ii) energy transfer through a structural path and (iii) noise radiation from the vibrating surfaces [2]. In vehicular powertrains, noise can originate from processes and associated components, such as combustion, piston slap, fuel injection, gear teeth contacts, oil pump and valve impacts. Fig. 1 shows the contributions to the total engine noise levels from the aforementioned noise sources for a three-cylinder, Contents lists available at ScienceDirect journal homepage: www.elsevier.com/locate/jsvi Journal of Sound and Vibration http://dx.doi.org/10.1016/j.jsv.2015.04.014 0022-460X/& 2015 The Authors. Published by Elsevier Ltd. This is an open access article under the CC BY license (http://creativecommons.org/licenses/by/4.0/). Abbreviations: ATS, Anti-thrust side; ABDC, After bottom dead centre; ATDC, After top dead centre; BDC, Bottom dead centre; BBDC, Before bottom dead centre; BTDC, Before top dead centre; COG, Centre of gravity; CWS, Continuous wavelet spectrum; EHL, Elasto-hydrodynamic lubrication; EVC, Exhaust valve closure; EVO, Exhaust valve opening; IVC, Inlet valve closure; IVO, Inlet valve opening; NVH, Noise, Vibration and Harshness; SPL, Sound pressure level; SPL T , Total sound pressure level; TDC, Top dead centre; TS, Thrust side n Corresponding author. E-mail address: [email protected] (S. Theodossiades). 1 Research data for this paper are available on request from Dr. Stephanos Theodossiades ([email protected]). Journal of Sound and Vibration 352 (2015) 192–209
Transcript of Journal of Sound and Vibration - s3-eu-west-1.amazonaws.com

Contents lists available at ScienceDirect
Journal of Sound and Vibration
Journal of Sound and Vibration 352 (2015) 192–209
http://d0022-46(http://c
Abbrecentre;valve cllevel; S
n CorrE-m1 Re
journal homepage: www.elsevier.com/locate/jsvi
A transient tribodynamic approach for the calculation ofinternal combustion engine piston slap noise
N. Dolatabadi, B. Littlefair, M. De la Cruz, S. Theodossiades n,1, S.J. Rothberg,H. RahnejatWolfson School of Mechanical and Manufacturing Engineering, Loughborough University, Loughborough LE11 3TU, UK
a r t i c l e i n f o
Article history:Received 13 November 2014Received in revised form24 March 2015Accepted 15 April 2015
Handling Editor: P. Josephtransferred energy onto the cylinder liner. The simulations are verified against experi-
Available online 27 May 2015
x.doi.org/10.1016/j.jsv.2015.04.0140X/& 2015 The Authors. Published by Elsevreativecommons.org/licenses/by/4.0/).
viations: ATS, Anti-thrust side; ABDC, After bBTDC, Before top dead centre; COG, Centre oosure; EVO, Exhaust valve opening; IVC, InlePLT, Total sound pressure level; TDC, Top deaesponding author.ail address: [email protected] (S.search data for this paper are available on r
a b s t r a c t
An analytical/numerical methodology is presented to calculate the radiated noise due tointernal combustion engine piston impacts on the cylinder liner through a film oflubricant. Both quasi-static and transient dynamic analyses coupled with impact elasto-hydrodynamics are reported. The local impact impedance is calculated, as well as the
mental results for different engine operating conditions and for noise levels calculated inthe vicinity of the engine block. Continuous wavelet signal processing is performed toidentify the occurrence of piston slap noise events and their spectral content, showinggood conformance between the predictions and experimentally acquired signals.& 2015 The Authors. Published by Elsevier Ltd. This is an open access article under the CC
BY license (http://creativecommons.org/licenses/by/4.0/).
1. Introduction
Internal combustion (IC) engines have been extensively deployed in various configurations for transportation (vehicles,ships, motorcycles etc.). There have been ever increasing concerns with regard to their radiated noise levels, fuelconsumption and emissions. These concerns, together with the growing competition have forced industry to increaseinvestment in research and development. As the parasitic losses of piston�cylinder system account for 6–9 percent of fuelconsumption [1], including friction and errant dynamics, their investigation has been regarded as beneficial.
One effect of errant dynamic behaviour is the induced noise, which is regarded as a sign of poor quality. Piston slap dueto secondary piston inertial dynamics is one such noise propagating concern. The generated noise is due to piston impact onthe cylinder liner, which has been a problem for the research community for a long time. The noise generation mechanismcan be analysed in three phases: (i) vibration excitation at the source, (ii) energy transfer through a structural path and(iii) noise radiation from the vibrating surfaces [2]. In vehicular powertrains, noise can originate from processes andassociated components, such as combustion, piston slap, fuel injection, gear teeth contacts, oil pump and valve impacts.Fig. 1 shows the contributions to the total engine noise levels from the aforementioned noise sources for a three-cylinder,
ier Ltd. This is an open access article under the CC BY license
ottom dead centre; ATDC, After top dead centre; BDC, Bottom dead centre; BBDC, Before bottom deadf gravity; CWS, Continuous wavelet spectrum; EHL, Elasto-hydrodynamic lubrication; EVC, Exhaustt valve closure; IVO, Inlet valve opening; NVH, Noise, Vibration and Harshness; SPL, Sound pressured centre; TS, Thrust side
Theodossiades).equest from Dr. Stephanos Theodossiades ([email protected]).

List of symbols
Ar surface area of noise radiating sourceAv surface area of impacted structurea distance between the pin-bore and top of
piston skirtb distance between the piston centre of gravity
and top of piston skirtC nominal clearance between piston and
cylinder linerca wave propagation speed in aird combined effect of instantaneous clearances;
et and ebdCOG offset between the piston centre of gravity and
the pin-boredp offset between point of action of gas force and
the pin-boreeb eccentricity at the bottom of piston skirtet eccentricity at the top of piston skirtF average lubricant reaction between two con-
secutive time stepsFf piston�cylinder conjunctional frictionFG gas forceFhyd lubricant reactionFL connecting rod forceFpin;x pin reaction along the x coordinateFpin;z pin reaction along the z coordinateFt lateral (side) force acting on the pistonh lubricant film thicknessht thickness of the structureIpis piston inertiaL piston skirt heightLw sound power levelMf viscous friction momentMhyd viscous reaction moment due to loadMs tilting moment due to pin or crankshaft offsetmpin mass of piston pinmpis mass of piston
P elasto-hydrodynamic pressurePa acoustic powerPref reference acoustic powerPv impact powerR radius of piston crownRb distance from the block surfacer piston profileS overall skirt deformations0 acoustic field characteristict timeUav speed of entraining motion of the lubricantVav lubricant side leakage velocityv lubricant film squeeze velocityvr surface vibration velocityvv impact velocityW transferred energyx coordinate along the axis of the cylinderY impact mobilityZ impact impedancez coordinate transverse to the axis of the
cylinder
Greek letters
η lubricant dynamic viscosityηa=v structural attenuation ratioη0 atmospheric dynamic viscosity of the
lubricantΘ lubricant temperatureΘ0 bulk oil temperatureθ crank angleρ lubricant densityρa density of airρv density of the impacted structureρ0 atmospheric density of lubricantσ surface radiation efficiencyϕ connecting rod obliquity angle
N. Dolatabadi et al. / Journal of Sound and Vibration 352 (2015) 192–209 193
water-cooled gasoline engine at a speed of 2500 rpm [2]. As can be seen, combustion and piston slaps are significantcontributors with their cumulative share representing about 80 percent of the total engine noise output [2]. Piston slaprepresents the most significant mechanical noise source, comparable with the combustion-induced noise [2–4].
Piston slap occurs due to the differing load conditions between the piston skirt and the cylinder wall. The type of contactis determined by the regime of lubrication, which can be hydrodynamic, elastohydrodynamic, mixed, or even boundary,depending on the prevailing kinematics/loading, geometry and lubricant rheological state [5]. The noise transfer mechanismfrom the piston assembly to the surface of the engine block is shown in Fig. 2. Piston slap depends on the variations of thecylinder pressure and the inertia of the piston assembly. The vibrations generated reach the engine block through thecylinder liner. Surface vibrations of the block induce sound propagation into the environment. The forces acting on thepiston assembly originate from three main sources: (a)- the cylinder pressure, (b)- component inertia and (c)- the lubricantfilm. Numerous studies have been reported in modelling the cylinder pressure analytically [6,7], whilst this is commonlymeasured for piston-slap investigations [3,8,9]. Models describing piston dynamics usually exclude its tilting motionthrough piston pin rotation [10,11] or simply use constrained Lagrangian dynamics to include the component reactions dueto piston rotation [8,12]. Methodologies involving multibody dynamics and Finite Element Analysis (FEA) software, such asMSC ADAMS and NASTRAN, have been reported for the study of piston secondary motion [13–16].
In earlier studies of piston dynamics, the effects of lubrication were generally neglected [10,11]. Later, a coefficient offriction was included in the equations of motion to account for the frictional losses [17]. In order to add the effect oflubricant film damping, spring-damper arrangements in parallel and/or in series have been considered [12,18–20]. A moreaccurate representation of lubricant behaviour is obtained through the solution of Reynolds equations [15,16, 21]. Cho and

Fig. 1. Indicative noise contributions in a three-cylinder water-cooled gasoline engine [2].
Cylinder Block Vibration
Cylinder head
Piston-Liner Impact
Crankshaft VibrationCon-rod Vibration
Piston Inertia Force
Cylinder Pressure Gas Excitation Noise Radiation
Excitation Sources Vibration Generation Transfer Paths Noise Radiation
Fig. 2. Noise generation and transfer paths in an IC engine.
N. Dolatabadi et al. / Journal of Sound and Vibration 352 (2015) 192–209194
Moon [22] studied the conjunctional lubricant behaviour using a quasi-static approach, in which piston tilting motion wastaken into account, but the effect of lubricant squeeze velocity was neglected. McClure investigated the contact conditionsbetween the piston and the cylinder bore using a transient approach, including the thermo-elastic distortion of piston skirt[23]. In the transient solution of conjunctional pressure and film thickness, the squeeze action of the oil film was included.D'Agostino et al. [8] and Littlefair et al. [24] considered the piston-skirt deformation when estimating the oil film thickness,with the latter demonstrating very good agreement between the numerical predictions and ultrasonically measuredlubricant film thickness. They have all combined the oil film behaviour with piston dynamics (tribo-dynamics), forming amulti-physics study of the piston's secondary motion. Further studies have been reported with the variations in thelubrication regime during the full engine cycle taken into account, together with the piston-profile and the connecting rodeffects [6,8,23–25].
The above mentioned piston-liner contact tribo-dynamic models are employed to identify piston slap events, irrespectiveof the structural excitation, engine block response and sound quality (dB levels and frequency) perceived by the receiver[26]. In tribo-dynamics, the effect of sound power structural attenuation has been investigated for the cylinder liner and theengine block through modal analysis [18,20]. Structural analysis has been reported using FEA [14,22]. A direct relationshipwas established between the vibration levels of the engine block and the excitation force/surface velocities at the impactsites of the cylinder liner's inner surface [11,12]. The impact impedance has been used at each contact point between thepiston and the cylinder liner in order to predict the surface vibrations of the engine block. In some practical approaches, atransfer function has been established experimentally to describe the noise attenuation characteristics through the engineblock [9,19].
The current study presents the development of a novel numerical/analytical method to investigate internal combustionengine NVH with the main emphasis placed on the identification of piston slap events. The prediction of noise levels, impactcharacteristics and structural analysis of the engine block are the objectives, whereas in the authors' previous paper [26] thefocus was mainly on the number and location of events during the internal combustion engine cycle. The novel contributionof this paper lies in the integration of impact in elastohydrodynamic lubrication (EHL) with piston transient dynamics inorder to identify potential slap noise events. In this multi-physics framework, the conjunctional pressures generated and theoil film thickness variations are used to estimate the impact force and the squeeze film velocity. The localised impactimpedance is calculated to determine the energy transferred to the structure and successively to estimate the structuralattenuation factor used in the prediction of the sound power loss through the cylinder-block structure. The piston secondarymotion is correlated to the surface vibrations of the engine block and the latter are then used to calculate the radiated noise

N. Dolatabadi et al. / Journal of Sound and Vibration 352 (2015) 192–209 195
levels. The sound levels predicted by this method are suitable for comparison with experimentally measured noise levelsand quantification of the user/receiver's perception of noise at any location of interest from the engine. The methodology isvalidated against experimental measurements obtained from a single-cylinder Honda CRF 450 motocross motorbike highperformance normally aspirated gasoline engine. The good correlation between the numerical and experimental resultsverifies the developed method.
2. Piston dynamics
Fig. 3a shows the primary (axially reciprocating) and secondary (lateral and tilting) motions of the piston within thecylinder liner. Piston dynamics are commonly defined by piston eccentricities from its aligned orientation at the top andbottom of the skirt (et and eb), resulting from its secondary motion [5,21]. Piston eccentricities et ; eb are pistondisplacements from the centre-line of cylinder liner. L and R are the skirt length and piston crown radius, respectively. θis the crank angle, commencing from the top dead centre (TDC). The two sides of the cylinder wall are commonly referred asTS (thrust side) and ATS (anti-thrust side). In the combustion stroke, the piston initially impinges onto the thrust side ofthe liner.
Fig. 3a and b depicts the piston and pin free body diagrams. mpis, mpin and Ipis are the piston mass, pin mass and pistoncentroidal moment of inertia. The centre of gravity and excitation force offsets are at distances dCOG and dp in the lateraldirection with respect to the piston's centre-line and at distances b and a in the primary axial direction with respect to theupper surface of the skirt. ϕ is the connecting rod angle with respect to the cylinder axis. Inertial forces are represented bympis €x, mpis €z for the piston and mpin €x, mpin €z for the pin, respectively. Other forces in Fig. 3b are: the combustion force FG, thelubricant reaction Fhyd ¼∬ Pdxdz, the oil film viscous friction force Ff , the connecting rod force FL and the pin reaction forcesFpin;x and Fpin;z.
The secondary piston motion is related to its primary dynamics. This can be established in one of two alternativeapproaches: (i) a purely kinematic analysis or (ii) including inertial dynamics. In the former approach, the piston secondarymotion and the lubricant film load carrying capacity are ignored, when estimating the primary force. In the latter approach(inertial dynamics) these effects are considered. Thus, in the kinematics approach, the lateral resultant force acting on the
Fig. 3. (a) Piston secondary motions; (b) Piston and pin free-body diagrams.

Fig. 4. The flow chart for the transient dynamic model.
N. Dolatabadi et al. / Journal of Sound and Vibration 352 (2015) 192–209196

film
thic
knes
s (μm
)
, ,
, ,
, ,
, ,
Time-step 1
Time-step 2
Fig. 5. Film shape at time steps 1 and 2. Force and film thickness indicators at an arbitrary point (i,j) on the piston skirt are shown to represent the energycalculation.
N. Dolatabadi et al. / Journal of Sound and Vibration 352 (2015) 192–209 197
piston, Ft , can be calculated using the forces in the primary axial direction as:
Ft ¼ FGþmpis €xþmpin €xþFf� �
tan ϕ (1)
In order to include the effect of piston secondary motion and lubricant reaction using inertial dynamics, the set of equationsof motion (2) is iteratively solved, simultaneously with Reynolds equation [21,25]. Thus, the lateral force is obtained in amore realistic manner. The deviation between the results of methods (i) and (ii), when predicting the lateral force, is quitesmall at lower engine speeds. As the piston speed increases and inertial effects become significant, the aforementionedmethods yield divergent results. The evaluated lateral force from Eq. (2) is used hereinafter to calculate the lateral impactforce and approach velocity.
mpis 1�bL
� �þmpin 1�aL
� �mpis
bLþmpin
aL
IpisL þmpis a�bð Þ 1�a
L
� � � IpisL þmpis a�bð ÞbL
0@
1A €et
€eb
( )¼
FhydþFf tan ϕþFtMhydþMf þMs
( )(2)
Mhyd is the moment due to load capacity variation of the lubricant film Fhyd over the piston skirt area. Mf is the moment dueto the viscous friction of the lubricant film Ff . Ms represents the tilting moment due to pin or crankshaft offset, whichequates to: FGdp�mpis €xdCOG. It should be noted that the lubricant viscous friction and its generated moment are neglected inthe current study as their influence on the impact force is quite small, constituting less than 3 percent of the total impactforce [27].
The flow chart for the iterative solution of the equations of motion is presented in Fig. 4. LAM I and LAM II are thepredictor and corrector routines for the numerical solution. The simulation time corresponds to three engine cycles underall the operational conditions (sufficient to achieve steady state motion per engine cycle). The time step is fixed at 5 μs. Thelimit of convergence is set to 1 percent tolerance and applied accelerations of piston top and bottom surfaces (i.e. €et and €eb),which are the fastest changing system variables.
3. Effect of lubricant film
To include the effect of lubricated contact, the solution of Reynolds equation is required, with its general form being:
∂∂x
ρh3
η
∂P∂x
!þ ∂∂y
ρh3
η
∂P∂y
!¼ 12 Uav
∂∂x
ρhð ÞþVav∂∂y
ρhð Þþ ddt
ρhð Þ� �
(3)
where x is the direction of lubricant entrainment along the axial direction of the cylinder liner and y is the circumferentialdirection (if viewed as unwrapped). P and h are the generated pressure and lubricant film thickness, respectively. Thelubricant density, ρ, is a function of pressure [28].
ρ¼ ρ0 1þ 0:6� 10�9 � P
1þ1:7� 10�9 � P
!(4)
ρ0 is the atmospheric density at the average measured liner temperature. The liner temperature is chosen because a recentthermo-hydrodynamics numerical analysis by Morris et al. [29], using a control volume thermal-mixing method has shownthat the lubricant film temperature remains close to that of the liner surface, with only a small rise due to its viscous shearcompared with the surface temperature. The lubricant viscosity, η, is also a function of pressure and temperature, where η0is the lubricant atmospheric dynamic viscosity at the measured liner temperature. The viscosity variation with pressure is

≥
< 0
≥
< 0
TS fi
lm th
ickn
ess (
μm)
ATS
film
thic
knes
s (μm
)
TS p
ress
ure
(MPa
)
ATS
pre
ssur
e (M
Pa)
→
→
→
→
Fig. 6. Calculation of impact energy at the TS and ATS.
N. Dolatabadi et al. / Journal of Sound and Vibration 352 (2015) 192–209198
given by Roeland [30]:
η¼ η0eα (5)
where
α¼ 1P
ln η0þ9:67� � Θ�138
Θ0�138
� ��S01þ P
1:98� 108
� �Z
�1
( )
S0 and Z are constants, independent of temperature and pressure. Θ is the temperature (in K). Θ0 is the bulk oil temperature.Uav is the speed of entraining motion of the lubricant (half the piston sliding velocity). No side leakage flow is assumed(Vav ¼ 0). Therefore, the second term on the right hand side of Eq. (3) is omitted from the computations. The Reynoldsequation can be solved in two different ways: (i)- quasi-static and (ii)- transient. In a quasi-static solution, the lubricant filmtime history is ignored (the third term on the right-hand side of Eq. (3) is omitted). In a transient solution, the time historyof the lubricant film thickness is retained. The instantaneous skirt profile and stiffness are updated in the film thicknessestimation at each time step (corresponding to a given crank angle position), using Eq. (6). Here, C is the nominal clearancebetween the piston and the cylinder liner surface, rðx; yÞ is the piston profile, d x; y; tð Þ represents the combined effect of theinstantaneous clearances et and eb (which are outputs of the system dynamics) and S x; y; tð Þ indicates the overall skirtdeflection [23–25]. In a quasi-static solution, the term d x; y; tð Þ is also neglected, as piston dynamics are not taken into

N. Dolatabadi et al. / Journal of Sound and Vibration 352 (2015) 192–209 199
account.
h x; yð Þ ¼ Cþr x; yð Þþd x; y; tð ÞþS x; y; tð Þ (6)
4. Local impact energy
The advantage of employing energy-based methods is the adherence to the principle of conservation of energy throughthe impact process [31]. Previous piston slap research has either excluded the role of lubricated impact or employed spring-damper lumped parameter models for the energy transfer mechanisms [12]. In the current study, an EHL solution is utilisedfor the calculation of the transferred energy through the lubricant film caused by the piston secondary motion. Additionally,piston skirt deformation effects are considered, thus reducing the transferred energy (as some of the impact energy isconsumed in localised deformation). Impact impedance calculations are then applied to the energy distribution across thediscretised piston skirt in order to estimate the energy transferred to the cylinder liner.
The tribodynamic equations provide the lubricant film shape and the generated contact pressure distribution acting onthe skirt area at each time step (crank angle position). The parameters affecting the transferred energy through the lubricantfilm are illustrated in Fig. 5. Fi;j;1 and hi;j;1 are the lubricant hydrodynamic force and film thickness at a grid point ði; jÞ of theskirt during time step 1, whilst Fi;j;2 and hi;j;2 pertain to the same grid point ði; jÞ during time step 2. The contact force(lubricant reaction) is the integrated pressure (P) over the elemental grid area.
The transferred energy Wi;j to the lubricated area at each grid point is calculated according to Eq. (7), using the averagedlocal force Fi;j between two consecutive steps of time for integration purposes. vi;j is the corresponding change in the localfilm thickness for the grid element i; jð Þ. In the integral of Eq. (7), the product vi;jdt can be replaced with dhi;j, thus:
Wi;j ¼Z t2
t1Fi;jvi;jdt ¼
Z h2
h1Fi;jdhi;j ¼ Fi;j h2i;j�h1i;j
� �(7)
The film shape and the corresponding pressure distribution are shown in Fig. 6 for a time step of the simulation. As can beseen, the contact pressure and the conjunctional film can be obtained simultaneously for the piston skirt-liner contact at theTS and the ATS. Consequently, energy transfer occurs at both sides of the partially skirted piston. The impact energycalculations are implemented accordingly. The lubricant film pressure is either positive or diminishes during an enginecycle. This in effect means that any cavitation is ignored in the current analysis as a full film is assumed within theconjunction. In other words, if the lubricant film is locally squeezed; dho0, then Wi;j takes a positive value and the oil filmabsorbs the impact energy (shown as Energy in Fig. 6). Otherwise, the energy is consumed in deforming the piston skirt orresult in the rigid body motion of the piston away from the cylinder wall (shown as Null). It is assumed that the localiseddeformation energy does not contribute to noise propagation.
5. Structural attenuation of sound propagation
The energy transfer pattern from the piston skirt can be converted into impact power, Pv, by using the data of twosuccessive time steps. The acoustic power of the engine block surface is required to estimate the radiated noise levels.Therefore, the structural attenuation ratio (ηa=v) is used to predict the sound power loss through the engine block structure.Structural attenuation is the ratio of acoustic power, Pa, at the outer surface of the engine block to impact power, Pv, at theinner surface of the cylinder liner [11]:
ηav¼ Pa
Pv(8)
The acoustic power is usually expressed as a function of the surface vibration velocity vr [18]:
Pa ¼ σρacaArv2r (9)
Subscripts v and r refer to the impacted and radiating structures. σ is the surface radiation efficiency (varying between 0 and1). For metallic parts vibrating at high frequencies, σ approaches unity [11]. ρa and ca are the air density and wavepropagation speed in air, respectively. Ar is the noise radiating surface area. The only unknown in Eq. (9) is the surfacevibration velocity (vr), defined below. The impact power can be expressed in terms of impact impedance Z and impactvelocity vv, using Eq. (10). The impact impedance is the inverse of impact mobility Y , which expresses the relationshipbetween the excitation and response as [31]:
Pv ¼ Zv2v ¼v2vY
(10)
Thus, the attenuation factor can be rewritten by substituting Eq. (9) and Eq. (10) into Eq. (8), yielding:
ηav¼ σρacaArv2r
Zv2v(11)
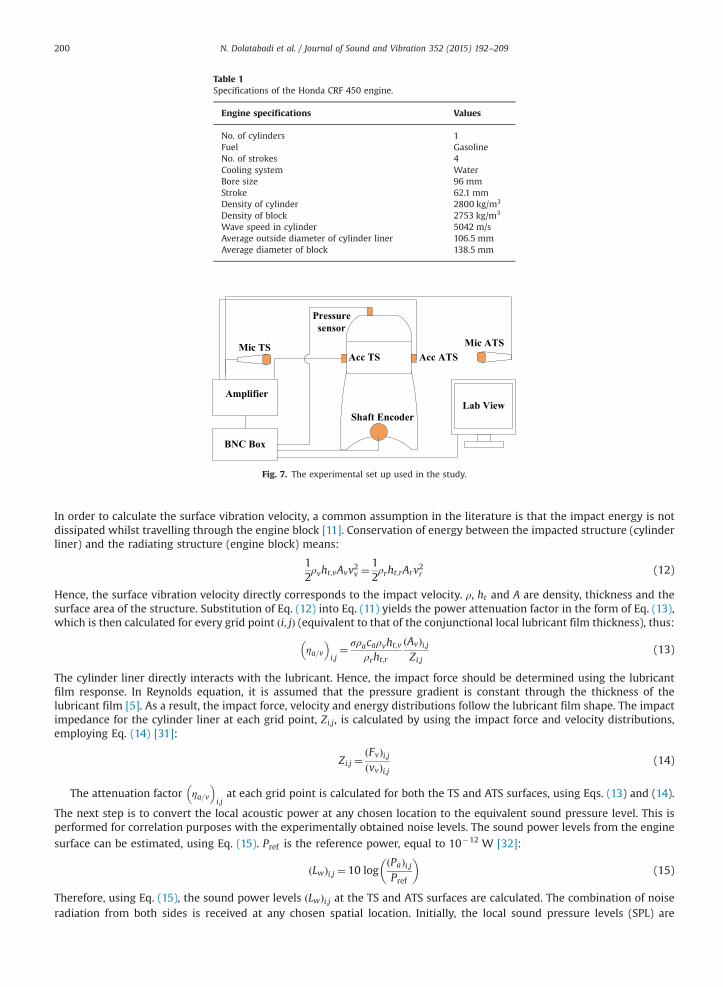
Table 1Specifications of the Honda CRF 450 engine.
Engine specifications Values
No. of cylinders 1Fuel GasolineNo. of strokes 4Cooling system WaterBore size 96 mmStroke 62.1 mmDensity of cylinder 2800 kg/m3
Density of block 2753 kg/m3
Wave speed in cylinder 5042 m/sAverage outside diameter of cylinder liner 106.5 mmAverage diameter of block 138.5 mm
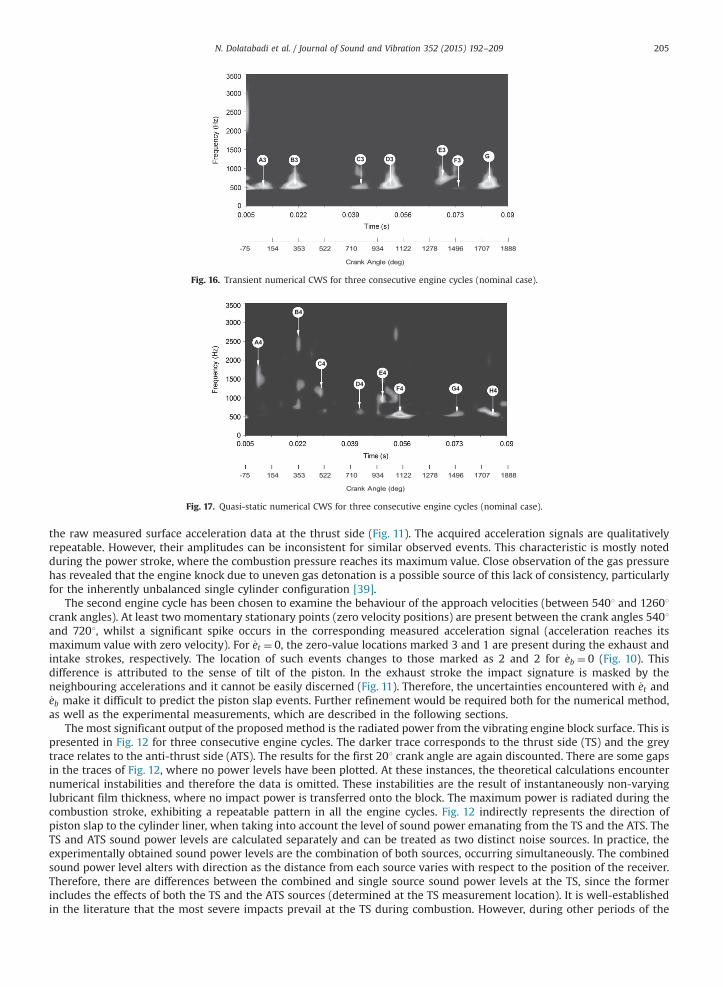
Mic TS Mic ATS
Lab View
Pressuresensor
Acc ATSAcc TS
Amplifier
BNC Box
Shaft Encoder
Fig. 7. The experimental set up used in the study.
N. Dolatabadi et al. / Journal of Sound and Vibration 352 (2015) 192–209200
In order to calculate the surface vibration velocity, a common assumption in the literature is that the impact energy is notdissipated whilst travelling through the engine block [11]. Conservation of energy between the impacted structure (cylinderliner) and the radiating structure (engine block) means:
12ρvht;vAvv2v ¼
12ρrht;rArv2r (12)
Hence, the surface vibration velocity directly corresponds to the impact velocity. ρ, ht and A are density, thickness and thesurface area of the structure. Substitution of Eq. (12) into Eq. (11) yields the power attenuation factor in the form of Eq. (13),which is then calculated for every grid point i; jð Þ (equivalent to that of the conjunctional local lubricant film thickness), thus:
ηa=v
� i;j¼ σρacaρvht;v
ρrht;r
Avð Þi;jZi;j
(13)
The cylinder liner directly interacts with the lubricant. Hence, the impact force should be determined using the lubricantfilm response. In Reynolds equation, it is assumed that the pressure gradient is constant through the thickness of thelubricant film [5]. As a result, the impact force, velocity and energy distributions follow the lubricant film shape. The impactimpedance for the cylinder liner at each grid point, Zi;j, is calculated by using the impact force and velocity distributions,employing Eq. (14) [31]:
Zi;j ¼Fvð Þi;jvvð Þi;j
(14)
The attenuation factor ηa=v
� i;jat each grid point is calculated for both the TS and ATS surfaces, using Eqs. (13) and (14).
The next step is to convert the local acoustic power at any chosen location to the equivalent sound pressure level. This isperformed for correlation purposes with the experimentally obtained noise levels. The sound power levels from the engine
surface can be estimated, using Eq. (15). Pref is the reference power, equal to 10�12 W [32]:
Lwð Þi;j ¼ 10 logPað Þi;jPref
� �(15)
Therefore, using Eq. (15), the sound power levels Lwð Þi;j at the TS and ATS surfaces are calculated. The combination of noiseradiation from both sides is received at any chosen spatial location. Initially, the local sound pressure levels (SPL) are

-180 0 180 360 540-6
-4
-2
0
2
Crank Angle (deg)
Forc
e (k
N)
Quasi-staticTransient
Compression Combustion Exhaust Intake
Fig. 8. Kinematic and inertial dynamic lateral force profiles vs. crank angle (nominal case).
N. Dolatabadi et al. / Journal of Sound and Vibration 352 (2015) 192–209 201
transferred to any chosen location using Eq. (16). s0 is the acoustic field characteristics. If the engine is located in a free-field,then s0 ¼ 1 and if the acoustic field is assumed to be semi-spherical, then s0 ¼ 2. The latter case has been applied in thisstudy. Rb is the distance from the block surface, thus [31]:
SPLi;j ¼ Lwð Þi;jþ10 logs0
4πR2b
!(16)
SPL values for the TS and ATS are combined using Eq. (17). SPLT is the total sound pressure level at any location of interest[32], suitable for comparison purposes with the experimentally measured noise levels as
SPLT ¼ 10 logXi
Xj
10 SPLTSð Þi;j=10þXi
Xj
10 SPLATSð Þi;j=10!0
@ (17)
6. Experimental investigation
The experimental setup used for validating the proposed methodology is briefly explained here. More detailedinformation can be found in Littlefair et al. [24]. A Honda CRF 450R single-cylinder, 4-stroke motorbike SI engine is utilised(engine specifications are provided in Table 1). The experimental set up is shown in Fig. 7. The engine is resisted by anOswald 250 kW transient dynamometer and controlled to the desired speeds. The exhaust fume is driven out through aventilation fan. The in-cylinder pressure is measured using a Kistler spark-plug type pressure sensor. Two accelerometersare attached to the TS and ATS of the engine block to monitor surface vibrations. The TS and ATS noise levels are measured at1 m distance from the block surface using microphones. An optical shaft encoder provides the corresponding crank angle tosynchronise with the acquired noise signals. The data acquisition is implemented in the environment of LabVIEW.
7. Signal processing
Different sources inside and outside the engine block contribute to the monitored noise (such as valves, gears, bearings,the dynamometer and the test-cell air conditioning system). Signal post-processing is a common means to filter out thecontributions of minor interest [31,33,34]. The operating frequencies of these events along with those of the piston impactshave been evaluated in these previous studies. The mechanical noise content is claimed to lie in the frequency range of 400–3200 Hz [31]. Other researchers have reported mechanical noise contributions to reside in the range: 1000–3000 Hz [35] orwithin 500–2000 Hz [36]. In the current study, the signal bandwidth was set at 450–3500 Hz, based on the aforementionedpublished work. The engine is installed in the test-cell, which is isolated from the outside environment to preventinterference. Nevertheless, the dynamometer and ventilation fan inside the test-cell introduce some uncertainties in themeasurements. It is not possible to measure the contribution of these background sources directly as they operateconcurrently with a running engine. However, the filtered signals were successfully matched to the mechanical events, asthe presentation of the results demonstrates in the following section.
In the presence of the above uncertainty and the likelihood of low signal to noise ratio (SNR), the essential informationcontained in the signal can be extracted using time-frequency signal processing techniques in order to link the eventsobserved in the signal to their excitation source [36]. The continuous wavelet transform (CWT) is a well-established methodfor time-frequency analysis of small oscillations that are highly localized in time, whereas the Fourier transform omits alltime-localised information [37]. Therefore, CWT is applied to the highly transient nonlinear dynamics of the piston impact

-180 0 180 360 540 720 900 1080 1260 1440 1620 1800 1980-60
-40
-20
0
20
40
60
80
100
Crank Angle (deg)
Ecc
entri
city
(m
)μ
eteb
Fig. 9. Eccentricity at the top and bottom of the piston skirt vs. crank angle (nominal case).
-180 0 180 360 540 720 900 1080 1260 1440 1620 1800 1980-0.1
0
0.1
0.2
velo
city
at e
t (ms-1
)
-180 0 180 360 540 720 900 1080 1260 1440 1620 1800 1980-0.1
0
0.1
0.2
Crank Angle (deg)
velo
city
at e
b (ms-1
)
Exhaust Intake
3 1
2 2
Fig. 10. Eccentricity velocity at: (a) the top and (b) bottom of the piston skirt (nominal case).
-180 0 180 360 540 720 900 1080 1260 1440 1620 1800 1980-0.5
-0.25
0
0.25
0.5
0.75
1
Crank Angle (deg)
Thru
st-s
ide
Acc
eler
atio
n (m
s-2)
-40
-20
0
20
40
60
80
In-C
ylin
der P
ress
ure
(bar
)
Acc TS In-Cyl Press
Fig. 11. Measured vibration acceleration at the engine block surface and correlation with the in-cylinder pressure (nominal case).
N. Dolatabadi et al. / Journal of Sound and Vibration 352 (2015) 192–209202
in this paper. The CWT function of Eq. (18) is used in the AutoSignal software environment for the current work [38]:
Wn sð Þ ¼XN�1
n' ¼ 0
xn'
ffiffiffiffiffiffiffiffiffiffiffiffiδts0
� �sΨn
0n0 �nð Þδt
s0
� �(18)
The Ψ0 function is the mother wavelet used in the CWT. The (n) refers to the complex conjugate of the function. N is the dataseries length and n is an index of the localised time. s0 is the wavelet scale and δt is the sampling interval. xn' represents thedata series on which the CWT is based. The Morlet function is the most commonly used mother wavelet and it is applied tothe current problem as [38]:
Ψ0 τð Þ ¼ π�ð1=4Þeimτe� τ2=2 (19)
m and τ are the wavenumber and the non-dimensional time parameter, respectively. The CWT parameters are set to returnthe best possible comparison between the experimental measurements and the analytical simulations for transient

-180 0 180 360 540 720 900 1080 1260 1440 1620 1800 19800
20
40
60
80
100
120
140
Crank Angle (deg)
Pow
er L
evel
(dB
)
TSATS
Fig. 12. Calculated sound power levels at the TS and ATS of the engine block (nominal case).
Fig. 13. Comparison of TS SPL measured and numerical data (nominal case).
N. Dolatabadi et al. / Journal of Sound and Vibration 352 (2015) 192–209 203
problems. The adjustable parameters in the AutoSignal environment are m, n and the plot gradient. m and n equal 8 and35 as default. The dB format is used with 21 dB value for the gradient.
8. Results and discussion
Experimental measurements were made at two different engine conditions: (i) 3500 rpm and 40 Nm and (ii) 4250 rpmand 42 Nm. Those test conditions are used to show the generic nature of the numerical predictive model through validationwith the measured data. Transient numerical solutions of the piston's secondary motion were carried out for both theaforementioned test conditions. A kinematic quasi-static solution (excluding the effects of piston pin rotation and lubricantfilm squeeze effect) was carried out for the case of 3500 rpm engine speed only in order to study the validity of the approachagainst the full transient analysis.
8.1. 3500 rpm engine speed and 40 Nm torque (nominal case)
Since the lateral force is an indication of potential ensuing piston slap, an investigation of the resultant side forceobtained from the quasi-static or transient inertial dynamics approaches is necessary. Fig. 8 shows a comparison of two netside force plots (one through quasi-static and the other through transient dynamics analysis). These are for an engine cycleat the engine speed of 3500 rpm with a maximum torque output of 40 Nm. The negative force values indicate net forcedirection towards the thrust side (TS) whilst the positive values correspond to the net force direction towards the anti-thrustside (ATS). The gas force is dominant from the end of the compression stroke up to 1801 crank angle position in the powerstroke. In this interval, the lateral (side) force for both the kinematic and the inertial dynamics analyses remain inagreement. In the other parts of the engine cycle, the inertial forces are dominant, thus there is some deviation between theresults of the transient inertial dynamics and that of quasi-statics. This deviation may be the result of piston tilt about the

-180 0 180 360 540 720 900 1080 1260 1440 1620 1800 198040
60
80
100
120
140
Crank Angle (deg)S
PL
(dB
)
MeasurementQuasi-StaticTransient
Fig. 14. Filtered SPL histories as a function of crank angle (3500 rpm and 40 Nm).
A1
B1C1 D1 F1E1 G
-75 154 353 522 710 934 1122 1278 1496 1707 1888
Crank Angle (deg)
-75 154 353 522 710 934 1122 1278 1496 1707 1888
Crank Angle (deg)
B2 H2 M2E2
F2 K2
OJ2
C2
D2
I2
N2
A2 G L2J2*
E2*
Fig. 15. The Continuous Wavelet Spectra (CWS) of the noise for three consecutive engine cycles (nominal case): (a) TS and (b) ATS.
N. Dolatabadi et al. / Journal of Sound and Vibration 352 (2015) 192–209204
pin-bore bearing. In both analyses, six instances of incursion from the piston axis occur, which are indicated by the lateralforce plots crossing the zero net force. Hence, six piston slaps can potentially occur [33,34].
Monitoring piston eccentricities (at its top and bottom skirt surfaces) is useful when investigating its tilting motion.Eccentricity plots obtained from the transient model are presented in Fig. 9 for the top and bottom of the skirt (i.e. et and eb,respectively) for three consecutive engine cycles. The top (et) and bottom (eb) eccentricities are the deviation of the pistontop and bottom from its centre-line axis, respectively. The results for the first 201 crank angle are ignored, since the squeezefilm action is initially neglected for sake of numerical stability. The largest eccentricity values are noted at the bottom of thepiston skirt during the power stroke and around the bottom-dead-centre (BDC) during the exhaust stroke. Largereccentricities can lead to higher piston lateral velocities and potentially a greater degree of impact severity. The repetitivenature of piston secondary dynamics is clear for the three cycles shown in the figure.
The approaching velocities at the top, _et , and bottom, _eb, of the skirt are presented in Fig. 10. As expected, velocityamplitudes are higher at the bottom of the skirt, where the observed displacements are larger. When the approach velocitydiminishes, either an impact has occurred or there may simply be no net side force (no secondary piston dynamics:momentary equilibrium condition). Therefore, identifying piston slap through the use of rates of change of top and bottomskirt eccentricities (lateral velocities) carries a certain degree of uncertainty. Thus, the velocities _et and _eb are compared with
-75 154 353 522 710 934 1122 1278 1496 1707 1888
Crank Angle (deg)
A3 B3 C3 D3E3
F3 G
Fig. 16. Transient numerical CWS for three consecutive engine cycles (nominal case).
A4
B4
C4
D4
E4
F4 G4 H4
-75 154 353 522 710 934 1122 1278 1496 1707 1888
Crank Angle (deg)
Fig. 17. Quasi-static numerical CWS for three consecutive engine cycles (nominal case).
N. Dolatabadi et al. / Journal of Sound and Vibration 352 (2015) 192–209 205
the raw measured surface acceleration data at the thrust side (Fig. 11). The acquired acceleration signals are qualitativelyrepeatable. However, their amplitudes can be inconsistent for similar observed events. This characteristic is mostly notedduring the power stroke, where the combustion pressure reaches its maximum value. Close observation of the gas pressurehas revealed that the engine knock due to uneven gas detonation is a possible source of this lack of consistency, particularlyfor the inherently unbalanced single cylinder configuration [39].
The second engine cycle has been chosen to examine the behaviour of the approach velocities (between 5401 and 12601crank angles). At least two momentary stationary points (zero velocity positions) are present between the crank angles 5401and 7201, whilst a significant spike occurs in the corresponding measured acceleration signal (acceleration reaches itsmaximum value with zero velocity). For _et ¼ 0, the zero-value locations marked 3 and 1 are present during the exhaust andintake strokes, respectively. The location of such events changes to those marked as 2 and 2 for _eb ¼ 0 (Fig. 10). Thisdifference is attributed to the sense of tilt of the piston. In the exhaust stroke the impact signature is masked by theneighbouring accelerations and it cannot be easily discerned (Fig. 11). Therefore, the uncertainties encountered with _et and_eb make it difficult to predict the piston slap events. Further refinement would be required both for the numerical method,as well as the experimental measurements, which are described in the following sections.
The most significant output of the proposed method is the radiated power from the vibrating engine block surface. This ispresented in Fig. 12 for three consecutive engine cycles. The darker trace corresponds to the thrust side (TS) and the greytrace relates to the anti-thrust side (ATS). The results for the first 201 crank angle are again discounted. There are some gapsin the traces of Fig. 12, where no power levels have been plotted. At these instances, the theoretical calculations encounternumerical instabilities and therefore the data is omitted. These instabilities are the result of instantaneously non-varyinglubricant film thickness, where no impact power is transferred onto the block. The maximum power is radiated during thecombustion stroke, exhibiting a repeatable pattern in all the engine cycles. Fig. 12 indirectly represents the direction ofpiston slap to the cylinder liner, when taking into account the level of sound power emanating from the TS and the ATS. TheTS and ATS sound power levels are calculated separately and can be treated as two distinct noise sources. In practice, theexperimentally obtained sound power levels are the combination of both sources, occurring simultaneously. The combinedsound power level alters with direction as the distance from each source varies with respect to the position of the receiver.Therefore, there are differences between the combined and single source sound power levels at the TS, since the formerincludes the effects of both the TS and the ATS sources (determined at the TS measurement location). It is well-establishedin the literature that the most severe impacts prevail at the TS during combustion. However, during other periods of the

-180 0 180 360 540 720 900 1080 1260 1440 1620 1800 198040
60
80
100
120
140
Crank Angle (deg)S
PL
(dB
)
MeasurementTransient
Fig. 18. Transient SPL for three consecutive engine cycles (4250 rpm and 42 Nm).
-180 0 180 360 540 720 900 1080 1260 1440 1620 1800 198040
60
80
100
120
140
Crank Angle (deg)
SP
L (d
B)
MeasurementTransient
Fig. 19. Filtered SPL histories as a function of crank angle for three consecutive engine cycles (4250 rpm and 42 Nm).
N. Dolatabadi et al. / Journal of Sound and Vibration 352 (2015) 192–209206
engine cycle, the ATS power levels can equal or surpass those from the TS. The severity of power/sound levels depends onthe location and energy of the piston inside the clearance. For instance, the piston impinges at the TS wall at the beginningof the combustion stroke, where a severe side force acts for a short duration. The ATS wall transfers higher power as thepiston separates from the TS wall towards the end of the combustion stroke.
The sound pressure level (SPL) is calculated at a distance of 1 m from the TS (Fig. 13) and it is compared with themeasured noise levels. Although the combined TS and ATS SPL data can exhibit different characteristics (since their powerlevels and directions differ), only the combined predicted TS results are presented for the sake of brevity. Therefore,hereinafter all the combined SPLs for transient and quasi-static solutions refer to the TS location. The three plots in Fig. 13generally conform well. To provide a clearer view, the results are magnified for the second engine cycle in the inset to thefigure. The theoretical results relate to the piston�cylinder liner interactions only. However, measurements includecontributions from all noise sources in and out of the engine block. Consequently, the measured noise levels exceed thosepredicted during the intake and compression strokes, where the contributions of other sources become comparable to thepiston slap as the gas pressure is reduced. Furthermore, in the transient dynamics solution the inertial effect of componentsother than the piston are neglected and the extent of deviation in the estimation of noise levels is anticipated (over-estimation or under-estimation). Therefore, the experimental and simulated noise signals have been filtered using thefrequency interval (450–3500 Hz) chosen in section 7. The resulting time histories are shown in Fig. 14. The three signalscompare well with the anticipated average noise level of 106.04 dB for the measurements, and 104.05 dB and 105.26 dB forthe transient dynamics and quasi-static predictions respectively. Although both analytical models agree well with themeasurements, further analysis would be required to assess which is the most accurate model in terms of highlighting thepiston slapping events.
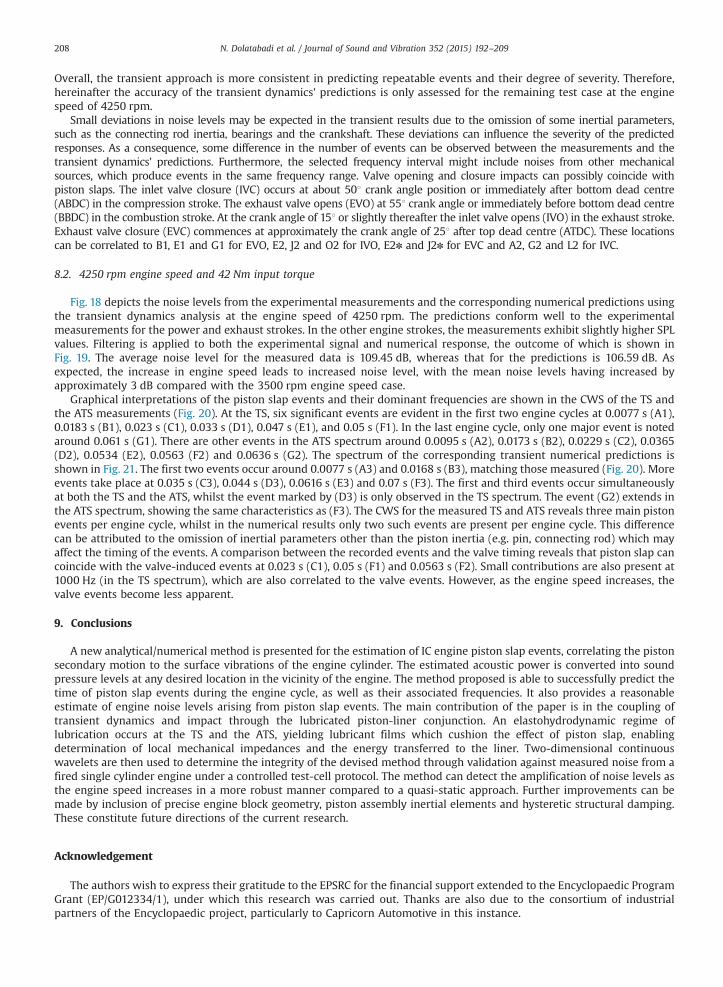
In order to identify the highest energy contributions in the acquired signals, two-dimensional Continuous WaveletSpectra (CWS) are presented (using the AutoSIGNAL software). The spectra corresponding to the measured noise at the TSand ATS (at 1 m distance) are shown in Fig. 15. The main contributions occur at 0.0082 s (A1), 0.04 s (D1), and 0.0713 s (F1)in the TS spectrum with additional less significant events at about 0.012 s (B1), 0.0305 s (C1), 0.0467 s (E1) and 0.0784 s(G1). The same main contributions are also present in the ATS spectrum around 0.00925 s (B2), 0.041 s (H2), and 0.073 s(M2). Additional contributions are identified in the ATS spectrum, which are located at 0.006 s (A2), 0.018 s (C2), 0.0205 s(D2), 0.022 s (E2), 0.0248 s (E2n) and 0.0303 s (F2) for the first engine cycle, at 0.037 s (G2), 0.049 s (I2), 0.050 s (J2) and0.0625 s (K2) for the second engine cycle and finally at 0.068 s (L2), 0.0828 s (N2) and 0.0861 s (O2) for the third enginecycle. These contributions follow the same pattern in all the displayed cycles. The highest energy contributions are locatedin the frequency band 500–1500 Hz. As described earlier, the experimental measurements are the result of combinedsources (at the TS and ATS). Therefore, TS events can be present in the ATS location measurements with similar severity. Theevents D1 and H2 represent this behaviour in Fig. 15.

N. Dolatabadi et al. / Journal of Sound and Vibration 352 (2015) 192–209 207
The CWS of the transient numerical results are presented in Fig. 16 for the combined SPL. Two predicted events arepresent in each cycle which can be correlated to those measured (in a temporal, as well as a spectral sense). These occur at0.0107 s (A3) and 0.0203 s (B3) for the first cycle, at 0.0419 s (C3) and 0.0524 s (D3) for the second cycle and finally at0.0688 s (E3), 0.0729 s (F3) and 0.08146 s (G3) in the third cycle. A3, B3, C3, D3, F3 and G3 correspond to B2, E2, H2, J2, M2and O2 (measured data) respectively. The contribution labelled F3 is rather weak and can be attributed to the fluctuations inthe in-cylinder pressure between different cycles (cycle-to-cycle combustion variation). Fig. 17 corresponds to the quasi-static CWS. As can be seen, good agreement is observed after 0.039 s between the quasi-static and measured spectra (thelatter events occur around 0.043 s (D4), 0.049 s (E4), 0.055 s (F4), 0.072 s (G4) and 0.0828 s (H4)). Prior to this time juncture,there are mismatched events (either temporally or based on spectral contributions). For instance the events marked as A4,B4 and C4 are approximately equivalent to B2, E2 and F2 temporally. However, their spectral compositions do not coincide.
-57 115 329 517 688 868 1080 1266 1432 1624 1832
Crank Angle (deg)
Fig. 21. Transient numerical CWS for three consecutive engine cycles (4250 rpm and 42 Nm)
-57 115 329 517 688 868 1080 1266 1432 1624 1832
Crank Angle (deg)
A1 B1
C1
D1 E1
F1
G1
A2C2
D2 E2
F2
G2B2
-57 115 329 517 688 868 1080 1266 1432 1624 1832
Crank Angle (deg)
Fig. 20. CWS of the noise for three consecutive engine cycles (4250 rpm and 42 Nm): (a) TS and (b) ATS.
N. Dolatabadi et al. / Journal of Sound and Vibration 352 (2015) 192–209208
Overall, the transient approach is more consistent in predicting repeatable events and their degree of severity. Therefore,hereinafter the accuracy of the transient dynamics' predictions is only assessed for the remaining test case at the enginespeed of 4250 rpm.
Small deviations in noise levels may be expected in the transient results due to the omission of some inertial parameters,such as the connecting rod inertia, bearings and the crankshaft. These deviations can influence the severity of the predictedresponses. As a consequence, some difference in the number of events can be observed between the measurements and thetransient dynamics' predictions. Furthermore, the selected frequency interval might include noises from other mechanicalsources, which produce events in the same frequency range. Valve opening and closure impacts can possibly coincide withpiston slaps. The inlet valve closure (IVC) occurs at about 501 crank angle position or immediately after bottom dead centre(ABDC) in the compression stroke. The exhaust valve opens (EVO) at 551 crank angle or immediately before bottom dead centre(BBDC) in the combustion stroke. At the crank angle of 151 or slightly thereafter the inlet valve opens (IVO) in the exhaust stroke.Exhaust valve closure (EVC) commences at approximately the crank angle of 251 after top dead centre (ATDC). These locationscan be correlated to B1, E1 and G1 for EVO, E2, J2 and O2 for IVO, E2n and J2n for EVC and A2, G2 and L2 for IVC.
8.2. 4250 rpm engine speed and 42 Nm input torque
Fig. 18 depicts the noise levels from the experimental measurements and the corresponding numerical predictions usingthe transient dynamics analysis at the engine speed of 4250 rpm. The predictions conform well to the experimentalmeasurements for the power and exhaust strokes. In the other engine strokes, the measurements exhibit slightly higher SPLvalues. Filtering is applied to both the experimental signal and numerical response, the outcome of which is shown inFig. 19. The average noise level for the measured data is 109.45 dB, whereas that for the predictions is 106.59 dB. Asexpected, the increase in engine speed leads to increased noise level, with the mean noise levels having increased byapproximately 3 dB compared with the 3500 rpm engine speed case.
Graphical interpretations of the piston slap events and their dominant frequencies are shown in the CWS of the TS andthe ATS measurements (Fig. 20). At the TS, six significant events are evident in the first two engine cycles at 0.0077 s (A1),0.0183 s (B1), 0.023 s (C1), 0.033 s (D1), 0.047 s (E1), and 0.05 s (F1). In the last engine cycle, only one major event is notedaround 0.061 s (G1). There are other events in the ATS spectrum around 0.0095 s (A2), 0.0173 s (B2), 0.0229 s (C2), 0.0365(D2), 0.0534 (E2), 0.0563 (F2) and 0.0636 s (G2). The spectrum of the corresponding transient numerical predictions isshown in Fig. 21. The first two events occur around 0.0077 s (A3) and 0.0168 s (B3), matching those measured (Fig. 20). Moreevents take place at 0.035 s (C3), 0.044 s (D3), 0.0616 s (E3) and 0.07 s (F3). The first and third events occur simultaneouslyat both the TS and the ATS, whilst the event marked by (D3) is only observed in the TS spectrum. The event (G2) extends inthe ATS spectrum, showing the same characteristics as (F3). The CWS for the measured TS and ATS reveals three main pistonevents per engine cycle, whilst in the numerical results only two such events are present per engine cycle. This differencecan be attributed to the omission of inertial parameters other than the piston inertia (e.g. pin, connecting rod) which mayaffect the timing of the events. A comparison between the recorded events and the valve timing reveals that piston slap cancoincide with the valve-induced events at 0.023 s (C1), 0.05 s (F1) and 0.0563 s (F2). Small contributions are also present at1000 Hz (in the TS spectrum), which are also correlated to the valve events. However, as the engine speed increases, thevalve events become less apparent.
9. Conclusions
A new analytical/numerical method is presented for the estimation of IC engine piston slap events, correlating the pistonsecondary motion to the surface vibrations of the engine cylinder. The estimated acoustic power is converted into soundpressure levels at any desired location in the vicinity of the engine. The method proposed is able to successfully predict thetime of piston slap events during the engine cycle, as well as their associated frequencies. It also provides a reasonableestimate of engine noise levels arising from piston slap events. The main contribution of the paper is in the coupling oftransient dynamics and impact through the lubricated piston-liner conjunction. An elastohydrodynamic regime oflubrication occurs at the TS and the ATS, yielding lubricant films which cushion the effect of piston slap, enablingdetermination of local mechanical impedances and the energy transferred to the liner. Two-dimensional continuouswavelets are then used to determine the integrity of the devised method through validation against measured noise from afired single cylinder engine under a controlled test-cell protocol. The method can detect the amplification of noise levels asthe engine speed increases in a more robust manner compared to a quasi-static approach. Further improvements can bemade by inclusion of precise engine block geometry, piston assembly inertial elements and hysteretic structural damping.These constitute future directions of the current research.
Acknowledgement
The authors wish to express their gratitude to the EPSRC for the financial support extended to the Encyclopaedic ProgramGrant (EP/G012334/1), under which this research was carried out. Thanks are also due to the consortium of industrialpartners of the Encyclopaedic project, particularly to Capricorn Automotive in this instance.

N. Dolatabadi et al. / Journal of Sound and Vibration 352 (2015) 192–209 209
References
[1] B. S. Andersson, Company's perspective in vehicle tribology, Proceedings of the 18th Leeds-Lyon Symposium, Lyon, France, 3–6 September 1991, in: D.Dowson, C. M. Taylor and M. Godet, (Eds.), Elsevier, New York, pp. 503–506.
[2] H. Kanda, M. Okubo, T. Yonezawa, Analysis of noise sources and their transfer paths in diesel engines, SAE Technical Paper 900014, 1990, pp. 1�8.[3] M. Okubo, H. Kanda, T. Yonezawa, Analysis and reduction of piston slap noise in diesel engines, SAE Technical Paper 890127 (1989).[4] R. DeJong, N. Parsons, Piston slap noise reduction in a vee-block diesel engine, SAE Technical Paper 820240 (1982).[5] R. Gohar, H. Rahnejat, Fundamentals of Tribology, Imperial College Press, London, 2008.[6] P. McFadden, S. Turnbull, Dynamic analysis of piston secondary motion in an internal combustion engine under non-lubricated and fully flooded
lubricated conditions, Proceedings of the Institution of Mechanical Engineers, Part C: Journal of Mechanical Engineering Science 225 (11) (2011) 2575–2585,http://dx.doi.org/10.1177/0954406211408674.
[7] E. Abu Nada, I. Al-Hinti, B. Akash, A. Al-Sarkhi, Thermodynamic analysis of spark ignition engine using a gas mixture model for the working fluid,International Journal of Energy Research 31 (11) (2007) 1031–1046.
[8] V. D' Agostino, D. Guida, A. Ruggiero, C. Russo. Optimized EHL piston dynamics computer code, Proceedings of the 5th International Conference onTribology, AITC-AIT, Parma, September 2006, pp. 9.
[9] S. Ge-qun, W. Hai-qiao, H. Rui, The transfer function of combustion noise in DI-diesel engine, SAE Technical Paper 2005-01-2486, 2005.[10] N. Lalor, E. Grover, T. Priede, Engine noise due to mechanical impacts at pistons and bearings, SAE Technical paper 800402, 1980.[11] E.E. Ungar, D. Ross, Vibrations and noise due to piston-slap in reciprocating machinery, Journal of Sound and Vibration 2 (2) (1965) 132–146.[12] S.H. Cho, S.T. Ahn, Y.H. Kim, A simple model to estimate the impact force induced by piston slap, Journal of Sound and Vibration 255 (2) (2002) 229–242.[13] M. Kushwaha, S. Gupta, P. Kelly, H. Rahnejat, Elasto-multi-body dynamics of multi-cylinder internal combustion engine, Proceedings of Institution of
Mechanical Engineers, Part K: Journal of Multi-body Dynamics 216 (4) (2002) 281–293.[14] H. Murakami, N. Nakanishi, N. Ono, T. Kawano, New three-dimensional piston secondary motion analysis method coupling structure analysis and
multi body dynamics analysis, SAE International Journal of Engines 5 (1) (2011) 42–50.[15] M. Perera, S. Theodossiades, H. Rahnejat, Elasto-multi-body dynamics of internal combustion engines with tribological conjunctions, Proceedings of
Institution of Mechanical Engineers, Part K: Journal of Multi-body Dynamics 224 (3) (2010) 261–277.[16] M. Perera, S. Theodossiades, H. Rahnejat, A multi-physics multi-scale approach in engine design analysis, Proceedings of Institute of Mechanical
Engineers, Part K: Journal of Multi-body Dynamics 221 (3) (2007) 335–348.[17] D.F. Li, S.M. Rohde, H.A. Ezzat, An automotive piston lubrication model, ASLE Transactions 26 (2) (1983) 151–160.[18] K. Ohta, K. Amano, A. Hayashida, G. Zheng, Analysis of piston slap induced noise and vibration of internal combustion engine, Journal of Environment
and Engineering 6 (3) (2011) 712–722.[19] S. Gerges, J. de Luca, N. Lalor, Effect of cylinder lubrication on piston slap, SAE Technical Paper 2005-01-2165, 2005.[20] T. Nakada, A. Yamamoto, T. Abe, A numerical approach for piston secondary motion analysis and its application to the piston related noise, SAE
Technical Paper 972043, 1997, pp. 1361�1370.[21] S. Balakrishnan, H. Rahnejat, Isothermal analysis of piston skirt-to-cylinder wall contacts under combined axial, lateral and tilting motion, Journal of
Physics, Part D: Applied Physics 38 (5) (2005) 787–799.[22] J. Cho, S. Moon, A numerical analysis of the interaction between the piston oil film and the component deformation in a reciprocating compressor,
Tribology International 38 (5) (2005) 459–468.[23] F. McClure, Numerical Modeling of Piston Secondary Motion and Skirt Lubrication in Internal Combustion Engines PhD Thesis, Massachusetts Institute of
Technology, 2007 USA.[24] B. Littlefair, M. De la Cruz, S. Theodossiades, R. Mills, Transient tribo-dynamics of thermo-elastic compliant high-performance piston skirts, Tribology
Letters 53 (1) (2014) 51–70.[25] B. Littlefair, M. De La Cruz, R. Mills, S. Theodossiades, Lubrication of a flexible piston skirt conjunction subjected to thermo-elastic deformation: a
combined numerical and experimental investigation, Proceedings of Institute of Mechanical Engineers, Part J: Journal of Engineering Tribology 228 (1)(2014) 69–81.
[26] N. Dolatabadi, S. Theodossiades, S.J. Rothberg, On the identification of piston slap events in internal combustion engines using tribodynamic analysis,Journal of Mechanical Systems and Signal Processing 58�59 (2015) 308–324.
[27] J. Cho, Effects of skirt profiles on the piston secondary movements by the lubrication behaviors, International Journal of Automotive Technology 5 (1)(2004) 23–31.
[28] D. Dowson, G. Higginson, A numerical solution to the elasto-hydrodynamic problem, Journal of Mechanical Engineering Science 1 (1) (1959) 6–15.[29] N. Morris, R. Rahmani, H. Rahnejat, P.D. King, B. Fitzsimons, Tribology of piston compression ring under transient thermal mixed regime of lubrication,
Tribology International 59 (2013) 248–258.[30] C. Roelands, Correlational Aspects of the Viscosity�Temperature�Pressure Relationship of Lubricating Oils PhD Thesis, Technical University Delft, 1966.[31] F. Fahy, P. Gardonio, Sound and Structural Vibration: Radiation, Transmission and Response, Academic Press, Netherlands, 2007.[32] C.E. Wilson, Noise Control, Revised Edition, Krieger Publishing Company, Malabar, Florida, USA, 2006.[33] Z. Geng, J. Chen, Investigation into piston-slap-induced vibration for engine condition simulation and monitoring, Journal of Sound and Vibration 282
(3) (2005) 735–751.[34] S.D. Haddad, K.T. Tian, An analytical study of offset piston and crankshaft designs and the effect of oil film on piston slap excitation in a diesel engine,
Mechanism and Machine Theory 30 (2) (1995) 271–284.[35] K. Ohta, Y. Irie, K. Yamamoto, H. Ishikawa, Piston slap induced noise and vibration of internal combustion engines (1st Report, Theoretical Analysis and
Simulation), SAE Technical Paper 870990, 1987.[36] K. Nakashima, Y. Yajima, K. Suzuki, Approach to minimization of piston slap force for noise reduction–investigation of piston slap force by numerical
simulation, JSAE Review 20 (2) (1999) 211–216.[37] M. Chiollaz, Engine noise characterisation with Winger�Ville time-frequency analysis, Mechanical Systems and Signal Processing 7 (5) (1993) 375–400.[38] AutoSignal version 1.7 release notes, Sea Solve Software Inc., 1999�2003.[39] H. Rahnejat, Multi-body dynamics: vehicles, machines and mechanisms, Professional Engineering Publishing, Bury St Edmunds, UK, 1998.