Journal of Social Sciences & Humanities PAPERS/JSSH Vol. 19 (S) Oct. … · Journal of Social...
210
Transcript of Journal of Social Sciences & Humanities PAPERS/JSSH Vol. 19 (S) Oct. … · Journal of Social...


Journal of Social Sciences & Humanities
About the JournalPertanika is an international peer-reviewed journal devoted to the publication of original papers, and it serves as a forum for practical approaches to improving quality in issues pertaining to tropical agriculture and its related fields. Pertanika began publication in 1978 as the Journal of Tropical Agricultural Science. In 1992, a decision was made to streamline Pertanika into three journals to meet the need for specialised journals in areas of study aligned with the interdisciplinary strengths of the university.
The revamped Journal of Social Sciences & Humanities (JSSH) aims to develop as a pioneer journal for the Social Sciences with a focus on emerging issues pertaining to the social and behavioural sciences as well as the humanities, particularly in the Asia Pacific region. Other Pertanika series include Pertanika Journal of Tropical Agricultural Science (JTAS); and Pertanika Journal of Science and Technology (JST).
JSSH is published in English and it is open to authors around the world regardless of the nationality. It is currently published two times a year i.e. in March and September.
Goal of PertanikaOur goal is to bring the highest quality research to the widest possible audience.
Quality We aim for excellence, sustained by a responsible and professional approach to journal publishing. Submissions are guaranteed to receive a decision within 12 weeks. The elapsed time from submission to publication for the articles averages 5-6 months.
Indexing of PertanikaPertanika is now over 30 years old; this accumulated knowledge has resulted in Pertanika journals being indexed in SCOPUS (Elsevier), EBSCO, AGRICOLA, and CABI. etc. JSSH is indexed in SCOPUS (Elsevier), and EBSCO.
Future visionWe are continuously improving access to our journal archives, content, and research services. We have the drive to realise exciting new horizons that will benefit not only the academic community, but society itself.
We also have views on the future of our journals. The emergence of the online medium as the predominant vehicle for the ‘consumption’ and distribution of much academic research will be the ultimate instrument in the dissemination of research news to our scientists and readers.
Aims and scopePertanika Journal of Social Sciences & Humanities aims to provide a forum for high quality research related to social sciences and humanities research. Areas relevant to the scope of the journal include: Accounting, Agricultural & resource economics, Anthropology, Communication, Community and peace studies, Design and architecture, Disaster and crisis management, Economics, Education, Extension education, Finance, Gerontology, Hospitality and tourism, Human ecology, Human resource development, Language studies (education, applied linguistics, acquisition, pedagogy), Language literature (literary & cultural studies), Management, Marketing, Psychology, Safety and environment, Social and behavioural sciences, Sociology, Sustainable development, and Ethnic relations.
Editorial StatementPertanika is the official journal of Universiti Putra Malaysia. The abbreviation for Pertanika Journal of Social Sciences & Humanities is Pertanika J. Soc. Sci. Hum.
Journ
al o
f S
oci
al S
cience
s &
Hum
aniti
es
Journ
al o
f S
oci
al S
cience
s &
Hum
aniti
es
Journ
al o
f S
oci
al S
cience
s &
Hum
aniti
es
Selected Papers from:Social and Psychological Well-Being
Guest Editors:Rohany Nasir
Wan Shahrazad Wan SulaimanRozainee Khairudin
Lukman Z. Mohamad
A scientific journal published by Universiti Putra Malaysia Press
VOL. 19 (S) OCT. 2011


Editorial Board2011-2013
Editor-in-ChiefShamsher Mohamad Ramadili Mohd., Malaysia
Finance, Corporate Governance
Executive EditorNayan D.S. KANWAL, Malaysia
Environmental issues- landscape plant modelling applications
Editorial Board Members
Abdul Mansur M. Masih (Professor Dr), Economics, Econometrics, Finance, King Fahd University of Petroleum and Minerals, Saudi Arabia.
Alan MALEY (Professor Dr), English Language Studies, Teaching of English Language and Literatures, Leeds Metropolitan University, UK.
Aminah Ahmad (Professor Dr), Sociology, Gender and Development, Universiti Putra Malaysia, Malaysia.
Bee-Hoon TAN (Associate Professor Dr), English Language Studies and Applied Linguistics, with Special Research Interest in e-learning and Learning Support, Universiti Putra Malaysia, Malaysia.
Brian TOMLINSON (Professor Dr), English Language Studies, The Evaluation, Adaptation and Development of Materials for Language Learning, Language through Literature, Teaching Methodology and Second Language Acquisition, Leeds Metropolitan University, UK.
Deanna L. SHARPE (Associate Professor Dr), Economics, Consumer and Family Economics, Personal Finance, The University of Missouri, Columbia, USA.
Dessy IRAWATI (Assistant Professor Dr), International Business Management, Strategic Management, Economic Geography, Globalization and Development Studies, Industrial Dynamics and Knowledge Transfer, Newcastle University Business School, U.K.
Elias @Ilias SALLEH (Professor Dr), Architectural Science, Sustainable Tropical Design, Thermal Comfort, Universiti Putra Malaysia, Malaysia.
Gong-Soog HONG (Professor Dr), Economics, Consumer and Family Sciences, The Ohio State University, USA.
Jacqueline Pugh-Kitingan (Associate Professor Dr), Music, Ethnomusicology, Borneo and Papua New Guinea Studies, Universiti Malaysia Sabah, Malaysia.
James R. STOCK (Professor Dr), Management Studies, Marketing, Logistics and Supply Chain Management, Quantitative Method, University of South Florida, USA.
Jayakaran MUKUNDAN (Associate Professor Dr), English Language Studies, Teaching English as a Second Language (TESL), English Language Studies, Universiti Putra Malaysia, Malaysia.
Jayum A. JAWAN (Professor Dr), Sociology, Politics and Government, Civilization Studies, Universiti Putra Malaysia, Malaysia.
Mary Susan PHILIP (Associate Professor Dr), English Language Theatre in Malaysia and Singapore; Postcolonial Theatre, Universiti Malaya, Malaysia.
Mohd. Shahwahid Hj. Othman (Professor Dr), Economics, Natural Resource Economic, Economics Valuation, Universiti Putra Malaysia, Malaysia.
Muzafar Shah HABIBULLAH (Professor Dr), Economics, Monetary Economics, Banking, Macroeconomics, Universiti Putra Malaysia, Malaysia.
Patricia MATUSKY (Dr), Music, Ethnomusicology, Malay and Indonesian language, Literature and Culture, Grand Valley State University, USA.
Samsinar Md. Sidin (Professor Dr), Management Studies, Marketing, Consumer Behaviour, Universiti Putra Malaysia, Malaysia.
Shameem Rafik-Galea (Associate Professor Dr), English Language Studies, Linguistics, Applied Linguistics, Language and Communication, Universiti Putra Malaysia, Malaysia.
Stephen J. HALL (Dr), English Language Studies, Linguist, Teacher Educator, TESOL, Sunway University College, Malaysia.
Stephen J. THOMA (Professor Dr), Psychology, Educational Psychology, The University of Alabama, USA.
Su-Kim LEE (Associate Professor Dr), English Language Studies, Language and Culture, World Englishes and Materials Design, Universiti Kebangsaan Malaysia, Malaysia.
Swee-Heng CHAN (Professor Dr), English Language Studies, Universiti Putra Malaysia, Malaysia.
Turiman Suandi (Professor Dr), Psychology, Youth Development and Volunteerism, Universiti Putra Malaysia, Malaysia.
Victor T. KING (Professor Emeritus Dr), Anthropology /Southeast Asian Studies, White Rose East Asia Centre, University of Leeds, UK.

International Advisory Board
Carolyn GRAHAM, Music, Jazz Chants, Harvard University, USA.
David NUNAN (Professor Emeritus Dr), Vice-President: Academic, Anaheim University, California, English Language Studies, Linguist, TESOL, University of Hong Kong, Hong Kong.
Gary N. MCLEAN (Senior Professor Dr), Executive Director, International Human Resource Development Programs, EAHR, Human Resource Development for National, Community and Social Development, International Human Resource Development, Organizational Development, Texas A&M University, USA.
Graham THURGOOD (Professor Dr), English Language Studies, General Linguistics, Discourse and Syntax, California State University, Chico., USA.
Handoyo Puji Widodo, English Language Studies, ESP, Language Curriculum-Materials Design and Development, and Language Methodology, Politeknik Negeri Jember, East Java-Indonesia.
John R. SCHERMERHORN Jr. (Professor Emeritus Dr), Management Studies, Management and Organizational Behaviour, International Business, Ohio University, USA.
Kent MATTHEWS (Professor Dr), Economics, Banking and Finance, Modelling and Forecasting the Macro Economy, Cardiff Business School, U.K.
Lehman B. FLETCHER (Professor Emeritus Dr), Economics, Agricultural Development, Policy Analysis and Planning, Iowa State University, USA.
Mark P. ORBE (Professor Dr), Communication, Interpersonal Communication, Communication and Diversity, Intercultural Communication, Western Michigan University, USA.
Mohamed Abdel-Ghany (Professor Emeritus Dr), Economics, Family and Consumer Economics, The University of Alabama, USA.
Mohamed ARIFF, CMA (Professor Dr), Economics, Finance, Capital Market, Islamic Finance, Fiscal Policy, Bond University, Australia.
Pal AHLUWALIA (Professor Dr), Pro Vice Chancellor & Vice-President, UNESCO Chair in Transnational Diasporas and Reconciliation Studies, African Studies, Social and Cultural Theory, Post-colonial Theory, Division of Education, Arts & Social Sciences, University of South Australia, Australia.
Phillip JONES (Professor Dr), Architectural Science, Sustainability in the Built Environment, Welsh School of Architecture, Cardiff University, UK.
Rance P.L. LEE (Professor Emeritus Dr), Sociology, The Chinese University of Hong Kong, Hong Kong.
Royal D. COLLE (Professor Emeritus Dr), Communication, Cornell University, USA.
Pertanika Editorial OfficeOffice of the Deputy Vice Chancellor (R&I), 1st Floor, IDEA Tower II, UPM-MTDC Technology Centre
Universiti Putra Malaysia, 43400 Serdang, Selangor, MalaysiaTel: +603 8947 1622
E-mail: [email protected]
PublisherThe UPM Press
Universiti Putra Malaysia43400 UPM, Serdang, Selangor, Malaysia
Tel: +603 8946 8855, 8946 8854 • Fax: +603 8941 [email protected]
URL : http://penerbit.upm.edu.my
The publisher of Pertanika will not be responsible for the statements made by the authors in any articles published in the journal. Under no circumstances will the publisher of this publication be liable for any loss or damage caused by your reliance on the advice, opinion or information obtained either explicitly or implied through the contents of this publication.
All rights of reproduction are reserved in respect of all papers, articles, illustrations, etc., published in Pertanika. Pertanika provides free access to the full text of research articles for anyone, web-wide. It does not charge either its authors or author-institution for refereeing/ publishing outgoing articles or user-institution for accessing incoming articles.
No material published in Pertanika may be reproduced or stored on microfilm or in electronic, optical or magnetic form without the written authorization of the Publisher.
Copyright © 2011 Universiti Putra Malaysia Press. All Rights Reserved.

Preface
The current political, economic and social development locally and globally is very challenging. The challenges affect the social and psychological well-being while at the same time can be very threatening to the human beings. It is therefore very timely to focus on the social and psychological issues impacting human beings. In relation to this an in-house workshop was organized by the School of Psychology and Human Development, Faculty of Social Sciences and Humanities, Universiti Kebangsaan Malaysia at Universiti Kebangsaan Malaysia, Bangi, Selangor from 3-5 May 2011. The theme of the workshop was “Social and Psychological Well-Being”. All papers presented were geared towards this theme.
From a total of 25 research papers, 22 papers were selected based on the recommendations made by the reviewers. The 22 papers met the criterions of the editorial board and fit well with the theme of the workshop. Hence the theme for this collection of papers for this special issue of the Pertanika Journal of Social Sciences and Humanities (JSSH) follows that of the workshop, that is, Social and Psychological Well-Being.
The success of the publication of this special issue is partly due to the cooperation and encouragement from various people. In this regard, we wish to thank our Vice-Chancellor, Professor Tan Sri Dato’ Wira Dr. Sharifah Hapsah Syed Hasan Shahabudin and the Dean of the Faculty of Social Sciences and Humanities, Professor Dr. Hazita Azman for their support and constant reminders about producing quality researches and journal articles. A special thank to the previous Chairman of the School of Psychology and Human Development, Dr Mustaffa Omar and the current Chairperson of the School, Dr. Fatimah Omar, for their relentless encouragement to all academic staffs of the school in their effort to conduct research and publish articles.
The publication of this special issue would not have been possible without the strong support from UPM’s Journal Division especially the Managing Editor, Dr. Nayan Kanwal, and his dedicated Publication Officer, Ms Erica Kwan Lee Yin. Last but not least our heartfelt appreciation goes to all authors of the articles in this special issue for all their efforts and hard work. May the culture of research and publications stay strong to enable us all to contribute to the ever growing needs locally and globally. Let us also pray for individual and collective strength and perseverance towards being accepted and respected in our respective fields.
Guest EditorsSeptember 2011


Pertanika Journal of Social Sciences and Humanities Vol. 19 (S) Oct. 2011
Contents
Special Issue Dedicated to the Theme “Social and Psychological Well-Being”Guest Editor: Rohany NasirGuest Editorial Board: Wan Shahrazad Wan Sulaiman, Rozainee Khairudin and Lukman Zawawi Mohamad
Gender Effects on Self-Esteem, Family Functioning and Resilience among Juvenile Delinquents in Malaysia
1
A. S. Arokiaraj, R. Nasir and W. S. Wan Shahrazad
Parental Support, Personality, Self-efficacy as Predictors for Depression among Medical Students
9
R. Nasir, M. B. Mustaffa, W. S. Wan Shahrazad, R. Khairudinand S. S. Syed Salim
Effects of Emotional Contents on Explicit Memory Process 17R. Khairudin, Mozhgan Valipour Givi, W. S. Wan Shahrazad, R. Nasir and F. W. Halim
Depression, Anxiety and Locus of Control among Elderly with Dementia 27R. Khairudin, R. Nasir, A. Z. Zainah, Y. Fatimah and O. Fatimah
Demographic Variables as Moderators in the Relationship between Job Satisfaction and Task Performance
33
R. Nasir, O. Fatimah, M. S. Mohammadi, W. S. Wan Shahrazad, R. Khairudin and F. W. Halim
Exploring the Meaning of Ageing and Quality of Life for the Sub-Urban Older People
41
K. Alavi, Rahim Md. Sail, M. S. Mohamad, M. Omar, N. Subhi, Sheau Tsuey Chong, N. Sarnon, I. Fauziah and Z. M. Lukman
Betrayal of Trust: The Involvement of Children in Prostitution 49Z. M. Lukman, I. Fauziah, H. M. Rusyda, N. Sarnon, M. K. Mokhtar, Alavi, K., Sheau Tsuey Chong, S. Nen and O. Fatimah
Enhancing Youth Civic Engagement and Generalized Trust Through Bonding Social Capital among Friends
57
Sheau Tsuey Chong, Karen Farquharson, Er Ah Choy, Z. M. Lukman and Mostafa Kamal Mokhtar
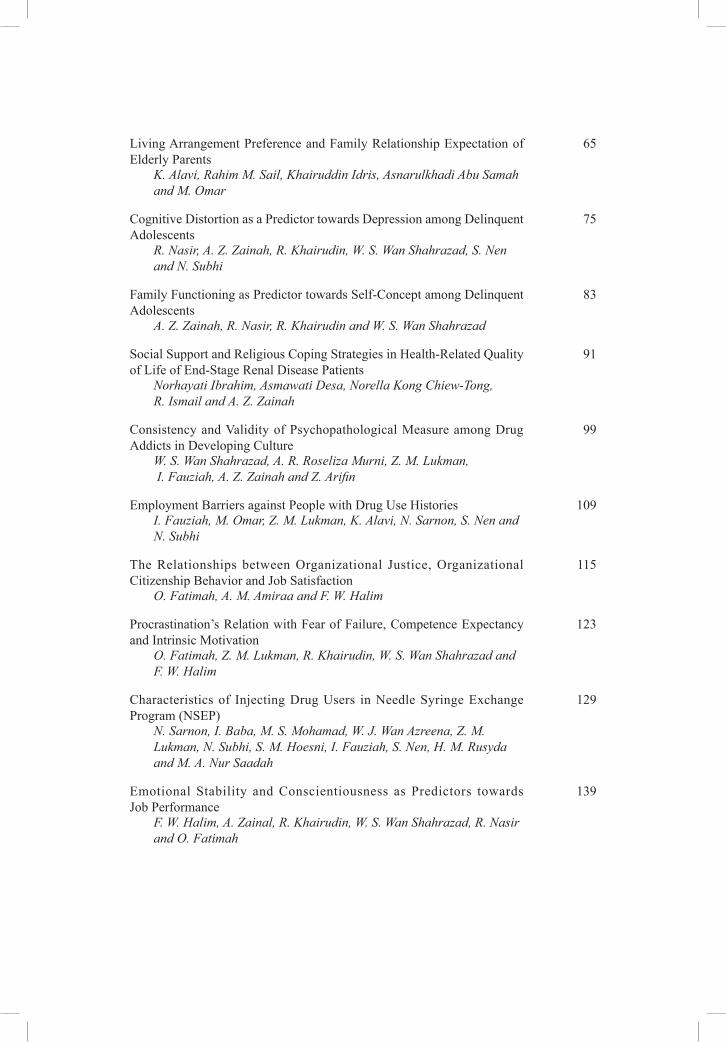
Living Arrangement Preference and Family Relationship Expectation of Elderly Parents
65
K. Alavi, Rahim M. Sail, Khairuddin Idris, Asnarulkhadi Abu Samah and M. Omar
Cognitive Distortion as a Predictor towards Depression among Delinquent Adolescents
75
R. Nasir, A. Z. Zainah, R. Khairudin, W. S. Wan Shahrazad, S. Nen and N. Subhi
Family Functioning as Predictor towards Self-Concept among Delinquent Adolescents
83
A. Z. Zainah, R. Nasir, R. Khairudin and W. S. Wan Shahrazad
Social Support and Religious Coping Strategies in Health-Related Quality of Life of End-Stage Renal Disease Patients
91
Norhayati Ibrahim, Asmawati Desa, Norella Kong Chiew-Tong, R. Ismail and A. Z. Zainah
Consistency and Validity of Psychopathological Measure among Drug Addicts in Developing Culture
99
W. S. Wan Shahrazad, A. R. Roseliza Murni, Z. M. Lukman, I. Fauziah, A. Z. Zainah and Z. Arifin
Employment Barriers against People with Drug Use Histories 109I. Fauziah, M. Omar, Z. M. Lukman, K. Alavi, N. Sarnon, S. Nen and N. Subhi
The Relationships between Organizational Justice, Organizational Citizenship Behavior and Job Satisfaction
115
O. Fatimah, A. M. Amiraa and F. W. Halim
Procrastination’s Relation with Fear of Failure, Competence Expectancy and Intrinsic Motivation
123
O. Fatimah, Z. M. Lukman, R. Khairudin, W. S. Wan Shahrazad and F. W. Halim
Characteristics of Injecting Drug Users in Needle Syringe Exchange Program (NSEP)
129
N. Sarnon, I. Baba, M. S. Mohamad, W. J. Wan Azreena, Z. M. Lukman, N. Subhi, S. M. Hoesni, I. Fauziah, S. Nen, H. M. Rusyda and M. A. Nur Saadah
Emotional Stability and Conscientiousness as Predictors towards Job Performance
139
F. W. Halim, A. Zainal, R. Khairudin, W. S. Wan Shahrazad, R. Nasir and O. Fatimah

The Impact of Vicarious Trauma on Professionals Involved in Child Sexual Abuse Cases (CSA)
147
S. Nen, Jill Astbury, N. Subhi, K. Alavi, Z. M. Lukman, N. Sarnon, I. Fauziah, S. M. Hoesni and M. S Mohamad
Coping with Difficulties: Social Inequality and Stigmatization on Single Mothers with Low Income Household
157
H. M. Rusyda, Z. M. Lukman, N. Subhi, Sheau Tsuey Chong, A. Abdul Latiff, H. Hasrul, and W. M. Wan Amizah
Sexual Identity and Sexual Fluidity among Gay Men and Lesbians 163N. Subhi, D. Geelan, S. Nen, I. Fauziah, M. S. Mohamad, Z. M. Lukman, K. Alavi, S. M. Hoesni and H. M. Rusyda
Illness Perception and Health-Related Quality of Life among Haemodialysis Patients
173
Norhayati Ibrahim, Norella Kong Chiew-Tong and Asmawati Desa


ISSN: 0128-7702Pertanika J. Soc. Sci. & Hum. 19 (S): 1 - 8 (2011) © Universiti Putra Malaysia Press
Received: 3 May 2011Accepted: 28 July 2011*Corresponding Author
INTRODUCTIONLiving in a continuously evolving and advancing world improves persons’ quality of life. However, they also become more prone to negative forces, resulting in their participation in a vast range of social problems, which arise due to the challenging environments they face every day (Laird, 2004; Laursen, 2005). In Malaysia, the rates of juvenile crime had increased steadily from 2002 to 2009 where the number of violent crimes by juvenile offenders such as rape, molest, and armed robbery had almost doubled from 1105 cases to 2394 cases. Based on police records, the number of violent crimes committed by juvenile offenders up to August 2010 was 860 (Hariati, 2010). Out of 2899 drug addicts identified in the year 2009, 43.29% were relapse cases. On an average, five new addicts and four relapse addicts were discovered everyday
throughout the period of January to November 2009 (National Anti Drug Agency, Ministry of Home Affairs, 2009).
Generally, an environment consists of the individual, his/her family, school and community. All these environments are connected and hence, the presence of possible risk and protective factors influence each other by the social relationships formed and its qualities. Adolescents faced with more risk factors are vulnerable to participate in risky behaviors (Ahern et al., 2008). As an example, Mayzer (2004) stated that participants with lower self-esteem were associated with an escalating pattern of aggressive behavior. Adolescent’s aggression were associated with more social problems, family expressiveness, physical discipline, and negative control but less family cohesion. Some predictors of delinquent
Gender Effects on Self-Esteem, Family Functioning and Resilience among Juvenile Delinquents in Malaysia
A. S. Arokiaraj*, R. Nasir and W. S. Wan ShahrazadSchool of Psychology and Human Development, Faculty of Social Sciences and Humanities,
Universiti Kebangsaan Malaysia, 43600 UKM, Bangi, Selangor, Malaysia*E-mail: [email protected]
ABSTRACTResilience is a very important aspect of each individual’s life. Individual characteristics such as self-esteem and family characteristics such as family adaptability and family cohesion pose both risk and protective factors in an individual’s environment. The objective of this research is to determine the relationships that exist between resilience, self-esteem, family adaptability and family cohesion of juvenile delinquents while considering the effect of gender. Respondents were 134 juvenile delinquents (44 males and 90 females) from two juvenile delinquent schools in Malaysia who took part in this exploratory cross-sectional survey research design by responding to The Resilience Scale, The Rosenberg Self-Esteem Scale and The Family Adaptability and Cohesion Scales II. Results showed that self–esteem, family cohesion and family adaptability together with gender did not produce a significant interaction effect with resilience.
Keywords: Self–esteem, family functioning, resilience, juvenile delinquents

A. S. Arokiaraj, R. Nasir and W. S. Wan Shahrazad
2 Pertanika J. Soc. Sci. & Hum. Vol. 19 (S) 2011
behaviors and aggression involved more maternal psychopathology, social problems, and family conflict with an addition of having lower global self-esteem in predicting aggression but not delinquent behavior.
The presence of protective factors within an individual’s environment help them achieve equilibrium to get back on the right track and protect them from succumbing to their vulnerability in making decisions and in their actions (Brooks, 2006; Knight, 2007; Anthony et al., 2009; Ungar et al., 2007; Kumpfer, 1999). Resilience is a personal resource and is defined as the ability to positively adapt and cope successfully, during or after experiencing stressful or risky situations, and in the face of adversity, enabling them to recover to the baseline they originally begin from (Reker, 2008; Rew et al., 2001; Holmes, 2006; Masten et al., 2008; Hauser and Allen, 2006; Ahern et al., 2008). It is developed through interactions of an individual with its social environments, brought about by one’s life changing circumstances and may not be possessed or be able to be developed if a person solely relies on his/her will power alone (Knight, 2007; Reker, 2008; Brooks, 2006). One researcher reported that women have lower levels of resilience compared to men (Sills et al., 2009). Another researcher also has similar findings proving that gender differs significantly in the variable of resilience (Fisher, 2003).
These behaviors could have stemmed from various roots. Firstly, the issue of self-esteem is of significant importance as the identity formation of an individual reaches its peak during adolescence. Self-esteem describes the discrepancies in an individual’s evaluation of his/her self image (who he/she actually is) and his/her ideal self (who he/she wants to be) (Kavas, 2009; Altinyelken, 2009). A study conducted by Bauman (2000) found that lower self-esteem is associated with higher physical abuse. Results showed that there were significant correlations between sexual abuse and stress where girls with more serious sexual abuse experienced more stress. In considering the effect of gender on the variable, Fisher (2003) suggested that there were no gender differences in self-esteem.
Other researchers reported that males have, significantly, slightly higher scores than that of females and vice versa (Craddock, 2009; Ullman and Tatar, 2001).
The family is the primary socializing group in which children develop their personalities through discovering values and attitudes that guide their actions in larger cultures and throughout their lives (Siegel et al., 2003; Cavan and Ferdinand, 1975). The circumstances that occur and situations that arise within a family would relate to and affect all its members. Most juvenile offenders have larger family sizes, come from low to moderate social economic status, broken homes or dysfunctional families such as those with family violence, interfamilial conflicts, erratic disciplining styles, or inconsistent family supervisions (Siegel et al., 2003; Shoemaker, 2010; Nye, 1958; Quay, 1987; Bynum and Thompson, 2002; Glueck and Glueck, 1968; Cavan and Ferdinand, 1975). Family adaptability refers to the amount of flexibility that exists or is displayed in a family (Olson and Gorall, 2003). It refers to the capability of the family system to change when the situation arises for such an occasion to take place. Family cohesion is defined as ‘the emotional bonding that couples and family members have towards one another’. It assesses the degree to which family members are connected to or separated from their family. In considering the effects of gender, Scabini and Galimberti (1995) discovered that gender yields no significant results with family adaptability as a dependant variable. Similar to this, Vincent and McCabe (2000) report no significant differences among both boys and girls on the family adaptability variable. Vincent (2007) states that males have higher mean in measuring family cohesion compared to females. Johnson et al. (2001) reports contrasting results that females have higher levels of family cohesion compared to males.
Besides the gender differences that exists in the variables of resilience, self-esteem family adaptability and family cohesion, many researchers have successfully found links between self–esteem, family cohesion, family adaptability, and resilience. Craddock

Gender Effects on Self-Esteem, Family Functioning and Resilience among Juvenile Delinquents in Malaysia
3Pertanika J. Soc. Sci. & Hum. Vol. 19 (S) 2011
(2009) discovered that both traits and outcome resilience were correlated significantly with self-esteem. Derner (2005) also discovered that a significant positive correlation did exist between resilience and self-esteem. Some other researchers in support of this link include Lee et al. (2008), Veselska et al. (2009), Sewell (2008), Parvizian (2004) and Madrigal (2008). Fisher (2003) reports the existence of a significant positive correlation between resiliency and family adaptability as well as resiliency and family cohesion. Similar to the above, Kim and Yoo (2010) report that the relationship between total resilience and family adaptability is one that is statistically significant.
The objective of this research is to determine the relationships that exist between resilience, self-esteem, family adaptability and family cohesion of juvenile delinquents while considering the effect of gender.
METHODSThe research design is an exploratory cross-sectional survey. It was carried out in two schools for juvenile delinquents; one of which is a boy’s only juvenile delinquent school whereas, the other is a girl’s only juvenile delinquent school. Using a purposive sampling, a total of 134 adolescents between ages 13 to 20 studying in these juvenile delinquent schools (44 males and 90 females; 84.3% Malay, 6.0% Chinese, 9.0 % Indian, and 0.7% others) participated in this study. Three standardized questionnaires were used to collect the data and they were:
1. The Resilience Scale - The Resilience Scale developed by Wagnild and Young (1993) was used in this research. It is a 25–item questionnaire with scores ranging from 25 to 175. Scores above 145 indicate moderately high to high resilience, whereas scores within 125-145 indicate moderately low to moderate levels of resilience, and scores of 120 and below indicate low resilience. The five characteristics that form the conceptual foundation of The Resilience Scale are perseverance,
equanimity, meaningfulness, self-reliant and existential aloneness (Wagnild, 2009). Based on Wagnild (2009), an article was published reviewing 12 studies that have used the Resilience Scale as part of their research. The Cronbach alpha coefficient of these studies ranges from .73 to .91, which indicated an acceptable and moderately high reliability. The Resilience Scale showed to have significant associations with variables such as morale, self-esteem, life satisfaction, depression and perceived stress (Wagnild, 2009). These studies indicated the support on the construct validity of the Resilience Scale (Wagnild, 2009).
2. The Rosenberg Self-Esteem Scale – The Rosenberg Self-Esteem Scale (Rosenberg, 1965) is a 10-item scale that is answered using a four point Likert scale ranging from strongly agree to strongly disagree to test an individuals’ global level of self esteem through statements of self-worth and self-acceptance. The scores obtained from this instrument can range from 0-30. A score of more than 25 indicates high self-esteem, while a score of below 15 indicates low self-esteem. Scores within 15-25 show that participants’ self-esteem is within the normal range or they have moderate self-esteem (Rosenberg, 1965).
The instrument has Cronbach alpha values in the range of 0.77 to 0.88 (Shamshunnisah and Hasanah, 2009). The test-retest correlations were within the range of 0.82 to 0.88. The scale also showed an internal consistency value of 0.670. Schmitt and Allik (2005) reported that the convergent validity of the Rosenberg Self-Esteem Scale was significantly positively related to extraversion at r = .21, p < .05, significantly negatively related to neuroticism at r = -.43, p < .001 and significantly positively related to model of self at r = .25, p < .01. In measuring the discriminant validity of the measure, it was not significantly positively related to openness at r = .12 and not significantly negatively related to model of other at r = -.05.

A. S. Arokiaraj, R. Nasir and W. S. Wan Shahrazad
4 Pertanika J. Soc. Sci. & Hum. Vol. 19 (S) 2011
3. The Family Adaptability and Cohesion Scale II - The Family Adaptability and Cohesion Scale II is a 30-item scale with 16 items measuring cohesion and 14 items measuring adaptability. Participants would respond to a Likert scale which ranges from 1 (almost never) to 5 (almost always) to describe how often a particular behavior takes place in their family. The description of the scores is given in Table 1. For the cohesion scale, the authors have reported a good internal validity of r = .87 and a high reliability value of r = .83. Similarly, for the adaptability scale, the authors also reported a good internal validity of r = .78 and a high reliability value of .80 (Olson and Tiesel, 1991; Saedah, 2004).
TABLE 1 Scoring of the family adaptability and
cohesion scale
Cohesion Adaptability8 80
74 Very Connected
8 7065 Very
Flexible7 7371
7 6455
6 7065
Connected
6 5450
Flexible5 64
605 49
464 59
55Separated
4 4543
Structured3 54
513 42
402 50
35Disengaged
2 3930
Rigid1 34
151 29
15
The first step involves identifying and selecting the participating juvenile delinquent schools, one in Selangor and one in Malacca. Following approval letters from Malaysian Welfare Department, the researcher gathered participants’ details from the respective locations. The students were gathered at a convenient location and time in their schools
and they were briefed on confidentiality issues. Participants then answered the questionnaires. After all the data have been collected, they were analyzed using the Statistical Package for Social Sciences (SPSS).
RESULTS AND DISCUSSIONHypothesis 1: There are s ignif icant interactions between self-esteem and gender on resilience among juvenile delinquents.A two-way between-groups analysis of variance was conducted to explore the impact of gender and self-esteem on resilience and the results are shown in Table 2. Subjects were divided into two groups according to their level of self-esteem (Group 1: low self-esteem; Group 2: moderate self-esteem). There was a statistically significant main effect for self-esteem, F(1, 130)=6.87, p<0.01; however, the effect size was large (partial eta squared=0.05). The main effect for gender, F(1,130)=2.25, p>.05 and the interaction effect F(1, 130) = 0.054, p>.05 did not reach statistical significance.
Hypothesis 2: There are significant interactions between family cohesion and gender on resilience among juvenile delinquents.Results in Table 3 show the two-way between-groups analysis of variance to explore the impact of gender and family cohesion on resilience. There was a statistically significant main effect for family cohesion, F(6, 121)=2.65, p<.0.05; however, the effect size was large (partial eta squared=0.14). Post–hoc comparisons using the Tukey HSD test indicated that the mean score for Group 1 (Disengaged) was 100.13 (SD=26.37) was significantly different from Group 4 (Separated) (M=127.08, SD= 17.24), Group 5 (Connected) (M=129.50, SD=24.78) and Group 7 (Very Connected) (M=154.00, SD=12.73). There were no significant mean differences between Group 2 (Disengaged) (M=119.08, SD=19.56), Group 3 (Separated) (M=124.94, SD=14.26) and Group 6 (Connected) (M=121.33, SD=15.92). The main effect for gender was F(1,121)=0.17, p>.05 and the interaction effect was not significant, F(6, 121)=1.36, p>.05.

Gender Effects on Self-Esteem, Family Functioning and Resilience among Juvenile Delinquents in Malaysia
5Pertanika J. Soc. Sci. & Hum. Vol. 19 (S) 2011
Hypothesis 3: There are no significant interactions between family adaptability and gender on resilience among juvenile delinquents.A two-way between-groups analysis of variance was conducted to explore the impact of gender and family adaptability on resilience and results are shown in Table 4. There was a statistically significant main effect for family adaptability, F(6, 120)=3.23, p<.0.001; however, the effect size was large (partial eta squared=0.12). Post–hoc comparisons using the Tukey HSD test indicated that the mean score for Group 1 (Rigid) was M=106.14, SD=29.81 and Group 2 (Rigid) was M=117.74, SD=18.63 and were significantly different from Group 5 (Flexible) (M=133.27, SD=19.36). Group 3 (Structured) with mean 119.35 (SD=20.64), Group 4 (Structured) with mean 121.68 (SD=18.31), Group 6 (Flexible)
with mean 123.00 (SD=16.20) and Group 7 (Very Flexible) with mean 116.40 (SD=28.54) did not significantly differ from the other groups. The main effect for gender was F(1,120)=0.82, p>.05 and the interaction effect was not significant, F(5, 120)=1.22, p>.05.
Results of this study indicated that self–esteem had a main effect on resilience as supported by Parvizian (2004), however, gender did not. Self-esteem and gender also did not have a significant interaction effect on resilience. Both family cohesion and family adaptability had a main effect on resilience, as supported by previous studies such as Fisher (2003) and Kim and Yoo (2010) respectively. Similar to the above, gender did not have a significant main effect on resilience as suggested by Scabini and Galimberti (1995) and Vincent and McCabe (2000). Both family cohesion and family
TABLE 2 Results of two-way ANOVA on the differences of resilience by gender and self-esteem
Sources of variance Sum of squares df Mean square FGender 886.226 1 886.226 2.247Self-esteem 2707.672 1 2707.672 6.865*Gender*Self-esteem 21.206 1 21.206 .054
* p < .01
TABLE 3 Results of two-way ANOVA on the differences of resilience by gender and family cohesion
Sources of variance Sum of squares df Mean square FGender 65.889 1 65.889 .172Family cohesion 6102.018 6 1017.003 2.652*Gender*Family cohesion 3118.659 6 519.776 1.355
* p < .05
TABLE 4 Results of two-way ANOVA on the differences of resilience by gender and family adaptability
Sources of variance Sum of squares Df Mean square FGender 306.443 1 306.443 .816Family adaptability 7269.936 6 1211.656 3.228*Gender*Family adaptability 2286.128 5 457.226 1.218
* p < .001

A. S. Arokiaraj, R. Nasir and W. S. Wan Shahrazad
6 Pertanika J. Soc. Sci. & Hum. Vol. 19 (S) 2011
adaptability, respectively, with gender, did not yield a significant interaction effect on resilience.
It was clearly identified that there were significant differences across participants who have disengaged family cohesion levels compared to participants with separated, connected and very connected family cohesion levels. As for family adaptability, there were significant differences across participants who have rigid levels of family adaptability levels when compared to participants with flexible family adaptability levels. This shows that participants have various ranges of family cohesion and family adaptability levels which can be at either extreme of the spectrum or somewhere in the middle. Therefore, the influence of family on the resilience level of an individual is clearly not the sole factor that influences adolescents. As an example, despite the various family backgrounds they come from, all the participants in this study were juvenile delinquents. Therefore, the internal characteristics of an individual play a very important contributing role in the resilience development process.
There were no main effects where gender was concerned as gender initially did not have a main effect on resilience. As the addition of self-esteem, family cohesion, and family adaptability together with gender also did not have a significant interaction effect with resilience, it can be concluded that the these variables are stronger when they individually influence resilience more than when they are combined. Another reason could be due to the fact that global gender inequality has declined over the past several decades leading to a lack of gender differences across a vast range of characteristics and fields (Dorius and Firebaugh, 2010).
CONCLUSIONAs a conclusion, it can be determined that self-esteem, family adaptability, and family cohesion have stronger and significant main effects with resilience as opposed to gender’s main effect on resilience or the interaction effect between
gender and the other variables on resilience. In-depth interviews should be conducted with participants, their families as well as their guardians at the juvenile delinquent schools to better understand the existence or the actual impact of self-esteem, family adaptability, family cohesion and gender on resilience.
REFERENCESAhern, N. R., Ark, P., & Byers, J. (2008). Resilience
and coping strategies in adolescents. Paediatric Nursing, 20(10), 32-36.
Altinyelken, H. K. (2009). Migration and self-esteem: A qualitative study among internal migrant girls in Turkey. Adolescence, 44(173), 149-163.
Anthony, A. K., Alter, C. F., & Jenson, J. M. (2009). Development of a risk and resilience based out-of-school time program for children and youths. Social Work, 54(1), 45-55.
Bauman, D. C. (2000). The interrelationship of self-reported abuse, self-esteem, locus of control, stress and adolescent pregnancy. Ph. D Thesis. Temple University.
Brooks, J. E. (2006). Strengthening resilience in children and youths: Maximizing opportunities through the schools. Children & Schools, 28(2), 69-76.
Bynum, J. E., & Thompson, W. E. (2002). Juvenile delinquency: A sociological approach (5th ed.). Boston: Allyn & Bacon.
Cavan, R. S., & Ferdinand, T.N. (1975). Juvenile delinquency (3rd ed.). New York: J.B. Lippincott Company.
Craddock, C. S. (2009). The impact of leadership behaviors on subordinate resilience among adults residing along the Southwest Texas-Mexico border. Ph.D Thesis. Our Lady of the Lake University.
Derner, G. F. (2005). Resilience in a time of terror: Individual, social and familial protective factors in Israeli adolescents. Ph.D Thesis. Adelphi University.
Dorius, S. F., & Firebaugh, G. (2010). Trends in global gender inequality. Social Forces, 88(5), 1941-1968.

Gender Effects on Self-Esteem, Family Functioning and Resilience among Juvenile Delinquents in Malaysia
7Pertanika J. Soc. Sci. & Hum. Vol. 19 (S) 2011
Fisher, Z. F. (2003). Protective factors influencing resiliency among African-American and Latino students. Ph.D Thesis. University of Southern California.
Glueck, S., & Glueck, E. (1968). Unraveling juvenile delinquency. Harvard: Harvard University Press.
Hariati Azizan. (2010). Troubled teens. Star, 7 November, 20 – 21.
Hauser, S. T., & Allen, J.P. (2006). Overcoming adversity in adolescence: Narratives of resilience. Psychoanalytic Inquiry, 26(4), 549-576.
Holmes, K. (2006). Adolescent resilience: The influence of family relationships and their impact on resilient outcomes. Ph.D Thesis. Fordham University.
Johnson, H. D., LaVoie, J. C., & Mahoney, M. (2001). Interparental conflict and family cohesion predictors of loneliness, social anxiety, and social avoidance in late adolescents. Journal of Adolescent Research, 16(3), 304-318.
Kavas, A. B. (2009). Self-esteem and health-risk behaviors among Turkish late adolescents. Adolescence, 44(173), 187-198.
Kim, D. H., & Yoo, I. Y. (2010). Factors associated with resilience of school age children with cancer. Journal of Paediatrics and Child Health, 46(7-8), 431-436.
Knight, C. (2007). A resilience framework: Perspectives for educators. Health Education, 107(6), 543-555.
Kumpfer, K. L. (1999). Factors and processes contributing to resilience: The resilience framework. In M. D. Glantz & J. L. Johnson (Eds.), Resilience and development: Positive life adaptations (pp 179-198). New York: Spring Street.
Laird, N. W. A. (2004). The construction of a measure to assess the development of resilience in adolescents of African descent. Ph.D Thesis. The Florida State University.
Laursen, E. K. (2005). Rather than fixing kids - Build positive peer cultures. Reclaiming Children and Youth, 14(3), 137-142.
Lee, H., Brown, S. L., Mitchell, M. M., & Schiraldi, G. R. (2008). Correlates of resilience in the face of adversity for Korean women immigrating to the US. Journal of Immigrant and Minority Health, 10(5), 415-422.
Madrigal, C. (2008). Acculturation, ethnic identity, resilience, self-esteem and general well-being: A psychosocial study of Colombians in the United States. Ph.D Thesis. The University Of Texas At Arlington.
Masten, A. S., Herbers, J. E., Cutuli, J. J., & Lafavor, T.L. (2008). Promoting competence and resilience in the school context. Professional School Counseling, 12(2), 76-84
Mayzer, R. (2004). First alcohol use and the development of antisocial behavior problems from preschool through early adolescence. Ph.D Thesis. Michigan State University.
National Anti Drug Agency. (2009). Laporan dadah. n.p: Ministry of Home Affairs.
Nye, F. I. (1958). Family relationships and delinquent behaviour. New York: John Wiley & Sons, Inc.
Olson, D. H., & Gorall, D.M. (2003). Circumplex model of marital and family systems. In F. Walsh (Ed.), Normal family processes, 3, 514-547.. New York: Guilford..
Olson, D. H., & Tiesel, J. (1991). FACES II: Linear scoring and interpretation. Minnesota: St. Paul.
Parvizian, P. (2004). The role of social support in resilience among child abuse survivors. Ph.D Thesis. Alliant International University.
Quay, H.C. (ed). (1987). Handbook of juvenile delinquency. New York: John Wiley & Sons Inc.
Reker, G. (2008). Resilience as a mediator of stressful life events and subjective well-being, existential regret, and physical health in older adults. Poster, 62nd Scientific Meeting of the Gerontological Society of America. National Harbour, Maryland, 21-25 November.
Rew, L., Taylor-Seehafer, M., Thomas, N. Y., & Yockey, R. D. (2001). Correlates of resilience in homeless adolescents. Journal of Nursing Scholarship, 33(1), 33-40.

A. S. Arokiaraj, R. Nasir and W. S. Wan Shahrazad
8 Pertanika J. Soc. Sci. & Hum. Vol. 19 (S) 2011
Rosenberg. (1965). Rosenberg self-esteem scale. http://www.yorku.ca/rokada/psyctest/rosen brg.pdf. (7/5/09).
Saedah, A. G. (2004). The effectiveness of family counselling to family adaptability, family cohesion, family environment, problemed behaviour and self-concept of early adolescents with problemed behaviour. Ph.D Thesis. Universiti Kebangsaan Malaysia.
Scabini, E., & Galimberti, C. (1995). Adolescents and young adults: A transition in the family. Journal of Adolescence, 18(5), 593-606.
Schmitt, D. P., & Allik, J. (2005). Simultaneous administration of the Rosenberg self-esteem scale in 53 nations: Exploring the universal and culture-specific features of global self-esteem. Journal of Personality and Social Psychology, 89(4), 623-642.
Sewell, M.A. (2008). Ameliorating fat stigma: Resilience as a correlate to self-esteem, body image, and sexual quality of life for internet-savvy big beautiful women. Doctoral Dissertation. Widener University.
Shamshunnisah, A. B., & Hasanah, C. I. (2009). Designing a culture, language and illness-specific self-esteem scale in Bahasa Malaysia. ASEAN Journal of Psychiatry, 10(2), 1-15.
Shoemaker, D. J. (2010). Theories of delinquency: An examination of explanations of delinquent behaviour (6th ed.). New York: Oxford University Press.
Siegel, L. J., Welsh, B. C., & Senna, J. J. (2003). Juvenile delinquency: Theory, practice and law (8th ed.). Canada: Thomson Wadsworth.
Sills, L. C., Forde, D. R., & Stein, M.B. (2009). Demographic and childhood environmental predictors of resilience in a community sample. Journal of Psychiatric Research, 43(12), 1007-1012.
Ullman, C., & Tatar, M. (2001). Psychological adjustment among Israeli adolescent immigrants: A report on life satisfaction, self-concept, and self-esteem. Journal of Youth and Adolescence, 30(4), 449-463.
Ungar, M., Brown, M., Liebenberg, L., Othman, R., Kwong, W. M., Armstrong, M., & Gilgun, J. (2007). Unique pathways to Resilience across cultures. Adolescence, 42(166), 287-310.
Veselska, Z., Geckova, A. M., Orosova, O., Gajdosova, B., van Dijk, J. P., & Reijneveld, S. A. (2009). Self-esteem and resilience: The connection with risky behavior among adolescents. Addictive Behaviors, 34(3), 287-291.
Vincent, E. R. (2007). Gender differences in protective factors associated with educational, emotional and dual domain resilience. Ph.D. Thesis. Indiana University.
Vincent, M. A., & McCabe, M. P. (2000). Gender differences among adolescents in family, and peer influences on body dissatisfaction, weight loss, and binge eating behaviors. Journal of Youth and Adolescence, 29(2), 205-221.
Wagnild, G. M., & Young, H. M. (1993). Development and psychometric evaluation of the resilience scale. Journal of Nursing Management, 1(2), 165-178.
Wagnild, G. (2009). A review of the resilience scale. Journal of Nursing Measurement, 17(2), 105-113.
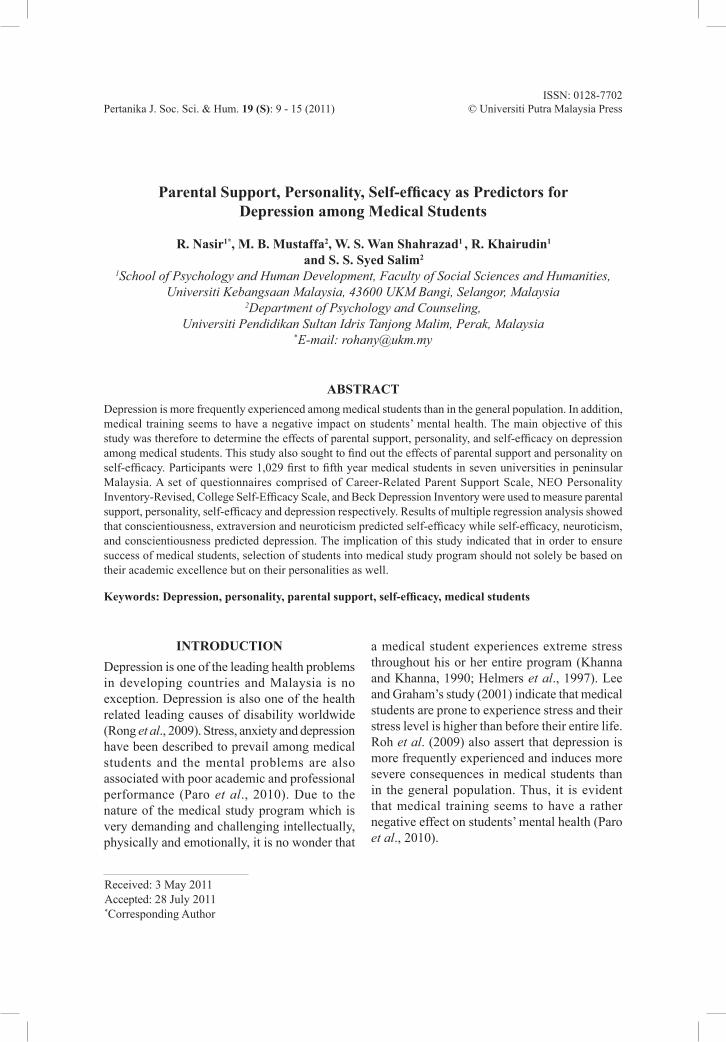
ISSN: 0128-7702Pertanika J. Soc. Sci. & Hum. 19 (S): 9 - 15 (2011) © Universiti Putra Malaysia Press
Received: 3 May 2011Accepted: 28 July 2011*Corresponding Author
INTRODUCTIONDepression is one of the leading health problems in developing countries and Malaysia is no exception. Depression is also one of the health related leading causes of disability worldwide (Rong et al., 2009). Stress, anxiety and depression have been described to prevail among medical students and the mental problems are also associated with poor academic and professional performance (Paro et al., 2010). Due to the nature of the medical study program which is very demanding and challenging intellectually, physically and emotionally, it is no wonder that
a medical student experiences extreme stress throughout his or her entire program (Khanna and Khanna, 1990; Helmers et al., 1997). Lee and Graham’s study (2001) indicate that medical students are prone to experience stress and their stress level is higher than before their entire life. Roh et al. (2009) also assert that depression is more frequently experienced and induces more severe consequences in medical students than in the general population. Thus, it is evident that medical training seems to have a rather negative effect on students’ mental health (Paro et al., 2010).
Parental Support, Personality, Self-efficacy as Predictors for Depression among Medical Students
R. Nasir1*, M. B. Mustaffa2, W. S. Wan Shahrazad1 , R. Khairudin1
and S. S. Syed Salim2
1School of Psychology and Human Development, Faculty of Social Sciences and Humanities, Universiti Kebangsaan Malaysia, 43600 UKM Bangi, Selangor, Malaysia
2Department of Psychology and Counseling, Universiti Pendidikan Sultan Idris Tanjong Malim, Perak, Malaysia
*E-mail: [email protected]
ABSTRACTDepression is more frequently experienced among medical students than in the general population. In addition, medical training seems to have a negative impact on students’ mental health. The main objective of this study was therefore to determine the effects of parental support, personality, and self-efficacy on depression among medical students. This study also sought to find out the effects of parental support and personality on self-efficacy. Participants were 1,029 first to fifth year medical students in seven universities in peninsular Malaysia. A set of questionnaires comprised of Career-Related Parent Support Scale, NEO Personality Inventory-Revised, College Self-Efficacy Scale, and Beck Depression Inventory were used to measure parental support, personality, self-efficacy and depression respectively. Results of multiple regression analysis showed that conscientiousness, extraversion and neuroticism predicted self-efficacy while self-efficacy, neuroticism, and conscientiousness predicted depression. The implication of this study indicated that in order to ensure success of medical students, selection of students into medical study program should not solely be based on their academic excellence but on their personalities as well.
Keywords: Depression, personality, parental support, self-efficacy, medical students

R. Nasir, M. B. Mustaffa, W. S. Wan Shahrazad, R. Khairudin and S. S. Syed Salim
10 Pertanika J. Soc. Sci. & Hum. Vol. 19 (S) 2011
Other studies like those of Dahlin et al. (2005) and Smith et al. (2007) have also shown that depression is a common phenomenon among medical students. A study done in Malaysia by Mohd Sidik et al. (2003) showed a similar picture where they found emotional disturbance to be an exceptional state of affair among medical students.
A significant correlation between emotional disturbances and the medical students’ relationship with their parents, siblings, and lecturers as well as the level of stress before the examinations was discovered by Mohd Sidik et al. (2003). Perceived parental empathy associated with healthy self-development and parental love inconsistency was found to be related to psychological maladjustment (Trumpeter et al., 2008). Further, detrimental parental rearing behaviors were associated with the presence of maladaptive schema (that is depression) (Muris, 2006). Similarly, Mustafa et al. (2010) found significant negative relationship between parental support and depression among medical students.
Findings on the relationship between family functions and depression are somewhat mixed. Some have found that authoritative parenting facilitated a positive perception of self as worthy and masterful and lower levels of depressive symptoms which in turn reduced the likelihood of developing depression (Liew et al., 2010). Takeuchi et al. (2010) suggested that a lower frequency of parental touching during childhood influences the development of depression. Nevertheless, findings like those of Nasir et al.’s (2010; 2011) showed that family did not play a role as a determinant factor leading to depression. Likewise, Sato et al.’s (2000) study on volunteer workers showed that adverse parenting experienced in childhood neither predisposes one to the development of depression in adulthood nor to dysfunctional personality.
In terms of personality effects on depression, empirical work consistently demonstrates that depressed individuals exhibit elevated levels of neuroticism and negative affectivity and reduced levels of extraversion and conscientiousness
(Bagby et al., 2008). Type D (distressed) personality was associated with an increased risk of anxiety and depression (Spiendler et al., 2009). Extraversion, conscientiousness and self-efficacy were found to have negative relationship with depression (Mustafa et al., 2010). The overall findings of Bessel and Priel’s (2005) research highlighted the relevance of personality vulnerability factors in depression in late adulthood.
Findings suggest that parental support lowers depressive symptomatology by the enhancement of maternal self-efficacy (Haslam et al., 2006). Self-efficacy or one’s belief in oneself becomes the main basis in accomplishing any task. According to Bandura (1997), self-efficacy is a belief instilled in oneself about his ability to strategize and execute any action required to achieve a certain goal in life.
Self-efficacy does not only involve one’s ability but also one’s belief in his or her ability to produce effective action results. People with high levels of self-efficacy are more likely to persevere in the face of difficulties, more likely to demonstrate intrinsic motivation when performing a task and have fewer tendencies to be disappointed in the face of failure (Prat-Sala and Redford, 2010). Self-efficacy and self-care behavior have a direct negative effect on depressive symptoms (Weng et al., 2008). Social self-efficacy mediated the association between attachment anxiety and feelings of loneliness and subsequent depression (Wei et al., 2005). A study by Caprava et al. (2010) found significant and direct path from self-efficacy to manage negative emotions to concurrent depression. On one hand, Florika et al. (2004) suggested that self-efficacy may function as a mechanism through which social relations influence depressive symptoms, and that the importance of this mechanism as domain-specific or domain-general may vary with age. On the other hand, Gilliam et al. (2006) suggest that care giving self-efficacy has a strong, direct relationship with depression symptoms for dementia family care givers.
Taking into consideration the significance of few psychological constructs on depression,
Parental Support, Personality, Self-efficacy as Predictors for Depression among Medical Students
11Pertanika J. Soc. Sci. & Hum. Vol. 19 (S) 2011
the main objective of this study was, thus, to determine the predictive factors of parental support, personality, self-efficacy on depression among medical students. This study also examined the effects of parental support and personality on self-efficacy. The five personalities construct under studied are Neuroticism, Extraversion, Openness, Agreeableness, and Conscientiousness.
METHODSThe total number of students involved were 1,029 from the first, second, third, fourth, and fifth years of study in the medical program in seven universities in peninsular Malaysia who have been randomly selected to participate in this study. A cross-sectional technique was used in this research study.
A set of questionnaires comprising the following scales and inventories was used to collect the data. All questionnaires were back translated into the Malay language using Brislin et al.’s (2004) and Marsella’s (1987) back translation techniques. The questionnaires were:
1. Career-Related Parent Support Scale (CRPSS) (Turner et al., 2003) was used to measure parental support. The scale contains 13 positive items. Each item is rated on a five-point Likert scale ranging from 1 (disagree strongly) to 5 (agree strongly). The reliability of CRPSS for the Malay version was .83.
2. NEO Personality Inventory-Revised (NEO-PI-R) (Costa and McCrae, 1992) was used to measure personality. The scale contains 240 items and five factors namely, Neuroticism, Extraversion, Openness, Agreeableness, and Conscientiousness. Each factor contains a total of 48 items (both negative and positive items combined). Each item is rated on a five-point Likert scale from 1 (disagree strongly) to 5 (agree strongly). The reliability of NEO-PI-R for the Malay version was: Neuroticism = .885; Extraversion = .888; Openness = .797; Agreeableness = .864; and Conscientiousness =.911.
3. College Self-Efficacy Scale (CSES; Solberg et al., 1993) was used for the measurement of self-efficacy. This scale contains 19 positive items and each item is rated on a seven-point Likert scale from 1 (no confidence at all) to 7 (full confidence). The reliability of CSES for the Malay version was .877.
4. Beck Depression Inventory (BDI) (Beck and Steer, 1993). BDI which contains 21 items was used to measure symptoms of depression. The reliability of BDI for the Malay version was .900.
This survey research was conducted at seven public institutions of higher learning in Peninsular Malaysia offering medical degrees. Prior to the research, a research proposal together with a letter requesting for permission to conduct research at the universities were submitted to each and every university involved in this research. The research instruments were distributed only after written consents were obtained from all universities. The research instruments were distributed and collected by representatives from the universities. The data were analyzed by using multiple regression analyses.
RESULTS AND DISCUSSION
Effects of Parental Support and Personality on Self-efficacyThe first analysis was done to examine the contributions of conscientiousness, extraversion, neuroticism, agreeableness, openness, and parental support towards self-efficacy. Results of multiple regression analysis as shown in Table 1 showed that conscientiousness, extraversion and neuroticism were significantly correlated at p< 0.001 and contributed 13.6% variance towards self-efficacy among the medical students. The results also showed that parental support, openness, and agreeableness factors of personality were not predictors of self-efficacy.
The main and strongest predictor of self-efficacy was conscientiousness (ß = .224, t =

R. Nasir, M. B. Mustaffa, W. S. Wan Shahrazad, R. Khairudin and S. S. Syed Salim
12 Pertanika J. Soc. Sci. & Hum. Vol. 19 (S) 2011
6.483, p < 0.001) and its contribution was 10.5%. The second strongest predictor was extraversion which contributed 2.5% to self-efficacy (ß = 0.166, t = 5.118, p < 0.001). Neuroticism was the third predictor with a negative effect on self-efficacy and which contributed 0.6% to self-efficacy (ß = -0.070, t = -2.075, p < 0.001).
These results showed that conscientiousness among medical students can increase self-efficacy. One of the characteristics of conscientious individuals is the will to achieve (Digman and Takemoto-Chock, 1981; Raynor and Levine, 2009). This means that these individuals will work hard and persevere in order to get what they aim. It is also worth noting that facets of concientiousness which are competence, order, dutifulness, achievement striving, self-discipline, and deliberation all contributed to the increase in self-efficacy. Self-efficacy has also been known to be a necessity for enabling one to be succesful (Bandura, 1997) especially in a medical program which can be both challenging and taxing on the students intellectually, emotionally, and physically.
Extraversion was also found to be the predictor of self-efficacy in medical students. Individuals who are extrovert are gregarious, active, warm, interested in seeking excitement
and have positive emotion. They are also outgoing, assertive, talkative and tend to experience greater positive emotion (McNiel et al., 2010) which will have a positive effect on self-efficacy.
Effects of Parental Support, Personality and Self-efficacy on DepressionMultiple regression analysis was done to examine the contribution of conscientiousness, extraversion, neuroticism, agreeableness, openness, parental support and self-efficacy as predictors of depression. Table 2 shows the multiple regression results which indicated that self-efficacy, neuroticism and conscientiousness were predictors that were significantly correlated (p < 0.001) and contributed 11.10% variance on depression. This means that parental support, extraversion, opennes and agreeableness did not predict depression significantly.
The strongest predictor was self-efficacy (ß = -0.192, t = -6.126, p < 0.001) and its contribution was 6.7%. Neuroticism was the second strongest predictor and it contributed 4.0% towards depression (ß = 0.171, t = 5.091, p < 0.001) while the third strongest predictor was conscientiousness which contributed 0.4% to depression (ß = -0.081, t = -2.344, p < 0.001).
TABLE 1 Multiple regression analysis between parental support, personality and self-efficacy
Variable R² F Beta ß tConscientiousness .105 20.623* .159 .224 6.483*Extraversion .132 78.005* .135 .166 5.118*Neuroticism .136 53.605* -.051 -.070 -2.075*
*p<0.001
TABLE 2 Multiple regression analysis between parental support, personality, self-efficacy and
depression
Variables R² F Beta ß tSelf-efficacy .067 73.293* -.096 -.192 -6.126*Neuroticism .107 61.152* .063 .171 5.091*Conscientiousness .111 42.778* -.029 -.081 -2.344*
*p<.001
Parental Support, Personality, Self-efficacy as Predictors for Depression among Medical Students
13Pertanika J. Soc. Sci. & Hum. Vol. 19 (S) 2011
The results showed that the three variables self-efficacy, neuroticism, and conscientiousness were predictors that contributed significantly to depression. What this suggests is that parental support, extraversion, openness, and agreeableness did not predict depression. One’s belief in one-self or self-efficacy however, has various effects. Self-efficacy would influence any action taken, how much effort one puts to do things, and one’s resilience against hardships and obstacles in facing failures or problems in life (Bandura, 1997). Self-efficacy would also influence one’s thinking pattern in that those with high self-efficacy are less likely to feel stressed and more frequently perceive a difficult situation as challenging rather than difficult. Moreover, setbacks and failure affect individuals with low self-efficacy more strongly, even in the cases of mild failure (Prat-Sala and Redford, 2010). Thus, self-efficacy is a trait that is essential for someone who is pursuing a medical degree.
Self-efficacy could also reduce depression among medical students. As asserted by Watt (1973) from the medical point of view, depression is a lack of mental and physical ability to face hardships. Thus one should expect an individual with high self-efficacy to have less tendency to experience depression.
The second predictor was neuroticism. Neuroticism affected depression among medical students. A medical student with high score in neuroticism may be prone to depression. This is because neuroticism is the opposite of emotional stability. Persons with high score in neuroticism tends to be anxious, hostile, depress, self-conscious, impulsive and vulnerable to stress. They are also sad, scared, angry, shy and have high dislike for other people or things (Costa and McCrae, 1992).
This result also showed that the more conscientious a student was, the less tendency for him to experience depression. An individual who has a high score in this construct shows competence, order, dutifulness, striving for achievement and self-discipline. On the other hand, low conscientiousness individuals comprise of those with high risk for unhealthy lifestyle and may lack the tendency to strive
for competence and achievement and tend to have less energy and will to achieve their aims (Raynor and Levine, 2009). A conscientious medical student would be better prepared for the program by being self-discipline, hard working, orderly, and competent. As such he is more suited to the program and be able to withstand and meet all the challenges while pursuing the degree no matter how stressful the program is.
Results of this study indicated that parental support did not predict both self-efficay and depression. This may be due to the fact that the students were in their early adulthood and on their own and away from the family environment. Therefore, parents’ influence tend to be less as other factors such as peers and college life enter their lives.
CONCLUSIONIt can be seen that self-efficacy, neuroticism, and conscientiousness significantly predicted depres s ion wh i l e consc i en t iousnes s , extraversion, and neuroticism significantly predicted self-efficacy. This study has a direct implication on the understanding of depression and its predictors among medical students. Mental and emotional stability of medical students are important in order to ensure their smooth and succesful journey in pursuing their studies. It is very important that the universities offering medical programs ensure that selection of students into medical study program is not solely based on their academic excellence alone but on their personalities as well. It is thus pertinent that the prospective students have the right personalities for the program.
REFERENCESBagby, R. M., Quilty, L. C., & Ryder, A.C. (2008).
Personality and depression. Canadian Journal of Psychiatry, 51(1), 14-25.
Bandura, A. (1997). Self-efficacy: The exercise of control. New York: W.H. Freeman and Company.
Beck, A.T., & Steer, R.A. (1993). Beck depression inventory. San Antiono: The Psychological Corporation, Harcourt Brace & Company.

R. Nasir, M. B. Mustaffa, W. S. Wan Shahrazad, R. Khairudin and S. S. Syed Salim
14 Pertanika J. Soc. Sci. & Hum. Vol. 19 (S) 2011
Bessel, A., & Priel, B. (2005). Interpersonal relatedness and self-definition in late adulthood depression: Personality predispositions, and protective factors. Social Behavior and Personality, 33(4), 351-382.
Brislin, R. W., Macnab, B., & Bechtold, D. (2004). Translation. In C.D. Spielberger (Eds.), Encyclopedia of applied psychology (Vol. 3). San Diego: Elsevier.
Caprava, G. V., Gerbio, M., Paciello, M., Di Giunta, L., & Pastorelli, C. (2010). Contracting depression and delinquency in late adolescence. European Psychologist, 15(1), 34-48.
Costa, P. T. Jr., & McCrae, R. R. (1992). NEO PI-R. Professional manual. N. Florida Ave: Psychological Assessment Resources,Inc.
Dahlin, M., Joneborg, N., & Runeson, B. (2005). Stress and depression among medical students. Medical Education, 39(6), 594-604.
Digman, J. M., & Takemoto-Chock, N. K. (1981). Factors in the natural language of personality: Re-analysis, comparison, and interpretation of six major studies. Multivariate Behavioral Research, 16(2), 149-170.
Florika, K. L., Mcilvane, J. M., Brown, E. E., & Autonucci, T. C. (2004). Social relations and depressive symptomatology: Self-efficacy as a mediator. Aging and Mental Health, 10(3), 227-239.
Gilliam, C. M., & Steffen, A. M. (2006). The relationship between care giving, self-efficacy and depressive symptoms in Dementia family caregivers. Aging and Mental Health, 10(2), 79-86.
Haslam, D. M., Pakenham, K. L., & Smith, A. (2006). Social support and post-partum depressive symptomatology, the mediating role of maternal self-efficacy. Infant Mental Health Journal, 27(3), 276-291.
Helmers, K. F., Danoff, D., Steinert, Y., Leyton, M., & Young, S. N. (1997). Stress and depressed mood in medical students, law students, and graduate students at McGill University. Academic Medicine, 72(8), 708-14.
Khanna, J. T., & Khanna, P. (1990). Stress as experienced by medical students. College Student Journal, 24(1), 20-26.
Lee, J., & Graham, A. V. (2001). Students’ perception of medical school stress and their evaluation of a wellness elective. Medical Education, 35(7), 652-659.
Liew, J. H., Cavell, E. G., & Lustig, K. (2010). The influence of authoritative parenting during adolescence on depressive symptoms in young adulthood: Examining the mediating roles of self-development and peer support. Journal of Genetic Psychology, 171(1), 73-92.
McNiel, J. M., Lowman, J. C., & Fleeson, W. (2010). The effect of state extraversion on four types of affect. European Journal of Personality, 24(1), 18-35.
Marsella, A. J. (1987). The measurement of depressive experience and disorder across cultures. In. A. J. Marsella, R. M. A. Hirschfeld, & A. M. M. Katz (Eds.), The measurement of depression (pp. 376-397). New York: The Guilford Press.
Mohd Sidik, S., Rampal, L., & Kaneson, N. (2003). Prevalence of emotional disorders among medical students in a Malaysian university. Asia Pacific Family Medicine, 2(4), 213–217.
Muris, P. (2006). Maladaptive schemas in non-clinical adolescence relations to perceived parental rearing behaviors, big five personality factors and psychopathological symptoms. Clinical Psychology and Psychotherapy, 13(6), 405-413.
Mustafa, M. B., Nasir, R., & Yusooff, F. (2010). Parental support, personality, self-efficacy and depression among medical students. Procedia Social and Behavioral Sciences, 7, 419-424.
Nasir, R., Zainah, A. Z., Khairudin, R., & Latipun, S. (2010). Effects of family functioning, self-esteem, and cognitive distortion on depression among Malay and Indonesian juvenile delinquents. Procedia Social and Behavioral Sciences, 7, 613-620.
Nasir, R., Zainah, A. Z., Khairudin, R., Wan Shahrazad, W. S., & Latipun, S. (2011). Psychosocial factors between Malaysian and Indonesian juvenile delinquents. World Applied Science Journal, 12, 52-57.
Paro, H. B. M. S., Morales, Silva, C. H. M., Razende, C. H. A., Pinto, R. M. C., Morales, R. R., Mendonca, T. M. S., & Prado, M. M. (2010). Health related quality of life of medical students. Medical Education, 44(3), 227-235.

Parental Support, Personality, Self-efficacy as Predictors for Depression among Medical Students
15Pertanika J. Soc. Sci. & Hum. Vol. 19 (S) 2011
Prat-Sala, M., & Redford, P. (2010). Interplay between motivation, self-efficacy and approaches to studying. British Journal of Educational Psychology, 80(2), 283-305.
Raynor, D. A., & Levine, H. (2009). Associations between the five-factor model of personality and health behaviors among college students. Journal of American College Health, 58(1), 73-82.
Roh, M. S., Jeon, H. J., Kim, H., Cho, H. J., Han, S. K., & Hahm, B. J. (2009). Factors influencing treatment for depression among medical students: A nationwide sample in South Korea. Medical Education, 43(2), 133-139.
Rong, Y., Luscombe, G. M., Davenport, T. A., Glozier, N., & Hickie, I. B. (2009). Recognition and treatment of depression: A comparison of Australian and Chinese medical students. Social Psychiatry Psychiatric Epidemiology, 44(8), 636-642.
Sato, T., Uehara, T., Narita, T., Sukada, K., & Fujii, Y. (2000). Parental bonding and personality in relation to a life time history of depression. Psychiatry and Clinical Neuroscience, 54(2), 121-130.
Smith, C. K., Peterson, F., Degenhardt, B. F., & Johnson, J. C. (2007). Depression, anxiety and perceived hassles among entering medical students. Psychology, Health & Medicine, 12(1), 31- 39.
Spiendler, H., Kruse, C., Zwisker, A-D., & Pederson, S. S. (2009). Increased anxiety and depression in danish cardiac patients with type d personality: Cross validation of the type d scale (DS14). International Journal of Behavior Medicine, 16(2), 98-107.
Solberg, V. S., O’Brien, K., Villareal, P., Kennel, R., & Davis, B. (1993). Self-efficacy and Hispanic college students: Validation of the college self-efficacy instrument. Hispanic Journal of Behavioral Sciences, 15(1), 80-95.
Takeuchi, M. S., Miyaoka, H., Tomoda, A., Suzuki, M., Liu, Q., & Kitamuru, T. (2010). The effect of interpersonal touch during childhood on adult attachment and depression: A neglected area of family and developmental psychology. Journal of Child and Family Studies, 19(1), 109-117.
Trumpeter, N. N., Watson, P. J., O’Leary, B. J., & Weatherington, B. L. (2008). Self- functioning and perceived parenting relations of parental empathy and love inconsistency with narcissism, depression and self-esteem. The Journal of Genetic Psychology, 169(1), 51-71.
Turner, S. L., Ailiman-Brissett, A., Lapan, R. T., Udipi, S., & Ergun, D. (2003). Career-related parent support scale. Measurement and Evaluation in Counseling and Development, 36, 83-94.
Watt, C. A. H. (1973). Depression: The blue plague. Westport: Technomic Publishing Company.
Wei, M., Russell, D. W., & Zakalik, R. A. (2005). Social self-efficacy mediated the association between attachment anxiety and feelings of loneliness and subsequent depression. Journal of Counseling Psychology, 52(4), 602-614.
Weng, L-C., Dai, Y-T., Wang, Y-W., Huang, H-L., & Chiang, Y-J. (2008). Effects of self-efficacy, Self-care behaviors on depressive symptoms of Taiwanese kidney transplant recipients. Journal of Clinical Nursing, 17(13), 1786-1794.

R. Nasir, M. B. Mustaffa, W. S. Wan Shahrazad, R. Khairudin and S. S. Syed Salim
16 Pertanika J. Soc. Sci. & Hum. Vol. 19 (S) 2011

ISSN: 0128-7702Pertanika J. Soc. Sci. & Hum. 19 (S): 17 - 26 (2011) © Universiti Putra Malaysia Press
Received: 3 May 2011Accepted: 28 July 2011*Corresponding Author
INTRODUCTIONMemory can be understood as in two categories, explicit and implicit. Explicit memory is the ability to consciously recall some experience or thought. Implicit memory is an experience that one may not be able to consciously recall yet can be shown to be present. Direct tests of memory, such as recognition and recall tasks, are often used to measure explicit memory. On the other hand, indirect tests of memory, such as word stem and perceptual identification test, are used to measure implicit memory (Schacter, 1987).
There are at least two types of measuring memory: recall and recognition. Recall can be carried out to comply with different kinds of instructions, but three types of instruction are commonly used, creating three types of recall test: free recall, serial recall, and cued recall. In free recall, participants are asked to recall as many studied items as possible, without regard to the order in which items were presented; for
example, a responder might write the last word presented, then the first word, then a word from the middle of the list, and so on. In serial recall, responders recall items in the order in which they were presented. In cued recall, responders are given explicit cues and are asked to recall items that go with the cue.
Recognition test is an explicit memory test, because participants are (explicitly) asked whether they had seen each particular word before (Bauer, 2004). In recognition tasks, people are asked to indicate whether or not some given information is remembered from a prior experience. Because recognition tasks present a test item, rather than ask for a re-production of an item as in the recall task, laboratory studies of recognition include a wider variety of materials than do studies of recall. Words, pictures, and other kinds of stimulus materials are found much more often in recognition studies than in recall studies. Additionally,
Effects of Emotional Contents on Explicit Memory Process
R. Khairudin*, Mozhgan Valipour Givi, W. S. Wan Shahrazad, R. Nasir and F. W. Halim
School of Psychology and Human Development, Faculty of Social Sciences and Humanities,Universiti Kebangsaan Malaysia, 43600 UKM, Bangi, Selangor, Malaysia
*E-mail: [email protected]
ABSTRACTIn two experiments, a recognition test was used to investigate the effects of emotional words and pictures on explicit memory. In Experiment 1, participants viewed a list of positive, negative, and neutral pictures and in Experiment 2, a list of positive, negative, and neutral words was shown to participants. A recognition test was conducted after a 30 minute interval. Results showed that pictures were remembered better than words. Positive emotional contents had an advantage in explicit memory when compared to negative contents. There was also evidence to suggest that explicit memory was suppressed when contents were negative. The findings provided evidence for the significant role of valence on explicit memory recognition processes.
Keywords: Explicit memory, emotional words, emotional pictures, recognition test

R. Khairudin, Mozhgan Valipour Givi, W. S. Wan Shahrazad, R. Nasir and F. W. Halim
18 Pertanika J. Soc. Sci. & Hum. Vol. 19 (S) 2011
recognition tasks are classified in terms of the way participants respond: yes or no recognition tasks ask participants to indicate for each single item whether it is “old” (previously presented in the experiment), or “new” (not previously presented in the experiment), whereas forced choice recognition tasks have participants select which item, from a set of 2 or more items that was presented previously in the experiment.
Memory often is better for emotional events than for events lacking emotional relevance. This emotional memory enhancement effect has been demonstrated in a wide range of laboratory studies, using a variety of verbal and nonverbal stimuli (Hamann, 2001).
In our daily lives, we experience many events that trigger an emotional response: We receive a compliment, witness a car crash, or watch children playing in a park. One widely accepted framework used to classify these diverse emotional experiences describes emotion in two orthogonal dimensions: Valence is a continuum specifying how negative or positive an event is, whereas arousal refers to the intensity of an event, ranging from very calming to highly exciting or agitating (e.g., Lang, Greenwald, Bradley and Hamm, 1993).
The influence of emotion on cognition is vast and important. From the moment a new born baby opens its eyes, emotion is already playing a role in shaping the infant’s cognition. Studies suggest that an early positive emotional bond with mothers may aid in the development of earliest mental representations (Hofer, 1994). Research has also shown that early visual processing of stimuli is improved by signals of emotionality. That is, positive or negative valence (relative to neutral) of a stimulus can change how we process that information. In a study by Sato, Kochiyama, Yoshikawa and Matsumura (2001), event related potentials (ERPs) were used to measure brain activity of participants viewing emotional (happy or fearful) and neutral faces. Statistical analyses of the ERP data revealed that brain regions involved in early visual processing were more activated for emotional relative to neutral faces. If emotionality affects processes as primary as
early visual processing, then emotionality may also affect higher order cognitive processes such as memory.
Studies have shown that emotion may influence our memories, such that it increases how well we remember information (Cahill and McGaugh, 1995; Hadley and MacKay, 2006). This “emotionality boost” has been demonstrated using different types of stimuli including pictures, words, sentences and narrated slide shows. In all of these studies, emotional stimuli (positively and negatively valenced) were remembered better than neutral stimuli.
Empirically, emotion has been shown to enhance memory under some conditions and to have a detrimental effect under other conditions. For example, free recall for emotionally negative, and sometimes positive, pictures, words, and slide sequences may be increased compared with recall for non-emotional items (Phelps, Labar and Spencer, 1997; Doerksen and Shimamura, 2001). Similarly, some researchers have found that recognition memory for emotional pictures and slide sequences are enhanced compared with recognition of non-emotional information (Heuer and Reisberg, 1990; Burke, Heuer and Reisberg, 1992; Ochsner, 2000).
In a study by Kensinger, Garoff-Eaton and Schacter (2007), the goal was to study emotional effect on memory in young adults and old adults. Photo objects were used to investigate whether an object is influenced by the item’s emotional valence (whether it is positive or negative). In the first experiment, recognition task was performed after 30 minutes interval for old adults and 2 days for young adults and in experiment two they performed recognition task on both groups after 30 minutes.
Results showed that both age groups showed enhanced specific recognition for photos of negatively valenced objects. Young adults‘ general recognition advantage also was restricted to negative photo objects, whereas older adults showed enhanced general recognition for positive and negative emotional objects. Negative content enhanced the visual specificity of memory in both ages, but positive content conferred a general memory advantage only for

Effects of Emotional Contents on Explicit Memory Process
19Pertanika J. Soc. Sci. & Hum. Vol. 19 (S) 2011
older adults. It has been found that emotion does not enhance memory for all aspects of presented information.
In the study conducted by Kuchinke et al. (2006), it was questioned whether emotional valence influences word recognition, even when participants do not have to pay attention to the emotional content of the stimuli for executing the task.. There were 360 test items; 180 (60 positive, 60 neutral and 60 negative) German words, and also a set of 180 orthographically legal and pronounceable non-words was created as randomly assigned letter strings, designed to be very word-like. Participants were all from a German university. In the testing task participants were instructed to respond as quickly and accurately as possible, by pressing the left mouse button for ‘WORD’ and the right mouse button for ‘NONWORD’. The behavioral results of this study indicated interactive effects of emotional valence and word in visual word recognition, emotional valence was found to significantly enhance performance.
Kensinger and Corkin (2003) examined whether individuals were more likely to remember details of the presentation of negative words, as compared with neutral words. In Experiment 1, words were selected from the Affective Norms for English Words database of words. One half of the words were neutral, and one half were negative. A self-paced recognition test occurred after a 15-min delay. The remember– know procedure was used to examine the effect of emotion on the vividness of an individual’s memory, showing that remember responses were more frequently assigned to negative words than neutral words. These results showed that negative emotional words have an effect on memory and they can be remembered with more details than neutral ones. However, the effects positive emotional contents are still not clear.
Several questions can be addressed relating to the effects of emotional contents on memory process, such as, is there any difference between remembering different kinds of stimulus in
explicit memory? Also is there any difference between remembering different types of emotion in explicit memory? Therefore, it was hypothesized that there is a significant difference in remembering between positive, negative, and neutral (baseline) stimuli in explicit memory. Participants would be more likely to remember the positive and negative stimulus (pictures and words) than neutral ones and less likely to remember stimulus presented with negative valence than those presented with positive valence. In addition we hypothesized that pictures will be remembered better than words in explicit memory.
The current study investigates the effects of different types of emotion (positive, negative, neutral (baseline)) and stimulus (word and picture) on explicit memory. We assessed explicit memory for negative and positive valence stimulus (word and picture), by showing slides containing different kinds of pictures (negative, positive and neutral) and words having different meanings (negative, positive and neutral) to participants. The present study examined whether negative and positive emotions can influence participants’ abilities to remember words and pictures explicitly. In particular, participants studied series of pictures and words, one third with a negative valence, one third with positive valence and the rest having no valence (neutral condition).
METHODS
Experiments 1 and 2These experiments were designed to study the effects of emotional contents on explicit memory. In this experiment, a mixed-factorial design was used: 1 between-subject factor: 2 stimulus type (picture and word) and 1 within-subject factor: 3 valences (negative, positive and neutral (baseline condition). This experiment was further broken into two parts, in experiment 1 with picture stimuli and in experiment 2 with word stimuli used. In both experiments participants were examined by using recognition test.
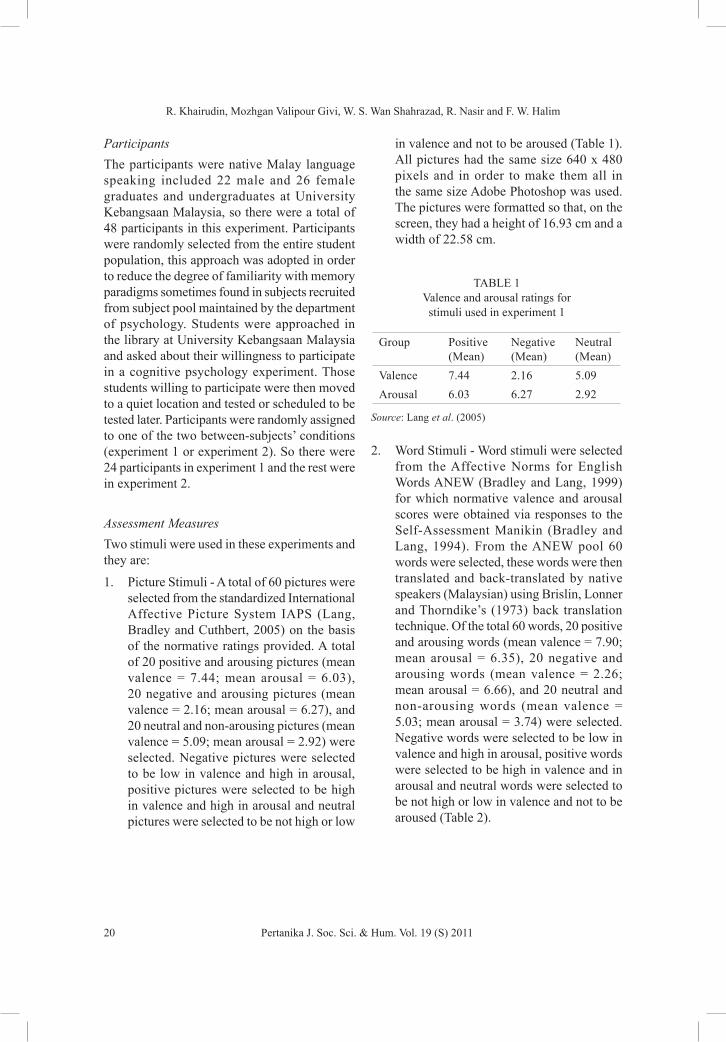
R. Khairudin, Mozhgan Valipour Givi, W. S. Wan Shahrazad, R. Nasir and F. W. Halim
20 Pertanika J. Soc. Sci. & Hum. Vol. 19 (S) 2011
ParticipantsThe participants were native Malay language speaking included 22 male and 26 female graduates and undergraduates at University Kebangsaan Malaysia, so there were a total of 48 participants in this experiment. Participants were randomly selected from the entire student population, this approach was adopted in order to reduce the degree of familiarity with memory paradigms sometimes found in subjects recruited from subject pool maintained by the department of psychology. Students were approached in the library at University Kebangsaan Malaysia and asked about their willingness to participate in a cognitive psychology experiment. Those students willing to participate were then moved to a quiet location and tested or scheduled to be tested later. Participants were randomly assigned to one of the two between-subjects’ conditions (experiment 1 or experiment 2). So there were 24 participants in experiment 1 and the rest were in experiment 2.
Assessment MeasuresTwo stimuli were used in these experiments and they are: 1. Picture Stimuli - A total of 60 pictures were
selected from the standardized International Affective Picture System IAPS (Lang, Bradley and Cuthbert, 2005) on the basis of the normative ratings provided. A total of 20 positive and arousing pictures (mean valence = 7.44; mean arousal = 6.03), 20 negative and arousing pictures (mean valence = 2.16; mean arousal = 6.27), and 20 neutral and non-arousing pictures (mean valence = 5.09; mean arousal = 2.92) were selected. Negative pictures were selected to be low in valence and high in arousal, positive pictures were selected to be high in valence and high in arousal and neutral pictures were selected to be not high or low
in valence and not to be aroused (Table 1). All pictures had the same size 640 x 480 pixels and in order to make them all in the same size Adobe Photoshop was used. The pictures were formatted so that, on the screen, they had a height of 16.93 cm and a width of 22.58 cm.
TABLE 1 Valence and arousal ratings for stimuli used in experiment 1
Group Positive (Mean)
Negative (Mean)
Neutral (Mean)
Valence 7.44 2.16 5.09Arousal 6.03 6.27 2.92
Source: Lang et al. (2005)
2. Word Stimuli - Word stimuli were selected from the Affective Norms for English Words ANEW (Bradley and Lang, 1999) for which normative valence and arousal scores were obtained via responses to the Self-Assessment Manikin (Bradley and Lang, 1994). From the ANEW pool 60 words were selected, these words were then translated and back-translated by native speakers (Malaysian) using Brislin, Lonner and Thorndike’s (1973) back translation technique. Of the total 60 words, 20 positive and arousing words (mean valence = 7.90; mean arousal = 6.35), 20 negative and arousing words (mean valence = 2.26; mean arousal = 6.66), and 20 neutral and non-arousing words (mean valence = 5.03; mean arousal = 3.74) were selected. Negative words were selected to be low in valence and high in arousal, positive words were selected to be high in valence and in arousal and neutral words were selected to be not high or low in valence and not to be aroused (Table 2).

Effects of Emotional Contents on Explicit Memory Process
21Pertanika J. Soc. Sci. & Hum. Vol. 19 (S) 2011
TABLE 2 Valence and arousal ratings for stimuli used in experiment 2
Group Positive (Mean)
Negative (Mean)
Neutraln (Mean)
Valence 7.90 2.26 5.03Arousal 6.35 6.66 3.47
Source: Bradley and Lang (1999)
Experiment 1
ProcedureThe experiment was conducted on a laptop using the Microsoft PowerPoint 2007 and participants were seated comfortably in a chair in front of the stimulus presentation monitor. Laptop was placed at approximately 30 cm distance and all participants were presented with the same pictures.
The experimental session consisted of three phases: Study, Break and Test phase. The duration of each study phase was 2 minutes 30 s, followed by a 30-minute rest interval before the test phase. There was a practice session before each of Study and Test phases. These practice trials gave the experimenter a chance to make sure that each participant understood the nature of the task.
Study PhasePractice phase was employed to familiarize the participants with the experimental procedure and it was consisting of 4 pictures. These pictures were presented on the monitor, to help participants understand the procedures. Once the practice phase had been successfully completed, the study phase began. In the study phase of the experiment, the participants saw a list of 30 pictures (10 positive emotional, 10 negative emotional, and 10 neutral pictures). The participants were instructed to look carefully and not to miss any picture. The duration of presentation for each picture was 4 s with a blank screen for 1 s in between the pictures and the order of list of the pictures was randomized,
so that no several negative, positive or neutral pictures could be presented subsequently in order to limit habituation.
Test PhaseFollowing the study phase, there was a delay (Break) of 30 minutes. After Break time the practice phase was performed to help participants understand the test procedure. In the practice phase the experimenter told participants that they would see some more pictures and their task was to simply say “yes” to previously seen or “no” to not previously seen pictures. Following the practice phase and after making sure that participants understood the procedure the test phase was performed.
Test phase was as follow, the recognition test started with the experimenter showing the participants the list of pictures, which consisted of 30 (non-studied) distracters (10 positive, 10 negative, and 10 neutral pictures) and 30 previous studied items (10 positive, 10 negative, and 10 neutral pictures). Previously studied and distracter pictures were randomly distributed through a presentation sequence of 60 total pictures, using the same equipment as in the study task.
Subjects were required to respond “yes” if they judged that the picture had been previously studied in the study phase, and to respond “no” if they did not judge that the picture had been presented in the study phase or simply to provide a “yes” response for the previously studied pictures and a “no” answer for the distracter pictures. They were asked to judge as quickly and accurately as possible. Pictures were presented until a response was registered, then the next image was presented, so the total time taken to complete the recognition task was thus variable for each participant.
Experiment 2
ProcedureThe procedure in Experiment 2 was similar to the one in Experiment 1, except that in this experiment words were used instead of pictures.

R. Khairudin, Mozhgan Valipour Givi, W. S. Wan Shahrazad, R. Nasir and F. W. Halim
22 Pertanika J. Soc. Sci. & Hum. Vol. 19 (S) 2011
RESULTS AND DISCUSSIONA two-factor ANOVA was conducted, the factors involved were stimulus type (word and picture) as the between-subject factor and valences (positive, negative, and neutral (baseline)) as the within-subject factor (Table 3). Results from ANOVA showed that there was a significant effect of different types of valence (F (2, 92) = 10.53, p = 0.000). Post-hoc test showed that there was a significant difference between positive and negative emotions (t (47) =3.095, p=0.003). Positive emotional information was remembered better than negative ones (Mean=8.67, Mean=8.00; for positive, and for negative, respectively). The difference between negative emotion and neutral condition was significant too (t (47) = -4.178, p=0.000) Negative content stimuli were remembered significantly less than neutral stimuli with a difference of 0.81. However, positive content stimuli and neutral stimuli did not differ (t(47)= -0.603, p=0.549) (Table 4).
TABLE 3 Summary of ANOVA results
Source F df P-valueValence 10.530 2 .000**Stimuli 6.542 1 .014*Valence * Stimuli 16.732 2 .000**
*p < 0.05, **p<0.0001
TABLE 4 Summary of T-test results shows the interaction between different valences (positive, negative,
and neutral (baseline)) considering both stimulus (picture and word)
t df P-value
Positive-Negative 3.095 47 .003*
Positive-Neutral -0.603 47 .549Negative-Neutral -4.178 47 .000**
*p < 0.01, **p<0.0001
There was also a significant effect of stimulus type (F (1, 46) = 6.54, p = 0.014). Pictures were remembered better than words (Mean=26.04. Mean=24.91; for pictures, for words, respectively). There was also a significant interaction between valence and stimulus type (F (2, 92) = 16.73, p = 0.000). Further analysis using t-test indicated that positive emotional pictures were remembered significantly more than neutral pictures (t (23) = 3.943, p= 0.001)(Mean=9.46, Mean=8.54; for positive, for neutral, respectively). Furthermore, positive pictures were remembered significantly better than negative pictures (t (23) = 5.411, p= 0.000) mean value for positive pictures (Mean = 9.46) was higher than negative pictures (Mean = 8.04). However, participants’ performance on negative pictures did not differ than that on neutral pictures (t (23) = - 1.906, p= 0.069) (Table 5).
TABLE 5 Summary of the T-test results shows the Interaction between different valences
(positive, negative and neutral (baseline)) in Experiment 1 picture stimuli)
t df P-valuePositive-Negative 5.411 23 .000**Positive-Neutral 3.943 23 .001*Negative-Neutral -1.906 23 .069
*p < 0.001, **p<0.0001
To investigate the effect of different types of valence on words, t-test was conducted. Results showed that, positive emotional words were significantly less remembered than baseline condition (neutral words) (t(23) = -4.099, p= 0.000). Mean value for positive words (Mean = 7.88), was less than neutral words (Mean = 9.08). Negative emotional words were remembered significantly less than baseline condition (neutral words) (t(23) = -4.048, p= 0.000). Mean value for negative words (Mean = 7.96) was less than neutral words (Mean = 9.08). However there was no difference in performance between positive emotional and negative emotional words (t(23) = - 0.310, p= 0.759) (Table 6).
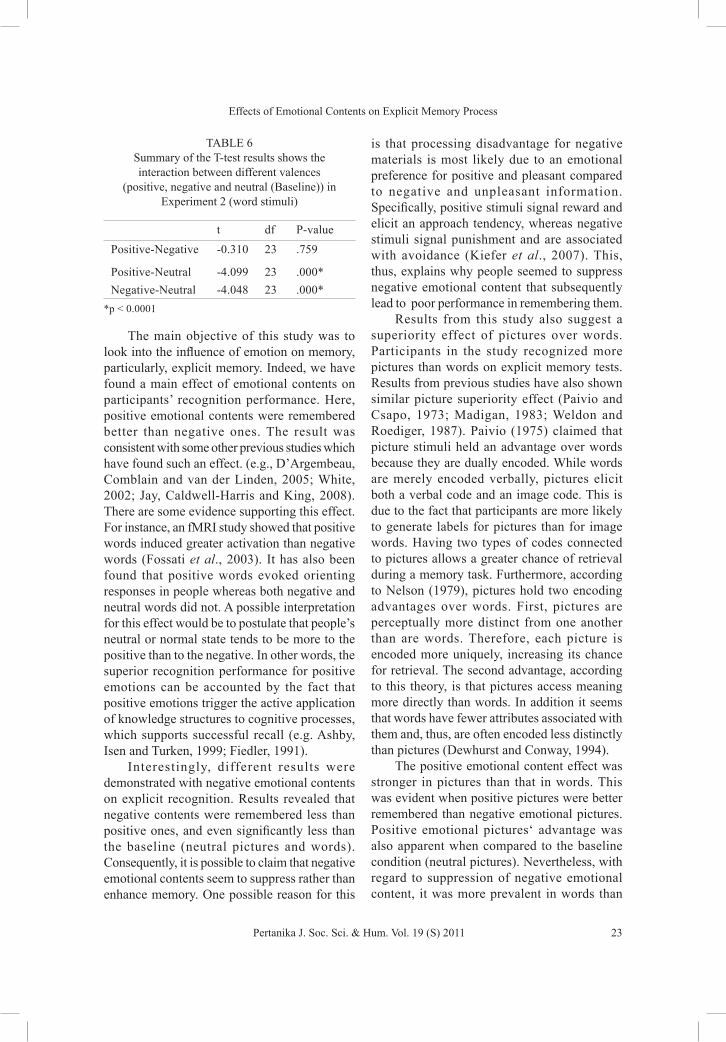
Effects of Emotional Contents on Explicit Memory Process
23Pertanika J. Soc. Sci. & Hum. Vol. 19 (S) 2011
TABLE 6 Summary of the T-test results shows the interaction between different valences
(positive, negative and neutral (Baseline)) in Experiment 2 (word stimuli)
t df P-value
Positive-Negative -0.310 23 .759
Positive-Neutral -4.099 23 .000*Negative-Neutral -4.048 23 .000*
*p < 0.0001
The main objective of this study was to look into the influence of emotion on memory, particularly, explicit memory. Indeed, we have found a main effect of emotional contents on participants’ recognition performance. Here, positive emotional contents were remembered better than negative ones. The result was consistent with some other previous studies which have found such an effect. (e.g., D’Argembeau, Comblain and van der Linden, 2005; White, 2002; Jay, Caldwell-Harris and King, 2008). There are some evidence supporting this effect. For instance, an fMRI study showed that positive words induced greater activation than negative words (Fossati et al., 2003). It has also been found that positive words evoked orienting responses in people whereas both negative and neutral words did not. A possible interpretation for this effect would be to postulate that people’s neutral or normal state tends to be more to the positive than to the negative. In other words, the superior recognition performance for positive emotions can be accounted by the fact that positive emotions trigger the active application of knowledge structures to cognitive processes, which supports successful recall (e.g. Ashby, Isen and Turken, 1999; Fiedler, 1991).
Interestingly, different results were demonstrated with negative emotional contents on explicit recognition. Results revealed that negative contents were remembered less than positive ones, and even significantly less than the baseline (neutral pictures and words). Consequently, it is possible to claim that negative emotional contents seem to suppress rather than enhance memory. One possible reason for this
is that processing disadvantage for negative materials is most likely due to an emotional preference for positive and pleasant compared to negative and unpleasant information. Specifically, positive stimuli signal reward and elicit an approach tendency, whereas negative stimuli signal punishment and are associated with avoidance (Kiefer et al., 2007). This, thus, explains why people seemed to suppress negative emotional content that subsequently lead to poor performance in remembering them.
Results from this study also suggest a superiority effect of pictures over words. Participants in the study recognized more pictures than words on explicit memory tests. Results from previous studies have also shown similar picture superiority effect (Paivio and Csapo, 1973; Madigan, 1983; Weldon and Roediger, 1987). Paivio (1975) claimed that picture stimuli held an advantage over words because they are dually encoded. While words are merely encoded verbally, pictures elicit both a verbal code and an image code. This is due to the fact that participants are more likely to generate labels for pictures than for image words. Having two types of codes connected to pictures allows a greater chance of retrieval during a memory task. Furthermore, according to Nelson (1979), pictures hold two encoding advantages over words. First, pictures are perceptually more distinct from one another than are words. Therefore, each picture is encoded more uniquely, increasing its chance for retrieval. The second advantage, according to this theory, is that pictures access meaning more directly than words. In addition it seems that words have fewer attributes associated with them and, thus, are often encoded less distinctly than pictures (Dewhurst and Conway, 1994).
The positive emotional content effect was stronger in pictures than that in words. This was evident when positive pictures were better remembered than negative emotional pictures. Positive emotional pictures‘ advantage was also apparent when compared to the baseline condition (neutral pictures). Nevertheless, with regard to suppression of negative emotional content, it was more prevalent in words than

R. Khairudin, Mozhgan Valipour Givi, W. S. Wan Shahrazad, R. Nasir and F. W. Halim
24 Pertanika J. Soc. Sci. & Hum. Vol. 19 (S) 2011
in pictures. Negative emotional words were poorly recognized when compared to the baseline condition (neutral words). The effect of valence on the likelihood of remembering information can be explained by the proposal that memory mechanisms have evolved to facilitate the encoding and retrieval of the affective information that is most relevant to one’s goals (Lazarus, 1991; LeDoux, 1998). For this reason, positive emotion can be relevant to one’s goals. Indeed, when positive stimuli are related to one’s current concerns they capture one‘s attention (Riemann and McNally, 1995). Furthermore, there is some evidence that individuals who seek positive goal states show enhanced memory for positive as compared to negative events (Mather and Carstensen, 2005). In this study, we have shown that the positive emotion advantage was more obvious in pictures than in words.
CONCLUSIONThis study contributed to the better understanding of the effect of emotional contents on explicit memory. The results of this study have given some insights into the role of emotion on memory in relation to the types of information to be remembered. The significance of emotional contents, especially, positive and negative emotions can also have their practical benefits in different aspects of life. For example, findings from this study are able to benefit those in advertising business. Insights from this study can direct advertisers in making their advertisements more effective leading to higher purchase of their products.
REFERENCESAshby, F. G., Isen, A. M., & Turken, A. U. (1999). A
neuropsychological theory of positive affect and its influence on cognition. Psychological Review, 106(3), 529-550.
Bauer, P. J. (2004). Getting explicit memory off the ground: Steps toward construction of a neuro-developmental account of changes in the first two years of life. Memory Development in the New Millennium, 24(4), 347-373.
Bradley, M. M., & Lang, P. J. (1994). Measuring emotion: The self-assessment manikin and the semantic differential. Journal of Behavioral Therapy and Experimental Psychiatry, 25(1), 49-59.
Bradley, M. M., & Lang, P. J. (1999). Affective norms for English words (ANEW): Instruction manual and affective ratings. Technical Report C-1, the Center for Research in Psychophysiology, University of Florida.
Brislin, R. W., Lonner, W. J., & Thorndike, R. M. (1973).Cross-cultural research methods. New York: John Wiley & Sons
Burke, A., Heuer, F., & Reisberg, D. (1992). Remembering emotional events. Memory & Cognition, 20, 277-290.
Cahill, L., & McGaugh, J. L. (1995). A novel demonstration of enhanced memory associated with emotional arousal. Consciousness and Cognition, 4, 410–421.
D’Argembeau, A., Comblain, C., & van der Linden, M. (2005). Affective valence and the self reference effect: Influence of retrieval conditions. British Journal of Psychology, 96(4), 457-466.
Dewhurst, S. A., & Conway, M.A. (1994). Pictures, images, and recollective experience. Journal of Experimental Psychology: Learning, Memory and Cognition, 20(5), 1088- 1098.
Doerksen, S., & Shimamura, A. P. (2001). Source memory enhancement for emotional words. Emotion, 1(1), 5–11.
Fiedler, K. (1991). On the task, the measures, and the mood in research on affect and social cognition. In J. P. Forgas (Ed.), Emotion and social judgments: An introductory review (pp. 83-104). London: Routledge.
Fossati, P., Hevenor, S. J., Graham, S. J., Grady, C., Keightley, M. L., Craik, F., & Mayberg, H. (2003). In search of the emotional self: An fMRI study using positive and negative emotional words. The American Journal of Psychiatry, 160, 1938–1945.
Hadley, C. B., & MacKay, D. G. (2006). Does emotion help or hinder immediate memory? Arousal versus priority-binding mechanisms. Journal of Experimental Psychology: Learning, Memory, and Cognition, 32(1), 79-88.

Effects of Emotional Contents on Explicit Memory Process
25Pertanika J. Soc. Sci. & Hum. Vol. 19 (S) 2011
Hamann, S. B. (2001). Cognitive and neural mechanisms of emotional memory. Trends in Cognitive Science, 5, 394-400.
Heuer, F., & Reisberg, D. (1990). Vivid memories of emotional events: The accuracy of remembered minutiae. Memory & Cognition, 18, 496-506.
Hofer, M. A. (1994). Early relationships as regulators of infant physiology and behavior. Acta Paediatric, 83(s397), 9-18.
Jay, T., Caldwell-Harris, C., & King, K. (2008). Recalling taboo and non-taboo words. American Journal of Psychology, 121(I), 83-103.
Kensinger, E. A. (2004). Remembering emotional experiences: The contribution of valence and arousal. Reviews in the Neurosciences, 15(4), 241–252.
Kensinger, E. A., & Corkin, S. (2003). Memory enhancement for emotional words: Are emotional words more vividly remembered than neutral words? Memory & Cognition, 31(8), 1169–1180.
Kensinger, E. A., Garoff-Eaton, R. J., & Schacter, D. L. (2007). How negative emotion enhances the visual specificity of a memory. Journal of Cognitive Neuroscience, 19(11), 1872–1887.
Kiefer, M., Schuch, S., Schenck, W., & Fiedler, K. (2007). Mood states modulate activity in semantic brain areas during emotional word encoding. Cerebral Cortex, 17(7), 1516-1530.
Kuchinke, L., Jacobs, A. M., Vo, M. L., Conrad, M., Grubich, C., & Herrmann, M. (2006). Modulation of prefrontal cortex activation by emotional words in recognition memory. NeuroReport, 17(10), 1037-1041.
LaBar, K. S., & Phelps, E. A. (1998). Arousal-mediated memory consolidation: Role of the medial temporal lobe in humans. Psychological Science, 9(6), 490–493.
Lang, P. J., Bradley, M. M., & Cuthbert, B. N. (2005). International affective picture system (IAPS): Instruction manual and affective ratings. Technical Report A-6, The Center for Research in Psychophysiology, University of Florida.
Lang, P. J., Greenwald, M. K., Bradley, M. M., & Hamm, A. O. (1993). Looking at pictures: Affective, facial, visceral and behavioral reactions. Psychophysiology, 30, 261-273.
Lazarus, R. S. (1991). Emotion and adaptation. New York: Oxford University Press.
LeDoux, J. E. (1998). The emotional brain: The mysterious underpinnings of emotional life. New York: Simon & Schuster.
Madigan, S. (1983). Picture memory. In J. C. Yuille (Ed.), Imagery, memory, and cognition: Essays in honor of Allan Paivio (pp. 65-89). Hillsdale: Lawrence Erlbaum Associates.
Mather, M., & Carstensen, L. L. (2005). Aging and motivated cognition: The positivity effect in attention and memory. Trends in Cognitive Science, 9(10), 496-502.
Nelson, D. L. (1979). Remembering pictures and words: Appearance, significance, and name. In L. S. Cermak, & F. I. M. Craik (Eds.), Levels of processing in human memory (pp. 45–76).Hillsdale: Lawrence Erlbaum Associates.
Ochsner, K. N. (2000). Are affective events richly recollected or simply familiar? The experience and process of recognizing feelings past. Journal of Experimental Psychology: General, 129(2), 242-261.
Paivio, A. (1975). Coding distinctions and repetition effects in memory. In G. H. Bower (Ed.), The psychology of learning and motivation (9, 179-214.). New York: Academic Press.
Paivio, A., & Csapo, K. (1973). Picture superiority in free recall: Imagery or dual coding? Cognitive Psychology, 5(2), 176–206.
Phelps, E. A., Labar, K. S., & Spencer, D. D. (1997). Memory for emotional words following unilateral temporal lobectomy. Brain and Cognition, 35(1), 85–109.
Riemann, B., & McNally, R. J. (1995). Cognitive processing of personally relevant information. Cognition and Emotion, 9(4), 325-340.

R. Khairudin, Mozhgan Valipour Givi, W. S. Wan Shahrazad, R. Nasir and F. W. Halim
26 Pertanika J. Soc. Sci. & Hum. Vol. 19 (S) 2011
Sato, W., Kochiyama, T., Yoshikawa, S., & Matsumura, M. (2001). Emotional expression boosts early visual processing of the face: ERP recording and its decomposition by independent component analysis. Neuroreport: For Rapid Communication of Neuroscience Research, 12(4), 709-714.
Schacter, D. L. (1987). Implicit memory: History and current status. Journal of Experimental Psychology: Learning. Memory and Cognition, 13(3), 501–518.
Weldon, M. S., & Roediger, H. L. III. (1987). Altering retrieval demands reverses the picture superiority effect. Memory and Cognition, 15(4), 269-280.
White, R. T. (2002). Memory for events after twenty years. Applied Cognitive Psychology, 16(5), 603-612.
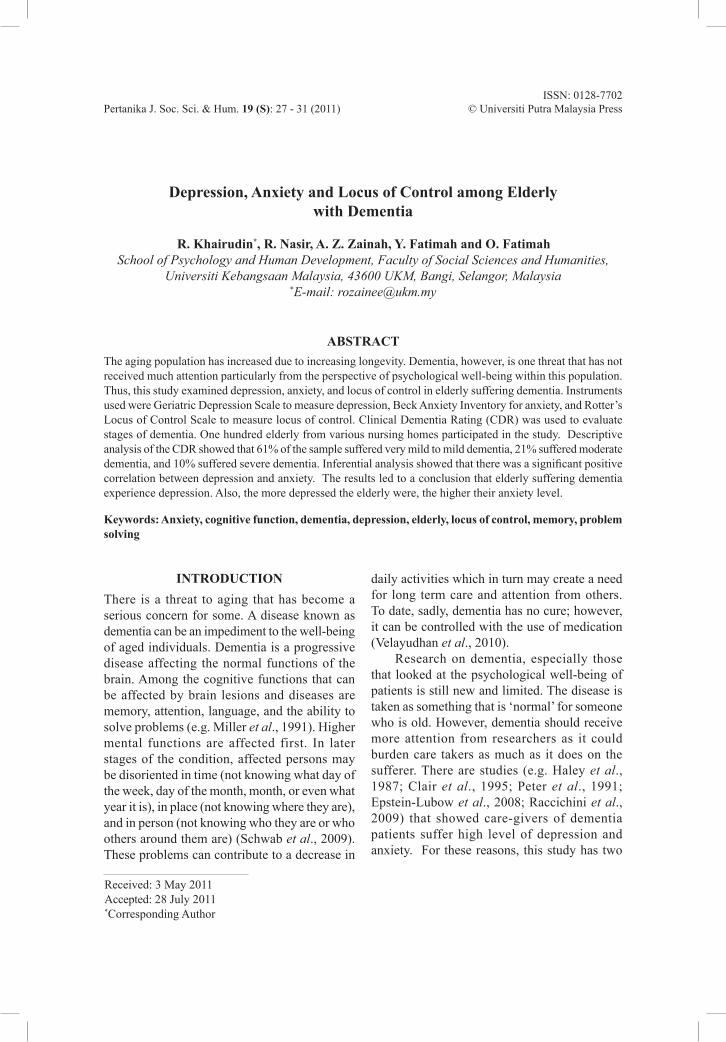
ISSN: 0128-7702Pertanika J. Soc. Sci. & Hum. 19 (S): 27 - 31 (2011) © Universiti Putra Malaysia Press
Received: 3 May 2011Accepted: 28 July 2011*Corresponding Author
INTRODUCTIONThere is a threat to aging that has become a serious concern for some. A disease known as dementia can be an impediment to the well-being of aged individuals. Dementia is a progressive disease affecting the normal functions of the brain. Among the cognitive functions that can be affected by brain lesions and diseases are memory, attention, language, and the ability to solve problems (e.g. Miller et al., 1991). Higher mental functions are affected first. In later stages of the condition, affected persons may be disoriented in time (not knowing what day of the week, day of the month, month, or even what year it is), in place (not knowing where they are), and in person (not knowing who they are or who others around them are) (Schwab et al., 2009). These problems can contribute to a decrease in
daily activities which in turn may create a need for long term care and attention from others. To date, sadly, dementia has no cure; however, it can be controlled with the use of medication (Velayudhan et al., 2010).
Research on dementia, especially those that looked at the psychological well-being of patients is still new and limited. The disease is taken as something that is ‘normal’ for someone who is old. However, dementia should receive more attention from researchers as it could burden care takers as much as it does on the sufferer. There are studies (e.g. Haley et al., 1987; Clair et al., 1995; Peter et al., 1991; Epstein-Lubow et al., 2008; Raccichini et al., 2009) that showed care-givers of dementia patients suffer high level of depression and anxiety. For these reasons, this study has two
Depression, Anxiety and Locus of Control among Elderly with Dementia
R. Khairudin*, R. Nasir, A. Z. Zainah, Y. Fatimah and O. Fatimah School of Psychology and Human Development, Faculty of Social Sciences and Humanities,
Universiti Kebangsaan Malaysia, 43600 UKM, Bangi, Selangor, Malaysia*E-mail: [email protected]
ABSTRACTThe aging population has increased due to increasing longevity. Dementia, however, is one threat that has not received much attention particularly from the perspective of psychological well-being within this population. Thus, this study examined depression, anxiety, and locus of control in elderly suffering dementia. Instruments used were Geriatric Depression Scale to measure depression, Beck Anxiety Inventory for anxiety, and Rotter’s Locus of Control Scale to measure locus of control. Clinical Dementia Rating (CDR) was used to evaluate stages of dementia. One hundred elderly from various nursing homes participated in the study. Descriptive analysis of the CDR showed that 61% of the sample suffered very mild to mild dementia, 21% suffered moderate dementia, and 10% suffered severe dementia. Inferential analysis showed that there was a significant positive correlation between depression and anxiety. The results led to a conclusion that elderly suffering dementia experience depression. Also, the more depressed the elderly were, the higher their anxiety level.
Keywords: Anxiety, cognitive function, dementia, depression, elderly, locus of control, memory, problem solving

R. Khairudin, R. Nasir, A. Z. Zainah, Y. Fatimah and O. Fatimah
28 Pertanika J. Soc. Sci. & Hum. Vol. 19 (S) 2011
objectives: (1) to measure the level of dementia in the elderly in relation to gender and race in the sample, (2) to identify the level of psychological well-being in elderly patients with dementia in terms of depression, anxiety, and locus of control as well as relationships between the variables.
METHODSThis study adopted the purposive method which involved the use of survey. This study involved elderly patients from various government and private nursing homes, as well as those who live at home in the Klang Valley. The respondents were selected from the elderly aged 65 to 90 years old. Selection was also based on the use of the Clinical Dementia Rating (CDR) Scale. There were 100 respondents in this study. The selection of participants of the study was done carefully to ensure ethical clearance was taken great care. The first step in obtaining participants was to get the approval from the Social Welfare Department of Malaysia. The approval was granted. Then, a letter of permission was written to various nursing homes. The care-givers provided signatures on behalf of the respondents for the purpose of consent for participation. The participants themselves could not provide their own signatures for consent because most of them could no longer write. With these steps, we ensured that ethical clearance was taken into account.
This study used four instruments which were the Clinical Dementia Rating (CDR) Scale, Geriatric Depression Scale (GDS, Short Form), Beck Anxiety Inventory (BAI) and Rotter’s Locus of Control Scale to measure stages of dementia and psychological well-being (depression, anxiety, and locus of control). The scales reliability and validity have been established in several studies. For this reason, the reliabilities and validities of all the four instruments used in the current study were based on other studies. Beck Anxiety Inventory (BAI) is a self-report measure with 21 items used to assess the severity of anxiety symptoms (Beck et al., 1988) with a high internal consistency (alpha = 0.92) (Beck et al., 1988). The total score of
all 21 items (range 0 -63) provides an estimate of the severity of anxiety symptoms (Beck and Steer, 1993). Geriatric Depression Scale (GDS) is a self-rating screening tool for depression developed to be used in geriatric populations. Cronbach’s alpha coefficient was 0.89 in internal consistency analysis (Sivrioglu et al., 2009). Locus of Control was assessed using Rotter I-E Locus of Control Scale. This scale has been widely used as a measure of internal-external control expectancies, leading to the confirmation of the locus of control construct as an important personality variable (Lefcourt, 1976). The I-E scale is designed to sample behavior from a wide range of life areas such as love and affection, dominance, social-political events, social recognition, academic recognition, and general life philosophy. The alpha for this scale is 0.74 (Lefcourt, 1976). The Clinical Dementia Rating scale (CDR) measures cognitive and functional impairment in dementia patients (Hughes et al., 1982). The scale’s reliability has been established with alpha=0.92.
RESULTS AND DISCUSSIONThe distribution of respondents according to gender is shown in Fig. 1. There were 51 males (51%) and 49 females (49%). As for the race factor, 67 respondents were Malay (67%), 11 were Chinese (11%), and 19 were Indian (19%). The distribution of respondents by race is shown in Fig. 2.
Fig. 1: The distribution of respondents by gender

Depression, Anxiety and Locus of Control among Elderly with Dementia
29Pertanika J. Soc. Sci. & Hum. Vol. 19 (S) 2011
Fig. 2: The distribution of respondents by race
The Clinical Dementia Rating (CDR) Scale was used to measure the levels of dementia among the respondents. The results showed that 35% of the elderly who suffered from dementia had very mild dementia; 34% suffered mild dementia; 21% experienced moderate dementia; and 10% experienced severe dementia. The results are shown in Fig. 3.
Fig. 3: The distribution of respondents by stages of dementia
The descriptive results for psychological well-being showed that 36% of the respondents did not suffer depression, but the other 64% did suffer depression. Of the latter, 38% suffered minimal anxiety, 36% had mild anxiety, 19% had moderate anxiety, and 7% had severe anxiety. Descriptive analysis on the locus of control
showed that 5% of the respondents had strong external locus of control, 9% had moderate external locus of control, 36% had both internal and external locus of control, 27% had moderate internal locus of control, and 23% had strong internal locus of control.
Analysis using Pearson Correlation Coefficient showed that there was a significant positive correlation between depression and anxiety among the elderly with dementia (r=0.41, p<0.001). Table 1 shows the relationship between depression and anxiety. The results indicated that the higher the level of depression in an elderly person with dementia, the higher the level of his or her anxiety. However, correlations between locus of control and depression, and between locus of control and anxiety did not reach significance (depression; anxiety: r=-0.14, p=0.152; r=-0.03, p=0.75, respectively).
TABLE 1 Relationship between depression and anxiety
Construct rDepression
.412**
Anxiety**p<0.001
The analysis of gender differences revealed that the only factor that reached significance was locus of control (t=2.2, p=0.03). However, the difference was only marginal. Differences in depression and anxiety based on gender were not significant (depression; anxiety: t=0.90, p=0.37; t=1.40, p=0.16, respectively). The data for gender differences is shown in Table 2.
TABLE 2 Difference in locus of control based on gender
Gender N Mean SD df t
Male 51 3.31 1.1998 -2.145*
Female 49 3.78 0.94*p<0.05

R. Khairudin, R. Nasir, A. Z. Zainah, Y. Fatimah and O. Fatimah
30 Pertanika J. Soc. Sci. & Hum. Vol. 19 (S) 2011
Analysis of differences in locus of control, depression, and anxiety based on race revealed that there was a significant difference in anxiety based on race (t=2.26, p<0.05). The results are shown in Table 3. However, there were no significant differences in depression and locus of control based on race (depression; locus of control: t=0.64, p=0.52; t=1.73, p=0.09, respectively).
TABLE 3 Difference in anxiety based on race
Race N Mean SD df t
Malay 67 1.81 0.8498 -2.264*
Non Malay
33 2.24 1.03
*p<0.05
The results showed that most of the elderly in the sample suffered very mild, mild, or moderate levels of dementia, as measured by the Clinical Dementia Rating (CDR) Scale. In terms of CDR domains, some of the respondents had problems in orientation, while others had difficulties in judgment and problem solving. But for most of the respondents the main symptom was the loss of memory. In the first stage of memory loss, the patient forgets a lot of things in his or her daily life. At a more severe stage, the patient often forgets the day, time, place, and even his or her own birth date (Cassimjee, 2008).
Disorientation and the inability to solve problems are caused by damage to the frontal lobe of the brain, which is responsible for the processes of planning, problem solving, and decision making (Goel et al., 1997). Clearly, if the elderly with dementia have difficulties in planning, then they will also have difficulties in solving any kind of problem, including problems dealing with his or her daily life.
This study showed that most of elderly with dementia in the sample suffered depression. One possible reason for this is the fact that the major problem of dementia is the loss of memory. Without the ability to remember, performing
normal daily activities would be impaired. For instance, the elderly with dementia may have to stop doing his or her favorite activity, like gardening, because of memory problems. The subsequent feelings of boredom, aggravation, and frustration can lead to depression (Edwards, 2006).
This study also showed that most of the elderly in the respondents possessed minimal to mild anxiety. Most of the respondents lived in nursing homes where the constant attention from professional care-givers may have helped in making them feel relaxed and not too anxious about negative things. Consequently, they may feel that they can control their own providence. This would explain the study’s result that most of the elderly with dementia had internal locus of control.
The results of this study indicated a significant positive correlation between depression and anxiety. The elderly with a high level of depression were more likely to endure a high level of anxiety. This is to some extent not surprising as both depression and anxiety are types of mood disorder. And finally, there was a significant difference between races in terms of anxiety. The non-Malays experienced higher anxiety (mean=2.3) than the Malays (mean=1.8). One possible reason for this was due to the coping strategies that the elderly possess for controlling anxiety: since most Malays were Muslims and they were usually more religious conscious as they get older, it was probable that the prayers they practised were a means of relaxation which in turn helped to lessen their anxiety. Moreover, Islam encourages patience and self-control and the Malay elderly might have practiced what they had learned as Muslims.
CONCLUSIONThis study found that there exists a high prevalence of detrimental well-being, particularly in terms of depression and anxiety, among the elderly with dementia within the sample. Because of problems related to their cognitive abilities, they were unable to carry out normal daily living. Depression and anxiety were the

Depression, Anxiety and Locus of Control among Elderly with Dementia
31Pertanika J. Soc. Sci. & Hum. Vol. 19 (S) 2011
major negative psychological ailments affecting their contentment. Note that the samples in the current study had mild to very mild levels of dementia. Even so, the presence of psychological problems was exhibited in these samples. This matter calls for serious attention. Cautions should be taken when arriving at any conclusions as the present study did not examine any cause and effect issues. This is one limitation of the study. Nevertheless, the insights provided here about the elderly with dementia are noteworthy as they can contribute to the efforts to improve the quality of their care.
REFERENCESBeck, A. T., Epstein, N., Brown, G., & Steer, R. A.
(1988). An inventory for measuring clinical anxiety: Psychometric properties. Journal of Consulting and Clinical Psychology, 56(6), 893-897.
Beck, A. T., & Steer, R. A. (1993). Manual for the Beck Anxiety Inventory. San Antonio, TX: Psychological Corporation.
Cassimjee, N. (2008). Psychosis in Alzheimer’s disease: Prevalence, clinical characteristics, symptom co-morbidity, and etiology. South African Journal of Psychology, 38(1), 95–115.
Clair, J. M., Fitzpatrick, K. M., & La Gory, M. E. (1995). The impact of psychosocial resources on caregiver burden and depression: Sociological var ia t ions on a gerontological theme. Sociological Perspectives, 38(2), 195-215.
Department of Statistics Malaysia. (n.d). Retrieved from http://www.statistics.gov.my/portal/index.
Edwards, S. (2006). Physical exercise and psychological well-being. South African Journal of Psychology, 36(2), 357-373.
Epstein-Lubow, G., Davis, J. D., Miller, I. W., & Tremont, G. (2008). Persisting burden predicts depressive symptoms in Dementia caregivers. Journal of Geriatric Psychiatry and Neurology, 21(3), 198-203.
Goel, V., Grafman, J., Tajik, J., Gana, S., & Danto, D. (1997). A study of the performance of patients with frontal lobe lesions in a financial planning task. Brain, 120(10), 1805- 1822.
Haley, W. E., Levine, E. G., Brown, S. L., & Bartolucci, A. A. (1987). Stress, appraisal, coping, and social support as predictors of adaptational outcome among Dementia caregivers. Psychology and Aging, 2(4), 323-330.
Hughes, C. P., Berg, L., Danziger, W. L., Coben, L. A., & Martin, R. L. (1982). A new clinical scale for the staging of dementia. British Journal of Psychiatry, 140(1), 566-572.
Kleiber, D. A., & Hemmer, J. D. (1981). Sex differences in the relationship of locus of control and recreational sport participation. Sex Roles, 7(8), 801-810.
Lefcourt, H. M. (1976). Locus of control: Current trends in theory and research. New York: Wiley.
Miller, B. L., Lesser, I. M., Boone, K. B., Hill, E., Mehringer, C. M., & Wong, K. (1991). Brain lesions and cognitive function in late-life psychosis. The British Journal of Psychiatry, 158(1), 76-82.
Peter, P. V., Heather, M. Y., & Russo, J. (1991). Burden: A review of measures used among caregivers of individuals with dementia. The Gerontologist, 31(1), 67-75.
Raccichini, S. A., Castellani, S., Civerchia, P., Fioravanti, P., & Scarpino, O. (2009). The caregiver’s burden of Alzheimer patients: Differences between live-in and non-live-in. American Journal of Alzheimer’s Disease and Other Dementias, 24(5), 377-383.
Schwab, W., Messinger-Rapport, B., & Franco, K. (2009). Psychiatric symptoms of dementia: Treatable, but no silver bullet. Cleveland Clinic Journal of Medicine, 76(3), 167-174.
Sivrioglu, E. Y., Sivrioglu, K., Ertan, T., Ertan, F. S., Cankurtaran, E., Aki, O., Uluduz, D., Ince, B., & Kirli, S. (2009). Reliability and validity of the Geriatric Depression Scale in detection of post-stroke minor depression. Journal of Clinical and Experimental Neuropsychology, 31(8), 999-1006.
Velayudhan, L., Poppe, M., Archer, N., Proitsi, P., Brown, R. G., & Lovestone, S. (2010). Risk of developing dementia in people with diabetes and mild cognitive impairment. The British Journal of Psychiatry, 196(1), 36-40.


ISSN: 0128-7702Pertanika J. Soc. Sci. & Hum. 19 (S): 33 - 40 (2011) © Universiti Putra Malaysia Press
Received: 3 May 2011Accepted: 28 July 2011*Corresponding Author
INTRODUCTIONOur jobs take more than eight hours of our time daily. Jobs provide a sense of accomplishment and identity. Most people identify themselves with their jobs. As such, to be happy and satisfied with one’s job is very important. Job satisfaction has an impact on task performance. Job satisfaction and task performance are also important to industries and organizations because their performance and productivity depend on the employees’ satisfaction and performance. Hence, industrial and organizational psychologists have started studying job satisfaction decades ago. One of their major tasks was to assess employees’ attitudes about their jobs particularly
their job satisfaction. Psychologists concluded that some of the organizational behaviors are a consequence of either job satisfaction or dissatisfaction.
Job satisfaction is the attitude an employee has toward her or his job (Aamodt, 2007). Smith et al. (1969) view job satisfaction as positive attitude of an individual toward his job. Mitchell and Larson (1987) describe job satisfaction as reflection of view points and positive feelings of staff of their jobs. Spector (2000) defines job satisfaction as people’s feelings toward their jobs. Hulin and Judge (2003) asserted that an employee’s affective reaction to a job is based on a comparison of the actual outcomes derived from the job with those outcomes that are
Demographic Variables as Moderators in the Relationship between Job Satisfaction and Task Performance
R. Nasir*, O. Fatimah, M. S. Mohammadi, W. S. Wan Shahrazad, R. Khairudin and F. W. Halim
School of Psychology and Human Development, Faculty of Social Sciences and Humanities,Universiti Kebangsaan Malaysia, 43600 UKM, Bangi, Selangor, Malaysia
*E-mail: [email protected]
ABSTRACTJobs provide a sense of accomplishment and identity. Job satisfaction has an impact on task performance and both are important to industries and organizations because their performance and productivity depend on the employees’ satisfaction and performance. The objective of this study was to investigate the relationship between job satisfaction and task performance among 450 employees of Behzisty organization in Central Provinces of Iran. The study also looked at the influence of gender, age, education, and tenure on the relationship between job satisfaction and task performance. Instruments used to collect data were Job Description Index (JDI), Task Performance (supervisors’ ratings) and the Demographic questionnaires. Descriptive and inferential statistics were used to analyze the data. The results found that there was a significant relationship between job satisfaction and task performance. It was also shown that gender and education moderated the relationship between job satisfaction and task performance while age and tenure did not moderate the relationship between job satisfaction and task performance. The results have significant implications on the policies of human resource as well as organizations in Iran.
Keywords: Job satisfaction, task performance, industrial psychology, organizational psychology

R. Nasir, O. Fatimah, M. S. Mohammadi, W. S. Wan Shahrazad, R. Khairudin and F. Halim
34 Pertanika J. Soc. Sci. & Hum. Vol. 19 (S) 2011
deserved or expected. Dawis (2004) added that feelings of job satisfaction can change with time and circumstances.
Task performance on the other hand relates to specific job requirements and includes all activities that are directly related to the organization’s technical core, for example, closing a sale or contributing to sales unit revenue (Borman and Motowidlo, 1997; Motowidlo et al., 1997). Task performance can be viewed as an activity in which an individual is able to accomplish successfully the task assigned to him or her, subject to the normal constraints of the reasonable utilization of available resources (Jamal, 2007).
Studies have shown that job satisfaction is positively related to job performance (Rehman and Waheed, 2011). A review on the relationship between job satisfaction-job performances by Judge et al. (2001) concluded that job satisfaction was an effective predictor of job performance. Meta-analyses by Cooper-Hakim and Viswesvaran (2005), Harrison et al. (2006), Meyer et al. (2002) and many others have shown that positive job attitudes, such as satisfaction, are accompanied by better work outcomes. Riketta’s (2008) meta-analytic regression analyses on 16 studies had also demonstrated relationship between job performance and job attitudes (i.e. job satisfaction). Humphrey et al.’s (2007) and Wright et al.’s (2007) studies indicated modest effects of job satisfaction on performance. Jacobs et al. (2007) also found that job satisfaction predicted performance. Pei-Ling Shih’s (2007) study showed positive effect of job satisfaction on job performance.
Van Scotter (2000) studied effects of task performance and contextual performance on turnover, job satisfaction, and effective organizational commitment on two samples of Air Force mechanics. It was found that the relationships between task performance, contextual performance, and job satisfaction and organizational commitment were very consistent across the two samples. Employees whose contextual performance was higher also reported being more satisfied with their jobs and more committed to the organization.
Schleicher et al . (2004) studied the moderating effect of affective and cognitive components (ACC) on the relationship between job satisfaction and performance. Employees with high ACC showed significantly stronger job satisfaction-performance relations than those employees lower in ACC. Snead (1991) conducted a research on the moderating effect of job and organization tenure on the job satisfaction-job performance relationship. The moderating effect was evident when performance was viewed as the criterion. In addition, job tenure moderated the performance to satisfaction with growth relationship, performance to satisfaction with supervisor relationship, and performance to overall job satisfaction relationship.
There are many studies about job satisfaction but unfortunately a small number of those studies look at job satisfaction among Asians (Hagerty, 2000) and most of the studies were done in North America (Judge and Watanabe, 1993). The lack of research and valid data in non Western countries makes it difficult for organizations in these countries to base their decisions on. Hence, this research aimed to ascertain the relationship between job satisfaction and task performance. This study also sought to determine the moderating effects of gender, age, educational level, and tenure on the relationship between job satisfaction and task performance.
METHODSThis research is a correlational study. It was conducted among employees of Behzisty Organization, which is a Welfare Organization in Iran. This organization offers social welfare services to the disabled and needy people, who are not covered by insurance system or benefit protective services. This is a government financed organization. Other financial public resources are special funds, public donations, and charities.
A total of 530 employees of Behzisty organization were randomly selected for this study out of which 450 agreed to be participants of the study. There were 230 women and 220

Demographic Variables as Moderators in the Relationship between Job Satisfaction and Task Performance
35Pertanika J. Soc. Sci. & Hum. Vol. 19 (S) 2011
men whose age ranged from 18 to 57 years old. Majority of the participants (91.1%) had at least a diploma level of education and 66.5% fell within 34-49 age group. More than 50% had more than 13 years of work experience.
Three sets of questionnaires were used to collect data: Job Description Index (JDI), Task Performance (supervisors’ ratings) and the Demographic questionnaires. Both the JDI and Task performance were translated into Persian language using back translation technique by Brislin et al. (1973).
1. Job Description Index (JDI): The JDI was used to measure job satisfaction. This scale assesses five facets and many users of the scale have summed the scale into an overall job satisfaction score (Spector, 2006). This instrument contains 72 items categorized into five dimensions. Three dimensions, work, supervision, and co-worker contained 18 items and two dimensions opportunities for promotion and pay contained 9 items. The questionnaire uses a three-point Likert scale with response option of “yes”, “no” or “undecided”. High scores indicate high satisfaction and low scores indicate low satisfaction. For each of the dimension a score will be obtained and sum total of the obtained score will be considered as job satisfaction. In this study Cronbach’s alpha for reliability coefficient were used. The reliability coefficient of JDI is acceptable. Also, in this study the validity’s coefficients have been computed by correlating the results of JDI with the results of another questionnaire of job satisfaction (15-degree scale from very agree to very disagree). The result showed that there was acceptable coefficient at level of significance of p< 0.001
2. Task Performance: The supervisors’ ratings of performance questionnaire suggested by Kobe-steel company of Japan in 1993 as a tool for evaluation of task performance of staff by directors and supervisors was employed. This questionnaire was completed by supervisors rating the respondents. The
questionnaire elicits answers from the supervisor to appraise the merit of personnel in the last year based on a merit item that contains one question. Each of these items was measured using a five-point scale ranging from (1) very weak to (5) very good. The correlation between questionnaire of task performance (supervisors’ ratings) and scale of merit is acceptable at level of significance of p<0.001 and the correlation between questionnaire of task performance (supervisors’ ratings) and questionnaire of task performance (self-assessment) is acceptable at level of significance of p<0.05. In this study reliability’s coefficient of questionnaire of task performance (supervisors’ ratings) were computed by Cronbach’s alpha (0.93) and split half (0.95).
3. Demographic assessment: The questions developed by the researcher were used to assess demographic variables which were gender, age, education level, and tenure.
The researcher arranged a meeting to coordinate with Behzisty Organization to carry out the research, followed by meetings with 450 employees who were participants in this study. The meeting also involved all the supervisors who were supposed to rate the subjects task performance. The task performance questionnaires were completed by the supervisors while JDI and demographic questionnaires were completed by the employee’s sample in order to determine the scale of their job satisfaction.
RESULTS AND DISCUSSIONResult of multiple regression analysis as seen in Table 1 showed that there was significant relationship between job satisfaction and task performance (R Square change=0.85, p<0.01). The results showed that 85% of the dependent variable (task performance) variance is due to the independent variable (job satisfaction). As shown in Table 1 the computed power of prediction is (Beta=0.92, p<0.01).

R. Nasir, O. Fatimah, M. S. Mohammadi, W. S. Wan Shahrazad, R. Khairudin and F. Halim
36 Pertanika J. Soc. Sci. & Hum. Vol. 19 (S) 2011
In the second analysis also shown in Table 1, age moderated the relationship between job satisfaction and task performance (R Square change=0.85, p<0.01). As shown in Table 2, the prediction of task performance through age was (Beta=-0.01, p>0.05) and job satisfaction was (Beta= 0.92, p<0.01). In this stage age did not moderate the relationship between job satisfaction and task performance.
In the third analysis, gender along with age moderated the relationship between job satisfaction and task performance (R Square change=0.88, p<0.01). As shown in Table 2, the prediction of task performance through gender was (Beta= -0.16, p<0.01), age was (Beta=-0.03, p>0.05) and job satisfaction was (Beta= 0.91, p<0.01). In this stage gender moderated the relationship between job satisfaction and task performance. In the fourth analysis, education along with age and gender moderated the relationship between job satisfaction and task performance (R Square change=0.88, p<0.01)
(Table 1). As shown in Table 2, the prediction of task performance through education was (Beta=0.10, p<0.01), gender was (Beta=-0.17, p<0.01), age was (Beta=-0.05, p>0.01) and job satisfaction was (Beta= 0.83, p<0.01). In this stage education moderated the relationship between job satisfaction and task performance. In the fifth analysis, tenure along with age, gender and education moderated the relationship between job satisfaction and task performance (R Square change=0.88, p<0.01) (Table 1). As shown in Table 2, the prediction of task performance through tenure was (Beta=0.10, p>0.05), education was (Beta=0.13, p<0.01), gender was (Beta=-0.18, p<0.01), age was (Beta=-0.06, p>0.05) and job satisfaction was (Beta= 0.82, p<0.01). In this stage tenure did not moderate the relationship between job satisfaction and task performance. Gender and education moderated the relationship between job satisfaction and task performance but age and tenure did not moderate this relationship.
TABLE 1 Model summary of regression analysis on the moderating role of gender, age,
educational level and tenure
Model R R squareAdjusted R square
Std. error of the estimate
Change statisticsR square change F change df1 df2
Sig. F change
1 .923a .852 .851 3.43394 .852 2568.852 1 448 .0002 .923b .852 .851 3.43627 .852 1282.878 2 447 .0003 .937c .878 .877 3.12220 .878 1067.787 3 446 .0004 .940d .883 .882 3.05189 .883 843.612 4 445 .0005 .941e .885 .884 3.03584 .885 683.187 5 444 .000
1. Predictors: job satisfaction2. Predictors: age, job satisfaction 3. Predictors: age, gender, job satisfaction4. Predictors: age, gender, education, job satisfaction5. Predictors: age, gender, education, tenure, job satisfaction

Demographic Variables as Moderators in the Relationship between Job Satisfaction and Task Performance
37Pertanika J. Soc. Sci. & Hum. Vol. 19 (S) 2011
TABLE 2 Multiple regression analysis results of standardized beta coefficients of the
moderating role of gender, age, educational level and tenure
VariablesStandardized coefficients beta
t P level
1 Job satisfaction .923 50.684 .000
2 Job satisfaction .917 45.332 .000
Age .013 .626 .5323 Job
satisfaction .911 49.508 .000
Age .029 1.595 .111Gender -.162 -9.770 .000
4 Job satisfaction .833 33.957 .000
Age .053 2.842 .005Gender -.172 -10.503 .000education .104 4.668 .000
5 Job satisfaction .825 33.474 .000
Age -.063 -1.206 .228Gender -.176 -10.737 .000education .127 5.255 .000Tenure .105 2.391 .067
a. Dependent variable: task performance
Results of this study showed that there was a significant relationship between job satisfaction and task performance. On the basis of social exchange theory, researchers often expect employees who are satisfied with their jobs to perform better in these jobs. One reason for the relationship between job satisfaction and task performance is because the employees who are satisfied are more likely to attend work, stay with an organization, arrive at work on time and perform well. Also people who like their jobs tend to work harder and perform better (Spector, 2006). Thus when they perform better they are likely to benefit from the performance such as bonuses, promotion, and recognition which could enhance satisfaction. On the other
hand, job satisfaction is positively correlated with motivation, job involvement, organizational commitment, life satisfaction and physical and mental health, working environment, economic development, and is negatively related to absenteeism, turnover, and perceived stress.
This finding is supported by previous research findings done by Judge et al. (2001) and Rehman and Waheed (2011) that found significant relationship between job satisfaction and performance. Numerous meta-analyses (e.g. Meyer et al., 2002; Cooper-Hakim and Viswesvaran, 2005; Harrison et al., 2006; Riketta, 2002; 2008) have demonstrated that positive job attitudes, such as commitment and satisfaction, are accompanied by better work outcomes.
This finding is in line with findings of a number other studies, the results of which are as follows: the correlation between satisfaction and performance was r = .36, indicating a modest effect (Wright et al., 2007). Across two separate studies, using several different measures of job satisfaction, Schleicher et al. (2004) found that worker satisfaction modestly predicted job performance. In addition, a few social–cognitive theories predict that attitudes toward the job (e.g. job satisfaction) would influence behaviors on the job (e.g. reflected in job performance) and this prediction has been supported by Judge et al. (2001), and is also supported by a meta-analysis (Riketta, 2002; 2008). Organ et al. (2006) concluded that it is reasonable to think that the more positive a person’s job attitude is the more positive the person’s behavior will be with respect to the job.
Result of multiple regression analysis showed that the variables of gender and education moderated the relationship between job satisfaction and task performance but age and tenure were not significant moderators in this relationship. This finding is consistent with the findings of Williams (2000) and Koustelios (2001) who found that women were more satisfied with their working conditions. This according to Spector (2006) is because women may be happier with lower pay and responsibility than men, thus perhaps because of their lower

R. Nasir, O. Fatimah, M. S. Mohammadi, W. S. Wan Shahrazad, R. Khairudin and F. Halim
38 Pertanika J. Soc. Sci. & Hum. Vol. 19 (S) 2011
expectations. Hartman et al. (1988) indicated that gender is a strong predictor of task performance. He suggested that gender could be considered as a determinant of the task performance. As for education, the research found that it moderated the relationship between job satisfaction and task performance. Okpara (2004) and Gürbüz (2007) found that participants with higher education seemed to be more concerned with performance and productivity. This may be so because usually those with higher education hold higher posts and thus have more responsibilities then those with lower education. Thus this describes why gender and education could be considered as a determinant of job satisfaction and task performance.
On the other hand, age and tenure were not significant moderators in the relationship between job satisfaction and task performance. This finding is inconsistent with Clark et al. (1996), Siu and Cooper (1999), Karatepe et al. (2006) and Robbins et al. (2004). This is because majority of the respondents were in the 34-49 age group. Previous studies such as Barefoot et al. (1993) observed significant difference because of the difference in age gap in which individuals over the age 60 exhibit much less hostility and anger than younger adults and thus better able to regulate their moods and display higher levels of emotional intelligence (Siu and Cooper, 1999). A possible reason why tenure did not moderate the relationship between job satisfaction and task performance is because majority of the respondents have more than 13 years of work experience. Other studies that found significant relationship between job satisfaction and task performance was because performance was observed to improve with experience (Hall and Mansfield, 1975; Schmidt et al., 1986). Karatepe et al. (2006) posited that job satisfaction was positively correlated with organizational tenure in which employees who have been working for more than twenty years would be more satisfied with their jobs than those who have been working for a shorter period of time.
CONCLUSIONBased on results of the present study it can be concluded the relationship between job satisfaction and job performance was moderated by gender and education. The findings have significant implications on the policies of human resource in public organizations in Iran. It would be very meaningful to study the difference in the relationship of the two variables, job satisfaction and performance between Iran, which is an Islamic country and a western or non Islamic country so that one can see how cultural and religious factors influence the relationship.
REFERENCESAamodt, M. G. (2007). Industrial/Organizational
psychology: An applied approach (international student 5th ed.). California: Thomson Wadsworth.
Barefoot, J. C., Beckham, J. C., Haney, T. L., Siegler, I. C., & Lipkus, I. M. (1993). Age differences in hostility among middle-aged and older adults. Psychology and Aging, 8(1), 3-9.
Borman, W. C., & Motowidlo, S. J. (1997). Task performance and contextual performance: The meaning of personnel selection research. Human Performance, 10(2), 99-109.
Brislin, R. W., Lonner, W. J., & Thorndike, R. W. (1973). Cross-cultural research method. New York: John Wiley & Sons.
Clark, A. E., Oswald, A., & Warr, P. (1996). Is job satisfaction u-shaped in age? Journal of Occupational and Organizational Psychology, 69(1), 57-81.
Cooper-Hakim, A., & Viswesvaran, C. (2005). The construct of work commitment: Testing an integrative framework. Psychological Bulletin, 131(2), 241–259.
Dawis, R.V. (2004). Job satisfaction. In J. C. Thomas (Ed.), Comprehensive handbook of psychological assessment (pp. 470-481). Hobokyn, NJ: Willey.
Gürbüz, A. (2007). An assessment on the effect of education level on the job satisfaction from the tourism sector point of view. Zonguldak Karaelmas University, Safranbolu Vocational School of Higher Education. Retrieved from http://search ebscohost.com.www.ezplb.ukm.my/login.aspx? direct=true&db=psyh &A
Demographic Variables as Moderators in the Relationship between Job Satisfaction and Task Performance
39Pertanika J. Soc. Sci. & Hum. Vol. 19 (S) 2011
Hagerty, M. R. (2000). Social comparison of income in one’s community: Evidence from national surveys of income and happiness. Journal of Personality and Social Psychology, 78(4), 764-771.
Hall, D. T., & Mansfield, R. (1975). Relationships of age and seniority with career variables of engineers and scientists. Journal of Applied Psychology, 60, 201-210.
Harrison, D. A., Newman, D. A., & Roth, P. L. (2006). How important are job attitudes? Meta-analytic comparisons of integrative behavioral outcomes and time sequences. Academy of Management Journal, 49(2), 305-325.
Hartman, S. J., Griffeth, R.W., Miller, L., & Kinicki, A. J. (1988). The impact of occupation, performance, and sex on sex role stereotyping. Journal of Social Psychology, 128(4), 451-463.
Hulin, C. L., & Judge, T. A. (2003). Job attitudes. In W. C. Borman, D. R. Ilgen & R. J. Klimoski (Eds.), Handbook of psychology (Vol.12): Industrial and organizational psychology (pp. 255-276). Hoboken, NJ: Willey.
Humphrey, J., Nahrgang, J., & Morgenson, F. (2007). Integrating motivational, social, and contextual work design features: A meta-analytic summary and theoretical extension of the work design literature. Journal of Applied Psychology, 92(1), 1332-1356.
Jacobs, P., Tytherleigh, M., Webb, C., & Cooper, C. (2007). Predictors of work performance among higher education employees: An examination using the asset model of stress. International Journal of Stress Management, 14(2), 199-210.
Jamal, M. (2007). Job stress and job performance controversy revisited: An empirical examination in two countries. International Journal of Stress Management, 14(2), 175-187.
Judge, T. A., Thoreson, C. J., Bono, J. E., & Patton, G. K. (2001). The job satisfaction–job performance relationship: A qualitative and quantitative review. Psychological Bulletin, 127(3), 376-407.
Judge, T. A., & Watanabe, S. (1993). Individual differences in the nature of the relationship between job and life satisfaction. Journal of Occupational and Organizational Psychology, 67(2), 101-107.
Karatepe, O. M., Uludag, O., Menevis, I . , Hadzimehmedagic, L., & Baddar, L. (2006). The effects of selected individual characteristics on frontline employee performance and job satisfaction. Tourism Management, 27(4), 547-560.
Koustelios, A. D. (2001). Personal characteristics and satisfaction of Greek teachers. The International Journal of Educational Management, 15(7), 354-358.
Meyer, J. P., Stanley, D. J., Herscovitch, L., & Topolnytsky, L. (2002). Affective, continuance, and normative commitment to the organization: A meta-analysis of antecedents, correlates, and consequences. Journal of Vocational Behavior, 61(1), 20–52.
Mitchell, A., & Larson, L. (1987). Effect of job experience on supervisor attribution for a subordinates poor performance. Journal of Applied Psychology, 67(2), 181-188.
Motowidlo, S. J., Borman, W. C., & Schmidt, M. J. (1997). A theory of individual differences in task and contextual performance. Human Performance, 10(2), 71-83.
Okpara, J. O. (2004). Personal characteristics as predictors of job satisfaction: An exploratory study of IT managers in a developing economy. Information Technology & People, 17(3), 327-338.
Organ, D. W., Podsakoff, P. M., & MacKenzie, S. B. (2006). Organizational citizenship behavior. California: Sage Publications.
Pei-Ling, S. (2007). The research of relationship among job satisfaction, task performance, organizational citizenship behavior, and the organizational performance. Case study of Water Resources Agency, Ministry of Economic. Master’s thesis. Doğuş Üniversitesi Dergisi.
Rehman, M. S., & Waheed, A. (2011). An empirical study of impact of job satisfaction on job performance in the public sector organization. Interdisciplinary Journal of Contemporary Research Business, 2(9), 167-181.
Riketta, M. (2002). Attitudinal organizational commitment and job performance: A meta-analysis. Journal of Organizational Behavior, 23(1), 257–266.
R. Nasir, O. Fatimah, M. S. Mohammadi, W. S. Wan Shahrazad, R. Khairudin and F. Halim
40 Pertanika J. Soc. Sci. & Hum. Vol. 19 (S) 2011
Riketta, M. (2008). The causal relation between job attitudes and performance: A meta-analysis of panel studies. Journal of Applied Psychology, 93(2), 472-481.
Robbins, S. P., Bruce, M. T., & Marsh. (2004). Organizational behaviour (4th ed.). Australia: Pearson Prentice Hall.
Schleicher, D., Watt, J., & Greguras, G. (2004). Reexamining the job satisfaction-performance relationship: The complexity of attitudes. Journal of Applied Psychology, 89(1), 167-177.
Schmidt, F. L., Hunter, J. E., & Outerbridge, A. N. (1986). Impact of job experience and ability on job knowledge, work sample performance, and supervisory ratings of job performance. Journal of Applied Psychology, 71, 432–439.
Siu, O. L., & Cooper, C. L. (1999). Managerial stress in Hong Kong and Taiwan: A comparative study. Journal of Managerial Psychology, 14(1), 6-25.
Snead, J. D. (1991). The moderating effect of job and organization tenure on the job satisfaction-job performance relationship. M.A. thesis, Central Michigan University.
Spector, P. E. (2006). Industrial and organizational psychology (4th ed.). USA: John Willey & Sons.
Spector, P. E. (2000). Industrial and organizational psychology. USA: John Willey & Sons.
Smith, F. C., Kendal, L. M., & Hulin, C. L. (1969). The measurement of satisfaction in work and retirement. Chicago: Rand McNally.
Van Scotter, J. R. (2000). Relationships of task performance and contextual performance with turnover, job satisfaction, and affective commitment. Human Resource Management Review, 10(1), 79-95.
Williams, M. (2000). When is personality a predictor of job performance? The moderating role of autonomy. Ph.D thesis, Florida International University.
Wright, T. A., Cropanzano, R., & Bonett, D. G. (2007). The moderating role of employee positive well being on the relation between job satisfaction and job performance. Journal of Occupational Health Psychology, 12(2), 93-104.

ISSN: 0128-7702Pertanika J. Soc. Sci. & Hum. 19 (S): 41 - 48 (2011) © Universiti Putra Malaysia Press
Received: 3 May 2011Accepted: 28 July 2011*Corresponding Author
INTRODUCTIONIn aging population, the aspects of life that are important to older people have been identified by empirical research as: psychological wellbeing, good physical functioning, relationships with others, health, and social activity (Bigelow et al., 1982; Day, 1991; Bowling, 1995a, b, 1996b; Farquhar, 1995; Browne et al. 1994). In contrast from younger people, older people have been reported to be less likely to emphasize on financial status, standard of living and housing (Bowling, 1995b). The group WHOQOL (1995) defined the quality of life as an individual’s perception of his/ her position in life in the context of the culture and value system in which he/ she lives in relation to his/ her goals, expectations, standards, and concerns.
United Nations (UN) defines “aged nation” for the elderly population in the age of 60 years and over in developing countries and above 65 years in developed countries. In the world population scenario today, one in every10 persons is an elderly (age 60 and above) and this trend would increase to 1 in every 5 persons by the year 2050 and the number of people older than 65 will double to 14 percent from 7 percent of the world’s population in the next 30 years, rising to 1.4 billion by 2040 from about 506 million in middle of 2008 (National Institute on Aging, 2008). In Malaysia, older people are blessed with good health, longer life expectancy, low mortality, as well as declining fertility. These factors have brought changes in the demographic profile of the country’s population (Ong Fon Sim,
Exploring the Meaning of Ageing and Quality of Life for the Sub-Urban Older People
K. Alavi1*, Rahim Md. Sail2 , M. S. Mohamad1, M. Omar1, N. Subhi1, Sheau Tsuey Chong1, N. Sarnon1, I. Fauziah1 and Z. M. Lukman1
1School of Psychology and Human Development, Faculty of Social Sciences and Humanities,Universiti Kebangsaan Malaysia, 43600 UKM, Bangi, Selangor, Malaysia
2Department of Professional Development and Continuing Education, Faculty of Educational Studies, Universiti Putra Malaysia, 43400 UPM, Serdang, Selangor, Malaysia
*E-mail: [email protected]
ABSTRACTA quality of life which includes psychological well-being, good physical functioning, relationships with others, health, and social activity is very important to the aged. The main purpose of this descriptive and exploratory case study was to analyze the meaning of aging and perceived quality of life among the elderly in sub-urban communities. Participants were 15 Malays, Chinese and Indians, aged 60 and above. In-depth interviews with the participants were conducted to gather the data. The findings indicated that aging brought a lot of shortfall, especially in terms of health and physical strength to the elderly. They were pleased to see the development of families, children, and grandchildren as a quality of life. Respondent are contented living with their children and grandchildren. The implication of this study is that there is a need for more gerontological social workers with adequate training and skills to provide services for the elderly.
Keywords: Older people, quality of life, meaning of ageing, community social work

K. Alavi et al.
42 Pertanika J. Soc. Sci. & Hum. Vol. 19 (S) 2011
2002). These improvements have resulted in the increase in the number of older people. In year 2000, the population distribution in Malaysia, consisted of 6.1% or 1.418 million who were 60 years old and above. The demography of the aged would change drastically where it is estimated that 9.5% of the population would be above 60 years old (Department of Statistics, 2001).
This demographic trend implies that in the future the needs and problems of older people will be more complex and the roles of family members in caring for the elderly would have significant impacts and future quality of life for both the caregivers and the elderly rely on their family members. An increasing number of the aging population proved to be very challenging to the social, health, politics and economy of the families, society and the nation. A new trend had been created where the elderly take care of themselves or take care of each other. There are also greater demands on a shrinking number of young caregivers. This situation is very challenging to the social workers in terms of their roles pertaining to the aging population. The gerontological social workers need to understand the meaning of old age and their perceptions on the quality of life for the aged should be based on the older people’s perspectives. It is high time for Malaysian social workers examine the perceptions of the elderly about their lives in a multi-racial society. It is important to understand the feelings and self-esteem of the elderly in relation to their aging bodies and how they are influenced by the social and cultural values. This will give the caregivers and social workers a better understanding of the elderly and assist them in developing good practice when working with this group of people.
In general, the quality of life of the elderly can be defined as the elderly who excel in life which lead to their well-being which includes personal development, healthy lifestyles, access to knowledge, and information. Gabriel and Bowling (2004) defined the quality of life of the older people as the positive relationships with
their families, friends, neighbors and having a ‘good’ home and secure neighborhood. The “good” home means have a positive outlook on life; being involved in activities and hobbies, being in good health; play meaningful roles; earn an adequate income and being independent.
Having said that, to understand the ‘real’ meaning of old age is to empathies with the elderly. Understanding and empathy will enable the healthcare providers such as nurses and social workers to plan a reality-based strategy. This strategy aims to maintain the autonomy and independence of the elderly develop a better understanding on the changes in behaviors and needs resulting from the aging process, thus allowing for the health and social well being of the elderly (Freitas et al., 2010). There are two meanings as the researches have described either a cognitive dimension of meaning (e.g. beliefs one holds about one’s experience) or an emotional dimension (e.g., satisfaction one finds with the role and with its benefits and rewards) (Noonan et al., 1996). These two dimensions may also be seen as two different dynamic operations – searching for the meaning and finding the meaning. Reker et al. (1987) distinguished between the desire to find the meaning of life and the perception of meaning as well as the purpose of life. In contrast, Battista and Almond (1973) discerned the following four structural characteristics of the meaning of life: (a) a positive commitment to some concept of the meaning of life, (b) a framework of purpose in the life or life view, (c) a sense of fulfilment, and (d) a feeling of significance. In exploring the meaning and quality of life experiences by older people, two specific research questions are developed: (1) What is the meaning of old age and how do the Malay, Chinese, and Indian elders view their futures? (2) How do the elders in rural and urban areas perceive quality of life in later life? The aim of this paper is to identify the meaning of ageing and the perceived quality of life in later life among older people in rural and urban settings by comparing the Malays, Chinese, and Indians.

Exploring the Meaning of Ageing and Quality of Life for the Sub-Urban Older People
43Pertanika J. Soc. Sci. & Hum. Vol. 19 (S) 2011
METHODSThe combination of a case study and grounded theory was selected to conduct this research. This approach was selected to answer the research questions based on the background of the research subjects. The participants were chosen based on the criteria to acquire an in-depth information regarding the preferences and expectations of the elderly, their living arrangements and family relationships. The participants were elderly Malays, Chinese and Indians who are living in the community, in Selangor (the urban area) and Pahang (the rural area). The total sample size chosen by purposive sampling was 15 elderly participants who are living with their own families. An open, unstructured and in-depth interview was conducted with these participants. It began with the questions: what
are the meanings of life for older peoples? More questions were asked on the respondent’s background, why do they prefer to stay with their family members and how they perceive the quality of life in their later life. The interview data were analyzed using thematic analysis.
RESULTS AND DISCUSSIONResults in Table 1 showed that four Malay participants were recruited from the rural areas and only one Malay respondent was found in the city area. Four Chinese participants lived in the city and one Chinese respondent recruited from the outskirt of a town area while all the Indian participants came from the rural area. With regards to their education level, one respondent held a diploma, another has Malaysia Certificate
TABLE 1 Profile of participants
Respondent Age Sex Education Employment
Malay 1 64 F No schooling HousewifeChild minder
Malay 2 72 F No schooling Housewife
Malay 3 70 M Primary Rubber tapper
Malay 4 60 F Primary Collecting palm trees fruit
Malay 5 87 F Primary Housewife
Indian 6 63 M Primary Security guard
Indian 7 64 M Secondary Pensioner
Indian 8 63 F Primary Housewife
Indian 9 82 F Secondary Housewife
Indian 10 75 F Diploma Pensioner
Chinese 11 70 F Primary Housewife
Chinese 12 63 F Primary Housewife
Chinese 13 79 F Primary Housewife
Chinese 14 73 F Primary Housewife
Chinese 15 67 M Primary Unemployed

K. Alavi et al.
44 Pertanika J. Soc. Sci. & Hum. Vol. 19 (S) 2011
of Education, one has secondary education, ten have primary education, and the two others did not go to school.
Most of the elderly were found in the rural areas were men and women who were still working in the village; child minder; rubber tapper, oil palm fruit collector, and social worker. While the elderly in the city were security guards, pensioners (ex-customs officer), housewives, and unemployed. The participants’ age ranged between 60 to 87 years, a good mix of early, mid, and late old age. The researchers noted that age was not a setback among elders when they were helping their children in child minding, house cleaning, cooking and so on. Even the elderly in the rural areas were still working because their children were unable to support them financially. The elderly also realized of the higher demands of life faced by their adult children in the era of modernization such as paying their home loan and children’s education fees, transportation, etc.
The first theme emerged in this study was the participants’ understanding and meaning of life and what the future holds for them, what they feel about physical and emotional changes inside their body. These data showed that their responses were related to the family belief and the experiences of the quality of life. This study focused on the elderly who were still active, even though they had reached the middle age and the old categories. Almost all of the participants’ (Malay, Chinese, and Indian) families said that they rarely thought about what was going to happen next in their future. Almost all participants never thought about ageing or plans in old age period. Gabriel and Bowling (2004) noted that the key indicator to the quality of life is measured through their health, illness, and well-being. All the participants seemed to link their ageing to old age diseases like decrease in mobility, physical capacity and changes in their emotions. One of the Malay participants emphasized this:
When we are old illness comes... high blood pressure, diabetes, always dizzy, could not walk fast, while working ... get tired soon, hands and legs are
stiff, and feeling tired. More sensitive ... when grandchild is reprimanded, I can’t take it. My grandchild is with me during the day... at night the parents take over... I find it difficult to sleep at night as all sort of thoughts come into mind.
(Respondent M1)
Another Malay respondent stated that she never had the time to think about ageing, as she was busy taking care of the welfare of her family as a mean to improve her living standard. Besides, a Malay respondent found that it was difficult to share his ageing or meaning of aging. He admitted that there were differences between his young days and old age.
In contrast, two of the Malay participants confirmed that the meaning of aging had a close relationship with health problems. They continually moaned of being unwell, followed by frequent headaches, knee pain, heel pain, and weak to perform daily activities. They were hoping for good health to enable them to carry out the daily tasks such as tapping rubber, collecting palm fruit and doing household chores. For example,
Ovoid ... when we are old, sure we will be unwell. Sometimes I feel dizzy, whole body aches ... knee aches, heel pain and feel helpless. I really hope for body healthy, so that I can tap, or to collect palm oil fruit...
(Respondent M4)
I always feel weak because there is no energy, no appetite to eat. Now I’m always worried and sad thinking about my children ... two of them not married ... if possible I marry off my daughters before the age of 30, but they are still not married ... I always think of the children, all living in city. My husband and I are feeling weak. If they are with us they will take care of us.
(Respondent M5)
Exploring the Meaning of Ageing and Quality of Life for the Sub-Urban Older People
45Pertanika J. Soc. Sci. & Hum. Vol. 19 (S) 2011
The views of the Indian participants towards ageing were similar to the Malay participants. Most of the participants said that they were very happy to see their family expanding; their children got married and having grandchildren. One of the Indian participants stated that he was very pleased to be with his children and grandchildren until the end of life. Whereas, another Indian respondent expressed the meaning of aging as follows:
I can feel the difference, the body is weak, not like before ... I am now much more patient. I can rationalize my emotions and feelings are rather stable. Rarely thought about myself, often think about the welfare of children...
(Respondent I7)
Body getting weaker than before, not much emotion changes and I hope my children can live happily. I also never thought of ageing nor be afraid to age.(Respondent I 8).
The findings from Indian respondent 8 collaborated with Thompson et al. (1990) who explored the life stories of people aged 60 to 80, who were grandparents. They found that regardless of the chronological age, the physical signs of aging or the health status did not make the participants perceive themselves as ‘old’. Nor did their lives fit stereotypical views of the old age. Almost all Indian participants stated that aging was closely knitted to health problems but they were very happy to be with their children and grandchildren. For instance:
For me, at this old age, weakened body, I cannot do heavy work like before ... I cannot think fast and I’m less efficient ... As I age, I feel upset often as I cannot do what I wish. Prior to this, I faced all the challenges but now is being hindered by ageing. I wish to stay with my family until the end of life.
(Respondent I9)
The sense of aging among the Malay, Indian and Chinese participants did not have much difference. Almost all participants indicated that significant differences can be seen in their physical capacities. It is interesting to note that the participants were rather calmer and relaxed in handling their family issues in their old age. They often hoped for happiness in their families. Two of the Chinese participants emphasized that:
I have more than 10 grandchildren ...body is getting weak ... cannot do heavy work, body ache, can’t stand or sit for long ... emotions under control, I am not as angry as before. Easy to “let go”, calmer, not nosy, can’t do much so just relax. Children are bigger and can decide for themselves, only the two of us at home. ... But what I expect is to see them getting married ... who’s going to take care of them when they are old. Once children are happy setting up their home, there is nothing to worry.
(Participants C11)
... At the age of 60 years ... like me now, need help from others, to wash clothes, cannot squat, leg cramps ... cannot rise and sit down quickly ... back bone feels like terrible. Emotionally feel bad, as cannot do work as much as before. It’s common to be sad and happy ... all parents were like that. If possible I don’t want to be bed-ridden, don’t want to be a burden to my children or make life difficult for everyone.
(Respondent C12)
Similarly, Chinese respondent 10 admitted that the health problems did slow down their routines. It made them feel distressed because they were unable to live independently in the last stages of life. However, they accepted the fact that as they age their health would deteriorate. They hope that they can care for themselves and wish for happiness to their families and children.

K. Alavi et al.
46 Pertanika J. Soc. Sci. & Hum. Vol. 19 (S) 2011
Becoming old has affected my health, health is deteriorating. Old age has weakened my body and energy. However, I accept the fact that I’m getting old and hope not to bother my children, and wish to be independent. I always think about my children’s future...
(Respondent C13)
There was a Chinese respondent who moaned about her inability to take care of herself, and have to rely on her children for financial assistance to buy her medicines. Plus, she was also disappointed with her children who did not understand her inability. These findings were consistent with Freitas et al. (2010) where the quality of life of the older people can be determined by their capacity of maintaining autonomy and independence in life. Most of the older people were afraid of old age because of the possibility to be dependent as a result of illness or inability to do their daily chores. However, they consoled themselves by looking back on the sweet memory on how they raised their children. For example:
I think aging can lose one’s ability to attend to oneself and need to be cared by family members. I done like to be a burden for always asking money for treatment. I have no strength, no ability to move about. Sometimes family members do not understand my needs and feelings. I always remember the sweet memories of the past. I hope to recover quickly to live with the family harmoniously. I always reflect on the success of the children and my ability to raise the children after my husband died.
(Respondent C14)
I can feel the impact on health, relatively slow reaction, declining and worrying condition of health ... I can accept the reality of aging and emotionally don’t
want to be a hot-tempered old man...I always think about my children’s future and hope they will take care of me in my older days later.
(Participants C15)
According to the participants, being healthy in the old age was important because it allowed them to be active in their life. However, all participants accepted the fact that, being healthy or sick in the old age was a matter of faith. It was also observed that old people needed to believe in themselves and accept the changes inherent to endure the aging process, accepting losses and perceiving them as possibilities of taking up new interests and opportunities to continue to learn and experience new situations (Freitas et al., 2010). This is the main goal of the social work practice with older people where it aims to empower the elderly to have a positive thinking in the old age period (Zastrow, 2010). Therefore, social workers need to be trained in gerontology. They acquire different types of training, community education and offer more leisure activities to the elderly. These plans will help social workers to work with older people in managing the changes and loss due to the transition of life period. The loss refers to the lack of body function, bereavement of spouse or friends and being homeless.
A social worker can play their roles by giving awareness to the elderly through leisure activities in accordance with the participants’ interests. This is important for a successful aging activity. A successful aging means usage of all the capacity to respond optimally to predictable challenges of growing old. For example an older person who manages his/her sickness effectively so that it does not reduce his/her participation in routine works or voluntary activities. For some elderly, the daily routine activities such as personal care (sleep, rest, and a hobby), cooking, cleaning the house or sitting calmly can be challenging. The social worker should counsel older people via social and spiritual activities to promote their well-being. Leisure activities are activities that occupy the loneliness of one

Exploring the Meaning of Ageing and Quality of Life for the Sub-Urban Older People
47Pertanika J. Soc. Sci. & Hum. Vol. 19 (S) 2011
who has lost someone dear (Sharp and Mannel, 1996). Even these activities can provide better mental health to the elderly. The leisure activities are tools to entertain the individuals’ minds and prevent them from stress and depression. This helps to maintain ties with other people and to give renewed meaning of the old age to life.
In exploring the meaning of life, there are differences between aging men and women. Elderly men get more life satisfaction than older women. Women still carry out some responsibilities such as caring for sick husbands and raising children and grandchildren. On the other hand, their participation in leisure activities is restricted due to income, health and education barriers. However, older women are more active than older men, in caring of grandchildren and participating in social activities in the community. Some participants described that they had been nursing the elderly from young: mother, father, in laws even their sick husbands. All participants expect care assistance from their children when they are sick or immobile.
CONCLUSIONThe findings concluded that aging and the quality of life of older people in sub-urban area were perceived to be both positive and negative. Those with positive perceptions were happy because they were close to their children and grandchildren, for them this was the quality of life. A negative perception was that some of the participants could not care less on family matters. They were rather calm, patient, and able to rationalize their emotions better even in the old age. However, older women’s traditional roles have not changed as they continue to carry out their routine activities. In this aspect they cope better with old age. However, older men tended to have somewhat limited mobility within the family or communal activities. The negative perceptions towards aging and quality of life were result in vulnerable feelings of old age. Most of the participants feared to be dependent on their children for care and financial assistance. They wanted to live independently
just as when they were young. There were participants who groaned about their mobility to work in and outside the house due to impairment and various health problems. The health problems could also hamper their daily routines when they were used to be before. Poor health has adverse effect on the elderly as they have to rely on others. Therefore, the findings propose the potential roles of gerontological social workers to fulfill the needs of the older people by enhancing their quality of life and their families’ well being. Social workers are well trained to work with older population because of their holistic perspective and offer the “perfect hybrid career” prospects in the field of aging for the coming decades. One should prepare mentally, physically, financially, and have good relationship with others to achieve successful aging. This is because aging is a stage in when one experiences loss of job, position, pay-cut, limited social interaction, and changes to self-image in society.
ACKNOWLEDGEMENTThe researcher is greatly indebted to the Ministry of Science, Technology and Innovation (MOSTI) for the financial support to this research project.
REFERENCESBattista, J., & Almond, R. (1973). The development
of meaning in life. Psychiatry, 36(6), 409-427.
Bigelow, D. A., Brodsky, G., Steward, L., & Olson, M. (1982). The concept and measurement of quality of life as a dependent variable in evaluation of mental health services. In G. J. Stahler, & W. R. Tash (Eds.), Innovative approaches to mental health evaluation. New York: Academic Press,
Bowling, A. (1996). The effects of illness on quality of life: Findings from a survey of households in Great Britain. Journal of Epidemiology and Community Health, 50(2), 149-155.
Bowling, A. (1995a). What things are important in people’s lives? A survey of the public’s judgments to, inform scales of health related quality of life. Social Science and Medicine, 41(10), 1447-1462.

K. Alavi et al.
48 Pertanika J. Soc. Sci. & Hum. Vol. 19 (S) 2011
Bowling, A. (1995b). The most important things in life – Comparisons between older and younger population age groups by gender: Results from a national survey of the public’s judgments. International Journal of Health. Sciences, 6(12), 169-175.
Browne, J. P., Boyle, C. A., & McGee, H. (1994). Individual quality of life in the healthy elderly. Quality of Life Research, 3(2), 235-244.
Day, A.T. (1991). Remarkable survivors. Washington DC: Urban Institute Press.
Department of Statistics. (2001). Population d i s t r i b u t i o n a n d b a s i c d e m o g r a p h i c characteristics. Putrajaya: Department of Statistics.
Farquhar, M. (1995). Elderly people’s definitions of qualify of life. Social Science and Medicine, 41(10), 1439-1446.
Freitas, M. C., Queiroz, T. A., & Sousa, J. A. V. (2010). The meaning of old age and the aging experience of in the elderly. Rev. Esc. Enferm. USP, 44(2), 403-8.
Gabriel, Z., & Bowling A. (2004). Perspectives on quality of life in older age. In Walker et al. (Eds), Growing older. Buckingham: Open University Press..
National Institute on Aging. (2008). Why population aging matters: A global perspective .Washington, DC: National Institute on Aging.
Noonan, A.E., Tennstedt, S., & Rebelsky, F.G. (1996). Making the best of it: Themes of meaning among informal caregivers to the elderly. Journal of Aging Studies, 10(4), 313-327.
Ong Fon Sim. (2002). Ageing in Malaysia: A review of national policies and programmes. In D. R. Phillips, & C. M. Chan (Eds.), Ageing and long-term care: National policies in the Asia Pacific Singapore (pp. 107-149). Institute of Southeast Asian Studies and International Development Research Centre, Canada.
Reker, G. T., Peacock, E., & Wong, P. T. P. (1987). Meaning and purpose in life and well-being: A lifespan perspective. Journal of Gerontology, 42(1), 44-49.
Sharp, A., & Mannell, R. C. (1996). Participation in leisure as a coping strategy among bereaved women. Eighth Canadian Congress on Leisure Research. Ottawa: University of Ottawa.
The WHOQOL Group. (1995). The world health organization quality of life assessment (WHOQOL): Position paper from the world health organization. Social Science and Medicine, 41(10), 1403-1409
Thompson, P., Itzin, C., & Abendstern, M. (1990). I don’t feel old: Understanding the experience of later life. London; Oxford University Press.
Zastrow, C. H. (2010). The practice of social work: A comprehensive work text (9th ed.). Belmont, CA: Brooks/Cole.

ISSN: 0128-7702Pertanika J. Soc. Sci. & Hum. 19 (S): 49 - 56 (2011) © Universiti Putra Malaysia Press
Received: 3 May 2011Accepted: 28 July 2011*Corresponding Author
INTRODUCTIONChild prostitution is not a new phenomenon in Malaysia. But, it is a phenomenon that the public does not really know and understand. In fact many claim it does not exist (Sereny, 1985; O’Grady, 1994). People fail to realize its existence because child prostitution is seen as no different from adult prostitution. Children in prostitution are assumed to have the same moral values and attitudes as women in prostitution and that they are also ‘selling’ their bodies to men for money (Lukman, 2009a; Jeffreys, 1997; Sycamore, 2000). Most people believe that children as well as women in prostitution choose to break the law and deserve whatever happens to them (Hofstede et al., 1999; Lukman et al., 2011). No distinction has been made between the two groups of females in terms of their age, power, cognitive and psychological ability,
as well as maturity (Sullivan, 2005; Cusick et al., 2003). Like prostituted women, children in prostitution also have been stigmatized, marginalized, criminalized, and treated abusively by the society (Shaw and Butler, 1998; U.S. Department of State, 2000).
Understanding the precipitating factors that make children vulnerable to prostitution does not fully explain how they are drawn into ‘the life’ (Sullivan, 2005; Cusick et al., 2003; Lukman, 2009b; Klain, 1999). Other related aspects also should be examined. One of the important aspects to consider in the case of children’s involvement in prostitution is the ‘recruitment processes’. Gray et al. (2002) define ‘recruitment into prostitution’ as the process of selecting individuals for prostitution. There are many ways a child or young woman can be recruited. Often recruitment is accomplished
Betrayal of Trust: The Involvement of Children in Prostitution
Z. M. Lukman*, I. Fauziah, H. M. Rusyda, N. Sarnon, M. K. Mokhtar, Alavi, K., Sheau Tsuey Chong, S. Nen and O. Fatimah
School of Psychology and Human Development, Faculty of Social Sciences and Humanities, Universiti Kebangsaan Malaysia, 43600 UKM, Bangi, Selangor, Malaysia
*E-mail: [email protected]
ABSTRACTThe involvement of children in prostitution is a well known phenomenon but not well understood. The aim of this study was to examine the involvement of children in prostitution. A total of 63 sexually exploited young women participated in this children-centered approach study. Both quantitative and qualitative methods were used. Respondents’ age ranged from 13 to 18 years old. Nearly 89.0 percent of them were 16-18 years old. This study found that the youngest respondent first involvement in prostitution was nine years old. A majority of them entered prostitution at the age of between 13 to17 years old and more than half were 15-16 years of age. The average age of the respondents’ first involvement in prostitution was 15.1 years. Three main reasons for their involvement were boyfriends’ deceit, friends’ influence, and personal. The study provides a significant implication to social workers on how they should treat children who are safeguarded from prostitution and living in the rehabilitation centers.
Keywords: Child prostitution, pimp, enticement, rape
Z. M. Lukman et al.
50 Pertanika J. Soc. Sci. & Hum. Vol. 19 (S) 2011
through lies, blackmail, tricks, exploiting friendships or relationships, enticement, playing on the financial needs of the person being recruited, intimidation, and peer pressure (Farley and Kelly, 2000; Phoenix, 1999; O’Connell-Davidson, 1998). The recruitment process of young women into prostitution almost always involves adult accomplices, particularly pimps (Estes and Weiner, 2002; Barrett et al., 2000). Pimps are almost ‘invisible’ from the public eye (Abiala, 2003; Sullivan, 2005). They control the ‘business’ and play a vital role in exploiting and manipulating prostituted young women (May et al., 2000; Aderinto, 2007). Individuals responsible for recruiting young women into prostitution other than ‘pimps’ that are frequently mentioned in the literature are parents, relatives, and peers (Barnitz, 2000; Taylor-Browne, 2002; May et al., 2000).
The current study aims to examine the involvement of children in prostitution. Many researchers (e.g., Estes and Weiner, 2002; Farley and Kelly, 2000; Phoenix, 1999; O’Connell-Davidson, 1998; Barrett et al., 2000) believed that children do not voluntarily choose to be prostitutes or involved in prostitution. But, they are victims of sexual exploitation by perpetrators who want to make a quick profit from prostitution (Sullivan, 2005; Cusick et al., 2003; Voss, 1999; Aderinto, 2007; Gould, 2001). The researchers therefore would like to find out the situation of the phenomenon in Malaysia; are children or young women in Malaysia also being recruited into prostitution and who are the ones responsible to bring them into prostitution.
METHODSThe researchers hypothesized that most of the young women in the research sample would have entered prostitution because of being tricked, forced or trapped by perpetrators. In this research, the use of the children-centered approach would seem to be the right choice, considering that children in prostitution are victims of sexual exploitation. Such method is also for the fact that the nature of the phenomenon is sensitive. The small scale of this research is also the reason for
using such approach. Children-centered approach is concerned with the pressures and influences that affect children involved in research more than other approaches (Barker and Weller, 2003). It has the ability to minimize any possible risk to the children resulting from the research. In principle, the approach places children at the centre of the research process, regarding them as socially competent and worthy of investigation (James et al., 2002). It recognizes children as knowledgeable individuals who know about their own worlds more than adults (United Nations, 2000; Sullivan, 2005; Cusick et al., 2003). Adults do not always know everything about children’s worlds, what they are doing and thinking (RWG-CL, 2003). This approach would also be an advantage to the children because it gives them opportunities to address their situation without adult interventions.
This research was conducted with the participation of young women safeguarded from prostitution in two rehabilitation centers. Both centers are located in Peninsular Malaysia (West Malaysia). In this research, both quantitative and qualitative methods were used. According to Poindexter (2002) the use of a combination of qualitative and quantitative methods is often considered the best and most efficient approach to collecting in-depth and complete information for research, since the two complement each other and make up for what the other method lacks. The advantage of using these methods is that it allows such a difficult target group of young women in prostitution to be approached with respect to their rights, vulnerability, safety, and confidentiality.
A total of 86 sexually exploited young women were interviewed, which represents a 100 percent of the total residents in both centers who consented to participate in the research. However, only 63 residents were considered relevant for the research. Of those eliminated, 17 were found not involved in any activity related to prostitution, while six young women refused to take part in this research.
The youngest respondent involved in this research was 13 years old and the oldest was 18. Nearly 89.0 percent of them were 16-18

Betrayal of Trust: The Involvement of Children in Prostitution
51Pertanika J. Soc. Sci. & Hum. Vol. 19 (S) 2011
years old and about 11 percent were 13-15. The average age of the respondents was 16.95 years old. Young women of 18 years old were the majority of the respondents (44.4 percent) who participated in this survey.
RESULTS AND DISCUSSIONThis study found that the youngest respondent’s first involvement in prostitution was at nine years old (Table 1). The majority of them (92.0 percent) entered prostitution at the age of 13-17 years old and more than half (55.5 percent) were 15-16 years of age. The average age of the respondent’s first involvement in prostitution was 15.10 years. Up-close, 49.2 percent of the respondents entered prostitution in their intermediate secondary school age (16-18 years), 46.0 percent at the lower secondary school age (13-15 years), and 4.8 percent at the primary school age (7-12 years).
TABLE 1 Age of entry into prostitution
Age of respondent Frequency Percentage9 1 1.611 2 3.213 8 12.714 7 11.115 14 22.216 21 33.317 8 12.718 2 3.2Total 63 100.0
Most of the young women indicated that the person they ‘trusted most’ introduced them to prostitution (Table 2). In about 48.0 percent of cases, prostitution was due to their boyfriends’ deceit, 38.1 percent were influenced by a friend, two respondents were forced by their mother, and one was persuaded by a relative (uncle). Nearly ten percent however said that they become involved in prostitution as a result of
their own personal decision. Up close, more than half of rape victims in the current study entered prostitution under the influence of peers (Table 3).
TABLE 2 Ways to prostitution
Ways to prostitution Frequency PercentageInfluenced by a friend 24 38.1Own decision 6 9.5Deceived by boyfriend 30 47.6Forced by mother 2 3.2Persuaded by relative 1 1.6Total 63 100.0
TABLE 3 Ways in which rape victims entered
prostitution
Ways into prostitution
Rape victimsFrequency Percentage
Influenced by a friend
8 57.1
Thought of it myself 1 7.1Deceived by boyfriend
3 21.4
Forced by mother 1 7.1Persuaded by relative 1 7.1Total 14 100.0
The findings support the hypothesis. The perpetrators were found to be the persons they ‘trusted most’ who then tricked, forced or trapped them into prostitution. Most significantly they include ‘boyfriends’, relatives, and their mothers. The ‘boyfriend’, in this case, is not the one who truly love or care for the young women, or who would willingly protect the young women in any kind of situations. They are pimps who want to take advantage from the vulnerability of the young women by making them “money machine” (Hosey and Clune, 2002; Gray et al., 2002).

Z. M. Lukman et al.
52 Pertanika J. Soc. Sci. & Hum. Vol. 19 (S) 2011
A feigned friendship and love is a primary method of procuring a young woman for prostitution (Sullivan, 2005; Cusick et al., 2003; NCMEC, 2002). This method is a classic tactic of recruitment used by pimps (May et al., 2000). Pimps use a systematic plan to gain control of a young woman by gradually luring her away from her support network until she is completely separated from friends, family, and her home (Gray et al., 2002; Aderinto, 2007). In general, the process to recruit a young woman into prostitution starts when a pimp approaches her, befriends her, ‘sweet-talks’ her, gradually builds a comforting relationship by giving attention and feigned affection and later convinces her ‘to be his woman’ until she is dependent upon him emotionally or financially (Hay, 2004; Barry, 1995; Hofstede et al., 1999). A pimp is able to detect what is missing in the young woman’s life and that makes her vulnerable to become sexually exploited (Gray et al., 2002). During the relationship, she may be seduced with gifts, compliments, and even a promise of marriage or a lifetime commitment (Sereny, 1985; Sorajjakool, 2003).
After making the young woman dependent on him, the pimp slowly separates the young woman from her support group (family, relatives and friends) and introduces her to drugs and alcohol (Gray et al., 2002; Hay, 2004). At this stage, the pimp begins to dominate her, eventually establishes control, and forces her into prostitution, either on the streets or in an indoor place (Saikaew, 1996). Some women may realize they are victims of prostitution the minute they are forced, but many take a long time to realize it (O’Connell-Davidson, 1998; May et al., 2000; Roman et al., 2002). Often young women regard what they do or they are told to do as a form of ‘sacrifice’ for their ‘love’ relationship, and they continue to think of the pimps as their ‘boyfriends’ (Klain, 1999). This happens because the emotional bond between the young woman and her pimp affects her perspective taking abilities. She does not regard those who benefit from her prostitution earnings as a pimp, rather as a ‘boyfriend’ or ‘partner’
(Department of Health, 2000; May et al., 2000). Tipah’s account provides a good example of this process:
It all started when I met and fell in love with a guy whom now I will hate for the rest of my life. I was 16 years old and was studying in form four at secondary school. He was 25 years old, good looking and a sweet talking young man. Every time he came to see me, he would bring me a present … It felt really nice when someone thought you were very special, cared and tended to your needs and confessed that you were always in his heart … I was pushed to give myself to him as prove of my never-ending love for him … After two months, he showed his real character; aggressive, bad tempered, rude, insolent, foul-mouthed, and so on. At that time, I realized that he was not sincere, and not committed to marrying me … In the hotel I was drugged and raped … When I woke up, I was in a room with nine other young women, three Indonesians, five Thais, and one Chinese. I asked one of the Indonesian young women where was I. She told me that she also did not know where she was. She believed that I was sold to the same man who controlled the prostitution syndicate in the hotel. My heart was broken when she told me about that.
(Tipah, a 16-year-old victim of prostitution)
Pimps or boyfriends also recruit and mingle with young women who desire money or desire what they believe will be a glamorous, comfortable and exciting lifestyle (Scott, 2002). Initially, pimps often promise these young women money, a car, nice clothes and jewellery (Roman et al., 2002; Estes and Weiner, 2002). Young women who are addicted to drugs are also vulnerable to being recruited (Lukman, 2009a; Hosey and Clune, 2002; Spangenberg, 2001).

Betrayal of Trust: The Involvement of Children in Prostitution
53Pertanika J. Soc. Sci. & Hum. Vol. 19 (S) 2011
Peer influence was found to be the second most important way in which young women entered prostitution. Nevertheless, the percentage found in this study was lower (38.1 percent) than the result (60 percent) found by Schetky (1988). Some peers work independently in prostitution and they influence other young women to get involved to follow their lifestyle. They may do this because of loneliness and the need for friends while involved in prostitution (Spangenberg, 2001; Hunter, 1994; Duong, 2002). They introduce these young women to prostitution as ‘an adventurous’ way to make money to survive, or to make more money than they could possibly achieve by legitimate means (Cusick et al., 2003; Finkelhor and Ormrod, 2004). Often, peers ‘provoke’ or ‘feed’ these young women with stories of the exciting, glamorous life on the streets, as well as with outward signs of being ‘successful’ in their pursuit of their victims – nice clothes, pretty jewelry, pagers and mobile phones, easy access to drugs, a network of adult friends who take them to ‘grown up’ places (e.g., night clubs, bars, holiday trips) and adults who ‘protect’ them from harm by others (Saphira, 2002; Estes and Weiner, 2002;). Some children, especially those living on the streets, in poverty and in desperate living condition, are easily seduced by the ‘exciting’ stories of prostitution by their friends, particularly when their friends showed material evidence of what they already achieved from prostitution (Lukman, 2011; Gray et al., 2002). However, other peers may influence young women for their pimps because they are asked to do so (Estes and Weiner, 2002).
The current study also found that more than half of rape victims entered prostitution under the influence of peers. The social learning theory can explain more about the relationship. According to the theory, childhood sexual exploitation teaches the victim to view herself as sexually degraded – as ‘loose’, ‘dirty’ and/or ‘damaged goods’ (Brannigan and Van Brunschot, 1997). Prostitution thus become an option for self-revenge for what they feel about themselves as they believe they have nothing left to lose (United Nations, 2000; Lukman, 2009b). They are easily influenced when they meet up with
friends who are already in prostitution, or who know an ‘adventurous’ way of making money for survival. Shima explained this process in the following way:
After a few months living with Anna, she suggested that I should find a job. I told her that I would be very happy to work, but without any certificate how was I to get a job and who would want to employ me? I was then only 14 years old. To my surprise, she put the idea for me to take up the job. I told her that I was too scared and was without any experience to do the job. However, she pointed out that the job could easily make me rich … In the beginning, I did feel guilty about doing the job. But I realized the job was the ticket to my survival and independence. I knew it was not a real job. Yet, it was better than being raped. I was a rape victim and other people who have been raped will understand my situation and why I did it. When you have been raped, you are completely stripped of your self-worth. Life means nothing to you. Therefore, you might as well try the job, as you have nothing to lose.
(Shima, a 14-year-old victim of prostitution)
CONCLUSIONThe majority of young women had been betrayed, tricked or coerced by perpetrators and influenced by friends to engage in prostitution. The nature of ‘choice’ is greatly debated in the context of children’s involvement in prostitution. Adults may choose prostitution as a career deciding for them what is good and bad for their life. But, children do not ‘choose’ a life of prostitution. They lack awareness and have limited social, emotional, and intellectual development to understand fully their actions and make responsible choices. Instead, they are lured, coerced, enticed or forced into a life of prostitution by adult due to their immaturity,

Z. M. Lukman et al.
54 Pertanika J. Soc. Sci. & Hum. Vol. 19 (S) 2011
helplessness, and weakness. Although some children may claim to be acting ‘voluntarily’, in reality this cannot be considered voluntary or consenting behavior. For the vulnerable and often victimized children, there may be too few alternative options to choose from.
The study has given a significant implication to social workers on how they should treat children who are safeguarded from prostitution and living in the rehabilitation centers. These young women have been betrayed by persons they trusted. Social workers have a challenge to lay trust back into the young women self in order to develop their self-esteem and self-worth. For future research, it is important to study the effect of prostitution on children psychologically and socially for social workers to fully understand them and to provide the best intervention process for them to recover from the dark life of prostitution.
ACKNOWLEDGEMENTThe researcher is greatly indebted to Prof. Simon Hackett for his willingness to supervise this research and to the Malaysian Public Service Department and the Universiti Kebangsaan Malaysia for their financial support.
REFERENCES Abiala, K. (2003). The prostitution of sex and sexual
trafficking: Context, actors and attitudes in Moldova, Estonia and Sweden. Paper presented at the 5th European Feminist Research Conference on Gender and Power in the New European. Lund University, Sweden. 20th-24th August 2003.
Aderinto, S. (2007). The girls in moral danger: Child prostitution and sexuality in Colonial Lagos, Nigeria, 1930s to 1950. Journal of Humanities and Social Sciences, 1(2), 1-22.
Barker, J., & Weller, S. (2003). Is it fun? Developing children centred research methods. International Journal of Sociology and Social Policy, 23(1/2), 33-58.
Barnitz, L. A. (2000). Commercial sexual exploitation of children: Youth involved in prostitution, pornography & sex trafficking. Washington: Youth Advocate Programme International.
Barrett, D., Barrett, E., & Mullenger, N. (eds.) (2000). Youth prostitution in the New Europe: The growth in sex work. Dorset: Russell House Publishing.
Barry, K. (1995). The prostitution of sexuality: The global exploitation of women. New York: New York University Press.
Brannigan, A., & Van Brunschot, E. G. (1997). Youthful prostitution and child sexual trauma. International Journal of Law and Psychiatry, 20(3), 337-354.
Cusick, L., Martin, A., & May, T. (2003). Vulnerability and involvement in drug use and sex work. Home Office Research Study No. 268. London: Home Office Research, Development and Statistics Directorate.
Department of Health. (2000). Safeguarding children involved in prostitution: Supplementary guidance to working together to safeguard children. London: Department of Health, Home Office, Department for Education and Employment, & National Assembly for Wales.
Duong, L.B. (2002). Viet Nam – Children in prostitution in Hanoi, Hai Phong, Ho Chi Minh City and Can Tho: A rapid assessment. Geneva: IPEC.
Estes, R. J., & Weiner, N. A. (2002). The commercial sexual exploitation of children in the U. S., Canada and Mexico. Philadelphia: Center for the Study of Youth Policy, University of Pennsylvania.
Farley, M., & Kelly, V. (2000). Prostitution: A critical review of the medical and social sciences literature. Women & Criminal Justice, 11(4), 29-64.
Finkelhor, D., & Ormrod, R. (2004). Prostitution of juveniles: Patterns from NIBRS. Juvenile Justice Bulletin, June 2004.
Gould, A. (2001). The criminalisation of buying sex: The politics of prostitution in Sweden. Journal of Social Policy, 30(3), 437-456.
Gray, L., Mark, M., Campbell, Z., & Moore, M. (2002). Full circle. Vancouver: Urban Native Youth Association.
Hay, M. D. (2004). Commercial sexual exploitation of children and youth. British Columbia Medical Journal, 46(3), 119-122.

Betrayal of Trust: The Involvement of Children in Prostitution
55Pertanika J. Soc. Sci. & Hum. Vol. 19 (S) 2011
Hofstede, A., Carter, V., Determan, E., Jacobs, B., Miller, K., Patterson, G., Peterson, S., Pettiford, A., Skillingstad, C., & Snyder, L. (1999). The Hofstede committee report: Juvenile prostitution in Minnesota. Minneapolis: Minnesota Attorney General’s Office.
Hosey, J., & Clune, D. (2002). We can do better: Helping prostituted women and girls in grand rapids make healthy choices – A prostitution round table report to the community. Grand Rapids, MI: Nokomis Foundation.
Hunter, S. K. (1994). Prostitution is cruelty and abuse to women and children. Michigan Journal of Gender & Law, 1(1994), 1-14.
James, A., Jenks, C., & Prout, A. (2002). Theorizing childhood. Cambridge: Polity Press.
Jeffreys, S. (1997). The idea of prostitution. North Melbourne: Spinifex.
Klain, E. J. (1999). Prostitution of children and child-sex tourism: An analysis of domestic and international responses. Arlington, VA: National Center for Missing and Exploited Children.
Lukman, Z. M. (2009a). Childhood abuse among children involved in prostitution in Malaysia. The Social Sciences, 4(6), 567-572.
Lukman, Z. M. (2009b). The prevalence of running away from home among prostituted children in Malaysia. Journal of Social Sciences, 5(3), 157-162.
Lukman, Z. M., Nasir, R., Fauziah, I., Sarnon, N., Sheau Tsuey, C., Mostafa Kamal, M., Mohamad, M. S., Zainah, A. Z., Subhi, N., Fatimah, O., Nen, S., Hoesni, S. M., Khairudin, R., & Rusyda, H. M. (2011). The relationship between dysfunctional family and the involvement of children in prostitution. World Applied Sciences Journal, 12, 7-12.
May, T., Harocopos, A., & Hough, M. (2000). For love or money: Pimps and the management of sex work. Police Research Series – Paper No. 134. London: Policing and Reducing Crime Unit, Home Office.
NCMEC. (2002). Female juvenile prostitution: Problem and response. Second Edition. Virginia: NCMEC.
O’Connell-Davidson, J. (1998). Prostitution, power and freedom. Michigan: The University of Michigan Press.
O’Grady, R. (1994). The rape of the innocent: One million children trapped in the slavery of prostitution. Bangkok: ECPAT.
Phoenix, J. (1999). Making sense of prostitution. New York: St. Martin’s Press.
Poindexter, C.C. (2002). Meaning from methods: Re-presenting narratives of an HIV-affected caregiver. Qualitative Social Work, 1(1), 59-78.
Roman, J., Nachtman, C., & Walker, N.E. (2002). Prostituted teens: A problem for Michigan too. In Michigan Family Impact Seminars Briefing Report No. 2002-2. Prostituted teens: More than a runaway problem. (pp. 5-12) Michigan: Institute for Children, Youth, and Families, Michigan State University.
RWG-CL. (2003). Handbook for action-oriented research on the worst forms of child labour including trafficking in children. Bangkok: Regional Working Group on Child Labour in Asia (RWG-CL).
Saikaew, L. (1996). A non-governmental organization perspective. In R. B. Reich, & J. F. Otero (Eds.), Forced labor: The prostitution of children (pp. 63-70). Washington: U.S. Department of Labor, Bureau of International Labor Affairs.
Saphira, M. (2002). Child prostitution in New Zealand. Social Work Now, 22(August), 6-13.
Schetky, D. H. (1988). Child pornography and prostitution. In D. H. Schetky & A. H. Green (Eds.), Child sexual abuse: A handbook for health care and legal professionals (pp. 153-165) NY: Brunner/Mazel. .
Scott, M. S. (2002). Street prostitution. Problem-Oriented Guides for Police Series No. 2. Washington DC: Office of Community Oriented Policing Services, U.S. Department of Justice.
Sereny, G. (1985). The invisible children: Child prostitution in America, West Germany and Great Britain. New York: Alfred A. Knopf.
Shaw, I., & Butler, I. (1998). Understanding young people and prostitution: A foundation for practice?. British Journal of Social Work, 28(2), 177-196.
Z. M. Lukman et al.
56 Pertanika J. Soc. Sci. & Hum. Vol. 19 (S) 2011
Sorajjakool, S. (2003). Child prostitution in Thailand: Listening to rahab. New York; Haworth Press.
Spangenberg, M. (2001). Prostituted youth in New York city: An overview. Working Papers Series. New York: ECPAT-USA.
Sullivan, M. (2005). What happens when prostitution becomes work? An update on legalisation of prostitution in Australia. Victoria: Coalition against Trafficking in Women, Australia.
Sycamore, M.B. (Ed.). (2000). Tricks and treats: Sex workers write about their clients. New York: Harrington Park Press.
Taylor-Browne, J. (2002). More than one chance! Young people involved in prostitution speak out. London: ECPAT UK.
U.S. Department of State. (2000). Country reports on human rights practices for 1999. Washington: Bureau of Democracy, Human Rights, and Labor, U.S. Department of State.
United Nations. (2000). Sexually abused and sexually exploited children and youth in Yunnan Province, China: A qualitative assessment of their health needs and available services in selected areas of the province. New York: United Nations.
Voss, M. L. (1999). The commercial sexual exploitation of children. New York: ECPAT-USA.
ISSN: 0128-7702Pertanika J. Soc. Sci. & Hum. 19 (S): 57 - 64 (2011) © Universiti Putra Malaysia Press
Received: 3 May 2011Accepted: 28 July 2011*Corresponding Author
INTRODUCTIONSocial capital consists of the norms of trust and reciprocity shared by a group of people (Putnam, 1993). The literature on social capital among friends mainly focuses on how friendship networks can help individuals in job searches (Davern and Hachen, 2006; De Graaf and Flap, 1988; Flap and De Graaf, 1986; Montgomery, 1992; Stone et al., 2003). This trend in the literature on friendship networks can be traced back to Granovetter’s (1973) idea of ‘the strength of weak ties’. Granovetter asserted
that weak ties are more advantageous in job-searching and getting information than are strong ties. This is because building weak ties require less time and effort than the formation of strong ties and weak ties are more likely to link people into different networks than are strong ties. Indeed Granovetter’s weak ties could be taken as an early reference to bridging social capital. Putnam (2000) introduced the concept of bridging social capital as a feature of open networks (i.e., networks that connect people ‘across diverse social cleavages’).
Enhancing Youth Civic Engagement and Generalized Trust Through Bonding Social Capital among Friends
Sheau Tsuey Chong1*, Karen Farquharson2, Er Ah Choy3, Z. M. Lukman1 and Mostafa Kamal Mokhtar1
1School of Psychology and Human Development, Faculty of Social Sciences and Humanities,
Universiti Kebangsaan Malaysia2Faculty of Life and Social Sciences
Swinburne University of Technology, Hawthorn, VIC 3122, Australia.3School of Social, Development and Environmental Studies,
Faculty of Social Sciences and Humanities, Universiti Kebangsaan Malaysia, 43600 UKM, Bangi, Selangor, Malaysia
*E-mail: [email protected]
ABSTRACTSocial capital among close friends is the norms of trust and reciprocity shared by a group of friends within multi-stranded networks. This research investigated the factors that contribute to the levels of friendship social capital. It also analyzed whether friendship social capital was associated with participation in voluntary associations and whether those who reported high levels of social capital with their friends also reported higher levels of generalized trust in the wider society. Through an online survey of young Australian residents aged 16 to 25 (N=283) closed networks were found to be associated with very high levels of social capital among friends. Further, those with very high levels of friendship social capital were more likely to participate in organized groups and to report high levels of generalized social capital than those with lower levels of friendship social capital. Thus, promoting friendship networks of young people could benefit society more broadly by fostering participation in voluntary activities and generalized social capital.
Keywords: Social capital, young people, network, friendship, generalized trust

Sheau Tsuey Chong, Karen Farquharson, Er Ah Choy, Z. M. Lukman and Mostafa Kamal Mokhtar
58 Pertanika J. Soc. Sci. & Hum. Vol. 19 (S) 2011
There is a lack of research on social capital among close friends. The type of social capital shared by close friends can be described as bonding social capital. Bonding social capital is social capital that is developed and reinforced in homogenous groups which share the same identity in ‘repeated, intensive, multistranded networks’ like family and friendship relationships (Putnam, 2000). The term multistranded here refers to the inter-connections in close friendship groups where most or all of the members are mutual friends. In such networks, the linkages are not centered only on one member of the network because all members are connected. Close friends in the same network develop norms that enable them to trust in and reciprocate with one another, because norms can be imposed more easily in a closed network than an open network (Coleman, 1988).
There is evidence that individuals who are more trusting are more likely to engage in social activities than are those who are less trusting (Green and Brock, 1998; Chong et al., 2011). Voluntary associations are an important part of communities. Voluntary associations are those where people “acting voluntarily and collectively to serve their own interests or those of others, without seeking personal financial benefit” (Passey and Lyons, 2005). Voluntary associations are major service providers of community, sport and recreation, education, health care, the arts, and religious worship (Passey and Lyons, 2005). They are central to Australian life, based on the fact that there are 700,000 voluntary associations in Australia and just under two-thirds of the population belonged to at least one voluntary association in 1997 (Passey and Lyons, 2005). In fact, the 2003 Australian Survey of Social Attitudes (AuSSA) showed that 86% of respondents were then members of at least one voluntary association (Passey and Lyons, 2005).
In general there are two types of membership in an organized group: active and passive. Putnam (2000) documents a decline in generalized social capital in the USA by showing that Americans have stopped attending meetings of social organizations. If they belong to civic
organizations now, it is as passive members who only send in their membership fees or make donations (Putnam, 2000). Putnam (2000) argues that passive members are no different to non-members in terms of their contribution to social capital, because in both there is a lack of face-to-face socialization in cultivating norms of trust and reciprocity. Active members are those who effectively perform a range of volunteer tasks for the association in order for the association to operate. Office holders are the very active members who take legal responsibility for their association, and perform governance activities (Passey and Lyons, 2005). The AuSSA 2003 found that a majority of members of voluntary organizations were passive, not taking an active involvement in the organization (Passey and Lyons, 2005).
There is evidence that members of organized groups are more trusting and more engaged with civil society (Passey and Lyons, 2005; Stolle, 1998), but previous research has not specifically looked at whether this is the case for young people. It is possible that young group members’ close friends would also be members of the same organized groups. Active participation in organized groups might be a way to enhance their friendship by creating more opportunities for them to interact with one another. In this article the researchers test whether Putnam’s (2000) theory that there is a positive relationship between association memberships and generalized trust is accurate for young Australians. The researchers ask whether active membership in organized groups affect the level of trust and reciprocity members have in their friendship groups.
The term generalized social capital relates to a generalized trust in and reciprocity with other people (including strangers) in the wider society. Generalized trust and reciprocity is an extension of bonding social capital (Putnam, 2000), and according to him, generalized trust is strongly related to other forms of civic engagement social capital. Chong (2007) also argues that social capital among neighbors is related to generalize trust. In this article the researchers investigate whether having high levels of friendship
Enhancing Youth Civic Engagement and Generalized Trust Through Bonding Social Capital among Friends
59Pertanika J. Soc. Sci. & Hum. Vol. 19 (S) 2011
social capital was associated with high levels of generalized trust for our young Australian participants. If high friendship social capital is linked with high generalized social capital, it will suggest that fostering friendship social capital in young people would benefit society. It would indicate that young people who build social capital with their close friends are likely to extend their interpersonal trust and reciprocity to people whom they meet in daily life.
The literature indicates that social capital is important for society. However, there has been limited research on friendship social capital in general, and on young people’s friendship social capital in particular. The researchers are interested in whether having high levels of friendship social capital (FRSC) leads young people to join voluntary organizations. Based on our review of the literature, the researchers expect that in dense friendship networks, young people would be likely to join voluntary organizations if friends were members. The researchers also expect that young people with very high levels of FRSC would be more likely to be active group members, as participating in group activities would strengthen their friendship networks. The researchers are also interested in the relationship between high levels of FRSC and generalized social capital (GSC). In other words, does having highly trusting relationships with friends make young people more likely to trust generalized others. The researchers investigate these issues by testing the following hypotheses:
Hypothesis 1: Young people who report that their close friends are all mutual friends have higher FRSC, compared with their counterparts who report that fewer of their close friends are friends with each other, and with those who report that none of their close friends are friends with each other.
Hypothesis 2: Young people who report a very high level of FRSC are more likely to be members of organized groups than are young people who report only a high level of FRSC.
Hypothesis 3: Young people who report a very high level of FRSC are more likely to be active members o f o rgan ized groups than are young people who report only a high level of FRSC.
Hypothesis 4: Young people who report a very high level of FRSC have significantly higher means of generalized social capital (GSC) than do young people who report only a high level of FRSC.
METHODSAn online survey was conducted in this quantitative study using convenience sampling and snowballing technique. Two hundred and eighty three young people (N=283: 86 male, 194 female) aged 16 to 25 (mean age of 21.19) completed the survey between January 2006 and May 2006. Most participants (N=206) were university students who resided in Victoria. Most respondents (N=232, 82%) claimed that they only speak English at home, but only 65.7% reported that their ancestors were from English speaking countries.
Measuring Social Capital among FriendsTo measure social capital among friends, the researchers first asked young people to consider all of their friends who they feel at ease with, can talk to about private matters, or call on for help. These friends are people who are not spouses, romantic partners or immediate members of the young people’s families.

Sheau Tsuey Chong, Karen Farquharson, Er Ah Choy, Z. M. Lukman and Mostafa Kamal Mokhtar
60 Pertanika J. Soc. Sci. & Hum. Vol. 19 (S) 2011
In order to test Hypothesis 1, the existence of multistranded connections between members in the close friendship groups of respondents was investigated, by asking the following question: ‘To what extent do your close friends know one another?’ on an 11-point scale, (1 = No, not at all, 11 = Yes, completely). Three categories of the extent to which the close friends of respondents know one another were studied: ‘a few close friends know one another’, ‘some close friends know one another’, ‘all close friends know one another’. Young people who reported a maximum score (11 points on the 11 point scale) were categorized in ‘all close friends know one another’. Those whose score were between one and 5.99 were categorized as ‘a few close friends know one another’. Next, those whose combined score was between 6.00 and 10.99 were categorized as ‘some close friends know one another’. In order to compare FRSC mean scores of these three groups of young people, a one-way analysis of variance (ANOVA) was conducted. FRSC is treated as continuous data.
Measuring Type of MembershipTo test Hypotheses 2 and 3, respondents were asked about their membership in organized groups. In the organized groups section of the survey, the first question given to the respondent was: ‘B2. Now we would like to ask you about organized groups organized by school/college/university/workplace, community, online community, national or international organizations. Are you a member of any organized group?’ Then, organized group members (OGM) were asked to report their type of membership (member, active member or office-holder). The meaning of being a non-member (NOGM), active member (AOGM) or office-holder was explained earlier as: a) a non-member does not belong to any organized group; b) a passive member pays a subscription, makes donations or is on a mailing list, but he or she is not any more involved than this; c) an active member is regularly involved in
the group’s activities; d) an officeholder has a decision-making role in the group, for example, being a committee member, activity organizer or webmaster.
Due to the small number of officeholders in this sample (n = 25), the category of ‘officeholders’ was collapsed into ‘active members’. First the comparison of the levels of FSC between non-members and members was done followed by the comparison of two types of group membership: passive member; and active member. Non-members were those who did not belong to any organized groups. Those participants who claimed that they belonged to one or more organized groups as a member only (not active or office-holder) were labeled passive members. A respondent who participated as an active member in any group was categorized as an active member. For example, Ann participated in a religious group as a passive member; at the same time she was also an active member of an ethnic group. She was categorized as ‘active member’.
Measuring Generalized Social CapitalTo obtain the combined scores of generalized social capital (GSC), young respondents were asked to answer three questions regarding GSC about most people whom they might meet in an average day (‘including people whom you know and strangers’): ‘To what extent do you trust him or her to act in your best interests?’, ‘. To what extent do you think he or she would be willing to help if you needed it (e.g. giving directions or returning a dropped bag)?’ and ‘To what extent would you yourself be willing to help if he or she needed it? (e.g. giving directions or returning a dropped bag)’. These questions are adapted from Stone and Hughes (2002). All three generalized social capital questions were on an 11-point scale from 1 = ‘No, not at all’ to 11 = ‘Yes, completely’. Reliability analysis shows that this scale has good internal consistency, with a Cronbach alpha coefficient score of 0.79. This result supported Stone and Hughes’s study

Enhancing Youth Civic Engagement and Generalized Trust Through Bonding Social Capital among Friends
61Pertanika J. Soc. Sci. & Hum. Vol. 19 (S) 2011
(2002) that the social capital scale has good internal consistency, with a Cronbach alpha coefficient reported of 0.78. To test Hypothesis 4, comparison of GSC mean scores between young people who reported very high levels of FSC and high levels of FSC was drawn using the continuous data of combined GSC scores.
RESULTS AND DISCUSSIONThe first hypothesis in this paper was that young people who reported that their close friends were all mutual friends would have higher FRSC than their counterparts who reported that either some of their close friends were friends with each other or a few or none of their close friends were friends with each other. A one-way between-groups analysis of variance was conducted to explore the impact of having mutual close friends on FRSC. Subjects were divided into three groups according to the extent of how many of their close friends know each other [Group 1: a few (n = 28); Group 2 (n = 182): some; Group 3: all (n = 30)]. There was a significant difference at the p < 0.001 level in FRSC for the three groups of young people [F(2, 245) = 10.63, p < 0.001]. Next, a post-hoc comparison using Tukey HSD test indicated the mean score for Group 3 (M = 10.59, SD = 0.73) was different from Group 1 (M = 9.17, SD = 1.78) and Group 2 (M = 9.58, SD = 1.25).
This result revealed that young people with the highest levels of FRSC were those whose friends all knew each other, followed by lower FRSC for young people where some of their close friends knew each other, and even lower for young people who had a few or no mutual friends in their close friendship networks. This suggests that high FRSC may be much easier to build in intense and multistranded networks than in loose and unrelated networks. Thus, Hypothesis 1 was supported.
The second and third hypotheses were about FRSC and membership of organized groups. First the researchers studied whether young people who reported very high levels of FRSC were more likely to be OGMs than were
young people who reported high FRSC. All respondents reported high FRSC as the definition of a friend was someone who you trusted. The key difference was between those who reported high FRSC and those who reported very high FRSC. Table 1 shows that a larger percentage of young people who reported very high levels of FRSC (62%) were OGMs than young people who reported high FRSC (44%). A chi-square test was run to confirm the different proportion of each type of membership in high levels of FRSC and very high levels of FRSC categories. The results showed that chi-square value was 8.8, p < 0.001. This indicates that the young people’s motivation to participate in organized groups was associated with the experience of sharing very high levels of social capital with their friends. Young people who reported very high levels of FRSC were less likely to be NOGMs than young people who reported high FRSC. Thus, Hypothesis 2 was supported: young people who had a very high level of FRSC were more likely to be OGMs than were young people who had only a high level of FRSC.
TABLE 1 Type of membership of organized groups by
FRSC (per cent)
Type of membership
FRSC
High Very high Total
NOGM 56 38 46OGM 44 62 54Total 100 100 100Total N 123 152 275
Note: Missing data (n = 8) not included in subtotals
To test Hypothesis 3, young people who reported very high levels of FRSC and those with high FRSC in terms of how active their membership in organized groups were compared. As shown in Table 2, a larger percentage of young people who reported very high levels of FRSC (83%) were AOGMs than were young people who reported high FRSC (74%). However, a chi-square test showed that the differences were
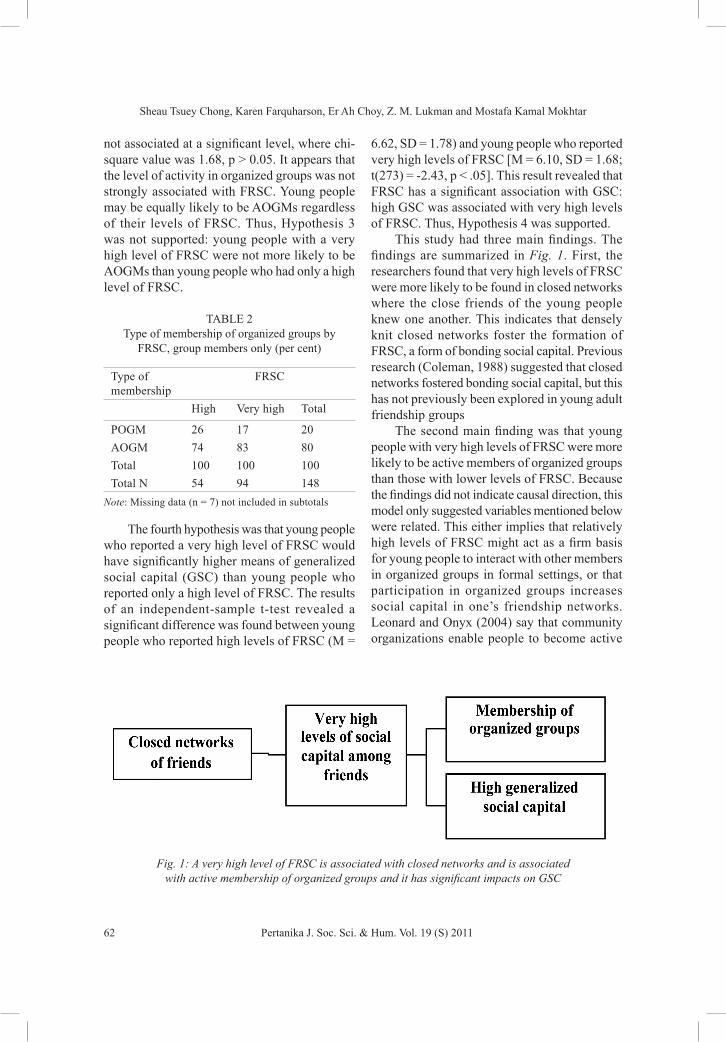
Sheau Tsuey Chong, Karen Farquharson, Er Ah Choy, Z. M. Lukman and Mostafa Kamal Mokhtar
62 Pertanika J. Soc. Sci. & Hum. Vol. 19 (S) 2011
not associated at a significant level, where chi-square value was 1.68, p > 0.05. It appears that the level of activity in organized groups was not strongly associated with FRSC. Young people may be equally likely to be AOGMs regardless of their levels of FRSC. Thus, Hypothesis 3 was not supported: young people with a very high level of FRSC were not more likely to be AOGMs than young people who had only a high level of FRSC.
TABLE 2 Type of membership of organized groups by
FRSC, group members only (per cent)
Type of membership
FRSC
High Very high Total
POGM 26 17 20AOGM 74 83 80Total 100 100 100Total N 54 94 148
Note: Missing data (n = 7) not included in subtotals
The fourth hypothesis was that young people who reported a very high level of FRSC would have significantly higher means of generalized social capital (GSC) than young people who reported only a high level of FRSC. The results of an independent-sample t-test revealed a significant difference was found between young people who reported high levels of FRSC (M =
6.62, SD = 1.78) and young people who reported very high levels of FRSC [M = 6.10, SD = 1.68; t(273) = -2.43, p < .05]. This result revealed that FRSC has a significant association with GSC: high GSC was associated with very high levels of FRSC. Thus, Hypothesis 4 was supported.
This study had three main findings. The findings are summarized in Fig. 1. First, the researchers found that very high levels of FRSC were more likely to be found in closed networks where the close friends of the young people knew one another. This indicates that densely knit closed networks foster the formation of FRSC, a form of bonding social capital. Previous research (Coleman, 1988) suggested that closed networks fostered bonding social capital, but this has not previously been explored in young adult friendship groups
The second main finding was that young people with very high levels of FRSC were more likely to be active members of organized groups than those with lower levels of FRSC. Because the findings did not indicate causal direction, this model only suggested variables mentioned below were related. This either implies that relatively high levels of FRSC might act as a firm basis for young people to interact with other members in organized groups in formal settings, or that participation in organized groups increases social capital in one’s friendship networks. Leonard and Onyx (2004) say that community organizations enable people to become active
Fig. 1: A very high level of FRSC is associated with closed networks and is associated with active membership of organized groups and it has significant impacts on GSC

Enhancing Youth Civic Engagement and Generalized Trust Through Bonding Social Capital among Friends
63Pertanika J. Soc. Sci. & Hum. Vol. 19 (S) 2011
citizens within civil society, so if very high levels of FRSC do lead young people to join organized groups, promoting strong friendship ties could be good for society.
Lastly, levels of FRSC had a significant impact on GSC as young people with very high levels of FRSC reported higher GSC than their counterparts who reported high levels of FRSC. Indeed, tightly knit groups of friends seemed to be outgoing contributors to society in general.
The findings suggested that young people’s FRSC was highest when their close friends were from the same social network. The young people maintained their social capital with close friends in close-knit networks with multistranded and intense social connections. This description of close friendship fits the concept of bonding social capital (Putnam, 2000) and also lends support to Coleman’s (1988) argument that social capital can be built easily in closed networks because the norms of trust can be more effective in the closed networks than open ones.
FRSC was also related to membership in organized groups. In particular, having very high levels of FRSC may have motivated the young people to be OGMs as opposed to NOGMs. This lends support to Putnam’s (2000) argument that interpersonal trust is related to civic engagement. The experience of having FRSC with close friends may encourage young people to meet more people by joining organized groups. It seems that FRSC may act as a springboard for young people to propel themselves into the wider society and become active members of organized groups. In other words, FRSC may act as a platform for young people to reach out to the community and engage in organized group activities. The findings suggested that building very high levels of social capital with friends might act as a bridge between young people and society. On the other hand, having FRSC only at a high level is more likely to produce NOGMs. Those with lower levels of FRSC appeared less motivated to participate in organized groups. To conclude here, having very high trust and reciprocity with close friends may play an important role in young people’s participation in organized groups.
Interestingly, young people with very high FRSC were not significantly more likely to be AOGMs than were those with only high FRSC. So while FRSC was associated with membership of organized groups, it had no significant impact on how active the memberships were. Young people might be influenced by their close friends either to just sign up with organized groups or to be very active in those groups. Indeed, POGMs and AOGMs reported similar chances to build social capital with their friends.
Young people’s trust in and reciprocity with people in general was also associated with levels of FRSC. This implies that generalized social capital may be an extension of FRSC. Through practicing norms of trust and reciprocity with their close friends, young people may be able to extend their trust in and reciprocity with people in general, lending support to Putnam’s (2000) suggestion that personal networks allow trust to be extended to people in general. Thus, building and maintaining social capital among friends may lead to the generalized social capital which is essential to encourage members in the wider society to cooperate with one another. These findings do not support Fukuyama’s (1995) theory that closed networks could produce high social capital which discourage members of the informal networks from widen their formal networks and in turn also prevent them in generating trust in people in general in the broader society. Indeed, the findings show that closed networks of friends may encourage young people to build very high social capital with friends and in turn promote membership of organized groups and higher generalized social capital.
CONCLUSIONThis paper aimed to study bonding social capital among friends. The findings showed that the young people in the sample tended to report very high social capital with their friends when there was closure in their friendship networks. This group of young people was more likely to report high generalized social capital than those with lower levels. This suggested that young people

Sheau Tsuey Chong, Karen Farquharson, Er Ah Choy, Z. M. Lukman and Mostafa Kamal Mokhtar
64 Pertanika J. Soc. Sci. & Hum. Vol. 19 (S) 2011
who have made close connections with friends, people outside of their kinship group, were also more likely to trust in generalized others. In addition, those with very high social capital within friendship groups were more likely to be members of organized groups. Organized group membership appeared to have positive effects on society as it seemed to promote generalized social capital and civic engagement.
The results of this analysis suggested that promoting the dense friendship networks of young people could benefit society by fostering participation in voluntary activities and generalized social capital. Future research should further investigate the quality of the friendship networks and other potential effects of friendship social capital.
REFERENCESChong, S. T. (2007). It takes a village to raise a child:
building social capital in safe and cohesive neighbourhood. e-BANGI - Journal of Social Sciences and Humanities, 2(2), 12.
Chong, S. T., Mohamad, M. S., Hoesni, S. M., Lukman, Z. M., Fauziah, I., Sarnon, N., Nen, S., Subhi, N., Kamaruzaman Jusoff, Alavi, K., & Aeslina Abdul Kadir. (2011). Generalized trust and organized group membership among young Australians. World Applied Sciences Journal, 12(Special Issue), 58-62.
Coleman, J. S. (1988). Social capital in the creation of human capital. American Journal of Sociology, 94(Supplement 1988), 95-120.
Davern, M., & Hachen, D. S. Jr. (2006). The role of information and influence in social networks. American Journal of Economic and Sociology, 65(2), 269-293.
De Graaf, N. D., & Flap, H. (1988). With a little help from my friends: Social resources as an explanation of occupational status and income in West Germany, the Netherlands, and the United States. Social Forces, 67(2), 452-472.
Flap, H. D., & De Graaf, N. D. (1986). Social capital and attained occupational status. Netherlands Journal of Sociology, 22(2), 145-161.
Fukuyama, F. (1995). Trust: The social virtues and the creation of prosperity. New York: Free Press.
Granovetter, M. (1973). The strength of weak ties. American Journal of Sociology, 78(6), 1360-1380.
Green, M. C., & Brock, T. C. (1998). Trust, mood, and outcomes of friendship determine preferences for real versus ersatz social capital. Political Psychology, 19(3), 527-544.
Leonard, R., & Onyx, J. A. (2004). Social capital and community building: Spinning straw into gold. London: Janus Publishing Company.
Montgomery, J. D. (1992). Job search and network composition: Implications of the strength of weak ties hypothesis. American Sociological Review, 57(5), 586-596.
Passey, A., & Lyons, M. (2005). Voluntary associations and political participation. In S. Wilson, G. Meagher, R. Gibson, D. Denemark, & M. Western (Eds.), Australian social attitudes: The first report (pp. 62-81). Sydney: UNSW Press.
Putnam, R. D. (1993). The prosperous community: Social capital and public life. American Prospect, 13(Spring 1993), 35-42.
Putnam, R. D. (2000). Bowling alone: The collapse and revival of American community. New York: Simon & Schuster.
Stolle, D. (1998). Bowling together, bowling alone: The development of generalized trust in voluntary associations. Political Psychology, 19(3), 497-525.
Stone, W., & Hughes, J. (2002). Social capital: Empirical meaning and measurement validity. Research Paper 27. Melbourne: Australian Institute of Family Studies.
Stone, W., Gray, M., & Hughes, J. (2003). Social capital at work: How family, friends and civic ties relate to labor market outcomes. Research Paper 31. Melbourne: Australian Institute of Family Studies.

ISSN: 0128-7702Pertanika J. Soc. Sci. & Hum. 19 (S): 65 - 73 (2011) © Universiti Putra Malaysia Press
Received: 3 May 2011Accepted: 28 July 2011*Corresponding Author
INTRODUCTIONStudies on care for elderly in the developed countries were very encouraging throughout the decade. However, the issues regarding the care of elderly in developing countries are still lacking and have not been given much attention (Jameelah et al., 2003). In Malaysia, the issue of caring and providing services for elderly has been taken into serious consideration in the Eighth Malaysian Plan (2001-2005). The medical advancement and economic development had improved the life expectancy of the elderly population in Malaysia since the
last three decades. The population distribution in Malaysia, based on age, in year 2000 showed that 6.1% or 1.418 million people were 60 years and above, and is expected to increase further to 9.5% in the year 2020 (Department of Statistic, 2001). The increase in aging demography initiates challenges and tribulations to the emotions, social, health, politics, and economies that will have to be faced by the family, society, and the nation.
Various research findings showed that care provided by family members was becoming a less preferred option for the increasing number of senior citizen population (Chan, 1995;
Living Arrangement Preference and Family Relationship Expectation of Elderly Parents
K. Alavi1*, Rahim M. Sail2, Khairuddin Idris 2, Asnarulkhadi Abu Samah3 and M. Omar1
1School of Psychology and Human Development, Faculty of Social Sciences and Humanities, Universiti Kebangsaan Malaysia, 43600 UKM, Bangi, Selangor, Malaysia
2Department of Professional Development and Continuing Education, Faculty of Educational Studies,
3Department of Social and Development Sciences, Faculty of Human Ecology, Universiti Putra Malaysia, 43400 UPM, Serdang, Selangor, Malaysia
*E-mail: [email protected]
ABSTRACTFamily support is essential for sustainability of elderly living arrangement. The main purpose of this study is to identify the living arrangement preference and family relationships expectation of elderly parents. An approach guided by grounded theory was chosen. Selected 15 elderly participants of Malay, Chinese, and Indian ethnic, aged 60 and above were interviewed. The findings showed that most elderly parents preferred living with their children or family members than living alone. They also expected material assistance and social support from their adult children, relatives, neighbours, and friends. Elderly men turned to their spouses for assistance where as widowers expected their sons to take care of their well-being. Almost all elderly parents expected their children to care for them, due to the affectionate and obligatory ties between elderly parents, their children and in-laws. The implication of this study is that family support and care in enhancing the well-being of elderly parents is very important.
Keywords: Living arrangement, family relationships, social support, sustainability, elderly parents

K. Alavi, Rahim M. Sail, Khairuddin Idris, Asnarulkhadi Abu Samah and M. Omar
66 Pertanika J. Soc. Sci. & Hum. Vol. 19 (S) 2011
Mazanah and Mazalan, 1999; Asnarulkhadi, 2001; Sim, 2002; Tengku Aizan, 2001). This phenomenon is the result of various changes that affected the family. Among the factors are (i) decline in birth rate which results in fewer children in the family sharing the responsibility of caring for their parents; (ii) increase in women participation in the workforce which consequently resulted to either their parents being left alone in the house or left to be looked after by their grandchildren; (iii) the increased divorce rate that have weaken the relationship with the children and other relatives; and (iv) the consequent of geographical relocation due to employment and economic needs that further detach elderly parents from their children and relatives. The trend of having a nucleus family unit in urban areas has also resulted in weakening relationship with other relatives. In this type of family structure, the parents-children relationship is deemed more important rather than with other relatives. Therefore, most families in the urban areas seem to have very minimal emotional attachment or lack of strong sentiments towards their relatives. This has made the elderly parents more vulnerable and totally dependent upon their children for care.
Chan and DaVanzo (1996) and DaVanzo and Chan (1994) stated that two-thirds of Malaysians aged 60 and above stay with their adult children. The Department of Statistics (1998) reported that 59% of the elderly stayed with their children. Chen’s (2002) finding showed that the percentage of the elderly staying with their children had increased to 72%. Alavi et al. (2011) found that most adult children (92.8%) in the rural areas chose to stay with their parents or parents-in-law. On the other hand, only 43.1% of the urban respondents live with their parents and 36.6% live nearby their parent’s home. Although quite a number of adults are staying with their parents, the recent trend is for them to stay nearby, especially in urban areas. In spite of statistical differences from the research above, the data show the majority of elders in Malaysia prefer to stay with their children.
Modernization and urbanization in Malaysia are two factors that influence the changes in the traditional family system. The geographical distance and changing family structure seem to hinder the potential and ability of family members to provide constant care for the elderly. Therefore, it is important for the elderly to stay near care providers although not necessarily staying with them. This will enable them to get continuous financial assistance, emotional support, information, and personal assistance in time of crisis (Seeman et al., 1988). However, in Malaysia the adult children are very much closer, physically and emotionally to their parents. They do communicate with their parents regularly through phone calls, letter writing, and emails, or even visiting them regularly (Roziah, 2000). This shows that family members, especially adult children, remain the main support for the elderly (Hasmah, 2001). According to Tengku Aizan et al. (2000), majority of the elderly Malays and Indians have support from their children, whereas the elderly Chinese get support from their partners. In fact, in some Chinese community, the elderly parents are rarely cared by their daughters and son-in-laws. The Chinese believe that those who do not care for their elderly parents will be cursed by their ancestors (Sokolovsky, 2001). Other than financial assistance, elderly parents living alone or living with adult children often attain assistance in the form of food preparation, purchase of daily necessities, housekeeping, doing laundry and transportation to visit relatives/hospital/clinic (Chor and DaVanzo, 1999).
In addition to members of the family as the primary care takers for the elderly at home, relatives and neighbours are seen as secondary caregivers. The selection of primary caregivers depends upon the family connection, gender and residence location of the family members (Merrill, 1997; Cantor, 1979). In most cases, husband or wife will be the main caretaker of a spouse. In the absence of a spouse, either the daughter or son will play a key role in providing care for the elderly. For the elderly who have no children, their immediate family members

Living Arrangement Preference and Family Relationship Expectation of Elderly Parents
67Pertanika J. Soc. Sci. & Hum. Vol. 19 (S) 2011
will take the role and responsibility in caring for them. On top of that, they get information on programs and services provided in the community from neighbours or friends (Alavi, 2008).
Rapid economic development is one of the key factors causing changes in behaviour, attitude and lifestyle of the adult children in caring for elderly parents. The relationship between adult children, parents and grandparents is increasingly weakening due to the generation gap, leading to conflict and tension in the family which may bring unhealthy consequences to the elderly and their children (Clarke et al., 1999). The option of caring for the elderly by family members or government or private institutions has been a heated discussion in Malaysia. In managing the demands of modern life, family members find it hard to impart basic responsibilities and social behaviour to their elderly parents. The main purpose of the present study is therefore to identify the living arrangement preference and family relationships expectation of elderly parents in sub-urban communities.
METHODSThis research used an in-depth interviews and grounded theory approach. This approach and method depicted the background of research subjects, mostly the elderly who were willing to share their experiences on living arrangement preference and family relationship expectation. The subjects were chosen based on the criteria that were set to acquire extensive information.
The respondents selected were 15 elderly Malays, Chinese, and Indians living in urban Selangor and rural Pahang areas of Peninsular Malaysia. An in-depth interview in qualitative nature is conducted in an open and unstructured manner. The main question asked during the interviews was the following: “What are the living arrangement preference and family relationship expectation of the elderly during the last stage of their lives in the modern and challenging situation?” Additional questions discussed were on why do they prefer to stay
with family and have they thought about living in care institutions. In the subsequent interviews the researcher had selected passages from the written report (transcribed) to develop a theme.
RESULTS AND DISCUSSIONTheir ages range from 60 to 87 years, a good mix of early, mid, and late old age. In terms of gender, there were four male and eleven female respondents. Most of the Malay and Indian respondents were from rural areas, whereas all the Chinese respondents were from the city. With regards to their education level, only one respondent holds a diploma and another two have secondary education. As for the rest, ten respondents have primary education, and the other two have no education.
Most of the elderly men and women from the rural areas work as child minders, rubber tapper, oil palm fruit collector, and social worker. In comparison, a few of the elderly in the city work as security guards, while others as pensioners (ex-customs officer), housewives or unemployed. The researchers noted that age is not a setback among the elders to work and earn a living because most of their adult children cannot support them financially due to high commitment in paying their home loan, children’s education and others.
The respondents described their living arrangement preferences and family relationship expectation as closely related to their family belief, experiences and future expectation about their life. Almost all respondents indicated that living with family was more secure and merrier than living in care institution for the elderly. But a more interesting fact was that, they preferred their children staying with them rather than staying with their children. The respondents were also concerned about their future living arrangement when they were no longer healthy and able to move around. They preferred to live with their children when they were unable to live independently, and expected their children would care for them. According to a Malay woman, although living with children was much safer, this was not so with all her children.
K. Alavi, Rahim M. Sail, Khairuddin Idris, Asnarulkhadi Abu Samah and M. Omar
68 Pertanika J. Soc. Sci. & Hum. Vol. 19 (S) 2011
Though some of my children invite me to stay at their houses, I don’t feel comfortable to stay in yet. I may visit them but not stay in.
The majority of the female respondents preferred to live in their own houses or houses built by their late husbands. Sivam and Karuppannan (2008) having similar findings cited that the majority of elderly people in their study preferred living in their family homes because they did not like to move or were unable to move due to a number of constraints such as financial problems, lack of public transport, and inaccessible to services within walking distance. However, the more important issue was the sentimental attachment they have to their present home and the social network they have previously established with their present neighbourhood.
Two Malay elderly respondents said that they chose to live with their children because they expected their children to care for them when they were ill or unable to live independently. This view was shared by another Indian respondent, who was confident that her children would take care of her when she was in poor health. Another Indian respondent who was living alone did not mind living with her children. But she preferred to live alone because this honoured her independence and the freedom to move around. The third Indian respondent preferred to live with her son because she gave importance to family ties and attachment. For her, strong family ties obliged children to take care of parents willingly, especially when they were in poor health. The following quotation illustrates two elderly Indian’s views about the importance of family relationships:
I prefer to stay with my son now. I did not order him to take care of me, but he chooses to take care of me at my old age…
I like to stay with my child because I’m taken care with full of love. I did not impose to this child but he decided to take care of me willingly.
Malay and Indian respondents’ views were not much different to the Chinese respondents’ views on the preference of living arrangement and family relationships. However, the Chinese respondents preferred their sons and daughter-in-laws to take care of them when they was ill and immobile. These views was quite different from the Malay and Indian respondents, who were indifferent whether the caregivers were their sons or daughters, and were not concerned about which child would take care of them. The following quotation illustrates the subject of family relationships in the Chinese culture:
Must be with the children because the children have grown up and they should take care. I don’t mind, who takes care of me, for me they are all the same. But it would be difficult for my daughter to take care of me, because she has her husband and family to take care … Now I’m living with my unmarried daughter, who is working near here, so she is looking after me now.”
Almost all respondents expected their children to take care of them when they were sick or immobile. The Chinese respondents further suggested that for other children, they should give emotional support and shared the responsibility of taking care of their elderly parents, rather than leaving the burden of caring to one child only. In Alavi’s (2011) study, elderly Chinese expected their children to give them emotional support such as talking to them, listening to their grievances and problems, and advising them in religious and spiritual matter. The Chinese respondent also suggested one should not be too fussy when living with children and should tolerate with their busy lifestyle. She described her view as follows:
Any child will do ... I do not mind, as long as there is someone to take care of me. I’m already old and cannot be choosy, take as it is. Eat and drink what they serve us. If possible other children should visit, but I know they are busy with their work and do not live nearby.

Living Arrangement Preference and Family Relationship Expectation of Elderly Parents
69Pertanika J. Soc. Sci. & Hum. Vol. 19 (S) 2011
Although most Chinese respondents expected their sons to take care of them, but in reality this did not turn out to be so. Several respondents have given their views as the following:
If possible, I would like to live with my son and not with daughters or any institution caring for the elderly. I have to live with my daughter, though not my choice, as the others did not offer me to stay with them.
I would like to live with my sons and not with daughters or any institution caring for the elderly. I chose to stay with my daughter as I feel uncomfortable staying with my other children.
The second theme of this paper was assessing the respondents’ perceptions regarding the care from family members, community, and care institutions. The respondents, regardless of their ethnic group were contented to be cared by family and community rather than having institutional care. According to a Malay respondent, if their relationship with their children was good, there was no need for them to live in a nursing homes, except if their children could not afford care, or if they could not get along well with their in laws. The following are some of the excerpts documented during the in-depth interviews with several Malay respondents:
Our children are there for us ... and they can afford to take care of us. Unless they are unable to take care… or dislike … we’ll end up at nursing homes. I prefer to stay with my children as they treat me well. They is good and do well always and remember me in whatever he does. Not all children are like that. They give me money, medicines, and wherever they go, the buy gifts for me.
If possible, I would like to live with my children. I don’t wish to stay in such places. If there are many friends or religious classes, I don’t mind staying. However, I haven’t heard anyone being sent to old folks home.
Another Malay respondent said that he could not imagine himself living in a nursing home. However, he was rather open to the possibility of staying away from family. He may choose living in the “Pondok” – an Islamic care centre where he can pursue learning the Quran. He commented that:
I cannot imagine ... If I select, it will be the “pondok”, can learn to recite the Quran ... None here at the moment ... if there is I might consider. I have not thought about getting into the old folks home.
Another respondent stated that it was better for the elderly to live at home with their children. This was because the children know their likes and dislikes, and would shower him/her with endless warmth and love till the end of their lives. According to him, no one knew the well-being of those who lived in nursing homes. Children who sent their parents to nursing homes were considered disrespectful. In this regard, he said the following:
Definitely different ... if stay with children they know our needs and we know their needs. There will be affection… In old folks home there is no affection ... no one knows whether we are dead or alive… I do not want my children to be uncaring.
The Indian respondents’ views were no different from the Malay respondents, where they agreed living with children was better. The respondents stressed that they have taken good care of their children and expected the same

K. Alavi, Rahim M. Sail, Khairuddin Idris, Asnarulkhadi Abu Samah and M. Omar
70 Pertanika J. Soc. Sci. & Hum. Vol. 19 (S) 2011
treatment from their children when they grew older. According to an Indian respondent, the aged would yearn for love and affection from family and community. In his opinion, children were obliged to fulfil the needs of their parents as how their parents have provided for them when they were young. This view has been documented as follows:
I don’t have to live in nursing homes, as my children will look after me very well ... I raise them without discriminating them. I intend to stay with my children.
I do not expect anything ... I also do not expect that children will take care of me ... I love to be independent. Living with children is better than living at the institution. We will lose the love of family ... we will lose touch with the outside community ... we will be alone. In my opinion children should invite their parents to live with ... parents should not ask their children to take care of them. Children should understand the needs of their parents. If the relationship severs then the parents have no choice but to stay in the institution.
Another two Indian rrespondents have similar views on the living arrangement preference and family relationship expectation in elderly life. Both the elderly have never considered living in a nursing home, and hoped to live with their children. One respondent said that he has nine children who were responsible to take care of him when he was ill or incapable. The following excerpt illustrates this idea:
I i n t e n d t o l i v e w i t h a l l m y children. Never thought of living in institutions and do not like to live in such places. But I leave it to God…….
I never thought about those old institutions. I never imagined living in
an institution because I feel my children should be responsible to take care of me in their homes. I make sure my children will know their responsibilities from young. The best care for older people comes from their children. Parents need care and attention like a baby. The older they are the more sensitive they become….
Another Indian respondent agreed that the care from family was better than institutional care. In his view the family relationship was unique and precious, which has to be nurtured from young. He pointed out that, those living in care institutions have to interact with the same cohort, whereas living with family and community; they can spend time with a different group of people. He also suggested that living in institutions would make one feel lonely and sad for not being able to be in control of their own affairs.
Good care comes from family, where elders are appreciated. Family relationship is unique and valuable. If I had to stay in institutional care, I would feel sad for not being able to do the stuff I would do at home. I will just mingle with other elders. At home, I have children and grandchildren who bring cheer to my heart.
Chinese respondents’ views were not much different from the Malay and Indian respondents about the care of the elderly by family or institutions. All Chinese respondents indicated that they expected to stay with their children and grandchildren and helped them around the house. They have raised their children with great struggle, so it was impossible for their children to send them to the nursing homes. Nursing homes may be the option for the elderly who were very sick and bed ridden. The statement below explains the following idea:

Living Arrangement Preference and Family Relationship Expectation of Elderly Parents
71Pertanika J. Soc. Sci. & Hum. Vol. 19 (S) 2011
Yaa ... if we stay together we can look after each other. If in institution, no one knows we are alive or dead. Chinese prefer to die at his or her own home. I wish to die at my home. There are too many people to look after at the nursing home. I’m still strong to help around with chores in the house. They (children) know what I like or dislikes … I don’t like old folk home as it is usually dirty.
Sure to live with the children ... but hard to say. Well if we are healthy, that’s fine ... If sick and bed ridden nursing home is the place ... I do not wish to make life difficult for my children. … I’ve never been to nursing home, so not sure how it looks like. I wish not to be there. I’ve raised my kids and I don’t think they will abandon me there. … I wish to stay here for the rest of my life….ample space for my children and grandchildren to visit me.
Research findings of Lee (1997) and Farrar et al. (1964) indicated that moving into nursing home yields a sense of failure to the elderly parents and results in lack of respect for their children (Lee, 1997). Transition to nursing home and its environment has been widely accepted as a challenging event in the life for the elderly. As a result the elderly may be blanketed with the feeling of fear and anxiety (Farrar et al., 1964). Rebecca et al.’s (1997) study found that participants considered nursing homes as places of last resort, to only be used if they were physically and mentally incapacitated, or alone with no family support. The results are similar to the study by Rebecca et al. (1997) in which the Chinese respondents expressed negative views about life in the nursing home such as poor care, profit oriented, dirty environment, too crowded, reduced contact with family, and community. These negative perceptions quotes are as follows:
I don’t like to stay elsewhere. If I have to go to the nursing home, I will feel sad and lonely.
I feel that these institutions are more profit oriented rather than concern for care. In fact, these institutions are crowded and not everyone is getting enough attention.
The majority of the respondents have negative views about care institutions. It was described as a “dump” where the old folks were incapable of carrying out daily activities and literally waiting for their death. The inmates felt emotionally disabled, lonely, and sad living in such institutions. Several studies have proven that elders view the admission into the nursing homes with feelings of disregard, pressure, uncertainty, loss of their comfortable home environment, and lack of opportunity to communicate with family and friends (Chenitz, 1983; Brooke, 1989; Greene and Dunkle, 1992; Mikhail, 1992). The respondents rejected the placement of elderly in the care institutions due to cultural and religious constraints. On the other hand, not every child or adult can afford to give the care and protection to their parents. In addition some elderly preferred to live independently and did not want to rely on their children. The research found that there was a gap between the needs of the elderly and the ability of their children to fulfil the needs. The gap identified was the quality and management of care provided to the elderly, which can be improved through understanding the concept of aging in community.
CONCLUSIONAlmost all the respondents refused to stay at nursing homes caring for the elderly, regardless of ethnicity. Malay and Indian respondents’ believed that since they have taken care of their children when they were small, it was time for the children to reciprocate when the parents were old and disable. They hoped at least to stay near

K. Alavi, Rahim M. Sail, Khairuddin Idris, Asnarulkhadi Abu Samah and M. Omar
72 Pertanika J. Soc. Sci. & Hum. Vol. 19 (S) 2011
their children. This was to provide personal, emotional and physical support, especially in times of crisis. Family institutions are main sources in providing care for the elderly in the community, especially in terms of shelter, safety, provisions, healthcare, financial, and emotional support. Family’s support and care are also important factors in enhancing the well-being of parents compared to the formal care provided in hospitals, nursing homes and so forth. The researchers would like to recommend the care system based on the concept of aging in community, which emphasizes collaboration between the child and adult, community and government. The focus of aging in community is to develop an infrastructure to facilitate the sharing of strengths among generations and promote self-determination, community participation, and lifelong personal enrichment. Managing care for elderly in the community can also encourage social interaction, intergenerational relationships, and better diet monitoring for the elderly. Thus aging in community is a better option to formal care given by institutions and hospitals to the elderly.
ACKNOWLEDGEMENTThe researcher is greatly indebted to the Ministry of Science, Technology and Innovation (MOSTI) for the financial support to this research project.
REFERENCESAlavi, K. (2008). The experience of caring for elderly
parents among low-income Malay adult children in Kuala Lumpur. PhD. Thesis, University Putra Malaysia, Serdang.
Alavi, K., Rahim M. Sail, Khairuddin Idris, Asnarulkhadi Abu Samah, & Christine Chan. (2011). Emotional support needs in caring for the elderly parents by the adult children. e-BANGI Journal of Social Sciences and Humanities, 6(1), 102- 114.
Asnarulkhadi Abu Samah. (2001). Community approach to elderly: Putting into practice. 9th Annual General Meeting of Persatuan Gerontology Malaysia . Universiti Putra Malaysia, Serdang.
Brooke, V. (1989). How elders adjust: Through what phases do newly admitted residents pass? Geriatric Nursing, 10(2), 66–68.
Cantor, M. (1979). Neighbors and friends: An overlooked resource in the informal support system. Research on Aging, 1(4), 434-463.
Chan K. E. (1995). Demographic and socio-economic linkages in Malaysia: The case of demographic ageing. The First Symposium on Gerontology 1995 Proceeding: Issues and Challenges of Ageing Multidisciplinary Perspectives. Kuala Lumpur: Gerontology Association of Malaysia.
Chan, A., & DaVanzo, J. (1996). Ethnic differences in parents, co-residence with adult children in Peninsular Malaysia. Journal of Cross-Cultural Gerontology, 11(1), 29-59.
Chen, P. C. Y. (2002). The elderly Malaysian. Malaysian Medical Association. Retrieved from http://www.mma.org.my/info/4_elderly_84.htm.
Chenitz, W. C. (1983). Entry into a nursing home as status passage: A theory to guide nursing practice. Geriatric Nursing, 4(2), 92–97.
Chor Swang Ngin, & DaVanzo, J. (1999). Parent-child co-residence and quasi co-residence in Peninsular Malaysia. Southeast Asian Journal of Social Science, 27(2), 43-64.
Clarke, E. J., Preston, M., Raksin, J., & Bengston, V. L. (1999). Types of conflicts and tensions between older parents and adult children. Gerontologist, 39(3), 261-270.
DaVanzo, J., & Chan, A. (1994). Living arrangement of older Malaysians who co-reside with their adult children? Demography, 3(1), 95–114.
Department of Statistic. (2001). Population and housing survey 2000. Kuala Lumpur.
Department of Statistics. (1998). Senior citizens and population ageing in Malaysia. Population Census Monograph Series no. 4. Kuala Lumpur: National Printing Department.

Living Arrangement Preference and Family Relationship Expectation of Elderly Parents
73Pertanika J. Soc. Sci. & Hum. Vol. 19 (S) 2011
Farrar, M., Ryder, M. B., & Blenkner, M. (1964). Social work responsibility in nursing home care. Social Casework, 45, 527-533.
Greene, R. W., & Dunkle, R. E. (1992). Is the elderly patient’s denial of long term care adversive to later adjustment to placement? Physical and Occupational Therapy in Geriatrics, 10(4), 59–75.
Hasmah, M. A. (2001). Women and ageing in Malaysia: Meeting the challenges of the 21st century, keynote address. National Seminar on Women and Ageing. Nikko Hotel, Kuala Lumpur, Malaysia.
Jameelah Zainuddin, Arokiasamy, J. T., & Philip, P. (2003). Caregiving burden is associated with short rather than long duration of care for older persons. Asia-Pacific Journal of Public Health, 15(2), 88-93.
Lee, D. T. F. (1997). Residential care placement: Perceptions among Chinese people in Hong Kong. Journal of Advanced Nursing, 26(3), 602-607.
Mazanah, M., & Mazalan, K. (1999). Learning for older people in Malaysia. Paper presented at the Asian South Pacific Bureau of Adult Education’s Older People Learning (OPAL) Working Group Meeting, 5-9 November, 1999. Singapore.
Merrill, D. (1997). Caring for elderly parents: Juggling work, family, and care giving in middle and working class families. Westport, CT: Auburn House.
Mikhail, M. L. (1992). Psychological responses to relocation to a nursing home. Journal of Gerontological Nursing, 18(3), 35-39.
Rebecca, J., Schweibeat, V. L., Alvarado Rosenmann, P., Pekka, G., & Shiek, N. (1997). Residential preferences and eldercare views of Hispanic elders. Journal of Cross-Cultural Gementology, 12, 91-107.
Roziah Omar. (2000). Health and lifestyles: Current issues in community health. Kuala Lumpur: SNN Sdn. Bhd.
Seeman, T. E., Berkman, L. F., & Lisa, F. (1988). Structural characteristics of social networks and their relationship with social Support in the elderly: Who provides support? Journal of Social Science and Medicine, 26(7), 737-750.
Sim, O. F. (2002). Ageing in Malaysia: A review of national policies and programmes in ageing and long term care. In National Policies in the Asia Pacific. Singapore: ISEAS Library.
Sivam, A., & Karuppannan, S. (2008). Factors influencing old age persons residential satisfaction: A case study of South Australia. In T. Majoribanks, J. Barraket, J. S. Chang et al. (Eds.), paper presented at the Reimagining Sociology Conference, 2-5 December, The Australian Sociological Association (TASA), Melbourne.
Sokolovsky, J., (2001). The cultural context of aging: World perspectives. New York: Bergind Garvey.
Tengku Aizan Hamid. (2001). Family care versus institutional care. Jurnal Kebajikan Masyarakat, 23(2), 24-30.
Tengku Aizan, Asnarulkhadi, dan Masilawati (2000). Study on older person perceptions, problems and needs in Johor (Kajian perspesi masalah dan keperluan warga tua Johor) Universiti Putra Malaysia dan Yayasan Pembangunan Kerajaan Johor.


ISSN: 0128-7702Pertanika J. Soc. Sci. & Hum. 19 (S): 75 - 82 (2011) © Universiti Putra Malaysia Press
Received: 3 May 2011Accepted: 28 July 2011*Corresponding Author
INTRODUCTIONIn recent years adolescents’ involvement in anti-social and criminal behaviors had been the focus of discussions in the local as well as international media. In Malaysia, the topics that usually attract a lot of attention and became the main public concern ranged from violent crimes such as rapes and murders, non-violent crimes such as thefts, and traffic offences such as illegal motor cycle race committed by adolescents.
Throughout their early years adolescents experienced many life events that influenced their individual thoughts, feelings, and behaviors. All of those had significant impacts on them in a negative, positive or a combination of both ways. Delinquent and anti-social behaviors are presumably the results of negative impacts of
all sorts of experience that the adolescents had gone through.
Compared to non-delinquents, delinquents showed higher problematic behavior and cognitive distortions (Barriga et al., 2000). Nas et al.’s (2008) study which compared 311 delinquents and 142 non-delinquents found delinquents exhibited more cognitive distortions than non-delinquents. Various researchers had proposed that cognitive distortions are major factors in the understanding, prediction and treatment of antisocial behavior (Liau et al., 1998). Pervan and Hunter (2007) found an association between cognitive distortions with sexual offending behavior. Barriga et al. (2000) defined cognitive distortion as inaccurate ways of attending to or conferring meaning
Cognitive Distortion as a Predictor towards Depression among Delinquent Adolescents
R. Nasir*, A. Z. Zainah, R. Khairudin, W. S. Wan Shahrazad, S. Nen and N. SubhiSchool of Psychology and Human Development, Faculty of Social Sciences and Humanities,
Universiti Kebangsaan Malaysia, 43600 UKM, Bangi, Selangor, Malaysia*E-mail: [email protected]
ABSTRACTCognitive distortion as a reliable predictor to juvenile adolescents’ depression is still debatable. Thus, it is the purpose of this study to examine the relationships of the five domains of cognitive distortion: self-critique, self-blame, helplessness, hopelessness, and preoccupation with danger with depression and to ascertain the predictive relationship between the five domains of cognitive distortion with depression. Participants were 30 male delinquent adolescents who participated in a youth development program. A set of questionnaires comprising of demographic background questions, Cognitive Distortion Scale (CDS) and Reynolds Adolescent Depression Scale (RADS) measures the participants’ background, cognitive distortion and depression, respectively. Results from the correlations and multiple regressions indicate positive relationships between all the domains of cognitive distortion and depression. Among the domains, helplessness and preoccupation with danger are significant predictors of depression. Implications to counseling are discussed with emphasis on Cognitive Behavior Therapy (CBT) and family counseling.
Keywords: Cognitive distortion, depression, delinquent, adolescents
R. Nasir, A. Z. Zainah, R. Khairudin, W. S. Wan Shahrazad, S. Nen and N. Subhi
76 Pertanika J. Soc. Sci. & Hum. Vol. 19 (S) 2011
on experiences. According to Ellis (1977) and Liau et al. (1998) cognitive distortions are rationalizing attitudes, thoughts or beliefs concerning one’s own or others’ social behavior. Beck (1976) introduced the concept of cognitive distortion in his cognitive theory of depression which suggests a relationship between cognitive distortion and depression. An individual with cognitive distortion perceives things, people and experiences in a distorted manner. As such, a juvenile delinquent whose cognitions are distorted may defend his delinquent or anti-social behavior as acceptable and rational. Juvenile delinquents find it acceptable to use cognitive distortions and frequently used them (Barriga et al., 2001; Barriga et al., 2009; Kubik and Hecker, 2005; Barriga et al., 2008). Various researchers have proposed cognitive distortions as major factors in the understanding, predicting, and treating antisocial behavior (Liau et al., 1998). Krotenberg (2003) found relationships between cognitive distortions, self-esteem, and depression. Correlation between cognitive distortions and depression was also found by Nasir et al. (2010) in their study on 316 Malaysian juvenile delinquents.
High rates of depression among adolescents had been reported during the last fifteen years (Marcotte et al., 2006). However, it is difficult to make a precise assessment of the prevalence of depressive symptoms in the adolescent population (Marcotte et al., 2006). Depression among adolescents is indeed serious and according to Hamack et al. (2004) and Repetto et al. (2004) depression is related to suicide, other medical and psychological co-morbidities and a recurrent depression in adulthood. Major depressive disorder is more common in adolescents than asthma and most other chronic medical problems (Jackson and Lurie, 2006). It was estimated that the rate of serious depression among American youth had increased from approximately 2% in the 1960s to almost 25.5% in the 1990s (Johnson, 2010). In Taiwan the prevalence of depression among adolescents is high and the multiple factors of family, peer,
school and individuals are associated with depression (Lin et al., 2008). In Singapore the prevalence of depression was found to be 8.6% in adult and 5.7% in the elderly (Ministry of Health, Singapore, 2004). A relatively large proportion of young people tend to be depressed in Hong Kong too (Chou, 2000).
Wiesner and Kim (2006) and Hunt (2008) suggested that depressive symptoms and delinquent behavior among adolescents are common. Major depression is more common among juvenile offenders especially girls than in the general adolescent population (Ryan and Redding, 2004). Marton et al. (1993) found that depressed adolescents had significantly greater cognitive distortion than non-depressed adolescents. In a clinical study conducted by Ginsburg et al. (2009) on 390 adolescents, girls endorsed more negative cognition on three out of four factors. Further, their study showed that maladaptive cognitions were positively related to severity of depression.
Beck’s (1967; 1976) cognitive theory of depression suggests that negative perception of self of depressed children reflect their cognitive distortions of the self. Beck (1967) believed that cognitive distortion places an individual at a risk for depression. Further, negative cognitive errors make a person vulnerable to depression. A relationship between cognitive distortion and depression was found in various researches (Croker, 1991; Marton et al., 1993; Schroeder, 1994; Maxwell et al., 1997). There was also an evidence of a link between cognitive distortion and depression in a Chinese sample in a Hong Kong study (Wong, 2008).
Depression and delinquency are major public health problems which could be costly and a burden to society. They affect multiple groups (Scott et al., 2001; Lynch and Clark, 2006). Depression has been linked to increase mortality, poorer health status, pain, decreased functional and cognitive abilities and anxiety (Chuan et al., 2008; Anstey et al., 2007). Depression was also identified as the best single factor of suicide ideation (Zhang, 1996).
Cognitive Distortion as a Predictor towards Depression among Delinquent Adolescents
77Pertanika J. Soc. Sci. & Hum. Vol. 19 (S) 2011
On one hand, depressed adolescents are at greater risk of developing further episodes of depression later in life (Harrington et al., 1990). On the other, adolescents’ continued criminality jeopardizes stable employment, career and living options as adults, strains the resources of our legal and justice systems, burdens victims and their families, and increases costs for medical and social services (Unruh et al., 2009). Since depression is related to cognitive distortion among juvenile delinquents and adolescents in general, the problems need to be addressed. The purpose of this study is to examine the relationships of the five domains of cognitive distortions: self-critique, self-blame, helplessness, hopelessness, and pre-occupation with danger with depression among a group of delinquent adolescents. It will also ascertain the predictive relationship between the five domains of cognitive distortion with depression.
METHODSThe method of sampling was purposive. Participants for this study were 30 youths who had committed several traffic offences and other offences who volunteered to participate in a youth development camp. They were all males, the youngest was one 16 years old and the eldest were two 20 years old. They were all from Malay ethnic background. The data on the subjects is normal and homogenous based on Levene’s test of normality and homogeneity.
The set of questionnaires were given to the participants when they first arrived at the camp that is, before the development program began. Written consents from them were obtained. A set of questionnaires comprising of the demographic questions, Cognitive Distortion Scale (CDS) and Reynolds Adolescent Depression Scale (RADS) was used to collect the data for this study.
Demographic Questions were used to obtain background information of the participants, which include age, gender, academic background,
ethnicity, family income, and place of residence. Cognitive Distortion Scale (CDS) (Briere, 2000) assesses five dimensions of cognitive distortions: self-criticism (SC), self-blame (SB), helplessness (HLP), hopelessness (HOP), and preoccupation with danger (PWD). This scale contains 40 items and each dimension contains eight items. Each item is rated on a 5-point Likert scale, from 1 (never) to 5 (very often). The total score for the CDS is between 40 and 200 and for each dimension the total score is between 8 and 40. High scores indicate high cognitive distortion. The reliability of CDS for the Malay version was α =.97. The Reynolds Adolescent Depression Scale (RADS) (Reynolds and Mazza, 1998) was developed to evaluate the severity of depressive symptoms in adolescents. The RADS consists 30 items with 4-point Likert scale. Responses were evaluated on a 4-point scale ranging from 1 (never) to 4 (always). Possible total scores ranged from 30 to 120. Scores from 30 to 60 indicate that someone was in mid depression, scores from 61 to 90 represent moderate depression, and scores from 91 to 120 indicate severe depression. The reliability of RADS for the Malay version was α = .90. All instruments were translated into Malay language using Brislin et al. (1973) back translation technique.
RESULTS AND DISCUSSIONTable 1 presents the demographic characteristics of this study. The subjects consisted of 30 male delinquent adolescents who participated in a youth development program. Majority of the participants were from rural areas (83%) with the age group of 18 to 20 years old (93%). Most of the participants were at the lowest socioeconomic status as indicated by the parents’ monthly income of less than RM1500 per month (86%). In terms of educational level, 73% of the participants were from junior high and high school.

R. Nasir, A. Z. Zainah, R. Khairudin, W. S. Wan Shahrazad, S. Nen and N. Subhi
78 Pertanika J. Soc. Sci. & Hum. Vol. 19 (S) 2011
TABLE 1 Demographic characteristics
Variables Frequency %Age in years17 & below18-20
228
6.793.3
Parents’ incomeRM1000 & belowRM1001-RM1500RM1501 & above
16104
53.333.313.3
Location of residence UrbanRural
525
16.783.3
Educational levelNever been to schoolPrimary educationJunior high (Form 3)High school (Form 5)College Unknown
1161642
3.333.332053.3313.336.66
Total 30 100
Results of this study in Table 2 showed that the greater the cognitive distortion the more depressed the juvenile delinquents were and likewise the more depressed the juvenile delinquents the greater the distortion. It was also found that when one dimension of the cognitive distortion was high the overall cognitive distortion and the other four dimensions were also high. Likewise when the overall cognitive distortion increased all the four dimensions also increased. The findings of this study support previous studies by Marton et al. (1993), Maxwell et al. (1997), Croker (1991), Schroeder (1994), Krotenberg (2003), Wong (2008), and Nasir et al. (2010).
The regression model showed that helplessness and preoccupation with danger predicted significantly depression with 34% variance, R2 = .34, F(5,268)=27.28, p<001. The linear equation that can be formulated is:
Y=51.44+.634(helplessness) +.854(preoccupation with danger)
Helplessness was a significant predictor with Beta=.304, t=2.79, p<.01. Similarly, preoccupation with danger also was a significant predictor with Beta=.399, t=4.21, p<.001. The results are shown in Table 3.
Further results showed that helplessness and preoccupation with danger dimensions of cognitive distortion were predictors of depression. Other domains, namely self-critique, self-blame and hopelessness did not reach significance as predictors of depression.
Adolescents’ depression is a complex and pressing mental health problem. Since cognitive distortion is a significant predictor of depression, the main focus of counseling should be on reconstructing and changing of cognitions from distortion or maladaptive to normal and adaptive. Counseling using Cognitive Behavior Therapy is suggested which focuses on changing cognitions and building skills such as problem solving and communication. Specifically, cognitive behavior therapy will be able to help rid the irrational thinking patterns and learn strategies to challenge those thoughts and thereby have a positive feedback effect on the depressed juvenile delinquents moods. The literature reviewed by Larner (2009) suggests an integrative treatment approach that includes individual psychological treatment like CBT, medication where required and family therapy. An examination on psychological treatment outcome studies for depressed youth conducted since 1998 discovered the efficacy of CBT in the treatment of childhood and adolescent depression (David-Ferdon and Kaslow, 2008). Based on their study, Konner et al. (2009) suggests a brief group based CBT program for depression.
In eastern countries like Malaysia, families are generally quite traditional in the sense that families are relatively close knitted and parents play important roles in children’s and adolescents’ lives in all ethnic groups. As such, it is suggested that family counseling be included in the intervention programs for the rehabilitation

Cognitive Distortion as a Predictor towards Depression among Delinquent Adolescents
79Pertanika J. Soc. Sci. & Hum. Vol. 19 (S) 2011
of the delinquents. The focus of family therapy is psycho-education and enhancing communication between parents and adolescents to address relationship and communication issues. Feeny et al. (2009) suggested, future work with adolescents should carefully explore patterns of family environment and interaction.
Limitations of the current study should be noted. First the sampling method was purposive and the participants included were those who participated in the developmental camp. Second, the number of participants was small. Having said that, it is not possible to generalize the findings to the population of juvenile delinquents in the country. Future work should consider making a comparative study of juvenile delinquents in the correction and
rehabilitation centers in the country with non-juvenile delinquents.
CONCLUSIONThe results of this study support findings of previous studies which indicated positive correlation between the two variables, cognitive distortion, and depression. Further, helplessness and preoccupation with danger dimensions of cognitive distortion were strong predictors of depression. Depressed adolescents are at greater risk of developing into depressed adults, hence counseling with cognitive behavior therapy approach will help rid the irrational thinking patterns and build strategies to challenge those thoughts for positive feedback effect on the depressed delinquents’ adolescents.
TABLE 2 Correlation matrix between self-critique, self-blame, helplessness, hopelessness, pre-
occupation with danger and depression
1 2 3 4 5 6self-critique (1) 1.00self-blame (2) .779** 1.00helplessness (3) .822** .780** 1.00hopelessness (4) .831** .691** .824** 1.00preoccupation with danger (5)
.791** .731** .783** .757** 1.00
depression (6) .473** .442 .495** .405** .525** 1.00**p<0.001
TABLE 3 Multiple regression analysis between self-critique, self-blame, helplessness,
hopelessness, preoccupation with danger and depression
Model B Std. Error Beta tConstant 51.442 2.530 20.335**self-critique -.003 .223 -.001 -.012self-blame .127 .189 .059 .673helplessness .634 .227 .304 2.790**hopelessness -.315 .194 -.167 -1.622preoccupation with danger .854 .203 .399 4.206**
**p<0.001
R. Nasir, A. Z. Zainah, R. Khairudin, W. S. Wan Shahrazad, S. Nen and N. Subhi
80 Pertanika J. Soc. Sci. & Hum. Vol. 19 (S) 2011
REFERENCESAnstey, K.J., Von Sanden, C., Sargent-Cox, K.,
& Luszez, M.A. (2007). Prevalence and risks factors for depression in a longitudinal population based study including individuals in the community and residential care. American Journal of Geriatric Psychiatry, 13(6), 497-505.
Barriga, A. Q., Landau, J. R., Stinson, B. L. II., Liau, A. K., & Gibbs, J. C. (2000). Cognitive distortion and problem behaviors in adolescents. Criminal Justice and Behavior, 27(1), 36-56.
Barriga, A. Q., Morrison, E. M., Liau, A. K., & Gibbs, J.C. (2001). Moral cognition: Explaining the gender difference in antisocial behavior. Merrill-Palmer Quarterly, 47(4), 532-562.
Barriga, A. Q., Hawkins, M. A., & Camelia, C. R. T. (2008). Specificity of cognitive distortions to antisocial behaviors. Criminal Behavior and Mental Health, 18(2), 104-116.
Barriga, A. Q., Sullivan-Cosseti, M., & Gibbs, J. C. (2009). Moral cognitive correlates of empathy in juvenile delinquents. Criminal Behaviour and Mental Health, 19(4), 253-264.
Beck, A. T. (1967). Depression: Clinical experimental and theoretical aspects. New York: Hoeber.
Beck, A. T. (1976). Cognitive therapy and the emotional disorders. NewYork: Hoeber.
Briere, J. (2000). The cognitive distortion scale professional manual. Odessa, FL: Psychological Assesment Resources.
Brislin, R. W., Lonner, W. J., & Thorndike, R.M. (1973). Cross cultural research methods. New York: John Wiley & Sons.
Chou, K-L. (2000). Emotional autonomy and depression among Chinese adolescents. The Journal of Genetic Psychology, 161(2), 161-168.
Chuan, S. K., Kumar, R., Matthew, N., Heok, K. E., & Pin, N. T. (2008). Subsyndromal in old age: Clinical significance and impact in a multi ethnic community: The sample of elderly Singaporean. International Psychogeriatrics, 20(1), 188-200.
Croker, W. L. (1991). Coping strategies, cognitive distortion and depressive symptomatology in high school adolesecents. (Unpublished doctoral dissertation). University of Toronto, Canada.
David-Ferdon, C., & Kaslow, N. J. (2008). Evidence based psychosocial treatment of children and adolescents depression. Journal of Clinical Child and Adolescent Psychology, 37(1), 62-104.
Ellis, A. (1977). The nature of disturbed marital interactions. In A. Ellis, & R. Greiger (Eds.), Handbook of rational-emotive therapy (pp. 77-92). New York: Springer-Verlag.
Feeny, N. C., Silva, S. G., Reinecke, M. A., McNulty, S., Findling, R. L., Rohde, P., Curry, J. F., Ginsburg, G. S., Kratochvil, J. C., Pathak, S. M., May, D. E., Kennard, B. D., Simons, A. D., Wells, K. C., Robins, M., Rosenberg, D., & March, J. S. (2009). An exploratory analysis of the impact of family functioning on treatment for depression in adolescents. Journal of Clinical Child and Adolescents Psychology, 38(6), 814-825.
Ginsburg, G. S., Silva, S. G., Jacobs, R. H., Tonev, S., Hoyle, R. H., Kingery, J. N., Reinecke, M. A., Curry, J. F., & March, J. S. (2009). Cognitive measures of adolescent depression: Unique or unitary constructs. Journal of Clinical Child and Adolescence Psychology, 38(6), 790-802.
Hamack, P. L., Robinson, W. L., & Li, S. (2004). Poverty and depressive mood among urban African-American adolescents: A family stress perspective. Journal of Child and Family Studies, 13(3), 309-323.
Harrington, R., Fudge, H., Rutter, M., Pickels, A., & Hill, J. (1990). Adult outcome of childhood and adolescent depression. Archives of General Psychiatry, 47(5), 465-473.
Hunt, S. C. (2008). The prevalence of delinquency in depressed and substance abusing adolescent girls. Unpublished Doctor of Psychology Dissertation of Seattle University, WA.
Jackson, B., & Lurie, S. (2006). Adolescents’ depression: Challenges and opportunities. A review and current recommendations for clinical practice. Advances in Pediatrics, 53(1), 111-116.
Johnson, T. B. (2010). Antidepressants and alternative approaches to helping children and adolescents struggling with depression. Ethical Human Psychology and Psychiatry, 12(3), 238-253.

Cognitive Distortion as a Predictor towards Depression among Delinquent Adolescents
81Pertanika J. Soc. Sci. & Hum. Vol. 19 (S) 2011
Konner, C., Dobson, K., & Stelmach, L. (2009). The prevention of depression in nursing home residents: A randomized clinical trial of cognitive behavioral therapy. Aging and Mental Health, 132(2), 288-299.
Krotenberg, L. A. (2003). Cognitive and emotions in stereotype threat in African American and Hispanic college students. (Unpublished doctoral dissertation). St. John’s University (New York). Available on ProQuest Database.
Kubik, E. K., & Hecker, J. E. (2005). Cognitive distortions about sex and sexual offending: A comparison of sex offending girls, delinquent girls, and girls from the community. Journal of Child Sexual Abuse, 14(4), 43-69.
Larner, G. (2009). Integrating family therapy in adolescents’ depression: Ethical stance. Journal of Family Therapy, 31(3), 213-232.
Liau, A. K., Barriga, A. Q., & Gibbs, J. C. (1998). Relations between self-serving cognitive distortions and overt vs. covert antisocial behavior in adolescents. Aggressive Behavior, 24(5), 335-346.
Lin, H. C., Tan, T. C., Yen, J. Y., Ko, C. H., Huang, C. T., Liu, S. C., & Yen, C. F. (2008). Depression and its association with self-esteem, family, peer and school factors in a population of 9586 adolescents in southern Taiwan. Psychiatry and Clinical Neuroscience, 62(4), 412-420.
Lynch, F. L., & Clark, G. N. (2006). Estimating the economic burden of depression in children and adolescents. American Journal of Preventive Medicine, 31(6), S143-151.
Marcotte, D., Levesque, N., & Fortin, L. (2006). Variations of cognitive distortions and school performance in depressed and non-depressed high school adolescents: A two year longitudinal study. Cognitive Therapy and Research, 30(2), 211-225.
Marton, P., Churchyard, M., & Kutcher, S. (1993). Cognitive distortion in depressed adolescents. Journal of Psychiatric Neuroscience, 18(3), 103-107.
Maxwell, T. D., Gatchel, R. J., & Mayer, T. G. (1997). Cognitive predictors of depression in chronic low back pain: Toward an inclusive model. Journal of Behavioral Medicine, 21(2), 131-143.
Ministry of Health. (2004). MOH Clinical Practice Guidelines: Depression 3/2004. Singapore: Ministry of Health.
Nas, C. N., Brugman, D., & Koops, W. (2008). Measuring self-serving cognitive distortions with the “How I think” questionnaires. European Journal of Psychological Assessments, 24(3), 181-189.
Nasir, R., Zamani, Z. A., Yusooff, F., & Khairudin, R. (2010). Cognitive distortion and depression among juvenile delinquents in Malaysia. Procedia Social and Behavioral Sciences, 5, 272-276.
Pervan, S., & Hunter, M. (2007). Cognitive distortion and social self-esteem in sexual offenders. Applied Psychology in Criminal Justice, 3(1), 75-91.
Repetto, P. B., Caldwell, C. H., & Zimmermen, M. A. (2004). Trajectories of depressive symptoms among high risk African-American Adolescents. Journal of Adolescents Health, 35(6), 468-477.
Reynolds, W. M. (1986). Reynolds adolescent depression scale. Odessa, FL: Psychological Assesment Resources.
Reynolds, W. M. (1987a). Reynolds adolescent depression scale: A professional manual. Odessa, FL: Psychological Assessment Resources
Reynolds, W. M., & Mazza, J. J. (1998). Reliability and validity of Reynolds adolescent depression scale with young adolescents. Journal of School Psychology, 36(3), 295-312
Ryan, P. E., & Redding, R. E. (2004). A review of mood disorders among juvenile offenders. Psychiatric Services, 55(12), 1397-1407
Schroeder, R. M. (1994). The relationship between depression, cognitive distortion and life stress among African-American college students. (Unpublished doctoral dissertation). University of North Carolina, Chapel Hill.
Scott, J., Garland, A., & Moorhead, S. (2001). A pilot study of cognitive therapy in bipolar disorders. Psychological Medicine, 31(3), 459-467.
Unruh, D., Povenmiro-Kirk, T., & Yamamoto, S. (2009). Perceived barriers and protection factors of juvenile offenders in their developmental pathway to adulthood. Journal of Correctional Education, 60(3), 201-224.
R. Nasir, A. Z. Zainah, R. Khairudin, W. S. Wan Shahrazad, S. Nen and N. Subhi
82 Pertanika J. Soc. Sci. & Hum. Vol. 19 (S) 2011
Wiesner, M., & Kim, H. K. (2006). Co-occurring delinquency and depressive symptoms of adolescent boys and girls: A dual trajectory modeling approach. Developmental Psychology, 42(6), 1220-1235.
Wong, D. F. K. (2008). Cognitive behavioral treatment groups for people with chronic depression in Hong Kong: A randomized wait-list control design. Depression and Anxiety, 25(2), 142-148.
Zhang, J. (1996). Suicides in Beijing, China, 1992-1993. Suicide Life Threat Behavior, 26(2), 175-180.
ISSN: 0128-7702Pertanika J. Soc. Sci. & Hum. 19 (S): 83 - 89 (2011) © Universiti Putra Malaysia Press
Received: 3 May 2011Accepted: 28 July 2011*Corresponding Author
INTRODUCTIONAdolescence is a critical period of development. According to Santrock (2004) adolescents are continuously changing mentally, physically, and psychologically. Hence, they are learning more about the real world and trying to strive for independence from parents and inclusion in social groups (Santrock and Yussen, 1984).
Findings from previous studies indicate that adolescent antisocial behavior and problems predict long-term consequences which include addiction, impaired family relationships and criminal activity well into adulthood (Brook et al., 1998; Duncan et al., 1997; Newcomb and Bentler, 1988). Various risk factors have been associated with the development and progression of adolescents’ antisocial behavior.
Two commonly investigated risk factors for adolescent problem behavior are family functioning and self-concept.
According to McClun and Mervell (1998), self-concept does not exist in a vacuum as its development is influenced significantly by the immediate family context, although self-concept may also be influenced by factors outside the family, such as peers and school (Harter, 1999). Self-concept which is the way a person evaluates himself or herself influences one’s behavior and overall development. Findings from Henderson et al.’s (2006) study suggest that family functioning with self-concept work in conjunction with one another to predict the severity of adolescent externalizing problems such as drug involvement, aggressive behavior and also delinquent behavior.
Family Functioning as Predictor towards Self-Concept among Delinquent Adolescents
A. Z. Zainah*, R. Nasir, R. Khairudin and W. S. Wan Shahrazad School of Psychology and Human Development, Faculty of Social Sciences and Humanities,
Universiti Kebangsaan Malaysia, 43600 UKM, Bangi, Selangor, Malaysia*E-mail: [email protected]
ABSTRACTThe influence of family functioning on self-concept is crucial in adolescents’ development while negative family environment appears to be a risk factor in the development and maintenance of an adolescent’s behavior. This study aimed at determining the relationship between family functioning domains, adaptability, and cohesion with five domains of self-concept. The study employed survey research involving the administration of the Family Adaptability and Cohesion Evaluation Scale (FACES III) and the Tennessee Self-Concept Scale (TSCS). A total of 30 male adolescents who participated in a youth development program were involved in this study. Results from correlation and multiple regression analyse indicated positive relationships between domains of family functioning and five domains of self-concept. It was suggested that treatment for family therapy should focus on self-concept and family functioning in an integrative fashion rather than as separate loci. Positive family environment, effective parenting practices, and rebuilding adolescents’ self-concept should be incorporated in family-based intervention.
Keywords: Family functioning, self-concept, delinquent, adolescent
A. Z. Zainah, R. Nasir, R. Khairudin and W. S. Wan Shahrazad
84 Pertanika J. Soc. Sci. & Hum. Vol. 19 (S) 2011
According to Henderson et al. (2006), various family risk factors have been related to the development of adolescent drug use and antisocial behavior. Some of these family-related risk factors include ineffective parenting practices, especially poor parental monitoring (Pettit et al., 1999), unorganized strategies of managing families (Swadi, 1999), and coercive and manipulative attempts to control the adolescents (Loeber and Stouthamer-Lober, 1998). Henderson et al. (2006) studied 224 clinically referred adolescents and found strong and direct effect between self-concept and externalizing problems. It was also found that family functioning partially mediated the relationship between self-concept and externalizing problems.
A study on 3,634 primary and 2,706 secondary school students found that family cohesion and social self-concept were significant moderators for children and adolescents. Better family support and peer relationships weakened the relation between depression and suicide ideation. The study also discovered the moderation effect of social self-concept was less obvious among adolescents (Au et al., 2009). Chiou et al. (2008) also found that the level of parenting stress was found to be significantly associated with children’s self-concept. An examination by Gibson and Jefferson (2006) of 78 adolescents who participated in Gear Up program found that both perceived parental involvement and growth fostering relationships contributed significantly to the variance in self-concept.
Levy (1997) studied 365 Australian adolescent boys and girls and found the correlation between delinquency and self-concept. He found that the more serious these adolescents’ delinquent behaviors, the more negative their self-concepts were. A longitudinal study by Mc Nelis et al. (2000) on factors related to self-concept on 106 asthmatic children aged 8 to 13 found that low self-concept were displayed by children experiencing less satisfaction with family relationship, a more negative attitude toward illness, hence used more negative coping behaviors. Reyes (2008) studied two resiliency
factors: self-concept and perceived parental support, in conjunction with abuse factors that impacted psychological functioning on 61 sexually abused children. Among others, results found that a child’s self-concept was negative when exposed to lengthy abuse. Perceived parental support was found to be important
According to Matherne and Thomas (2001), cohesion refers to the level of attachment and emotional bonding between family members which are categorized into four levels: disengaged, separated, connected and enmeshed. Characteristics of families that are disengaged are lack of closeness and/or loyalty, and are also characterized by high independence. At the other end of the scale of cohesion are families identified as enmeshed, that are characterized by high levels of closeness, loyalty and/or dependency.
Adaptability defined by Matherne and Thomas (2001) is the ability of the family to change in power structure, roles and relationships in order to adjust to various situational stressors. It is also categorized into four levels: rigid, structured, flexible, and chaotic. Families with low levels of adaptability are considered rigid and these are characterized by authoritarian leadership, infrequent role modification, strict negotiation and lack of change. Whilst family with high level of adaptability are considered chaotic and these chaotic family types manifest a lack of leadership, dramatic role shifts, erratic negotiation and are characterized by excessive change (Matherne and Thomas, 2001).
This study was designed to determine the relationship between family functioning and self-concept. It also determined the relationship of family functioning domains and five domains of self-concept. This study also examined the predictive relationship between two dimensions of family functioning and the five domains of self-concept. The two dimensions of family functioning were adaptability and cohesion, while the five domains of self-concept were physical self, moral ethical self, personal self, family self, and social self.

Family Functioning as Predictor towards Self-Concept among Delinquent Adolescents
85Pertanika J. Soc. Sci. & Hum. Vol. 19 (S) 2011
METHODSThe method of sampling was purposive. The participants in this study consisted of 30 male youths aged between 16-25 years old, who had committed several offences, enrolled in a youth development program and gave consent to participate in this study. The data on the subjects is normal and homogenous based on Levene’s test of normality and homogeneity.
To assess family functioning, respondents completed the Family Adaptability and Cohesion Evaluation Scale (FACES III), which is composed of 20 negatively and positively stated questions based on a Likert-type scale ranging from 1 (almost never) to 5 (almost always). FACES III developed by Olson et al. (1979) assessed real family condition and ideal/imaginary condition. The reliability of the subscales of the FACES III Malay version has been fairly well established with alpha of 0.80. The Tennessee Self-Concept Scale (TSCS) developed by Fitts and Warren (2003) was employed to assess self-concept which contained 100 items scored on a 5-point scale from 1 (absolutely untrue) to 5 (very true). The reliability of TSCS was satisfactory with alpha 0.80.
RESULTS AND DISCUSSIONResults in Table 1 showed that there were significant and positive correlations between adaptability with physical self, moral ethical self, personal self, family self, and social self (five dimensions of self-concept). This meant that the higher the scores of adaptability, the higher the self-concepts of the adolescents. There were also significant and positive correlations
between cohesion and the five dimensions of self-concept. The results indicated that the higher the cohesion, the higher the self-concepts experienced by the adolescents.
Predictive relationship was also examined between adaptability and cohesion towards physical self. Multiple regression analysis found physical self was significantly predicted by family functioning. Results of multiple regression also showed that adaptability predicted significantly physical self with 10% variance, R² = 0.10, F (2, 281) = 14.89, p < 0.001. Adaptability was a significant predictor with Beta= 0.27, t=4.32, p < 0.001. However, cohesion did not predict significantly physical self-concept. The results are shown in Table 2. The linear equation that can be formulated is:
Y=44.99+0.393(Adaptability)
Predict ive relat ionships were also investigated between adaptability and cohesion towards moral ethical self. The regression model also showed that cohesion predicted significantly moral ethical self with 9% variance, R² = 0.09, F (2, 294) = 14.72, p < 0.001. Cohesion was a significant predictor with Beta = 0.27, t=4.20, p<0.001 as shown in Table 2. The linear equation that can be formulated is:
Y=43.54+0.27(Cohesion)
Personal self was also significantly predicted by both family adaptability and cohesion. Results of multiple regression showed that adaptability and cohesion predicted significantly personal self with 14% variance, R=0.14, F (2,280) = 22.89, p<0.001. Adaptability and
TABLE 1 Correlation between family functioning and self-concept
Physical Moral Ethical Personal Family SocialAdaptability 0.305* 0.191* 0.320* 0.510* 0.350*Cohesion 0.196* 0.298* 0.320* 0.560* 0.234*
*p < 0.01

A. Z. Zainah, R. Nasir, R. Khairudin and W. S. Wan Shahrazad
86 Pertanika J. Soc. Sci. & Hum. Vol. 19 (S) 2011
cohesion were significant predictors with Beta=0.21, t=3.37, p<0.001 and Beta=0.21, t=3.37, p<0.001 respectively. The linear equation that can be formulated is:
Y=38.89 + 0.34 (adaptability) + 0.27(cohesion)
Table 2 also reported multiple regression analysis between adaptability and cohesion with family self. Results showed both adaptability and cohesion predicted significantly family self-concept with 39% variance, R² = 0.39, F (2, 288) = 90.61, p < 0.001. Cohesion was a significant predictor with Beta= 0.40, t=7.68, p<0.001. Similarly, adaptability also significantly predicted family self with Beta= 0.30, t=5.82, p<0.001 as shown in Table 2. The linear equation that can be formulated is:
Y=22.98+0.59(adaptability) +0.63(cohesion)
Finally, this study also investigated the predictive relationship between adaptability and cohesion towards social self. The regression model also showed that only adaptability predicted social self with 13% variance, R² =0.13, F (2, 281) =20.55, p<0.001. Adaptability was a significant predictor with Beta=0.31, t=4.84, p<0.001. The linear equation that can be formulated is:
Y= 43.18+.40(adaptability)
Results of this study showed that the higher family functioning the adolescent experienced in his or her family environment, the higher was their self-concept. The significant positive
TABLE 2 Multiple regression analysis between family functioning and dimensions of self-concep
Model B Std. error Beta TPhysical selfConstant 44.99 2.77 16.24*
Adaptability 0.39 0.09 0.27 4.32*
Cohesion 0.06 0.07 0.05 0.89Moral ethical selfConstant 43.54 2.32 18.76*
Adaptability 0.06 0.07 0.05 0.39Cohesion 0.26 0.06 0.27 4.20*
Personal selfConstant 38.89 3.01 12.89*
Adaptability 0.34 0.10 0.21 3.37*
Cohesion 0.27 0.08 0.21 3.37*
Family selfConstant 22.97 3.04 7.54*
Adaptability 0.59 0.10 0.30 5.82*
Cohesion 0.63 0.08 0.40 7.68*
Social selfConstant 43.18 2.47 17.45*
Adaptability 0.40 0.08 0.31 4.84*
Cohesion 0.08 0.06 0.08 1.26*p < 0.001

Family Functioning as Predictor towards Self-Concept among Delinquent Adolescents
87Pertanika J. Soc. Sci. & Hum. Vol. 19 (S) 2011
relationship was true for both family functioning’s domains (adaptability and cohesion) with all five of self-concept’s domains (physical, moral, personal family, social, and ethical). The data, thus, support previous studies that have shown a relationship between self-concept and family functioning (e.g., Mc Nelis et al., 2000; McClun and Mervell, 1998).
Further, results have shown that adaptability was predictor of physical self, personal self, family self and social self whilst cohesion was predictor of ethical self, personal self, and family self.
Of the four domains of self-concept (family, physical, personal, and social), adaptability was the strongest predictor of family self. Similarly, family self was also predicted the best by cohesion. It seems that among the domains of self concept, family self can be best predicted by both adaptability and cohesion. What can be derived from this is that family functioning is the predictor of self-concept particularly family self. This is somewhat not surprising as elements of family functioning should contribute the most to the same aspect of other variables, in this case, family self concept. For that reason, it can be suggested that whether the adolescent develops strong family self concept, will depend mostly on the strength of his or her family functioning. What is more interesting here is that between the two family functioning domains, cohesion was the stronger predictor of family self. Cohesiveness of family members in the adolescent’s family seems to be the more crucial domain than adaptability in the developing of family self concept.
Previous research consistently has stressed that family functioning is a crucial factor in determining and predicting self-concept among adolescents. Family environment and functioning are significant predictors for an adolescent’s self-concept. If one’s family functioning is balanced and healthy, adolescent will continue to develop a positive outlook of oneself, that is a positive self-concept. The findings of this study also supported research by Nasir et al. (2011) that there was a positive correlation between family functioning and self-concept. According to Nasir
et al. (2011), family functioning would either directly or indirectly contribute to positive self-concept. When family is not functioning well, it will affect the emotional and physical growth, hence hampering the feeling of insecurity and positive development of self-concept.
Adolescents’ behavior may also be associated with delinquency. Research has also indicated that the family environment is an important variable in the development of delinquency (Cashwell and Vacc, 1996; Clark and Shields, 1997). Rosenbaum (1989) found that adolescents who have a strong relationship with their family were less likely to display delinquent behavior. Featherstone et al. (1993) also reported that youth from intact two-parent families were less likely to report school problems than were children from single-parent families. Cashwell and Vacc (1996) found that a cohesive family environment reduced the chances of delinquent behavior. Similarly, a study by Shields and Clarks (1995) found that low levels of adaptability in the family resulted in higher levels of delinquency. In addition, results of a study by Brown et al. (2009) indicated a direct and interactive influence of family dynamics and child characteristics on the development of children’s self-concept.
The findings from this study should be interpreted in light of some limitations. First, the sample comprised of a small sample of male adolescents involved in a youth development program; therefore, the results may not be generalized to other samples. Second, the family measures used were collected from the adolescents’ perspectives. It would be conceivable that parents perceive family environment differently from the adolescents’ perspective; hence different results may have been obtained.
CONCLUSIONThe findings of this study are consistent with previous studies suggesting that family functioning and self-concept are two variables that have influences on each other. Family functioning is a predictor of self-concept among

A. Z. Zainah, R. Nasir, R. Khairudin and W. S. Wan Shahrazad
88 Pertanika J. Soc. Sci. & Hum. Vol. 19 (S) 2011
adolescents. It seems likely that an adolescent who has a low self-concept may also see his or her family in a negative light. It seems unlikely that an adolescent who has a low self-concept would view his or her family functioning as high. Hence, treatment for family therapy should focus on self-concept and family functioning in an integrative fashion rather than as separate loci. Positive family environment, effective parenting practices, and rebuilding adolescents’ self-concept should be incorporated in family-based intervention.
REFERENCESAu, A. C. Y., Lau, S., & Lee, M. T. Y. (2009). Suicide
ideation and depression: The moderation effect of family cohesion and social self-concept. Adolescence, 44(17), 851-868.
Brook, J. S., Cohen, P., & Jaeger, L. (1998). Developmental variations in factors related to initial and increased levels of adolescent drug involvement. Journal of Genetic Psychology, 159(2), 179-194.
Brown, G. L., Mangelsdorf, S. C., Neff, C. A., Schoppe, S. J., & Frosch, C. A. (2009). Young children’s self-concept: Associations with child temperament, mother’s and father’s parenting and triadic family interaction. Merrill-Palmer Quarterly, 55(2), 184-216.
Cashwell, C. S., & Vacc, N. A. (1996). Family functioning and risk behaviors: Influence on adolescent delinquency. School Counselor, 44(2), 105-114.
Chiou, H. H., & Hsieh, L. P. (2008). Children’s self-concept and parenting stress between families of children with epilepsy and asthma. Journal of Nursing Research, 16(1), 65-73.
Clark, R., & Shields, G. (1997). Family communication and delinquency. Adolescence, 32, 81-92.
Duncan, T. E., Duncan, S. C., Alpert, A., Hops, H., Stoolmiller, M., & Muthen, B. (1997). Latent variable modeling of longitudinal and multilevel substance use data. Multivariate Behavioral Research, 32(4), 275-318.
Featherstone, D. R., Cundick, B. P., & Jensen, L. C. (1993). Differences in school behavior and achievement between children from intact, reconstituted and single-parent families. Family Therapy, 20(1), 37-48.
Fitts, W. H., & Warren, W. L. (2003). Manual tennessee self-concept scale (2nd ed.). USA: Western Psychological Services.
Gibson, D. M., & Jefferson, R. N. (2006). The effects of perceived involvement and the use of growth fostering relationships on self-concept in adolescents participating in gear up. Adolescence, 41(March), 111-125.
Harter, S. (1999). The construction of the self: A developmental perspective. New York: Guilford Press.
Henderson, C. E., Dakof, G. A., Schwartz, S. J., & Liddle, H. A. (2006). Family functioning, self-concept, and severity of adolescents externalizing problems. Journal of Child and Family Studies, 15(6), 721-731.
Levy, K. (1997). The contribution of self-concept in the etiology of adolescent delinquency. Adolescence, 32(Sept) 671-86.
Loeber, R., & Stouthamer-Lober, M. (1998). Development of juvenile aggression and behavior: Some common misconceptions and controversies. American Psychologist, 53(2), 242-259.
Matherne, M. M., & Thomas, A. (2001). Family environment as a predictor of adolescent delinquency. Adolescence, 36(Dec), 655-664.
McClun, L. A., & Merrel, K. W. (1998). Relationship of perceived parenting styles, locus of control orientation, and self-concept among junior high age students. Psychology in the Schools, 35(4), 381-390.
Mc Nelis, A. M., Huster, G. A., Michel, M., Hollingsworth, J., Eigen, H., & Austin, J. K. (2000). Factors associated with self-concept in children with asthma. Journal of Child and Adolescent Psychiatric Nursing, 13(2), 55-68.

Family Functioning as Predictor towards Self-Concept among Delinquent Adolescents
89Pertanika J. Soc. Sci. & Hum. Vol. 19 (S) 2011
Nasir, R., Zainah, A. Z., Khairudin, R., & Wan Shahrazad, W. S. (2011). Family functioning, self-esteem, self-concept and cognitive distortion among juvenile delinquents. The Social Sciences, 6(2), 155-163.
Newcomb, M. D., & Bentler, P. M. (1988). Consequences of adolescent drug use. Hillsdale, NJ: Lawrence Erlbaum Associates.
Olson, D. H., Sprenkle, D. H., & Russel, C. S. (1979). Circumplex model of marital and family system: Cohesion and adaptability dimension, family types and clinical applications. Family Process, 18(1), 3-28.
Pettit, G. S., Bates, J. E., Dodge, K. A., & Meece, D. W. (1999). The impact of after-school peer contact on early adolescent externalizing problems is moderated by parental monitoring, perceived neighborhood safety, and prior adjustment. Child Development, 70(3), 768-778.
Reyes, C. J. (2008). Exploring the relations among the nature of the abuse, perceived parental support, and child’s self-concept and trauma symptoms among sexually abused children. Journal of Child Abuse, 17(1), 51-70.
Rosenbaum, J. (1989). Family dysfunction and delinquency. Crime and Delinquency, 35(1), 31- 44.
Santrock, J. W. (2004). Life-span development (9th ed.). New York: McGraw-Hill.
Santrock, J. W., & Yussen, S. R. (1984). Children and adolescents: A developmental perspective. Dubuque, IA: Wm. C. Brown Publishers.
Shields, G., & Clark, R. D. (1995). Family correlates of delinquency: Cohesion and adaptability. Journal of Sociology and Social Welfare, 22(2), 93-106.
Swadi, H. (1999). Individual risk factors for adolescent substance use. Drug and Alcohol Dependence, 55(3), 209-224.


ISSN: 0128-7702Pertanika J. Soc. Sci. & Hum. 19 (S): 91 - 97 (2011) © Universiti Putra Malaysia Press
Received: 3 May 2011Accepted: 28 July 2011*Corresponding Author
INTRODUCTIONYear by year, the global number of patients with renal failure is reportedly rising by 7% -10% (De Vos, 2002). In the United States, about 19 million people were reported suffering from kidney failure and more than 325,000 people were dialysis dependant which then rose to 494,471 people in 2007 (Pirtle et al., 2004). Later in the year 2007, about 34,200 patients were estimated undergoing dialysis in the United
Kingdom and 230,000 people in Japan (Yeh et al., 2008). Meanwhile in Malaysia, at the end of 2009, there were about 21,159 patients with chronic kidney disease identified receiving dialysis treatment. The number of patients who received dialysis treatment was also found to increase from 6,689 in 2000 to 21,159 cases at end 2009. In the meantime, the number of new patients receiving dialysis treatment rose from 1,855 in 2000 to 4,146 in 2009 (Malaysian Dialysis and Transplant Registry, 2009).
Social Support and Religious Coping Strategies in Health-Related Quality of Life of End-Stage Renal Disease Patients
Norhayati Ibrahim1*, Asmawati Desa2, Norella Kong Chiew-Tong3, R. Ismail 2 and A. Z. Zainah2
1Health Psychology Unit, Faculty of Allied Health Sciences,Universiti Kebangsaan Malaysia,Jalan Raja Muda A. Aziz, 50300 Kuala Lumpur, Malaysia
2School of Psychology and Human Development, Faculty of Social Sciences and Humanities,Universiti Kebangsaan Malaysia, 43600 UKM, Bangi, Selangor, Malaysia
3Nephrology/Dialysis and SLE Unit, UKM Medical Centre, Faculty of Medicine,Jalan Yaacob Latif, Bandar Tun Razak, 56000 Cheras, Kuala Lumpur, Malaysia
*E-mail: [email protected]
ABSTRACTChronic disease states are known to cause psychological dysfunctions but are not well studied in patients with end-stage renal disease (ESRD). The purpose of this study was to identify the relationship and influence of social support and religious coping strategies on patient’s health-related quality of life (HRQoL). This study was conducted on 274 patients with ESRD who were treated chronic dialysis. The test instruments used were Provision of Social Relation (PSR) which was used to measure social support from family and friends, Short-Form 36 (SF-36) to measure their HRQOL and Religious Coping Strategies (RCS) to determine patients’ positive or negative nature of religious coping. Results showed that social support and religious coping strategies were significantly correlated with HRQoL in both aspects of physical component summary (PCS) and mental component summary (MCS). In addition, the findings showed that social support and religious coping were predictors of PCS and MCS. Therefore, these factors affected the quality of life in terms of physical and mental health. This study implies that attention should be given to any interventional processes to improve the HRQoL of ESRD patients. Future studies could clarify the issue of causality by employing longitudinal analyses or experimental designs.
Keywords: Social support, religious coping, health-related quality of life, end-stage renal disease, chronic dialysis

Norhayati Ibrahim, Asmawati Desa, Norella Kong Chiew-Tong, R. Ismail and A. Z. Zainah
92 Pertanika J. Soc. Sci. & Hum. Vol. 19 (S) 2011
Consistent with this drastic increase, the issues of health-related quality of life (HRQoL) of end-stage renal disease (ESRD) patients have become a hot topic discussed by many researchers. In general, studies that focused on HRQoL of kidney patients reported that most patients experienced a decline of life quality in those aspects associated with physical functioning compared with the normal population (Blake et al., 2000; DeOreo, 1997; Diaz-Buxo et al., 2000; Merkus et al., 1997; Vazquez et al., 2003), but not for mental functioning (DeOreo, 1997; Diaz-Buxo et al., 2000). However, there are also studies which found that kidney patients obtained lower scores for mental health components of quality of life compared with physical functioning. This was associated with increased survival rates among patients. On the other hand, the decline in physical functioning was associated with increased admission of patients to hospitals. Other researchers also found that dialysis patients were reportedly experiencing problems relating to quality of life, which include a low level of activities, sexual problems and difficulty in maintaining their jobs (Lok, 1996; Merkus et al., 1997)
Patients’ quality of life is variable and depends on the disease itself. Lopes et al.’s study (2007) showed some obvious features of kidney patients who had low levels in quality of life. Among others are patients’ low physical and mental aspects related to the coping strategies implemented by them. Furthermore, studies performed in United States showed that lack of social support may be associated with increased rates of mortality and morbidity (House et al., 1988). According to Caplan (1974) and Bloom (1990), the importance of interaction between patients’ network and their ability to use the sources of support received by patients will help improve health in terms of physical recovery hence may improve their quality of life (Ferrans and Power, 1993, Kimmel, 2001).
Furthermore, there are recent findings showing that religious elements and a strong stake in belief and faith were involved in one of the coping strategies that can reduce depression
and negative perceptions of the disease’s impacts which were also used to improve quality of life (Patel et al., 2002). Having studied religious behavior, Argyle and Beit-Hallahmi (1975) found that most participants in the study need religion when in crisis situations, including during illness or loss and death. They added that performing prayers or praying were ways commonly identified. According to Pargament (1997), in order to produce positive and sustainable health, religious coping strategies (RCS) are needed when faced with pressure. He suggested that people will rely more strongly on religion when the situation is more serious, harmful, and threatening.
For ESRD patients, full recovery from illness is something that is uncertain. Therefore, they should react by maintaining good quality of life, including maximizing functionality, reducing the symptoms faced and lowering the stress experienced (Lopes et al. 2007). For that, the purpose of this study was to identify the relationship and influence of social support and religious coping strategies on health-related quality of life (HRQoL) of ESRD patients.
METHODSThis was a cross-sectional study. The question and answer session was conducted through face to face interview. Collection of data involved two sample groups receiving dialysis treatment, which were patients who received hemodialysis (HD) treatment and patients on continuous ambulatory peritoneal dialysis (CAPD) treatment.
This study involved 274 ESRD patients who were made up of 183 patients who received HD treatment and 91 CAPD patients. HD samples were patients from dialysis centers managed by the Pusat Perubatan Universiti Kebangsaan Malaysia (PPUKM) and those who received HD from dialysis centers managed by the Charity Dialysis Centre MAA-Medicare. Meanwhile, samples from CAPD patients were obtained from PPUKM and Putra Specialist Hospital in Johor.
The Short-Form 36 (SF-36) is a set of questionnaires commonly used in health

Social Support and Religious Coping Strategies in Health-Related Quality of Life
93Pertanika J. Soc. Sci. & Hum. Vol. 19 (S) 2011
studies to assess the quality of life in a given population. HRQoL was assessed using SF-36 consists of 8 components which assess various aspects of function and well-being to provide a comprehensive objective of HRQoL. It took about 10 - 15 minutes to answer the questions. SF-36 is suitable for respondents over the age of 14 years. It contains 36 questions covering aspects of physical and mental health. The questions revolve around physical functioning, physical role, emotional role, social functioning, bodily pain, general health, vitality, and mental health. These questionnaires contribute to the evaluation of two major aspects of patients’ functioning -which comprised of physical component summary (PCS) and mental
component summary (MCS) (Covic et al., 2004). The reliability of the SF-36 test instrument for all the 8 dimensions ranged from 0.66 to 0.89.
Provision of Social Relations (PSR) questionnaire created by Turner et al. (1983) is to measure social support. PSR contains 15 items that essentially fall into 2 dimensions of support, which are family support and friend support. This test tool also has good concurrent validity in which it has a significant relationship with Kaplan’s social support scale. However, PSR also has a negative relationship with some other test tools of psychological distress (Turner et al., 1983). The reliability of PSR for this study is 0.89.
Religious Coping Strategies instrument was constructed by the present researchers. It contains 20 items that examine two sub-scales of religious coping strategies in positive and negative forms. The development of this test equipment is based on Pargament’s religious coping scale. However, most of the items were modified and supplemented as appropriate to the religions and multiethnic cultures in Malaysia. Before the test instrument was administered to the study population, the instrument was first validated. After factor analysis was done, the value and reliability of this test device was 0.88.
Data were analyzed using the Statistical Package for Social Sciences (SPSS) 18.0. Descriptive statistics were used for describing
the patient’s background. Pearson correlation analysis and multiple regressions with stepwise method were used in this study. A p value of ≤ 0.05 was taken as significance value.
RESULTS AND DISCUSSIONA total of 274 ESRD patients on chronic dialysis were recruited. Their demographic profile is summarized in Table 1. There were 51.5% male and 48.5% females. The majority were Malays (49.3%), married (75.9%), Muslims (52.2%) and aged 51 to 60 years (37.6%). Most of the patients were unemployed and without a pension (56.2%). On the other hand 18.2% of the patients were pensioners and the remaining 25.5% were still working. Of the 274 patients 66.8% were on HD and the remaining 33.2% on CAPD. Majority (50.7%) had been on dialysis for less than 36 months (3 years), i.e. 36.6% for 36-120 months (3-10 years) and the remaining 12.8% for more than 120 months (> 10 years).
TABLE 1 Demographic profile of the total ESRD
patient population
Variable Frequency Percentage (%)
Gender Male Female
141133
51.548.5
Ethnicity Malay Chinese Indian Others
135110236
49.340.18.42.2
Religion Islam Buddhism Hinduism Christianity Others
14380221118
52.229.28.04.06.6
Age < 40 years 40 – 50 years 51 – 60 years > 60 years
505310368
18.219.337.624.8

Norhayati Ibrahim, Asmawati Desa, Norella Kong Chiew-Tong, R. Ismail and A. Z. Zainah
94 Pertanika J. Soc. Sci. & Hum. Vol. 19 (S) 2011
Marital status Married Single Divorced/Widowed
3420832
12.475.911.7
Working status Employment Unemployment
without pension Unemployment
with pension
7015450
25.556.218.2
Type of dialysis HD CAPD
18391
66.833.2
Length of treatment < 36 month 36 - 120 month > 120 month
13910035
50.736.512.8
Table 2 summarizes the result of the eight components of patients’ HRQoL. Based on the mean values, the table indicates that all eight components of HRQoL were at the median level of 50. The highest mean value was that of the component of social functioning (79.38), while the lowest value was for the general health component (60.50). Furthermore, the study results also showed that the mean values for the PCS and MCS were 70.46 and 72.96 respectively. Patients were receiving good support from family and friends. Similarly, with the religious coping of mean value 54.60, it indicates that patients had high positive religious coping strategies. The standard deviation of all components of HRQoL showed a small dispersion.
TABLE 2 Descriptive analysis of all components of
health-related quality of life, social support and religious coping
Range Mean SDPhysical functioning
0-100 73.47 17.89
Physical role 0-100 71.21 20.74Bodily pain 0-100 76.64 21.91General health 0-100 60.50 15.66
PCS 0-100 70.46 14.17Vitality 0-100 62.15 18.73Social functioning
0-100 79.38 20.42
Emotional role 0-100 76.95 22.26Mental health 0-100 73.36 19.03MCS 0-100 72.96 16.20Social support 15-75 57.81 10.42Religious coping
20-100 77.09 1.61
Table 3 summarizes the relationship between social support and religious coping to the PCS and MCS of these patients. There was a significant positive relationship between social support with PCS (r = 0.23, p <0.01) and MCS (r = 0.30, p <0.01). Similarly for religious coping strategies, there was also a positive correlation with PCS (r = 0.20, p <0.05) and MCS (r = 0.31, p <0.01). These suggest that the higher the social support and the better the religious coping strategies being employed, the higher the PCS and MCS in those patients.
TABLE 3 Relationship between social support and
religious coping with PCS and MCS
Variable PCS(r) MCS (r)Social support 0.23** 0.30**Religious coping 0.20* 0.31***p < 0.05, **p < 0.01
To test the influence of social support and religious coping on PCS and MCS, multiple regression analysis using stepwise method was used. Results are as shown in Table 4. Social support and religious coping influenced the PCS and contributed only 7%. Furthermore, results shows that social support and religious coping contributed 13% to the MCS.
Chronic kidney disease (CKD) and end-stage renal disease (ESRD) are raising global pandemics. Kidney failure is the only organ failure, the functions of which can be replaced
Table 1 (cont’d) Table 2 (cont’d)
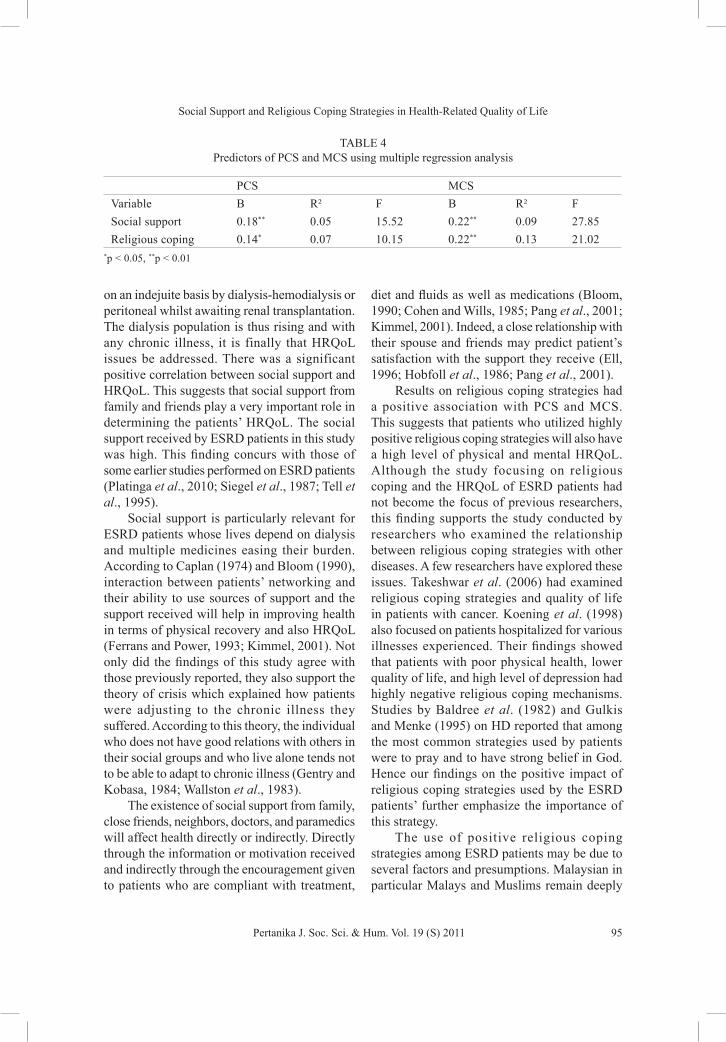
Social Support and Religious Coping Strategies in Health-Related Quality of Life
95Pertanika J. Soc. Sci. & Hum. Vol. 19 (S) 2011
on an indejuite basis by dialysis-hemodialysis or peritoneal whilst awaiting renal transplantation. The dialysis population is thus rising and with any chronic illness, it is finally that HRQoL issues be addressed. There was a significant positive correlation between social support and HRQoL. This suggests that social support from family and friends play a very important role in determining the patients’ HRQoL. The social support received by ESRD patients in this study was high. This finding concurs with those of some earlier studies performed on ESRD patients (Platinga et al., 2010; Siegel et al., 1987; Tell et al., 1995).
Social support is particularly relevant for ESRD patients whose lives depend on dialysis and multiple medicines easing their burden. According to Caplan (1974) and Bloom (1990), interaction between patients’ networking and their ability to use sources of support and the support received will help in improving health in terms of physical recovery and also HRQoL (Ferrans and Power, 1993; Kimmel, 2001). Not only did the findings of this study agree with those previously reported, they also support the theory of crisis which explained how patients were adjusting to the chronic illness they suffered. According to this theory, the individual who does not have good relations with others in their social groups and who live alone tends not to be able to adapt to chronic illness (Gentry and Kobasa, 1984; Wallston et al., 1983).
The existence of social support from family, close friends, neighbors, doctors, and paramedics will affect health directly or indirectly. Directly through the information or motivation received and indirectly through the encouragement given to patients who are compliant with treatment,
diet and fluids as well as medications (Bloom, 1990; Cohen and Wills, 1985; Pang et al., 2001; Kimmel, 2001). Indeed, a close relationship with their spouse and friends may predict patient’s satisfaction with the support they receive (Ell, 1996; Hobfoll et al., 1986; Pang et al., 2001).
Results on religious coping strategies had a positive association with PCS and MCS. This suggests that patients who utilized highly positive religious coping strategies will also have a high level of physical and mental HRQoL. Although the study focusing on religious coping and the HRQoL of ESRD patients had not become the focus of previous researchers, this finding supports the study conducted by researchers who examined the relationship between religious coping strategies with other diseases. A few researchers have explored these issues. Takeshwar et al. (2006) had examined religious coping strategies and quality of life in patients with cancer. Koening et al. (1998) also focused on patients hospitalized for various illnesses experienced. Their findings showed that patients with poor physical health, lower quality of life, and high level of depression had highly negative religious coping mechanisms. Studies by Baldree et al. (1982) and Gulkis and Menke (1995) on HD reported that among the most common strategies used by patients were to pray and to have strong belief in God. Hence our findings on the positive impact of religious coping strategies used by the ESRD patients’ further emphasize the importance of this strategy.
The use of positive religious coping strategies among ESRD patients may be due to several factors and presumptions. Malaysian in particular Malays and Muslims remain deeply
TABLE 4 Predictors of PCS and MCS using multiple regression analysis
PCS MCSVariable Β R² F B R² FSocial support 0.18** 0.05 15.52 0.22** 0.09 27.85Religious coping 0.14* 0.07 10.15 0.22** 0.13 21.02
*p < 0.05, **p < 0.01

Norhayati Ibrahim, Asmawati Desa, Norella Kong Chiew-Tong, R. Ismail and A. Z. Zainah
96 Pertanika J. Soc. Sci. & Hum. Vol. 19 (S) 2011
religious and are highly dependent on their God. This will empower these patients to accept challenges with an open heart and will overcome their maladies with the ‘help’ of God. ESRD patients also realize they have no other options other than chronic renal replacement therapy. Therefore the only hope that they have is to turn to their God, whereby surrendering to the will of God can reduce depression and anxiety resulting from the disease. This shows that religion is especially useful during this kind of trouble and crisis.
CONCLUSIONSocial support and religious coping strategies are important albeit not major factors that impact the HRQoL of ESRD patients on chronic dialysis. These factors, especially social support, should be given due attention in any interventional processes that are intended to improve the HRQoL this patient population. One implication of the study is the practical use of these strategies especially to care givers as they would definitely benefit from any kind of strategy that can promise an effective outcome. For that reason, in future, health authorities and healthcare workers should prioritize research into social support and religious coping for patient interventions to enhance HRQoL in patients.
REFERENCESArgyle, M., & Beit-Hallahmi, B. (1975). The social
psychology of religion. London: Routledge and Kegan Paul.
Baldree , K., Murphy, S., & Powers, M. (1982). Stress, identification and coping patterns in patients on hemodialysis. Nursing Research, 37(2), 107-112.
Blake, C., Codd, M. B., Cassidy, A., & O’Meara, Y. M. (2000). Physical function, employment and quality of life in end-stage renal disease. Journal of Nephrology Online, 13(2), 142-149.
Bloom, J. R. (1990). The relationship of social sciences and health. Social Sciences and Medicine, 30(5), 635-637.
Caplan, G. (1974). Support systems and community mental health . New York: Behavioural Publication.
Cohen, S., & Wills, T. A. (1985). Stress, social support and the buffering hypothesis. Psychology Bulletin, 98, 310-357.
Covic, A., Seica, A., Gusbeth- Tatomir, P., Gavrilovici, O., & Goldsmith, D. J. A. (2004). Illness representations and quality of life scores in hemodialysis patients. Nephrology Dialysis Transplant, 19(8), 2078-2083.
De Vos, J. (2002). Future trends in renal nursing. In N. Thomas (Ed.), Renal nursing (pp. 431-440). London: Bailliere Tindall.
DeOreo, P. B. (1997). Hemodialysis patient-assessed functional health status predicts continued survival, hospitalization, and dialysis-attendance compliance. American Journal of Kidney Diseases, 30(2), 204–212.
Diaz-Buxo, J., Lowrie, E. G., Lew, N. L., Zhang, H., & Lazarus, J. M. (2000). Quality of life evaluation using Short-Form 36: Comparison in hemodialysis and peritoneal dialysis patients. American Journal of Kidney Disease, 35(2), 293-300.
Ell, K. (1996). Social networks, social support and coping with serious illness: The family connection. Social Science Medicine, 42(2), 173-183.
Ferrans, C. E., & Powers, M. J. (1993). Quality of life of hemodialysis patients. ANNA Journal, 20(5), 575-581.
Gentry, W. D., & Kobasa, S.C.O. (1984). Social and psychological resources mediating stress-illness relationships in human. In W. D. Gentry, (Ed.), Handbook of behavior medicine. (pp. 87-116). New York: The Guilford Press.
Gulkis, J. A., & Menke, E. M. (1995). Chronic hemodialysis patient’s perceptions of stress, coping and social support. ANNA Journal, 2(4), 381-390.
Hobfoll, S. E., Naler, A., & Leiberman, J. (1986). Satisfaction with social support during crisis: Intimacy and self-esteem as critical determinants. Journal of Personality & Social Psychology, 51(2), 296-304.
Social Support and Religious Coping Strategies in Health-Related Quality of Life
97Pertanika J. Soc. Sci. & Hum. Vol. 19 (S) 2011
House, J. S., Landis, K. R., & Umberson, D. (1988). Social relationship and health. Sciences, 241(4865), 540-544.
Kimmel, P. L. (2001). Psychosocial factors in dialysis patients. Kidney International, 59, 1599-1613.
Koening, H. G., Pargament, K. I., & Nielsen, J. (1998). Religious coping and health status in medically ill hospitalized older adults. Journal of Nervous and Mental Disease, 186(9), 513-521.
Lok, P. (1996). Stressors, coping mechanisms and quality of life among dialysis patients in Australia. Journal of Advanced Nursing, 23(5), 873-881.
Lopes, A., Bragg-Gresham, J. L., Goodkin, D. A., Fukuhara, S., Mapes, D. L., Young, E. W., Gillespie, B. W., Akizawa, T., Greenwood, R. N., Andreucci, V. E., Akiba, T., Held, P. J., & Port, F. K. (2007). Factors associated with health-related quality of life among hemodialysis patients in the DOPPS. Quality of Life Research, 16(6), 545-557.
Malaysian Dialysis and Transplant Registry. (2009). 17th Report of the Malaysian Dialysis and Transplant Registry 2009. National Renal Registry Malaysian Society of Nephrology. Kuala Lumpur.
Merkus, M. P., Jager, K. J., Dekker, F. W., Boeschoten, E. W., Stevens, P., Krediet, R. T., & The Necosad Study Group. (1997). Quality of life of patients on chronic dialysis: Self assessment 3 months after the start of treatment. American Journal of Kidney Diseases, 29(4), 584–592.
Pang, S. K., Wan, Y., & Chan, A. (2001). Psychosocial correlates of fluid compliance among Chinese haemodialysis patients. Journal of Advanced Nursing, 35(5), 691-698.
Pargament, K. I. (1997). The psychology of religion and coping: Theory, research and practice. London: Guilford Press.
Patel, S. S., Shah, V. S., Peterson, R. A., & Kimmel, P. L. (2002). Psychosocial variables, quality of life and religious beliefs in ESRD patients treated with hemodialysis. American Journal of Kidney Diseases, 40(5), 1013- 1022.
Pirtle, C., Schoolwerth, A., Giles, W., Brown, D., Mokdad, A., & Ford, E. (2004). State-specific trends in chronic kidney failure United State. Mobility and Mortality Weekly Report, 53, 918-920.
Plantinga, L. C., Fink, N. E., Harrington-Levey, R., Finkelstein, F. O., Hebah, N., Powe, N. R., & Jaar, B. G. (2010). Association of social support with outcomes in incident dialysis patients. Clinical Journal of the American Society Nephrology, 5(8), 1480-1488.
Siegal, B. R., Calsyn, R. J., & Cuddihee, R. M. (1987). The relationship of social support to psychological adjustment in end-stage trenal disease patients. Journal of Chronic Disease, 40(4), 337-344.
Tarakeshwar, N., Vanderweaker, L. C., Paul, K. E., Pearce, M. J., Kasl, S. V., & Prigerson, H. G. (2006). Religious coping is associated with the quality of life of patients with advanced cancer. Journal Palliative Medicine, 9(3), 646-657.
Tell, G. S., Mittelmark, M. B., Hylander, B., Shumaker, S. A., Russel, G., & Burkart, J. M. (1995). Social support and health-related quality of life in black and white dialysis patients. ANNA Journal, 122(3), 301-308.
Turner, R. J., Frankel, B. G., & Levin, D. M. (1983). Social support: Conceptualization, measurement and application for mental health. Research in Community and Mental Health, 3, 67-111.
Vazquez, I., Valderrabano, F., Jofre, R., Fort, J., Lopez-Gomez, J. M., Moreno, F., & Sanz-Guajardo, D. (2003). Psychosocial factors and quality of life in young hemodialysis patients with low comorbidity. Journal Nephrology, 16(6), 886-894.
Wallston, B., Alagna, S.W., Devellis, B.M., & Devellis, R. I. (1983). Social support and physical health. Health Psychology, 2(4), 367-391.
Yeh, S-C. J., Huang, C-H., & Chau, H-C. (2008). Relationship among coping, comorbodity and stress in patients having haemodialysis. Journal of Advanced Nursing, 63(2), 166-174.

ISSN: 0128-7702Pertanika J. Soc. Sci. & Hum. 19 (S): 99 - 107 (2011) © Universiti Putra Malaysia Press
Received: 3 May 2011Accepted: 28 July 2011*Corresponding Author
INTRODUCTIONDrug abuse and addiction are among the most pressing health and social issues facing many developing countries, resulting in serious health risks. The rate of psychopathological symptoms among drug addicts have been demonstrated by many studies to be high (Compton et al., 2003; Esposito-Smythers, 2005; McKenna and Khantzian, 1979; Nunes et al., 1994; Regier et al., 1990) and this high rate is also prevalent among those undergoing treatment (Strain et al., 1991). As such, understanding the psychopathological symptoms among drug addicts is an important step for treatment and rehabilitation of drug addiction. Consequently, the measurement of
psychopathological symptoms requires a valid and reliable instrument to be used especially in cultures different from which it was developed.
Among several self-report instruments developed to assess current psychopathology, the Symptom Check List (SCL-90-R) is one that is extensively used in the mental health area. The 90-item instrument measures nine psychopathological symptoms namely somat iza t ion , obsess ion-compuls ion , interpersonal sensitivity, depression, anxiety, hostility, phobia, paranoia, and psychoticism. As SCL-90-R instrument is developed for English speaking population, modification, and adaptation is needed when applied to
Consistency and Validity of Psychopathological Measure among Drug Addicts in Developing Culture
W. S. Wan Shahrazad*, A. R. Roseliza Murni, Z. M. Lukman, I. Fauziah, A. Z. Zainah and Z. Arifin
School of Psychology and Human Development, Faculty of Social Sciences and Humanities, Universiti Kebangsaan Malaysia, 43600 UKM, Bangi, Selangor, Malaysia
*E-mail: [email protected]
ABSTRACTUnderstanding the psychopathological symptoms among drug addicts is an important step for treatment and rehabilitation of drug addiction. Consequently, the measurement of psychopathological symptoms requires a valid and reliable instrument to be used. This study aimed to examine the consistency and validity of the Symptoms Check List-90-Revised (SCL-90-R) in measuring psychopathological symptoms. The SCL-90-R is a self-report inventory that has 90 items with nine dimensions namely, somatization, obsessive-compulsive, interpersonal-sensitivity, depression, anxiety, hostility, phobia, paranoia, and psychoticism. The sample consisted of 599 respondents from six drug rehabilitation centers. Results showed that the instrument has good reliability and validity indicating that it is suitable and can be used to measure psychopathological symptoms among drug addicts. The results of this study provide insight into the validity of psychopathological symptoms experienced by drug addicts which has to be taken into consideration in designing an effective treatment program. Programs that can increase the drug addicts’ motivation to change must be specifically tailored to address the seriousness of clinical problems in drug addiction.
Keywords: Psychometric, psychopathology, validity, reliability

W. S. Wan Shahrazad, A. R. Roseliza Murni, Z. M. Lukman, I. Fauziah, A. Z. Zainah and Z. Arifin
100 Pertanika J. Soc. Sci. & Hum. Vol. 19 (S) 2011
countries where English is not the primary language. In addition, comparative similarities in psychopathology may exist in countries whose cultures, including values and lifestyles are remarkably different from that of the West. This is because psychopathology is a cross-cultural phenomenon as studies on psychopathology have demonstrated (Bonicatto et al., 1997; Bonynge, 1993; Franke, 1995; Holi et al., 1998; Schmitz et al., 2000). It is therefore, not unique to one culture. However, the differences may exist in the degree or severity of the symptoms experienced by drug addicts specifically in a developing country.
The indicator of psychopathological symptoms is important as it may give indication to the effectiveness of treatment modality among drug addicts. This is due to the findings of previous studies that demonstrate the role of psychopathology as an important predictor of success in addiction treatment (McLellan et al., 1983; McLellan et al., 1984; Wan Shahrazad et al., 2011a), whereby these studies have shown a negative relation between severity of psychiatric problems and treatment success. Another related study by Chung (2002) was conducted on 169 adolescents between 14-18 years old who were recruited from addictions treatment. Results showed that the most prevalent psychiatric disorders were conduct disorder (47%), major depression (29%), attention deficit-hyperactivity disorder (17%), and oppositional defiant disorder (11%).
Within the context of Malaysia as a developing country, the study by Fauziah and Kumar (2009) showed that the lack of motivation and readiness to change among the drug addicts were one of the key factors that contributed toward relapse cases. In addition, Wan Shahrazad et al.’s (2010) study indicated that the trait of psychoticism among drug addicts undergoing rehabilitation must be low in order for them to start taking steps in changing their addiction. This means that those who were emotionally unstable and have high psychoticism trait were still ambivalent and may face problems in changing their addictive behavior. High level of psychopathology among drug addicts
undergoing treatment may compromise their motivation to change and these individuals were unwilling to take steps to change their addictive behavior which certainly pose a threat toward the success of the treatment program. Eysenck (1997) states that psychotic individuals are characterized by their impulsive behavior, failure to give attention and disorganized personality.
Validation studies: The validity of the SCL-90-R is controversial despite its frequent use to measure psychopathology. Findings of previous studies on the factor structure of the instrument have been inconsistent with its original nine dimensions. Hofman and Overall (1978) found five factors in their study on psychiatric outpatient samples. Holcomb et al. (1983) obtained nine different factors among psychiatric inpatient samples which were different from Derogatis (1992). Hafkenscheid (1993) found four clinically interpretable factors in a psychiatric inpatient population, while Bonynge (1993) could only derive one large factor accounting for nearly 70% of the variance of the instrument in a community mental health crisis intervention unit.
Several studies on the psychometric properties of the SCL-90-R were done across different cultures. For instance, Schmitz et al. (2000) have done the study on the German SCL-90-R version with two clinical samples: psychosomatic outpatients and primary care patients. The result of internal consistency, measured by Cronbach alpha coefficients, was found to be high, for the global scale. Rief and Fichter (1992) also found that, the SCL-90-R can distinguish between patients with dysthymia, anxiety disorders and anorexia nervosa by using discriminant analysis. This is consistent with findings by Clark and Friedman (1983) who found differences in the mean intensity level between anxious, depressed and schizophrenic patients. Other studies showed that the SCL depression and anxiety scales showed good convergent and divergent validity (Koeter, 1992; Morgan et al., 1998).
Another study conducted in Finland by Holi et al. (1998) investigated the utility of the translated version of the SCL-90 in the Finnish
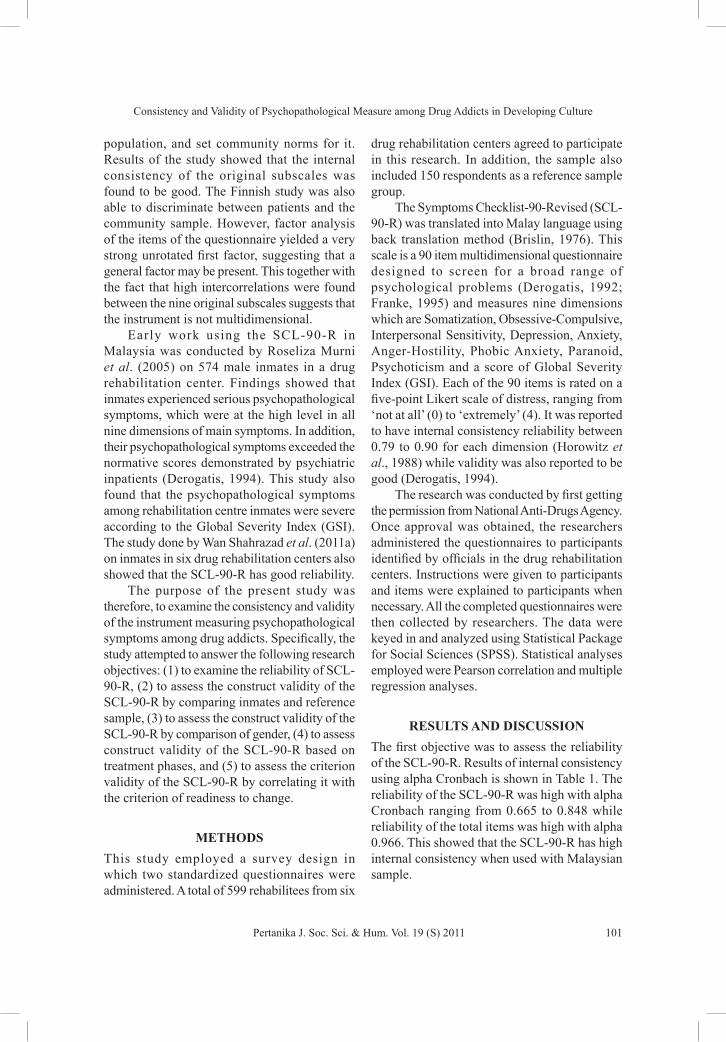
Consistency and Validity of Psychopathological Measure among Drug Addicts in Developing Culture
101Pertanika J. Soc. Sci. & Hum. Vol. 19 (S) 2011
population, and set community norms for it. Results of the study showed that the internal consistency of the original subscales was found to be good. The Finnish study was also able to discriminate between patients and the community sample. However, factor analysis of the items of the questionnaire yielded a very strong unrotated first factor, suggesting that a general factor may be present. This together with the fact that high intercorrelations were found between the nine original subscales suggests that the instrument is not multidimensional.
Early work using the SCL-90-R in Malaysia was conducted by Roseliza Murni et al. (2005) on 574 male inmates in a drug rehabilitation center. Findings showed that inmates experienced serious psychopathological symptoms, which were at the high level in all nine dimensions of main symptoms. In addition, their psychopathological symptoms exceeded the normative scores demonstrated by psychiatric inpatients (Derogatis, 1994). This study also found that the psychopathological symptoms among rehabilitation centre inmates were severe according to the Global Severity Index (GSI). The study done by Wan Shahrazad et al. (2011a) on inmates in six drug rehabilitation centers also showed that the SCL-90-R has good reliability.
The purpose of the present study was therefore, to examine the consistency and validity of the instrument measuring psychopathological symptoms among drug addicts. Specifically, the study attempted to answer the following research objectives: (1) to examine the reliability of SCL-90-R, (2) to assess the construct validity of the SCL-90-R by comparing inmates and reference sample, (3) to assess the construct validity of the SCL-90-R by comparison of gender, (4) to assess construct validity of the SCL-90-R based on treatment phases, and (5) to assess the criterion validity of the SCL-90-R by correlating it with the criterion of readiness to change.
METHODSThis study employed a survey design in which two standardized questionnaires were administered. A total of 599 rehabilitees from six
drug rehabilitation centers agreed to participate in this research. In addition, the sample also included 150 respondents as a reference sample group.
The Symptoms Checklist-90-Revised (SCL-90-R) was translated into Malay language using back translation method (Brislin, 1976). This scale is a 90 item multidimensional questionnaire designed to screen for a broad range of psychological problems (Derogatis, 1992; Franke, 1995) and measures nine dimensions which are Somatization, Obsessive-Compulsive, Interpersonal Sensitivity, Depression, Anxiety, Anger-Hostility, Phobic Anxiety, Paranoid, Psychoticism and a score of Global Severity Index (GSI). Each of the 90 items is rated on a five-point Likert scale of distress, ranging from ‘not at all’ (0) to ‘extremely’ (4). It was reported to have internal consistency reliability between 0.79 to 0.90 for each dimension (Horowitz et al., 1988) while validity was also reported to be good (Derogatis, 1994).
The research was conducted by first getting the permission from National Anti-Drugs Agency. Once approval was obtained, the researchers administered the questionnaires to participants identified by officials in the drug rehabilitation centers. Instructions were given to participants and items were explained to participants when necessary. All the completed questionnaires were then collected by researchers. The data were keyed in and analyzed using Statistical Package for Social Sciences (SPSS). Statistical analyses employed were Pearson correlation and multiple regression analyses.
RESULTS AND DISCUSSIONThe first objective was to assess the reliability of the SCL-90-R. Results of internal consistency using alpha Cronbach is shown in Table 1. The reliability of the SCL-90-R was high with alpha Cronbach ranging from 0.665 to 0.848 while reliability of the total items was high with alpha 0.966. This showed that the SCL-90-R has high internal consistency when used with Malaysian sample.

W. S. Wan Shahrazad, A. R. Roseliza Murni, Z. M. Lukman, I. Fauziah, A. Z. Zainah and Z. Arifin
102 Pertanika J. Soc. Sci. & Hum. Vol. 19 (S) 2011
TABLE 1 Alpha cronbach of SCL-90-R
Dimensions Alpha cronbachSomatization 0.848Obsessive-Compulsive 0.798Interpersonal-Sensitivity 0.798Depression 0.815Anxiety 0.836Hostility 0.763Phobia 0.687Paranoia 0.665Psychoticism 0.768Overall 0.966
The second objective was tested using t-test analysis. Results of mean difference for each dimension of psychopathology showed significant differences between inmates and the reference group with results of t-test for somatization [t(715) = 5.53, p < .05], obsessive-compulsive [t(714) = 3.87, p < .05], interpersonal-sensitivity [t(715) = 4.90, p < .05], depression [t(712) = 7.65, p < .05], anxiety [t(713) = 7.39, p < .05], hostility [t(715) = 6.84, p < .05], phobia [ t(711) = 3.97, p < .05], paranoia [t(712) = 6.80, p < .05], psychoticism [t(715) = 9.21, p < .05], and global severity index [t(697) = 7.81, p < .05]. The results are shown in Table 2.
The means of inmates were relatively higher compared with reference sample. For instance, in somatization inmates scored 1.34 compared to 0.98 for reference sample. Similarly in all other dimensions such as obsessive-compulsive the means were 1.76 for inmates and 1.52 for reference sample; interpersonal-sensitivity inmates=1.55, reference sample=1.23; depression inmates=1.57, reference sample=1.09; anxiety inmates=1.31, reference sample=0.84; hostility inmates=1.21, reference sample=0.76; phobia inmates=0.97, reference sample=0.73; paranoia inmates=1.46, reference sample=1.04; psychoticism inmates=1.29, reference sample=0.77; and global severity index inmates=1.43, reference sample=1.02.
The results showed that the mean scores of inmates were high or severe as compared to the reference sample. The same pattern was observed in the global severity index (GSI). In addition, the mean scores of inmates in all dimensions and GSI exceeded the mean scores of severity of psychiatric in-patients and out-patients. When comparison was made with the means scores of the reference sample, it was clear that the psychopathological symptoms of inmates undergoing treatment were at the high level and this indicated the severity of psychopathological symptoms that they experienced. The results are
TABLE 2 Descriptive statistics and t-test of the SCL-90-R dimensions for inmates
and reference sample
Dimens.Inmates(N=599)
Inpatient psychiatric
Outpatient psychiatric
Reference sample (N=150)
t
SOM 1.34 0.82 0.70 0.98 5.53*
O-C 1.76 1.22 1.41 1.52 3.87*
I-S 1.55 1.03 1.36 1.23 4.90*
DEP 1.57 1.41 1.59 1.09 7.65*
ANX 1.31 1.22 1.30 0.84 7.39*
HOS 1.21 0.73 1.00 0.76 6.84*
PHOB 0.97 0.71 0.65 0.73 3.97*
PAR 1.46 1.08 1.07 1.04 6.80*
PSY 1.29 0.91 0.90 0.77 9.21*
GSI 1.43 1.06 1.14 1.02 7.81*
*p < 0.05

Consistency and Validity of Psychopathological Measure among Drug Addicts in Developing Culture
103Pertanika J. Soc. Sci. & Hum. Vol. 19 (S) 2011
consistent with previous finding that showed the power of the SCL-90-R to discriminate between patients and the community (Holi et al., 1998; Bonicatto et al., 1997).
The third objective examined gender differences of psychopathological symptoms. Results of mean difference for each dimension of psychopathology showed significant differences between male inmates and female inmates with results of t-test for somatization [t(715) = 5.53, p < .05], obsessive-compulsive [t(714) = 3.87, p < .05], interpersonal-sensitivity [t(715) = 4.90, p < .05], depression [t(712) = 7.65, p < .05], anxiety [t(713) = 7.39, p < .05], hostility [t(715) = 6.84, p < .05], phobia [ t(711) = 3.97, p < .05], paranoia [t(712) = 6.80, p < .05], psychoticism [t(715) = 9.21, p < .05], and global severity index [t(697) = 7.81, p < .05]. The results are shown in Table 3.
TABLE 3 Descriptive statistics and t-test
of the SCL-90-R dimensions for male and female inmates
Dimension
Male inmates(N=490)
Female inmates (N=109)
t
SOM 1.34 0.98 5.53*
O-C 1.76 1.52 3.87*
I-S 1.55 1.23 4.90*
DEP 1.57 1.09 7.65*
ANX 1.31 0.84 7.39*
HOS 1.21 0.76 6.84*
PHOB 0.97 0.73 3.97*
PAR 1.46 1.04 6.80*
PSY 1.29 0.77 9.21*
GSI 1.43 1.02 7.81*
TABLE 4 Results of one-way analysis of variance of the SCL-90-R according to treatment phases
Dimension Phase1 Phase2 Phase3 Phase4 F
SOM 1.42 1.31 1.22 1.52 3.22*
O-C 1.82 1.79 1.56 1.89 5.27*
I-S 1.62 1.53 1.45 1.69 2.12*
DEP 1.67 1.52 1.46 1.73 3.74*
ANX 1.34 1.29 1.25 1.43 1.10HOS 1.20 1.23 1.56 1.36 1.14PHOB 0.95 0.94 0.99 1.07 0.69PAR 1.48 1.46 1.41 1.56 0.78PSY 1.31 1.26 1.22 1.50 2.99*
GSI 1.47 1.41 1.32 1.60 3.70*
*p <0.05
*p <0.05

W. S. Wan Shahrazad, A. R. Roseliza Murni, Z. M. Lukman, I. Fauziah, A. Z. Zainah and Z. Arifin
104 Pertanika J. Soc. Sci. & Hum. Vol. 19 (S) 2011
As shown in Table 3, women had higher scores than men. The means of male inmates were relatively higher compared with female inmates. For instance, in somatization male inmates scored 1.34 compared to 0.98 for female inmates. Similarly in all other dimensions such as obsessive-compulsive the means were 1.76 for males and 1.52 for females; interpersonal-sensitivity males = 1.55, females = 1.23; depression males = 1.55, females = 1.23; anxiety males = 1.55, females = 1.23; hostility males = 1.55, females = 1.23; phobia males = 1.55, females = 1.23; paranoia males = 1.55, females = 1.23; psychoticism males = 1.55, females = 1.23; and global severity index males = 1.55, females = 1.23.
The findings are consistent with studies on gender differences by Ahmad and Hammoud (2005). They said that the types of personality traits that could be considered as the predisposing factors toward addiction among women and how are they related to a person’s readiness for changing their addictive behaviors were different according to gender. Wan Shahrazad et al. (2011b) also demonstrated that there were gender differences in personality profiles which may influence the differing motivations to change among men and women.
The fourth objective aimed to answer the construct validity of the SCL-90-R by comparing psychopathological symptoms according to treatment phases. Results of one-way analysis of variance in Table 4 showed that there were significant differences of somatisation, obsessive-compulsive, interpersonal-sensitvity, depression, psychoticism, and global severity index based on treatment phases. The highest mean for somatisation was phase 4 = 1.52, for obsessive-compulsive the highest was also phase 4 = 1.89, for interpersonal-sensitivity the highest mean was also phase 4 = 1.69, for depression the highest mean was phase 4 = 1.73, for psychoticism the highest mean was phase 4 = 1.50, and for global severity index the highest mean was phase 4 = 1.60.
Finally, the fifth objective was to assess the criterion validity of the SCL-90-R by correlating it with the criterion of readiness to
change. Readiness to change was measured by the Stages of Change Readiness and Treatment Eagerness Scale (SOCRATES). Results in Table 5 showed significant correlations between all the dimensions of the SCL-90-R and SOCRATES. There were significant correlations between symptoms of obsessive-compulsive, interpersonal-sensitivity and depression with Recognition. There were also significant correlations between symptoms of obsessive-compulsive, interpersonal-sensitivity, depression, anxiety, paranoia and psychoticism with Ambivalence. Finally, only symptoms of hostility were found to be significantly negatively related to Taking Steps. This is supported by the study on readiness to change by Fauziah et al. (2010; 2011) who said that majority of the drug addicts showed a high motivational and readiness to change. However, ex-addicts should be supported to ensure they maintain continuous recovery without doubt to make changes and live free from drugs and prevent relapse.
TABLE 5 Correlations between SCL-90-R
subscales and SOCRATES
Recog. Ambiv. T. StepsSOM -.057 .075 .002O-C .103* .151* .069I-S .121* .193* .071DEP .096* .181* .054ANX .082 .109* .009HOS -.004 .022 -.132*
PHOB -.006 .031 -.065PAR .022 .083 -.056PSY .054 .129* .009
*p < .001
CONCLUSIONThe results of this study suggest that the SCL-90 is acceptable for several reasons. First, the nine subscales showed high levels of internal consistency, suggesting adequate reliability. Second, each of the subscales as well as the

Consistency and Validity of Psychopathological Measure among Drug Addicts in Developing Culture
105Pertanika J. Soc. Sci. & Hum. Vol. 19 (S) 2011
Global Severity Index (GSI) discriminated well between the reference sample and the patient samples. Third, the SCL-90-R also discriminated between male and female inmates. Fourth, the SCL-90-R showed significant differences across treatment phases. Fifth, the criterion validity was satisfactory as shown in the significant correlations between dimensions of the SCL-90-R and SOCRATES.
In conclusion, the SCL-90 appears to be a good instrument for use in a research setting, as well as clinical setting when measuring the change in average symptom levels among drug addicts. The mean GSI values and all of the nine psychopathological symptoms of drug addicts were significantly different from the reference sample and showed exceptionally higher levels even when compared to inpatient and outpatient psychiatric samples. This indicates the seriousness of psychopathological symptoms experienced by drug addicts. Future studies should attempt to determine whether these psychopathological symptoms are continuous effects from addiction to drugs. The results of this study provide insight into the validity of psychopathological symptoms experienced by drug addicts which has to be taken into consideration in designing an effective treatment program. Programs that can increase the drug addicts’ motivation to change must be specifically tailored to address the seriousness of clinical problems in drug addiction.
ACKNOWLEDGEMENTThis research has been funded by National Anti-Drugs Agency and the Faculty of Social Sciences and Humanities, Universiti Kebangsaan Malaysia. The researchers would like to express their sincere appreciation for all the support provided.
REFERENCESAhmad, H., & Hammoud, M. (2005). Addictive
behaviors amongst university students: Contributing factors, student’s perception and addiction rates. Journal of Social Sciences, 1(2), 105-113.
Bonicatto, S., Dew, M. A., Soria, J. J., & Seghezzo, M.E. (1997). Validity and reliability of Symptom Checklist ’90 (SCL90) in an Argentine population sample. Social Psychiatry and Psychiatric Epidemiology, 32(6), 332–338.
Bonynge, E. R. (1993). Unidimensionality of SCL-90-R scales in adult and adolescent crisis sample. Journal of Clinical Psychology, 49(2), 212-215.
Brislin, R. W. (1976). Comparative research methodology: Cross-cultural study. International Journal of Psychology, 11(3), 215-229.
Chung, T. (2002). Does adolescents’ readiness to change substance use behavior differ depending on profile of psychiatric comorbidity? Journal of Dual Diagnosis, 2(1), 73-88.
Clark, A., & Friedman, M. J. (1983). Factor structure and discriminant validity of the SCL-90 in a veteran psychiatric population. Journal of Personality Assessment, 47(4), 396-404.
Compton, W. M., Cottler, L. B., Jacobs, J. L., Ben-Abdallah, A., & Spitznagel, E. L. (2003). The role of psychiatric disorders in predicting drug dependence treatment outcomes. American Journal of Psychiatry, 160(5), 890-896.
Derogatis, L. R. (1992). BSI: Administration, scoring, and procedures manual—II. Towson, MD: Clinical Psychometric Research.
Derogatis, L. R. (1994). SCL-90-R: Symptom checklist-90-R administration, scoring and procedures manual (3rd ed.). Minneapolis: National Computer Systems.
Esposito-Smythers, C. (2005). Adolescent substance abuse and comorbid conditions: An integrated treatment model. The Brown University Digest of Addiction Theory and Application, 24(4), 8-8.
Eysenck, H. J. (1997). Addiction, personality and motivation. Human Psychopharmacology, 12(S2), S79-S87.
Fauziah, I., Arifin, Z., Wan Shahrazad, W. S., Lukman, Z. M., Roseliza Murni, A. R., Zainah, A. Z., & Siti Fatihah, G. (2010). Measuring motivational readiness for change among drug addicts in Malaysia: A descriptive analysis. The Social Sciences, 5(5), 429-432.
W. S. Wan Shahrazad, A. R. Roseliza Murni, Z. M. Lukman, I. Fauziah, A. Z. Zainah and Z. Arifin
106 Pertanika J. Soc. Sci. & Hum. Vol. 19 (S) 2011
Fauziah, I., Roseliza Murni, A. R., Kamaruzaman Jusoff, Wan Shahrazad, W. S., Lukman, Z. M., Arifin, Z., & Zainah, A. Z. (2011). Gender differences among drug abusers in the process of readiness to change. World Applied Sciences Journal, 12(Special Issue), 63-67.
Fauziah, I., & Kumar, N. (2009). The influence of community on relapse addiction to drug use: Evidence from Malaysia. European Journal of Social Sciences, 11(3), 471-476.
Franke, G. H. (1995). SCL-90-R: Die symptom-check-liste von derogatis - Deutsche Version. Goèttingen: Beltz Test Gesellschaft.
Hafkenscheid, A. (1993). Reliability of a standardized and expanded Brief Psychiatric Rating Scale: A replication study. Acta Psychiatrica Scandinavica, 88(5), 305–310.
Hofman N. G., & Overall, P. B. (1978). Factor structure of the SCL-90 in a psychiatric population. Journal of Consulting Clinical Psychology, 46(6), 1187-1191.
Holcomb, W. R., Adams, N. A., & Ponder, H. M. (1983). Factor structure of the Symptom Checklist-90 with acute psychiatric inpatients. Journal of Consulting Clinical Psychology, 51(4), 535-538.
Holi, M. M., Sammallahti, P. R., & Aalberg, V. A. (1998). A Finnish validation study of the SCL-90. Acta Psychiatrica Scandinavica, 97(1), 41–46.
Horowitz, L. M., Rosenberg, S. E., Bauer, B. A., Ureno, G., & Villasenor, V.S. (1988). Inventory of interpersonal problems: Psychometric properties and clinical applications. Journal of Consulting Clinical Psychology, 56(6), 885-892.
Koeter, M. W. J. (1992). Validity of the GHQ and SCL anxiety and depression scales: A comparative study. Journal of Affective Disorders, 24(4), 271-279.
McKenna, G. J., & Khantzian, E. J. (1979). Ego functions and psychopathology in narcotics and polydrug users. International Journal of Addictions, 14, 2.
McLellan, A. T., Childress, A. R., Griffith, J., & Woody, G. E. (1984). The psychiatrically severe drug abuse patient: Methadone maintenance or therapeutic community? American Journal of Drug and Alcohol Abuse, 10(1), 77-95.
McLellan, A. T., Luborsky, L., Woody, G. E., O’Brien, C. P., & Drulby K. A. (1983). Predicting response to alcohol and drug abuse treatments, role of psychiatric severity. Archives of General Psychiatry, 40(6), 620-625.
Morgan, C. D., Wiederman, M. W., & Magnus, R. D. (1998). Discriminant validity of the SCL-90 dimensions of anxiety and depression. Assessment, 5(2), 197-201.
Nunes, E. V., Donovan, S. J., Brady, R., & Quitkin, F. M. (1994). Evaluation and treatment of mood and anxiety disorders in opioid-dependent patients. Journal of Psychoactive Drugs, 26(2), 147-153.
Regier, D. A., Farmer, M. E., Rae, D. S., Locke, B. Z., Keith, S. J., Judd, L. L., & Goodwin, F. K. (1990). Comorbidity of mental disorders with alcohol and other drug abuse: Results from the Epidemiologic Catchment Area (ECA) study. The Journal of the American Medical Association, 264(19), 2511-2518.
Rief, W., & Fichter. (1992). The Symptom Check-List SCL-90-R and its ability to discriminate between dysthymia, anxiety disorders and anorexia nervosa. Psychopathology, 25(3), 128-138.
Roseliza Murni Ab. Rahman, Saedah A.Ghani, Zainah Ahmad Zamani, Wan Shahrazad Wan Sulaiman, & Arifin Hj Zainal. (2005). Psikopatologi di kalangan penagih dadah dan implikasi kepada modaliti rawatan. In Rohany Nasir, Hazita Azman, Ruzy Suliza Hashim, Mohd Yusof Hj Abdullah, & Rozmi Ismail (Eds.), Prosiding Seminar Penyelidikan Pembangunan Generasi Muda (pp. 181 -195). Bangi: Fakulti Sains Sosial & Kemanusiaan, UKM.
Schmitz, N., Hartkamp, N., & Franke, G. H. (2000). Assessing clinically significant change: Application to the SCL-90-R. Psychological Reports, 86, 263-274.
Strain, E. C., Brooner, R. K., & Bigelow, G. E. (1991). Clustering a multiple substance use and psychiatric diagnoses in opiate addicts. Drug Alcohol Dependence, 27(2), 127-134.
Wan Shahrazad, W. S., Lukman, Z. M., Roseliza Murni, A. R., Arifin, Z., Zainah, A. Z., Fauziah, I., & Siti Fatihah, G. (2010). Personality traits and readiness to change among drug addicts in Malaysia. Research Journal of Applied Sciences, 5(4), 263-266.

Consistency and Validity of Psychopathological Measure among Drug Addicts in Developing Culture
107Pertanika J. Soc. Sci. & Hum. Vol. 19 (S) 2011
Wan Shahrazad, W. S., Roseliza Murni, A. R., Lukman, Z. M., Zainah, A. Z., Kamaruzaman Jusoff, Fauziah, I., & Arifin, Z. (2011a). Psychopathological profile and readiness to change among drug addicts in Malaysia. World Applied Sciences Journal, 12(Special Issue), 29-34.
Wan Shahrazad, W. S., Lukman, Z. M., Roseliza Murni, A. R., Zainah, A. Z., Fauziah, I., & Arifin, Z. (2011b). Personality traits as predictors towards readiness to change among female drug addicts. American Journal of Applied Sciences, 8(2), 134-140.


ISSN: 0128-7702Pertanika J. Soc. Sci. & Hum. 19 (S): 109 - 114 (2011) © Universiti Putra Malaysia Press
Received: 3 May 2011Accepted: 28 July 2011*Corresponding Author
INTRODUCTIONFormer drug addicts from many countries in the world face a number of challenges in searching for employment. As part of the ‘radical’ new measures to support drug misuses reintegration into society, new world drug strategy indicated that getting former drug users into employment should be given greater priority. In Malaysia, more than 88% of drug addicts detected during January-June 2010 consist of those who have employment and careers. Addicts from the general labor sector recorded the highest number of 2,529 people (25.62%); followed by the services sector of 1,411 people (14.29%). As for other addicts, a total number of 979 people (9.92%) were registered as unemployed persons (National Anti-Drug Agency, 2010).
The detention of addicts in the Narcotics Addiction Recovery Center in Peninsular Malaysia to be treated and rehabilitated during the past two years has caused them to lose
their jobs. The challenge and dilemma faced by the majority of former addicts is to get back their previous employment. Studies conducted by some researchers (Bray, 2000; Delina and George, 1999; Sterling et al., 2001; Fauziah and Naresh Kumar, 2009), claimed that the unemployment factor is one of the causes that contributes to drug relapse among former addicts. Thus, studies to gather views and experiences of drug addicts on employment acceptance are explored.
In addition to examining whether drug users are more or less likely to be employed, some studies have explored the wider factors that facilitate or prevent employment among this group. According to a study conducted by Mahmood (2006) which involved 30 employers in Malaysia, it was found that 61.7% of employers would dismiss their employees if they were involved with drug addiction in the workplace. The results of this study indicated
Employment Barriers against People with Drug Use Histories
I. Fauziah*, M. Omar, Z. M. Lukman, K. Alavi, N. Sarnon, S. Nen and N. Subhi School of Psychology and Human Development, Faculty of Social Sciences and Humanities,
Universiti Kebangsaan Malaysia, 43600 UKM, Bangi, Selangor, Malaysia*E-mail: [email protected]
ABSTRACTUnemployment is one of the determining factors for the tendency of addicts to relapse. However, research on drug relapse due to unemployment among former addicts is still lacking and less widely studied. Therefore, this research was conducted to identify the drug addicts’ experiences of employment barriers which later force them into drug relapse. A total of 400 rehabilitees from eight Narcotics Addiction Recovery Center in Peninsular Malaysia were chosen using stratified random sampling. Data were analyzed using descriptive analyses. Results showed that many employers are still reluctant to take drug addicts as employees. Therefore, these findings suggest that further research from the perspectives of employers is needed to identify the factors of employment barriers against people with drug use histories. Such study is considered important in order to ensure former drug addicts are able to rebuild their life and be free from drugs.
Keywords: Drug relapse, employment barriers, unemployment, rehabilitation, employer acceptance

I. Fauziah, M. Omar, Z. M. Lukman, K. Alavi, N. Sarnon, S. Nen and N. Subhi
110 Pertanika J. Soc. Sci. & Hum. Vol. 19 (S) 2011
that employers would not compromise with workers found involved with substance abuse in the workplace. Inability to get a job after being released from drug rehabilitation centers and the lack of financial support to survive has led former drug addicts to return to drug addiction activities (Mc Coy and Lai, 1997).
Former drug users can also be hampered in their search for employment due to what Sutton et al. (2004) describe as social disadvantage in the form of crime and financial problems. Crime can be a barrier to employment due to the fact that many drug users engage in illegal activities, often to finance their drug use. The result is that drug users with past convictions can be very discouraging prospects to employers. Another barrier highlighted by Sutton et al. (2004) is related to drug users’ inability to deal with the stigma as former addicts. They examined how drug users struggle to establish beneficial relationships with support professionals to reestablish themselves. For example, a survey of 115 drug users conducted by the Glasgow Street Intervention Group revealed that 75% of participants perceived benefit agency and employment services staff to show a negative attitude or rejection towards them (Sutton et al., 2004).
Furthermore, poor interpersonal skills and the tendency to engage in behaviors that would be commonly unacceptable in the workplace can be highly detrimental to their employability. For example, employees who are involved with drug addiction are often associated with lower productivity, frequent absence from work, often faced health problems, and caused a high risk of workplace accidents (Glen et al., 2006; Dawson, 2003). Moreover, Kemp and Neale (2005) argue that the chaotic nature of most drug users’ lives make it very difficult for them to maintain employment.
In addition to individuals who are labeled as problematic in the workplace (Delina and George, 1999), lower educational qualification is also one of the immediate barriers to former addicts to regain their jobs after release from drug rehabilitation center (Feldman, 2002; Issacson and Brown, 2000; Shahnasarin, 2000;
Kanfer et al., 2001). Similar scenario was also observed in the case of Malaysia whereby majority (78.40%) of drug addicts detected during January-June 2010 has an education at the level of Form Three.
The study conducted by Marks (2002) and Ost (2000) found that many employers exhibit biased attitudes to former drug addicts. Some employers also pay lower wages to former addicts, and not according to the qualifications and experience that they have (Yunos, 1996; MacDonald and Pudney, 2000). This discriminatory situation has put pressure to former addicts and encourages them into drug relapse. The study conducted by Huffman and Torres (2001) also found that drug addicts have a negative perception, and often assume that their chances of getting a job are slim.
Since the employment factors are one of the critical issues to prevent relapse, the study was conducted to identify rehabilitees’ experiences on employer acceptance of former drug addicts. These findings hopefully will help the government through the National Anti-Drugs Agency to develop an effective action plan for former addicts, taking into account aspects relating to employment.
METHODSThe primary data were obtained through a survey using self-administered questionnaire. The first part of the questionnaire collected demographic information of the respondents. The second part consisted of six items created by the researchers to measure employer’s support. The respondents were asked to respond on a four scale measurement, ranging from strongly disagree to strongly agree. From the analysis, it was identified that the Cronbach alphas of all constructs exceeded Nunnally’s (1978) recommended threshold value of 0.7. Thus, the instrument used in this study showed a good level in terms of reliability. A total of 400 respondents were chosen using stratified random sampling. Questionnaires were personally distributed to the addicts who were undergoing treatment and rehabilitation in eight Narcotics

Employment Barriers against People with Drug Use Histories
111Pertanika J. Soc. Sci. & Hum. Vol. 19 (S) 2011
Rehabilitation Centers in Peninsular Malaysia and later collected by counselors from the respective centers. This procedure has achieved a high response rate (100%) for this study. This is due to the high degree of cooperation between the respondents and the centers’ counselors. The data were then analyzed using descriptive statistic through SPSS Version 15.
RESULTS AND DISCUSSIONMajority of the respondents (86%) involved in this research was aged between 30 years and above; mostly (80%) were Malays and Muslims; and in terms of marital status, 65% were single. With regards to education achievement, 91% of the respondents have Malaysian Certificate of Education, that is equivalent to O Level, and about 47% of them used to work as temporary workers.
Employer support refers to employer’s acceptance of former drug addicts as employees. The results revealed that the mean score for employer acceptance was 1.59, with a standard deviation of 0.53. The results subsequently showed that only eight respondents (2%) stated that they received a high level of support from employers (Table 1).
TABLE 1 Perceived level of employer support (n=400)
Level n % Mean SDLow (≤2.00)Moderate(2.01-3.00)High (3.01-4.00)
1702228
42.555.42.0
1.59 .53
While 222 (55.4%) of respondents stated that they received a moderate level of support, the other 170 respondents (42.5%) stated that they received a low level of support from their employers. Overall, the results showed that the majority of respondents (97.8%) surveyed received a moderate to low level of support from their employers. This situation gave the impression that most employers were not willing to employ ex-addicts to enable them to start a new life. These findings gave a negative implication towards the process of rehabilitation
among drug addicts. Based on the result of the study, ex-addicts should be given the opportunity to get an employment since recent findings found that the majority of addicts reported high percentage of motivational and initiatives in taking steps towards positive changes (Fauziah et al., 2010; Wan Shahrazad et al., 2010).
The study also revealed in Table 2 that 72% of respondents agreed and strongly agreed with the fact that they have difficulties obtaining employment due to their former drug addict status. Difficulty in getting a job after release gave a major challenge and negative impact on rehabilitation process of ex-addicts (Bray, 2000; Sterling et al., 2001). Unemployment and the lack of financial resources to earn a living may trigger conflict and strife in the family. For ex-addicts who cannot overcome such conflicts, this can lead to a tendency for relapse (Marlatt and Gordon, 1985; Fauziah and Naresh Kumar, 2009).
The study also found that about 69.8% of the respondents surveyed gave the view that employers often provided employment service that was not fair to former addicts. Meanwhile 61.5% of the respondents shared the experience that employers have not given them the opportunity to get their jobs back. The study conducted by Mc Coy and Lai (1997) found that the inability to get jobs after being released from a rehabilitation center, coupled with the lack of financial support caused former addicts to return to drug addiction. In fact, they also resorted to criminal activities like stealing for money to sustain their daily lives. This view is also supported by other studies that record drug addicts’ involvement in criminal activities as a result of employers’ reluctant to hire ex-addicts to work in their organizations (Kemp et al., 2004; Hough, 1996).
The results further identified that the majority of respondents (59.8%) agreed and strongly agreed with the view that employers paid lower wages to former drug addicts, although knowing that they have qualifications and skills. The results of this study are consistent with the views highlighted by Yunos (1996) who found that employers who took advantage

I. Fauziah, M. Omar, Z. M. Lukman, K. Alavi, N. Sarnon, S. Nen and N. Subhi
112 Pertanika J. Soc. Sci. & Hum. Vol. 19 (S) 2011
of former addicts paid a lower salary and not in accordance with their qualifications and experiences. Such biased and discriminatory attitude by employers against former addicts has led to dissatisfaction among them, and this encouraged them to quit working and relapse (Marks, 2002; Ost, 2000: Sutton et al., 2004).
The study also found that about 73.8% of respondents acknowledged that employers would terminate their jobs if they were caught involved in drugs. Most employers did not want to bear the risk of hiring drug addicts that would affect their organizations with low productivity and frequent absence from jobs (Glen et al., 2006; Dawson, 2003), often faced health problems, and causing a high risk of workplace accidents (Kemp and Neale, 2005; Sutton et al., 2004). Former addicts were also identified as those with low education levels (Feldman, 2002; Sutton et al., 2004; Issacson and Brown, 2000) thus, making them difficult to get jobs (Shahnasarin, 2001).
The study also found that 78.5% of the respondents acknowledged that many employers have no confidence in former drug addicts,
despite knowing that they have skills in technical work. While the study conducted by Hoffman and Larison (1999) found that employers’ unwillingness to hire former addicts is due to employers’ concerns over the influence of former drug addicts to form a negative culture of drug addiction in the workplace.
CONCLUSIONResearch findings illustrated the complex needs of former drug addicts and some of the challenges they faced in their everyday lives particularly in obtaining their jobs back. Therefore, this study contributed to the significant impact of coordination between drug treatment services, employment services and employers. This, combined with wider availability of support to former addicts would improve outcomes for this group. Despite the fact that most addicts have low educational background, the skills acquired while undergoing vocational rehabilitation programs for a period of two years should be given proper attention. Former addicts who have recovered can also be involved in volunteer work
TABLE 2 Drug addicts’ experiences on employers’ acceptance based on employment aspects
No Item Strongly disagreeand disagree
Agree andstrongly agree Mean
(%) (%)1 It’s hard for me to get a job because I am a
former drug addict 27.8 72 2.122 Employers often provide employment service
that is not fair to the former drug addicts 30.3 69.8 2.143 Employers do not want to give me the
opportunity to get the job back to continue a new life
38.6 61.5 2.31
4 Employers will pay lower wages to former addicts even knowing that they have the qualifications and skills of a good job
40.3 59.8 2.34
5 The employer will dismiss me from my job if they find that I am still involved in drugs 26.3 73.8 2.02
6 Most of employers are not confident to take former drug addicts to return to work within their organizations
21.6 78.5 1.98

Employment Barriers against People with Drug Use Histories
113Pertanika J. Soc. Sci. & Hum. Vol. 19 (S) 2011
by agencies and non-governmental organizations (NGOs). They can be trained and given skills as facilitators to help their friends, especially among addicts who are still trying to find the best formula on how to continue their lives free from the influence of drugs. Thus, former addicts should be given the opportunity to get employment since recent findings found that the majority of addicts reported a high percentage of motivational and initiatives in taking steps towards positive changes. These findings implied that further research from the perspectives of employers is needed to identify the factors of employment barriers against people with drug use histories. This is to ensure former drug addicts are able to rebuild their lives and be free from drugs.
REFERENCESBray, J. W. (2000). Symptoms of dependence, multiple
substance use and labor market outcomes. American Journal of Drug and Alcohol Abuse, 26(1), 77-95.
Dawson, C. (2003). Four million drugged workers? Estimates of drug-related injuries are excessive. Industrial Safety & Hygiene News, 37(5), 98.
Delina, E. M., & George, E. M. (1999). Therapy manual for drug addiction series. US: University of Pennsylvania.
Fauziah, I., & Naresh Kumar. (2009). Factors affecting drug relapse in Malaysia: An empirical evidence. Asian Social Science Journal, 5(12), 37-44.
Fauziah, I., Arifin, Z., Wan Shahrazad, W. S., Lukman, Z. M., Roseliza Murni, A. R., Zainah, A. Z., & Siti Fatihah, G. (2010). Measuring motivational readiness for change among drug addicts in Malaysia: A descriptive analysis. The Social Sciences, 5(5), 429-432.
Feldman, D. C. (2002). Career indication and vocational choices of teenagers and young adults. In D. C. Feldman (Ed.), Work carriers: A developmental perspectives (pp. 93-125). San Francisco: Jossey-Bass.
Glen, R. H., Peter, J. V., & Annette, E. F. (2006). Drugs and society. London: Jones and Bartlett Publishers.
Huffman, M. L., & Torres, L. (2001). Job search methods: Consequences for gender-based earning inequality. Journal of Vocational Behavior, 58(2), 127-141.
Hoffman, J., & Larison, C. (1999). Worker drug use and workplace drug-testing programs: Results from the 1994 national household survey on drug abuse. Contemporary Drug Problems, 26(2), 331-354.
Hough, M. (1996). Problem drug use and criminal justice: A review of the literature. Central Drugs Prevention Unit: Paper No. 15. London: Home Office
Issacson, L. E., & Brown, D. (2000). Career information, career counseling and career development (7th ed.). Needham Height: A Pearson Education Co.
Kanfer, R., Wanberg, C. R., & Kantrowitz, T. M. (2001). Job search and employment: A personality-motivational analysis and meta-analytic review. Journal of Applied Psychology, 86(5), 837-855.
Kemp, P. A., & Neale, J. (2005). Employability and problem drug users. Critical Social Policy, 25(1), 28-46.
Kemp, K., Savitz, B., Thompson, W., & Zanis, D. A. (2004). Developing employment services for criminal justice clients enrolled in drug user treatment programs. Substance Use and Misuse, 39(13), 2491-2511.
Linda, B., Gordon, H., Jennifer, M., & Colin, C. (2010). Problem drug users’ experiences of employment and the benefit system. Research Report No. 640. Norwich: Department for Work and Pensions.
MacDonald, Z., & Pudney, S. (2000). Illicit drug use, unemployment, and occupational attainment. Journal of Health Economics, 19(1), 1089-1115.
Machlan, B., Bronstrand, H. L., & Benshoff, J. J. (2004). Vocational Rehabilitation in Substance Abuse Treatment Programs. Journal of Teaching in the Addictions, 3(1), 71-80.
Marlatt, G. A., & Gordon, J. R. (1985). Relapse prevention: Maintenance strategies in the treatment of addictive behaviors. New York: Guilford Press.

I. Fauziah, M. Omar, Z. M. Lukman, K. Alavi, N. Sarnon, S. Nen and N. Subhi
114 Pertanika J. Soc. Sci. & Hum. Vol. 19 (S) 2011
Marks, A. (2002). Jobs elude former drug addicts. Chr is t ian Science Moni tor. Retr ieved April 7, 2010 from http://www.csmonitor.com/2002/0604/p02s02-ussc.html.
Mahmood, N. M. (2006). Policy and tolerance towards substance use and abuse in Malaysian organizations. International Journal on Multicultural Societies, 13(2), 41-74.
Montoya, I., & Atkinson, J. (2002). A synthesis of welfare reform policy and its impact on substance users. Journal of Drug and Alcohol Abuse, 28(1), 133-146.
Mc Coy., C. B., & Lai, S. (1997). No pain, no gain, establishing the Kunming, China, drug rehabilitation center. Journal of Drug Issues, 27(1), 73-85.
National Anti-Drug Agency. (2010). Website statistics of national drug abuse. Retrieved April 5, 2010 from http://www.adk.gov.my/utama.html.
Nunnally, J. (1978). Psychometric theory (2nd ed.). New York: McGraw-Hill.
Ost, V.W. (2000). Bias against recovered alcoholics and other drug addicts. The Van Ost Institute. Retrieved April 6, 2010 from http://www.vanostinstitute.org/drbill/db00_02_02.htm.
Shahnasarin, M. (2001). Career rehabilitation: Integration of vocational rehabilitation and career development in the twenty first century-career development industry. Career Development Quarterly. Retrieved April 5, 2010 from http://findarticles.com/p/articles/mi_m0JAX/is_3_49/ai_72703670/.
Sterling, R.C., Gottheil, E., Glassman, S. D., Weinstein, S. P., Serota, R. D., & Lundy, A. (2001). Correlates of employment: A cohort study. American Journal of Drug and Alcohol Abuse, 27(1), 137–146.
Sutton, L., Cebulla, A., Heaver, C., & Smith, N. (2004). Drug and alcohol use as barriers to employment: A review of the literature. Loughborough: CRISP, University of Loughborough.
Wan Shahrazad, W. S., Lukman, Z. M., Roseliza Murni, A. R., Arifin, Z., Zainah, A. Z, Fauziah, I., & Siti Fatihah, G. (2010). Personality traits and readiness to change among drug addicts in Malaysia. Research Journal of Applied Sciences, 5(4), 263-266.
Yunos Pathi Mohamed. (1996). Dilemma, experience and the prospect of former drug addicts. Seminar Papers from the Institute of Rehabilitation into Society, organized by the Malaysia Crime Prevention Foundation. Kuala Lumpur: Crown Princess Hotel, August 1996.

ISSN: 0128-7702Pertanika J. Soc. Sci. & Hum. 19 (S): 115 - 121 (2011) © Universiti Putra Malaysia Press
Received: 3 May 2011Accepted: 28 July 2011*Corresponding Author
INTRODUCTIONJob satisfaction can be defined as an individual’s attitude towards his work (Brayfield and Rothe, 1951). It’s a feeling of affective response to facets of situation (Smith et al., 1969). Studies on job satisfaction are important because if workers experience low job satisfaction it can have many negative impacts on the individual and the organization, such as absenteeism, decrease in performance, low commitment, and turnover (Robbins and Judge, 2007). Organizational justice relates to job satisfaction in that it influences the satisfaction experienced by the worker (Cropanzano et al., 2007). Organizational justice describes the individual’s perception of fairness of treatment received
from an organization and his behavioral reaction to such perceptions (James, 1993). Workers’ performance will be affected if they felt that they have been unjustly treated.
Organizational justice has an impact on organizations when employees perceived unfair treatment in the workplace and the outcome will be negative emotion and behavior (Latham and Pinder, 2005). Unfair treatment or injustice not only decreases job performance but also decreases quality of work and degree of cooperation among workers (Pfeffer and Langton, 1993). Researches done showed that organizational justice whether procedural or distributive justice has a significant positive relation with job satisfaction (McFairlin and
The Relationships between Organizational Justice, Organizational Citizenship Behavior and Job Satisfaction
O. Fatimah*, A. M. Amiraa and F. W. HalimSchool of Psychology and Human Development, Faculty of Social Sciences and Humanities,
Universiti Kebangsaan Malaysia, 43600 UKM, Bangi, Selangor, Malaysia*E-mail: [email protected]
ABSTRACTJob satisfaction is the most researched concept studied in industrial and organizational psychology since researches had found it to be related to factors that are important in creating a better organization. Hence the first objective of this study was to examine the relationship between organizational justice and organizational citizenship behavior with job satisfaction among secondary school teachers in Selangor, Malaysia. Secondly, it identified effects of the dimensions of organizational justice and organizational citizenship on job satisfaction. Finally this study looked at the moderating effect of organizational citizenship behavior on the relationship between job satisfaction and organizational justice. The psychometric measurement tools used for data collection were: Organization Justice Scale (OJS), Organizational Citizenship Behavior (OCB) and Minnesota Satisfaction Questionnaire (MSQ). Data collected were analyzed using Pearson correlation and multiple regressions. Results showed significant relationships between organizational justice and job satisfaction, organizational citizenship behavior and job satisfaction. Organizational justice was found to have a positive significant relationship with job satisfaction where organizational citizenship behavior acts as a moderator between the two variables.
Keywords: Job satisfaction, organizational justice, organizational citizenship behavior, teachers
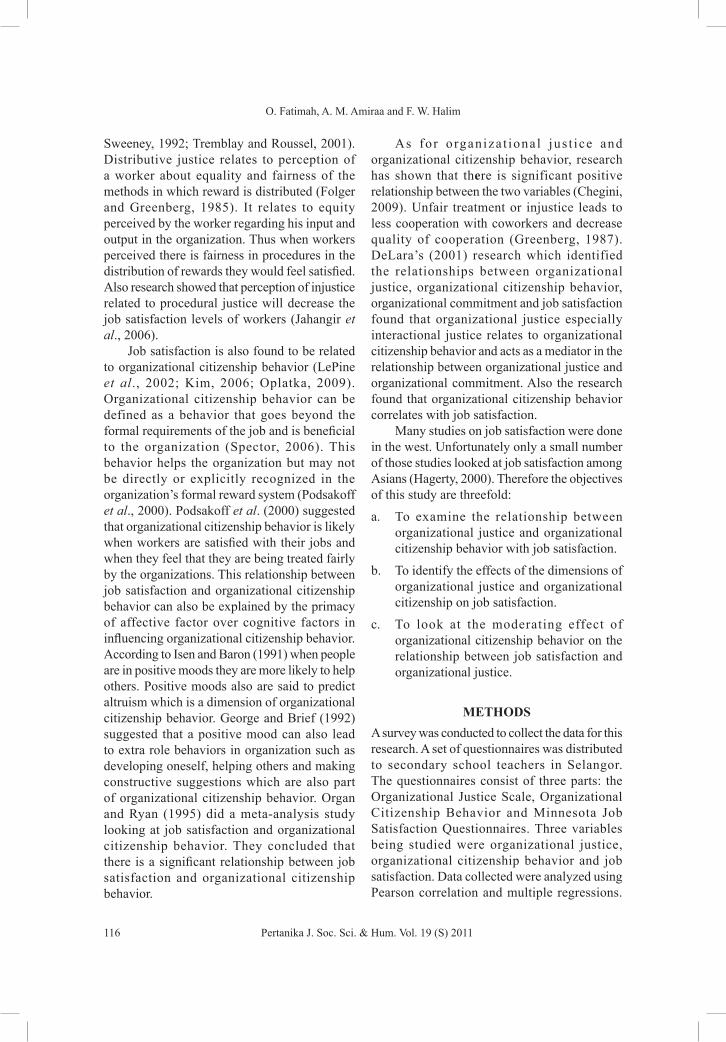
O. Fatimah, A. M. Amiraa and F. W. Halim
116 Pertanika J. Soc. Sci. & Hum. Vol. 19 (S) 2011
Sweeney, 1992; Tremblay and Roussel, 2001). Distributive justice relates to perception of a worker about equality and fairness of the methods in which reward is distributed (Folger and Greenberg, 1985). It relates to equity perceived by the worker regarding his input and output in the organization. Thus when workers perceived there is fairness in procedures in the distribution of rewards they would feel satisfied. Also research showed that perception of injustice related to procedural justice will decrease the job satisfaction levels of workers (Jahangir et al., 2006).
Job satisfaction is also found to be related to organizational citizenship behavior (LePine et al., 2002; Kim, 2006; Oplatka, 2009). Organizational citizenship behavior can be defined as a behavior that goes beyond the formal requirements of the job and is beneficial to the organization (Spector, 2006). This behavior helps the organization but may not be directly or explicitly recognized in the organization’s formal reward system (Podsakoff et al., 2000). Podsakoff et al. (2000) suggested that organizational citizenship behavior is likely when workers are satisfied with their jobs and when they feel that they are being treated fairly by the organizations. This relationship between job satisfaction and organizational citizenship behavior can also be explained by the primacy of affective factor over cognitive factors in influencing organizational citizenship behavior. According to Isen and Baron (1991) when people are in positive moods they are more likely to help others. Positive moods also are said to predict altruism which is a dimension of organizational citizenship behavior. George and Brief (1992) suggested that a positive mood can also lead to extra role behaviors in organization such as developing oneself, helping others and making constructive suggestions which are also part of organizational citizenship behavior. Organ and Ryan (1995) did a meta-analysis study looking at job satisfaction and organizational citizenship behavior. They concluded that there is a significant relationship between job satisfaction and organizational citizenship behavior.
As for organiza t ional jus t ice and organizational citizenship behavior, research has shown that there is significant positive relationship between the two variables (Chegini, 2009). Unfair treatment or injustice leads to less cooperation with coworkers and decrease quality of cooperation (Greenberg, 1987). DeLara’s (2001) research which identified the relationships between organizational justice, organizational citizenship behavior, organizational commitment and job satisfaction found that organizational justice especially interactional justice relates to organizational citizenship behavior and acts as a mediator in the relationship between organizational justice and organizational commitment. Also the research found that organizational citizenship behavior correlates with job satisfaction.
Many studies on job satisfaction were done in the west. Unfortunately only a small number of those studies looked at job satisfaction among Asians (Hagerty, 2000). Therefore the objectives of this study are threefold:
a. To examine the relationship between organizational justice and organizational citizenship behavior with job satisfaction.
b. To identify the effects of the dimensions of organizational justice and organizational citizenship on job satisfaction.
c. To look at the moderating effect of organizational citizenship behavior on the relationship between job satisfaction and organizational justice.
METHODSA survey was conducted to collect the data for this research. A set of questionnaires was distributed to secondary school teachers in Selangor. The questionnaires consist of three parts: the Organizational Justice Scale, Organizational Citizenship Behavior and Minnesota Job Satisfaction Questionnaires. Three variables being studied were organizational justice, organizational citizenship behavior and job satisfaction. Data collected were analyzed using Pearson correlation and multiple regressions.

The Relationships between Organizational Justice, Organizational Citizenship Behavior and Job Satisfaction
117Pertanika J. Soc. Sci. & Hum. Vol. 19 (S) 2011
Participants in the study were 200 secondary school teachers who were randomly selected from eight schools in Selangor, Malaysia. A total of 200 sets of questionnaires were distributed to the teachers. From the 200 questionnaires only 169 were returned and analyzed. Descriptions of questionnaires are as follows:
1. Organization Justice Scale (OJS): This scale was developed by Niehoff and Moorman (1993). It consists of 19 items to measure three dimensions of organizational justice that is distributive justice, procedural justice and interactional justice. Both distributive justice and procedural justice consist of five items while interactional justice is made up of nine items. Response to the items is based on 5 point Likert scale. High scores indicate high perception of justice in the organization and low scores indicate low perception of justice. For each of the dimension a score will be obtained and sum total of the obtained score will be considered as organizational justice. Cronbach’s Alpha for this scale was 0.927.
2. Organizational Citizenship Behavior (OCB): This scale was developed by Podsakoff and Mackenzie (1997). There are five dimensions in the scale: altruism, conscientiousness, sportsmanship, courtesy and civic virtue. Each dimension consists of four items. Therefore, the total items in the questionnaire are 20 items. Fourteen of the items are positive items (item 1,2,3,5,6,7,8,13,14,15,17,18,19 and 20) and the rest are negative items. Responses to the items are based on a 5 point Likert scale. High scores indicate high organizational citizenship behavior and low scores indicate low organizational citizenship behavior. For each dimension a score will be obtained and the sum total of the obtained score will be considered as organizational citizenship behavior. The Cronbach’s Alpha for the 20 organizational citizenship behavior item was 0.748.
3. Minnesota Satisfaction Questionnaire (MSQ): This scale was developed by Weiss et al. (1997) to measure job satisfaction. A short version consisting of 20 items was used in the study. The questions are on the 20 facets of job satisfaction. This short version is used to assess global satisfaction (both intrinsic and extrinsic satisfaction). Each MSQ item is a statement that describes a facet. The participants were asked to indicate how satisfied he was on a five point Likert scale. Total score for all the items will be considered as job satisfaction. High scores indicate high job satisfaction and low scores indicate low job satisfaction. The Cronbach’s Alpha coefficient for the scale was 0.890.
RESULTS AND DISCUSSIONResults of Pearson correlation as seen in Table 1 shows that there was a positive significant relationship between organizational justice and job satisfaction (r = 0.545, p< 0.05). The results also showed significant relationships between the procedural justice, interactional justice and distributive justice with job satisfaction.
TABLE 1 Pearson correlation analysis between
organizational justice and job satisfaction
Variables Job satisfactionOrganizational justice 0.545*
Procedural justice 0.462*
Interactional justice 0.472*
Distributive justice 0.444*
*p< 0.05
The findings showed that the higher the perception of organizational justice by the teachers the higher the job satisfaction they experienced. The research finding is consistent with what was stated by Mc Farlin and Sweeney (1992) that organizational justice is important and can produce high job satisfaction among
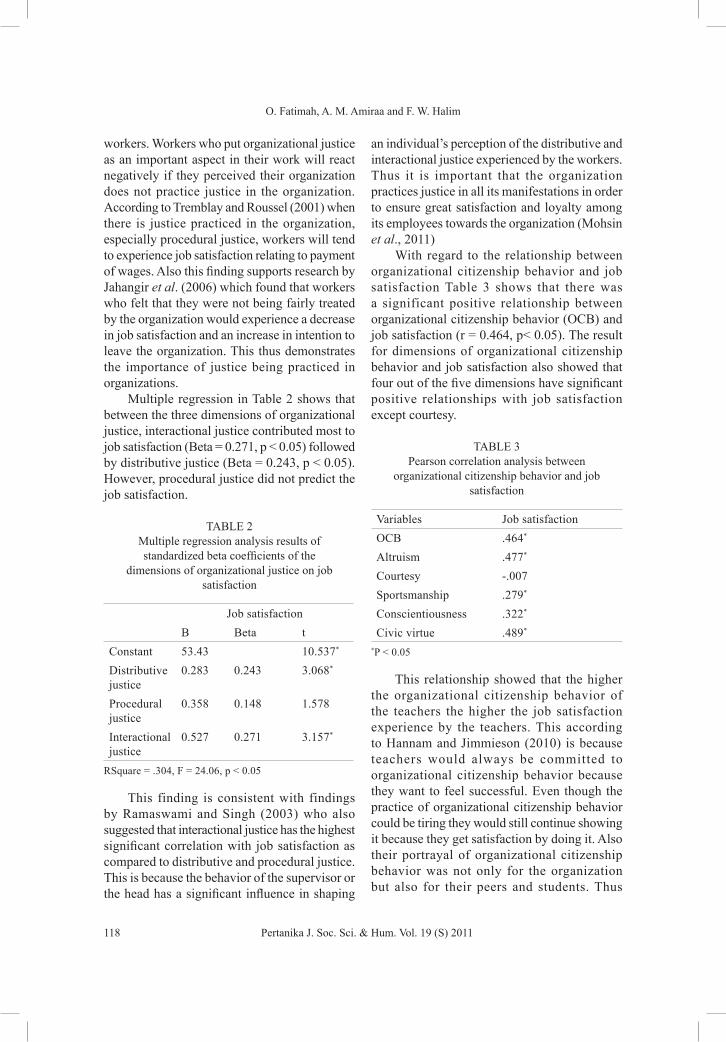
O. Fatimah, A. M. Amiraa and F. W. Halim
118 Pertanika J. Soc. Sci. & Hum. Vol. 19 (S) 2011
workers. Workers who put organizational justice as an important aspect in their work will react negatively if they perceived their organization does not practice justice in the organization. According to Tremblay and Roussel (2001) when there is justice practiced in the organization, especially procedural justice, workers will tend to experience job satisfaction relating to payment of wages. Also this finding supports research by Jahangir et al. (2006) which found that workers who felt that they were not being fairly treated by the organization would experience a decrease in job satisfaction and an increase in intention to leave the organization. This thus demonstrates the importance of justice being practiced in organizations.
Multiple regression in Table 2 shows that between the three dimensions of organizational justice, interactional justice contributed most to job satisfaction (Beta = 0.271, p < 0.05) followed by distributive justice (Beta = 0.243, p < 0.05). However, procedural justice did not predict the job satisfaction.
TABLE 2 Multiple regression analysis results of standardized beta coefficients of the
dimensions of organizational justice on job satisfaction
Job satisfactionB Beta t
Constant 53.43 10.537*
Distributive justice
0.283 0.243 3.068*
Procedural justice
0.358 0.148 1.578
Interactional justice
0.527 0.271 3.157*
RSquare = .304, F = 24.06, p < 0.05
This finding is consistent with findings by Ramaswami and Singh (2003) who also suggested that interactional justice has the highest significant correlation with job satisfaction as compared to distributive and procedural justice. This is because the behavior of the supervisor or the head has a significant influence in shaping
an individual’s perception of the distributive and interactional justice experienced by the workers. Thus it is important that the organization practices justice in all its manifestations in order to ensure great satisfaction and loyalty among its employees towards the organization (Mohsin et al., 2011)
With regard to the relationship between organizational citizenship behavior and job satisfaction Table 3 shows that there was a significant positive relationship between organizational citizenship behavior (OCB) and job satisfaction (r = 0.464, p< 0.05). The result for dimensions of organizational citizenship behavior and job satisfaction also showed that four out of the five dimensions have significant positive relationships with job satisfaction except courtesy.
TABLE 3 Pearson correlation analysis between
organizational citizenship behavior and job satisfaction
Variables Job satisfactionOCB .464*
Altruism .477*
Courtesy -.007Sportsmanship .279*
Conscientiousness .322*
Civic virtue .489*
*P < 0.05
This relationship showed that the higher the organizational citizenship behavior of the teachers the higher the job satisfaction experience by the teachers. This according to Hannam and Jimmieson (2010) is because teachers would always be committed to organizational citizenship behavior because they want to feel successful. Even though the practice of organizational citizenship behavior could be tiring they would still continue showing it because they get satisfaction by doing it. Also their portrayal of organizational citizenship behavior was not only for the organization but also for their peers and students. Thus

The Relationships between Organizational Justice, Organizational Citizenship Behavior and Job Satisfaction
119Pertanika J. Soc. Sci. & Hum. Vol. 19 (S) 2011
when teachers show organizational citizenship behavior such as responsibility towards peers and students and were being acknowledged or given credit for it they would feel satisfied in their jobs. The positive mood experienced by the teachers can lead to extra role behaviors and voluntarily contribute to the welfare of the organization and their effectiveness (Muchinsky, 2006). Findings also showed sportsmanship correlates positively with job satisfaction. This is true because relationship between coworkers and their heads are important as it can encourage cooperation among the workers themselves and can lead to satisfaction in the job. The findings also supported the research findings carried out by Foote and Tang (2008) where they found significant relationship between organizational citizenship behavior and job satisfaction.
Multiple regression in Table 4 shows that between the five dimensions of organizational citizenship behavior, altruism contributed most to job satisfaction (Beta = 0.374, p < 0.05) followed by civic virtue (Beta = 0.435, p < 0.05). The other three dimensions of organizational citizenship behavior did not contribute significantly to job satisfaction.
TABLE 4 Multiple regression analysis results of standardized beta coefficients of the
dimensions of organization citizenship behavior on job satisfaction
Job satisfactionB Beta t
Constant 49.21 10.246*
Altruism 1.300 0.374 5.564*
Courtesy -0.137 -0.054 -0.839Sportsmanship -0.192 -0.149 -1.766Conscientiousness 0.296 0.109 1.521Civic virtue 0.962 0.435 5.342*
R Square = . 386, F = 20.45, p < 0.05
This finding supports Safwat’s (1998) research which found that job satisfaction increases altruism and volunteering behavior among teachers. Organizational citizenship
behavior such as helping each other are also important to enhance job satisfaction. Apart from that relationship between the employer and employees are also important in influencing organizational citizenship behavior and job satisfaction. Thus it can be said that teachers’ organizational citizenship behavior can be influenced by their relationship with school authorities, degree of support and organizational justice which in turn will influence the level of their job satisfaction.
Organizational justice also showed to have significant positive relationship with job satisfaction when organizational citizenship behavior was used as a moderator in the relationship between the two variables (Table 5).
TABLE 5 Partial correlation between organizational
justice and job satisfaction
Moderating variable Job satisfaction
Organizational citizenship behavior
Organizational justice
0.334*
Distributive justice
0.104
Procedural justice
0.308*
Interactional justice
0.351*
*p < 0.05
From Table 5, it can be seen that although organizational citizenship behavior moderates the relationship between organizational justice and job satisfaction, it does not moderate the relationship between distributive justice and job satisfaction. Therefore, it can be said that if organizational citizenship behavior is low or negative, the relationship between organizational justice and job satisfaction will also be low. This finding support the research by LePine et al. (2002) which found that organizational citizenship behavior influenced job satisfaction when the employees perceived that the organization practiced interactional and

O. Fatimah, A. M. Amiraa and F. W. Halim
120 Pertanika J. Soc. Sci. & Hum. Vol. 19 (S) 2011
procedural justice. Thus organizational justice is not the only factor to guarantee workers’ job satisfaction.
CONCLUSIONBased on results of the present study, it can be concluded that there exist relationships between organizational justice and organizational citizenship behavior with job satisfaction. This gives implications that organizational justice and organizational citizenship behavior play important roles in influencing job satisfaction among teachers. High perception of organizational justice and high organizational citizenship behavior can enhance job satisfaction. Thus organization needs to ensure the practice of organizational justice and communicate the practice to their employees so that it can create confidence and loyalty among the employees. This will then influence workers’ organizational citizenship behavior that results in high job satisfaction.
REFERENCESBrayfield, A. H., & Rothe, H. F. (1951). An index of
job satisfaction. Journal of Applied Psychology, 35(5), 307-311.
Chegini, M. G. (2009). The relationship between organizational justice and organizational citizenship behaviour. American Journal of Economics and Business Administration, 1(2), 171-174.
Cropanzano, R., Bowen, D. E., & Gilland, S. W. (2007). The management of organizational justice. Academy of Management Perspectives, 21(4), 34-48.
De Lara, P. Z. M. (2001). Fairness, teachers’ non-task behaviour and satisfaction: The influence of group commitment. Journal of Educational Administration, 46(4), 514-538.
Folger, R., & Greenberg, J. (1985). Procedural justice: An interpretive analysis of personnel system. In K. Rowland & J. Ferris (Eds.), Research in personnel and resources management (pp. 141-183). Greenwich, CT: JAI.
Foote, D.A., & Li-ping Tang, T. (2008). Job satisfaction and organizational citizenship behaviour: Does team commitment make a difference in self-directed teams? Management Decision, 46(6), 933-947.
George, J. M., & Brief, A. P. (1992). Feeling good-doing good: A conceptual analysis of the mood at work-organizational spontaneity relationship. Psychological Bulletin, 112(2), 310-329.
Greenberg, J. (1987). Reactions to procedural injustice in payment distribution: Do the means justify the ends. Journal of Applied Psychology, 72(1), 55-61.
Hagerty, M. R. (2000). Social comparison of income in ones’ community: Evidence from national surveys of income and happiness. Journal of Personality and Social Psychology, 78(4), 764-771.
Hannam, R., & Jimmieson, N. (2010). The relationship between extra-role behaviours and job burnout for primary school teachers: A preliminary model and development of an organizational citizenship behaviour scale. Retrieved from http://www.aare.edu.au/02pap/han02173htm.
Isen, A. M., & Baron, R. A. (1991). Positive effect as a factor in organizational behaviour. Research in Organizational Behaviour, 13(1),1-53.
Jahangir, N., Akbar. M., & Begum, N. (2006). The impact of social power bases, procedural justice, job satisfaction and organizational commitment on employees’ turnover intention. South Asian Journal of Management, 13(4), 72-89.
James, K. (1993). The social context of organizational justice: Cultural, intergroup and structural effect on justice behaviour and perceptions. In R. Cropanzo (Ed.), Justice in the work place: Approaching fairness in human resource management, Erlbaum, Hillsdale, New Jersey.
Kim, S. (2006). Public service motivation and organizational citizenship behaviour in Korea. International Journal of Manpower, 27(8), 722-740.
Latham, G., & Pinder, C. (2005). Work motivation theory and research at the dawn of the twenty first century. Annual Review of Psychology, 56, 485-516.
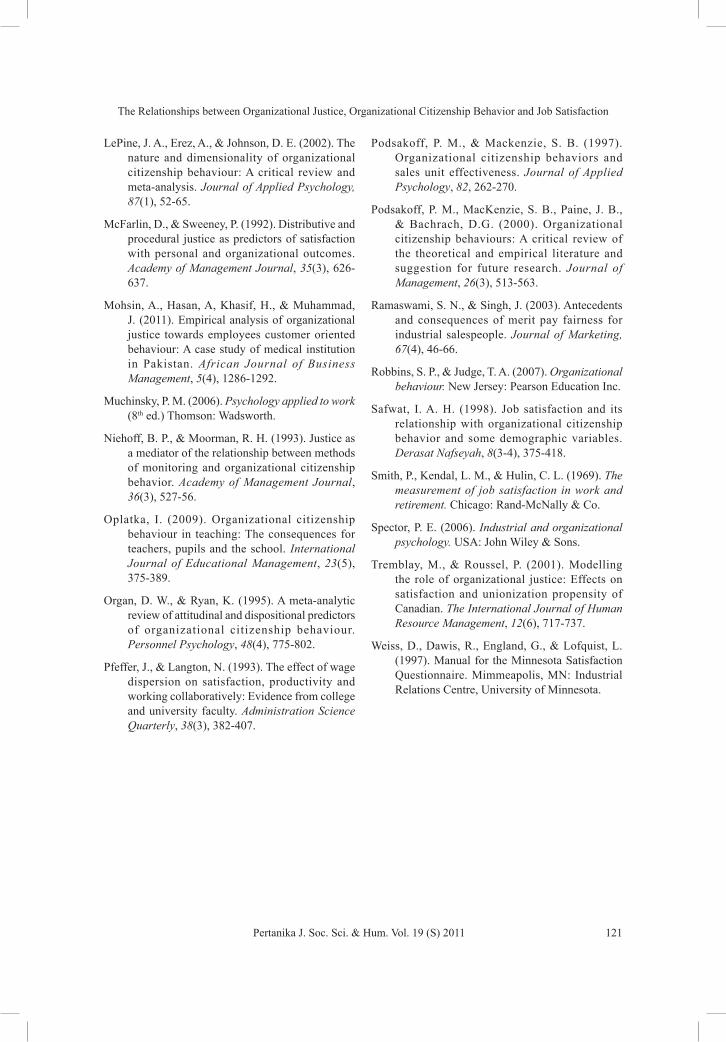
The Relationships between Organizational Justice, Organizational Citizenship Behavior and Job Satisfaction
121Pertanika J. Soc. Sci. & Hum. Vol. 19 (S) 2011
LePine, J. A., Erez, A., & Johnson, D. E. (2002). The nature and dimensionality of organizational citizenship behaviour: A critical review and meta-analysis. Journal of Applied Psychology, 87(1), 52-65.
McFarlin, D., & Sweeney, P. (1992). Distributive and procedural justice as predictors of satisfaction with personal and organizational outcomes. Academy of Management Journal, 35(3), 626-637.
Mohsin, A., Hasan, A, Khasif, H., & Muhammad, J. (2011). Empirical analysis of organizational justice towards employees customer oriented behaviour: A case study of medical institution in Pakistan. African Journal of Business Management, 5(4), 1286-1292.
Muchinsky, P. M. (2006). Psychology applied to work (8th ed.) Thomson: Wadsworth.
Niehoff, B. P., & Moorman, R. H. (1993). Justice as a mediator of the relationship between methods of monitoring and organizational citizenship behavior. Academy of Management Journal, 36(3), 527-56.
Oplatka, I. (2009). Organizational citizenship behaviour in teaching: The consequences for teachers, pupils and the school. International Journal of Educational Management, 23(5), 375-389.
Organ, D. W., & Ryan, K. (1995). A meta-analytic review of attitudinal and dispositional predictors of organizational citizenship behaviour. Personnel Psychology, 48(4), 775-802.
Pfeffer, J., & Langton, N. (1993). The effect of wage dispersion on satisfaction, productivity and working collaboratively: Evidence from college and university faculty. Administration Science Quarterly, 38(3), 382-407.
Podsakoff, P. M., & Mackenzie, S. B. (1997). Organizational citizenship behaviors and sales unit effectiveness. Journal of Applied Psychology, 82, 262-270.
Podsakoff, P. M., MacKenzie, S. B., Paine, J. B., & Bachrach, D.G. (2000). Organizational citizenship behaviours: A critical review of the theoretical and empirical literature and suggestion for future research. Journal of Management, 26(3), 513-563.
Ramaswami, S. N., & Singh, J. (2003). Antecedents and consequences of merit pay fairness for industrial salespeople. Journal of Marketing, 67(4), 46-66.
Robbins, S. P., & Judge, T. A. (2007). Organizational behaviour. New Jersey: Pearson Education Inc.
Safwat, I. A. H. (1998). Job satisfaction and its relationship with organizational citizenship behavior and some demographic variables. Derasat Nafseyah, 8(3-4), 375-418.
Smith, P., Kendal, L. M., & Hulin, C. L. (1969). The measurement of job satisfaction in work and retirement. Chicago: Rand-McNally & Co.
Spector, P. E. (2006). Industrial and organizational psychology. USA: John Wiley & Sons.
Tremblay, M., & Roussel, P. (2001). Modelling the role of organizational justice: Effects on satisfaction and unionization propensity of Canadian. The International Journal of Human Resource Management, 12(6), 717-737.
Weiss, D., Dawis, R., England, G., & Lofquist, L. (1997). Manual for the Minnesota Satisfaction Questionnaire. Mimmeapolis, MN: Industrial Relations Centre, University of Minnesota.


ISSN: 0128-7702Pertanika J. Soc. Sci. & Hum. 19 (S): 123 - 127 (2011) © Universiti Putra Malaysia Press
Received: 3 May 2011Accepted: 28 July 2011*Corresponding Author
INTRODUCTIONProcrastination is extremely prevalent and is widespread in the general population (Steel, 2007). Virtually all of us dallied with dallying. Several studies have linked procrastination to individual’s performance, with procrastinator performing poorly overall (Steel et al., 2001) and also to individual’s well being, with the procrastinator being more miserable in the long term (Lay and Schouwenburg, 1993). Procrastination has also been labeled as a troubling and dangerous phenomenon (Steel, 2007).
Procrastination is also common among students (Brownlow, 2000). According to Solomon and Rothblum (1984) as many as 50% of college students procrastinate on academic
tasks at least half of the time and additional 38% report procrastinating occasionally. This behavior is also prevalent among graduate students. The absolute amount of procrastination is considerable, with students reporting that it typically occupies one third of their daily activities, often enacted through sleeping, playing or watching TV (Pychyl et al., 2002). However between 55% and 60% of the students do want to decrease their procrastination behavior on task (Onwuegbuzie, 2004).
Procrastination is the purposeful delay of the start or completion of a task (Solomon and Rothblum, 1984). Procrastination is even considered to be an irrational delay of behavior towards an intended course of action despite expecting to be worse off caused by the delay.
Procrastination’s Relation with Fear of Failure, Competence Expectancy and Intrinsic Motivation
O. Fatimah*, Z. M. Lukman, R. Khairudin, W. S. Wan Shahrazad and F. W. Halim School of Psychology and Human Development, Faculty of Social Sciences and Humanities,
Universiti Kebangsaan Malaysia, 43600 UKM, Bangi, Selangor, Malaysia*E-mail: [email protected]
ABSTRACTThe present challenging social and economic development requires the young generation to be competitive. As such procrastination is seen as a problem that has adverse effects on them. Thus, this research aimed to look at procrastination in students. A set of questionnaires was distributed to 126 students for data collection. Data were then analyzed with t-test to see the difference between the variables in relation to gender and ethnicity. Pearson correlation was used to test the relationship between the variables. Results from the t-test showed no significant differences in all variables among subjects of different gender. However, for ethnicity t-test showed a significant difference in competence expectancy, intrinsic motivation, and fear of failure. Meanwhile there were significant negative correlations between procrastination and competence expectancy and intrinsic motivation. Also, there was a positive significant correlation between procrastination and fear of failure. In conclusion, findings showed that procrastination could be mainly related to fear of failure which can be lessened by their competence expectancy and their intrinsic motivation.
Keywords: Procrastination, students, fear of failure, competence expectancy, intrinsic motivation

O. Fatimah, Z. M. Lukman, R. Khairudin, W. S. Wan Shahrazad and F. W. Halim
124 Pertanika J. Soc. Sci. & Hum. Vol. 19 (S) 2011
Procrastination is considered a disease and it is considered to be chronic or dysfunctional when such a behavior disrupts everyday functioning by impinging on ability to work (McCown and Johnson, 1991). Consequently, procrastination may result in psychological and physical discomfort.
In academic settings, Rothblum et al. (1986) defined procrastination as the tendency to always or nearly always putting off academic tasks and always or nearly always experiencing problematic anxiety associated with procrastination. Academic procrastination can be understood as knowing that one is supposed to and perhaps even wanting to complete an academic task but failing to perform the activity within the expected or desired time frame (Senecal et al., 1995). This procrastination may contribute to missing or late assignments, anxiety during examinations and overall poor performance on tests and activities assigned for a course. Procrastination also affects the academic performance of students in terms of classroom learning and participation in activities, submission of their assignments, preparing for the examination and achievement (Hussain and Sultan, 2010).
Academic procrastination has been found to be associated with negative academic outcomes such as passing deadlines for submitting assignments, low course grades and course withdrawal. It has been identified as a substantial hindrance to academic success (Scher and Osterman, 2003). It also contributes to overall poor performance on tests and activities assigned for a course, giving up studying especially when more attractive alternatives are available (Lay and Schouwenberg, 1993).
There are many reasons associated with why students procrastinate (Solomon and Rothblum, 1984). Most reasons were related to fear of failure in relation to performance anxiety, perfectionism and lack of self confidence. However there are findings which show that fear of failure and procrastination behavior are not related (Schouwenberg, 1992), where fear of failure as a trait do not correlate with procrastination trait. Nevertheless fear of
failure in combination with some task aversion seems to be one of the principal reasons for procrastination. In other words fear of failure can lead to task avoidance particularly if the task involved is a heavy cognitive demand and is subject to evaluation. From this, it seems that procrastination is very contextual.
Motivational factors have also been found to contribute to the problem of academic procrastination. Senecal et al. (1995) have suggested that academic procrastination is a motivational problem whereby procrastinators are difficult to motivate and are likely to put off doing assignments and studying for exams until at the last minute (Tuckman, 1998). This suggests that the way students regulate their behavior can have a strong effect on academic outcomes. Self regulation concerns the way individual make use of internal and external cues to determine when to initiate, to maintain and to terminate their goal directed action. According to Rakes and Dun (2010) as intrinsic motivation to learn and effort regulation decreases procrastination increases.
Deci and Ryan’s (1985) theory of self determination distinguished four main types of motivation that exist along a self determined continuum. In this theory they distinguished between intrinsic motivation in which an individual engaged in an activity for its own sake and for the sheer pleasure it brings or because of interest. This is in contrast to extrinsic motivation which is instrumental in nature and is performed as a means to an end. They further classified extrinsic motivation into two types, namely, self determined extrinsic motivation and non self determined extrinsic motivation. Other type of motivation is characterized by the absence of intrinsic and extrinsic motivation.
R e s e a r c h e s h a v e s u g g e s t e d t h a t procrastination is an outcome that may be associated with self regulation styles in academic domain. Self regulation can have a powerful effect on academic outcomes such as persistence, performance learning and affect (Senecal et al., 1995; Vallerand et al., 1992).
In the present study, the relationship between motivational beliefs (intrinsic motivation and competence expectancy) and the students’

Procrastination’s Relation with Fear of Failure, Competence Expectancy and Intrinsic Motivation
125Pertanika J. Soc. Sci. & Hum. Vol. 19 (S) 2011
level of procrastination was examined. It was expected that procrastination would be negatively correlated with the two motivational beliefs. The relationship between the students’ procrastination and fear of failure was also measured based on context. Incidentally there should be a negative relation between fear of failure and procrastination level. Furthermore differences in studied variables between different gender and ethnic groups were explored.
METHODSSubjects were 126 students from an institute of higher education. Participation in the study was voluntary. Of the participants 67.5% are female. Most of the participants, 84% were from the second and third year students. The ages of the participants ranged from 20 to 46 years old. The subjects were made up of 82 Malays and 44 non Malays.
Participants were administered with a set of questionnaires to measure procrastination. Procrastination items were adapted from Tuckman (1991) procrastination scale TPS35 consisting of 35 items using 5 point Likert type response format which was modified from very true of me (5) to not very true of me (1). Examples of the items are “I needlessly delay finishing jobs even when they are important” and “I postpone starting things I don’t like to do”. The reliability of the scale was 0.75 in this sample.
Fear of failure measures was adapted from Elliot and Church’s (1997) performance-avoidance goal scale to measure fear of failure based on context specific factors. Here fear of failure relates to the psychology course the students attended. This scale consists of 6 items which was rated based on 5 point Likert scale. Reliability of the scale was 0.74.
Competence expectancy was assessed by two items adapted also from Elliot and Church (1997). The items were “I expected to do well in this class” and “I believe I will receive an excellent grade in this class”. Participants responded to the items based on 5 point Likert type scale from strongly agree (5), to strongly
disagree (1). Cronbach’s alpha for the scale is 0.91.
Finally intrinsic motivation was measured using an 8 item scale adapted also from Elliot and Church (1997). Item on the scale include: “I think the course is interesting” and “I think this course is fun”. Response to the item is based on a 5 point Likert type response from strongly agree (5) to strongly disagree (1). Reliability of the scale for this study is .95.
RESULTS AND DISCUSSIONThe relationships between the variables are presented in Table 1. As expected, procrastination was significantly and negatively related to intrinsic motivation and competence expectancy. However the relationship between procrastination and fear of failure showed a positive significant relationship.
TABLE 1 Intercorrelations of procrastination with
intrinsic motivation, competence expectancy and fear of failure (N = 126)
PRO IM CE FFPRO -IM -0.223* -CE -0.273* 0.465* -FF 0.374* -0.031 -0.045 -
*p < 0.05Note: PRO = procrastination; IM = intrinsic motivation; CE = competence expectancyFF = fear of failure.
Thus the present study showed that students who were motivated intrinsically reported low procrastination tendencies. These results are consistent with Senecal et al. (1995) who suggested that students who had intrinsic reasons for pursuing their studies are less likely to procrastinate. This is because the students involved and engaged in the activity for its own sake or for the pleasure derived from the experience not as a means to an end. Also it shows that students would not likely to procrastinate if they are interested genuinely in the course material.

O. Fatimah, Z. M. Lukman, R. Khairudin, W. S. Wan Shahrazad and F. W. Halim
126 Pertanika J. Soc. Sci. & Hum. Vol. 19 (S) 2011
Another reason why students with high intrinsic motivation procrastinate less may be because of the relationship between intrinsic motivation and mastery goals. Researches from achievement goal literature showed that there is a positive relationship between mastery goals and intrinsic motivation (Duda and Nicholls, 1992; Miller et al., 1993). Mastery goals seem likely to prompt the perusal of interesting material to enhance performance whereby those with mastery orientation tend to focus on improving their level of activity, becoming proficient with materials or skills or trying to thoroughly understand new information and skills. Thus they will less procrastinate in order to attain all the new information and skills.
Competence expectancy also had a negative relationship with procrastination. Competence expectancy refers to the belief of students that they could attain competence in an achievement situation and thus would orient towards the possibility of success and adopt approach achievement goals (mastery and performance approach) (Elliot and Church, 1997). This competence expectancy indirectly relates to the self efficacy of the students whereby it describes students’ belief about whether they are capable of successfully accomplishing a task, activity or assignment. Thus if students perceived that they have high competence expectancy, they would also have high regards of themselves as being able to successfully do a task which will lead them not to procrastinate since they tend to engage themselves readily in their academic tasks. This also relates to self regulation and motivational drives as suggested by Rakes and Dun (2010).
Findings from the research also showed that procrastination had a positive significant relation with fear of failure. This means that when subjects experience high fear of failure it will influence their tendency to procrastinate. This finding is congruent with that of Solomon and Rothblum’s (1984). They found that fear of failure is one of the primary reasons for students to procrastinate. In this research the
fear of failure was related to the course which was considered as context specific. Students will tend to procrastinate in doing the academic tasks when they know that they are being evaluated on. This is so because they fear for the evaluation and thus they try to prolong starting or finishing the tasks.
Analyses in this study have also shown that there were no significant differences in procrastination, intrinsic motivation, competence expectancy and fear of failure between gender. It seems that procrastination occurs equally in males and females. The same is true for intrinsic motivation, competence expectancy and fear of failure. This finding could be because all the subjects were exposed to the same conditions, thus there was no significant difference between genders. As for ethnic groups, it was found that there is significant difference in terms of intrinsic motivation (t = 2.659, p < 0.05), competence expectancy (t = 4.077, p < 0.05) and fear of failure (t = 2.029, p < 0.05). The mean calculated shows that for all the three variables except for procrastination, the Malays showed a higher mean score than the non Malays. This could be attributed to the difference in culture and upbringing between the two ethnicities.
CONCLUSIONIn conclusion results of the present study indicate that intrinsic motivation and competence expectancy are associated negatively with procrastination. Thus it is important for students to be self motivated and have a high regards for their competence which can lessen their tendencies to procrastinate. Results from the study also suggest that fear of failure in context situation will tend to increase procrastination behavior. Thus to avoid the situation of fear of failure students may try to avoid the situation in which they are to be evaluated. For this reason teachers and educators can be advised to provide students with learning environment in which comparison and competition among students should not be too obvious.

Procrastination’s Relation with Fear of Failure, Competence Expectancy and Intrinsic Motivation
127Pertanika J. Soc. Sci. & Hum. Vol. 19 (S) 2011
REFERENCESBrownlow, S. (2000). Putting off until tomorrow what
is better done today: Academic procrastination as a function of motivation towards college work. Journal of Social Behaviour and Personality, 15(5), 15-34.
Deci, E., & Ryan, R. (1985). Intrinsic motivation and self determination in human behaviour. New York: Plenum.
Duda, J. L., & Nicholls, J. G. (1992). Dimensions of achievement motivation in schoolwork and sport. Journal of Educational Psychology, 84(3), 290-299.
Elliot, A. J., & Church, M. A. (1997). A hierachical model of approach and avoidance achievement motivation. Journal of Personality and Social Psychology, 72(1), 1-24.
Irshad Hussain., & Sarwat Sultan. (2010). Analysis of procrastination among university student. Procedia Social and Behavioural Sciences, 5, 1897-1904.
Lay, C., & Schouwenburg, H. (1993). Trait procrastination, time management and academic behaviour. Journal of Social Behaviour and Personality, 8(4), 647-662.
McCown, W., & Johnson, J. (1991). Personality and chronic procrastination by university students during an academic exam period. Personality and Individual Differences, 12(5), 413-415.
Miller, R. B., Behren, J. T., Greene, B. A., & Newman, D. (1993). Goals and perceived ability: Impact on student valuing, self regulation and persistence. Contemporary Educational Psychology, 18(1), 2-14.
Onwuegbuzie, A. (2004). Academic procrastination and statistics anxiety. Assessment and Evaluation in Higher Education, 29(1), 3-19.
Pylchyl, T., Coplan, R., & Reide, P. (2002). Parenting and procrastination: Gender differences in the relations between procrastination, parenting style, and self-worth in early adolescence. Personality and Individual Differences, 33, 271-285.
Rakes, G. C., & Dun, K. E. (2010). The impact of online graduate students’ motivation and self regulation on academic procrastination. Journal of Interactive Online Learning, 9(1), 78-93.
Rothblum, E. D., Solomon, L. J., & Murakami, J. (1986). Affective, cognitive and behavioural differences between high and low procrastinators. Journal of Counselling Psychology, 33(4), 387-394.
Scher, S. J., & Osterman, N. M. (2003). Procrastination, conscientiousness, anxiety and goals: Exploring the measurement and correlates of procrastination among school-aged children. Psychology in Schools, 39(4), 385-398.
Schowenburg, H. C. (1992). Procrastinators and fear of failure: An exploration of reasons for procrastination. European Journal of Personality, 6(1), 225-236.
Senecal, C., Koestner, R., & Vallerand, R. (1995). Self regulation and academic procrastination. The Journal of Social Psychology, 135(5), 607-619.
Solomon, L. J., & Rothblum, E. D. (1984). Academic procrastination: Frequency and cognitive-behavioural correlates. Journal of Counselling Psychology, 31(4), 503-509.
Steel, P., Brothen, T. & Wambach, C. (2001). Procrastination and personality, performance, and mood. Personality and Individual Differences, 30, 95-106.
Steel, P. (2007). The nature of procrastination: A meta-analytic and theoretical review of quintessential self- regulatory failure. Psychological Bulletin, 133(1), 65-94.
Tuckman, B. W. (1998). Using tests as an incentive to motivate procrastinators to study. Journal of Experimental Education, 66(2), 141-147.
Tuckman, B.W. (1991). The development and concurrent validity of the procrastination scale. Educational and Psychological Measurement, 51(2), 473-480.
Vallerand, R., Pelletier, L., Blais, M., Briere, N., Senecal, C., & Vallieres, E. (1992). The academic motivation scale: A measure of intrinsic, extrinsic and amotivation. Education and Psychological Measurement, 52(4), 1003-1017.
Van, W. L. (2004). The relationship between procrastination and stress in the life of the high school teacher. Pretoria: University of Pretoria.


ISSN: 0128-7702Pertanika J. Soc. Sci. & Hum. 19 (S): 129 - 138 (2011) © Universiti Putra Malaysia Press
Received: 25 July 2011Accepted: 28 July 2011*Corresponding Author
INTRODUCTIONMalaysia’s experience in combating HIV/AIDS among the injecting drug user (IDU) in the past indicate the need for more effective methods instead of traditional ways (Malaysian AIDS Council-MAC and Burnet Institute, 2004; Sarnon et al., 2011). In 2005, the government announced two programs of the Harm Reduction by two methods of the Needle Syringe Exchange Program (NSEP) and the Methadone Maintenance Therapy (MMT) (Malaysian AIDS Council and Burnet Institute, 2005). The first NSEP was implemented in 2006 by the AIDS Action Research Group (AARG) in Pulau Pinang, the Pink Triangle Foundation (PTF) in Kuala Lumpur and the welfare body known as the Intan Zon Kehidupan (INTAN
LIFEZONE) in Johor Bahru. Presently, there are 240 NSEPs; 12 are on fixed sites orientation and 206 are outreach (United Nations General Assembly Special Session-UNGASS, 2010). Nowadays, the NSEP expanded to other eight states and 1.8 needles distributed to more than 12000 IDUs along with seven health centers (Kamarulzaman, 2009).
This paper concentrates only on the NSEP because of its uniqueness. The Ministry of Health in collaboration with the NGOs who provide services directly to the community administers NSEP. The NSEP is an effective program to reduce the HIV spreading among the IDUs (World Health Organization-WHO, 2004) and to enable both governments and non-governmental organizations to reach out
Characteristics of Injecting Drug Users in Needle Syringe Exchange Program (NSEP)
N. Sarnon1*, I. Baba2, M. S. Mohamad1, W. J. Wan Azreena1, Z. M. Lukman1, N. Subhi1, S. M. Hoesni1, I. Fauziah1, S. Nen1, H. M. Rusyda1
and M. A. Nur Saadah1
1School of Psychology and Human Development, Faculty of Social Sciences and Humanities, Universiti Kebangsaan Malaysia, 43600 UKM, Bangi, Selangor, Malaysia.
2School of Social Sciences, Universiti Sains Malaysia,11800 USM, Minden Penang, Malaysia *E-mail: [email protected]
ABSTRACTThis study aims to identify the intrapersonal and interpersonal characteristics of the injecting drug users (IDUs) who were involved in the Needle Syringe Exchange Program (NSEP). A total of 13 respondents took part in an in-depth semi-structured interview. Results showed that there were five intrapersonal characteristics of IDUs; (i) negative self concept, (ii) unwillingness to abstain from injecting drug, (iii) fear of being arrested, (iv) depressed, and (v) self-efficacy in practice safe injecting. The four interpersonal characteristics of IDU were (i) the practice of sharing drug paraphernalia, (ii) stigmatized by others, (iii) too dependent on case workers, and (iv) estranged relationships with family members. In conclusion, it is vital for IDUs to seek help from professionals such as social workers and psychologists for their positive survival.
Keywords: Injecting drug user (IDU), Needle Syringe Exchange Program (NSEP), harm reduction, social work

N. Sarnon et al.
130 Pertanika J. Soc. Sci. & Hum. Vol. 19 (S) 2011
drug users. Furthermore, this program has had a number of impacts in term of reducing the act of sharing injecting drug equipment and declining number of the IDUs using the “port doctors” to facilitate their drug use (e.g. supplying used needles) which initially, susceptible to HIV infection (Bernama, November 2007).
The Harm Reduction Program aims to reduce the risk associated with the use of psychoactive drugs by individuals who are unable or unwilling to stop using drug (International Harm Reduction Association-IHRA, 2010). Its goal is to focus on behavior changes among selected high-risk in order to reduce the transmission of HIV/AIDS (United Nations Office on Drugs and Crime-UNODC et al., 2004) including the IDUs. It is an effort to reduce harmful negative effects due to the drug injection behavior (MAC and Burnet Institute, 2005; De Simone, 2005). The related theories on association of behavior and network-based intervention are Theory of Reasoned Action and Theory of Planned Behavior (Ajzen and Fishbein, 1980) which describe behavior as a function of attitudes, peer norms and motivation. Whereas, the Health Belief Model (Strecher and Rosenstock, 1997) applied in individual-based interventions that contain the elements of perceived susceptibility, perceived severity, perceived barriers, perceived benefits, and self-efficacy.
Stigmatization can reduce the effectiveness of prevention and harm reduction interventions among IDUs. It affects how they are treated and prevent them from fully utilized the services offered. The IDUs also seem to enhance their own self-esteem and reinforce their own sense of ‘responsible members of society’ by being in their own group rather than with outsiders who attribute stigma behaviors on the IDUs (Simmonds and Coomber, 2009). It is common for heroin addicted individuals to distinguish themselves from the ‘out of control dope fiend’; distancing themselves in order to restrain from negative judgments of the society (Furst et al., 1999). This practice may also contribute to them militating against their
own guilt regarding their own risky behaviors, which in so doing the goal of harm reduction may be further undermined (Simmonds and Coomber, 2009). For that matter, it is important to identify the disequilibrium between the IDU and their environment (Sarnon et al., 2007). The influence of biology, psychology, and emotional process as well as social development of the client is important to be looked at (Woods and Robinson, 1996). Meanwhile, the intervention based on the psychosocial approaches should contain four principles such as who is the client real self, client’s strength and limitation, the real needs of client and what can be done to help the clients to achieve their goals (Turner, 2002). Many researchers (e.g., Braine et al., 2004; Guydish et al., 2000; Des Jarlais et al., 2000) were interested to study the IDU high-risk behaviors. Most studies emphasized on demographic characteristics and risk behaviors such as education, age, ethnics, mode of using the drug, source of income and injecting, and sexual behaviors. Only few studies (e.g., Roberts and Crofts, 2000; Rousev and Barendgregt, 2004) have looked at the characteristics of the IDUs who are involved in the NSEP, particularly in developed countries. Hence, this study aims to identify the intrapersonal and interpersonal characteristics of the IDUs in order to improve NSEP services particularly in Malaysia.
METHODSThis qualitative research is an exploratory and self-perception oriented. The method used was an in-depth interview with semi-structured questions. In this study, the respondents were thirteen hardcore drug users at One Stop Centre IKHLAS, Lorong Haji Taib Kuala Lumpur. Purposive sampling method was used to select respondents. They were among the injecting heroin users who were involved in the NSEP for more than ten months. Thematic analysis obtained the important themes about the intrapersonal and the interpersonal characteristics of the IDU.

Characteristics of Injecting Drug Users in Needle Syringe Exchange Program (NSEP)
131Pertanika J. Soc. Sci. & Hum. Vol. 19 (S) 2011
RESULTS AND DISCUSSIONThe results showed that there were five intrapersonal characteristic of the IDU who were involved in NSEP: i) negative self-concept, (ii) unwillingness to abstain from injecting drug, (iii) fear of being arrested, (iv) depressed, and (v) self-efficacy in practice safe injecting (but not in using condom).
Most of the IDUs involved in the NSEP have inferiority complex and feel stressful as drug addicts. Almost all of them had negative impression towards themselves. They lacked confidence in themselves and sometimes they felt they do not deserve to be friends with others. This study found that there were some differences between the positive HIV respondents and their counterparts in how they viewed themselves where the former showed more negativity than the latter. Previous studies (e.g., Habil and Mohd, 2003; Rahim and Herman, 1996) showed that IDUs have low self-esteem and in most cases, they blamed themselves for being drug addicts (Wynn et al., 2009). They also felt that their problems were unsolvable and will remain as such (Connors, 1994). According to Gamella (1994), feelings of despair and inferior would lead drug addicts to keep consuming drug without any effort to improve their condition.
Most of the HIV positive respondents viewed themselves as having no chance to recover. Table 1 shows the themes of reflection of the IDUs towards themselves according to their HIV status in sequence to its level of seriousness
based on respondents’ perspective. Half of them blamed themselves for being involved in drug addiction.
Another intrapersonal characteristic was the unwillingness to abstain themselves from injecting drug. Almost all of the respondents found it impossible to stop injecting themselves. Given the choice, they would rather be completely drug-free than stop injecting. Sham (the names presented in this paper are pseudonymous) explained: “rather than stopping using needles, I’d be better off by not taking drugs completely…I’m trying to change myself but for now I still can’t… I’ve been thinking to find a way out but until now I can’t find anything….” He was just not prepared to abstain from drug and found it very difficult to do so. Many respondents claimed that they wanted to quit consuming drug due to weariness of being labeled as “drug’s victim”, but it remains as a wishful thought. Previous studies have identified the fact that most of drug users would continue consuming drugs despite the awareness of its catastrophe effects (MAC and Burnet Institute, 2004). The respondents in this study confessed of their constant intention to quit drug especially when they were alone and tired of their lives. From their point of view, it is not worth to be drug addicts as they have no purpose in life. Their lives revolved around addiction and hence had to “work” hard to get money to fulfill their addiction. The activity of consuming drug had turned from being a pleasure to avoidance of withdrawal syndrome. Zack explained,
TABLE 1 Themes of personal reflection between HIV positive respondents and non-HIV respondents
HIV positive respondents Non-HIV positive respondents1. Hopelessness and giving up on life2. Self blame 3. No confidence in socializing with non drug
addicts4. Lack of confidence5. Lack of family’s support6. No family responsibility 7. No guilt of using drug
1. Lack of confidence2. No confidence in socializing with non drug
addicts3. Easily manipulated by others4. No family responsibility 5. No guilt of using drug6. No respect from family7. Self blame 8. Hopelessness and giving up on life
N. Sarnon et al.
132 Pertanika J. Soc. Sci. & Hum. Vol. 19 (S) 2011
We play with this drug, can ask any drug addicts, there will be a day that we get fed-up, unable to play. The drug doesn’t feel like drug, then it’s so tough to find money, automatically I will be fed-up. When the time comes I’ll change and stop (from using drug). Injecting drugs caused bleeding all over the body. Just like that. Sometimes it came across my mind that I had enough. Not that I never thought about it. I want to stop but don’t know how, it just can’t stop…
For this reason, they continued injecting drug even though they realized the risks and effects. The respondents did try to abstain from drug but not drastically. They had the intention to be drug free but lack of courage to do so. A respondent name Lan stated that he often thought about his uncertain future of being a drug user.
I used to think of not sharing. But because of number one (firstly), this needle lasts for sometime. I can feel it when I want to play with the needle. Injecting here and there. Even though my friend told me that playing with needles are dangerous … somehow I don’t know what will happen to me in the future…”
In addition, ten respondents claimed that they were reluctant to carry many injecting equipments (especially the needles) due to fear of being arrested by the police. This is also supported by many studies such as by Cz et al. (2007), Hien et al. (2000), Klee and Faugier (1990), and Strathdee et al. (2005). Drug users preferred to embark in a risky behavior (sharing needles) due to fear of being arrested. For example in Zaman’s case, he was placed in rehabilitation centers seven times and found the experience as “useless” and just “a waste of time”. Zack stated,
That’s how I feel. That’s the reason I don’t want to carry this thing. Sometimes in the midst of ‘work’ I got arrested. Many of my friends were arrested while riding on their motorbikes. The police stopped us not only to do simple check-up; they will also check the body. When checking (searching) the body, if they found the needles even when there was no drugs … were arrested there and then …
Therefore, they left the equipments somewhere else to prevent from being caught. Besides, they preferred to use injecting services at the ‘port’, which provided the drugs and a ‘doctor’ who helped them with injecting drugs. As Sham stated,
We all sometimes have to leave the thing … we do not bring (any) … worried to bring the needle, worried to bring it anywhere, when the police stopped us, and if they found the needle, we would get arrested … we all decided not to bring needles. We all sometimes brought or bought the drug near the port where a doctor is already there.
This study also found that there were five respondents who can be categorized as depressed considering their negative verbal expression. Among them were HIV positive individuals and those estranged by their families. They felt hopeless and deserved to die. Zaman who was stressful due to his chronic disease and without family support stated that “I don’t care anymore. My organs can be taken away. I’m useless. I give-up. If there’s anyone who needs my kidneys or even my heart, they can take it. I don’t have anything anymore. I’m not being my own self recently, I assumed I’m not human anymore…” A few of the non HIVs also felt that they were useless, “I feel useless… I do not benefit anyone…I’d rather die.”
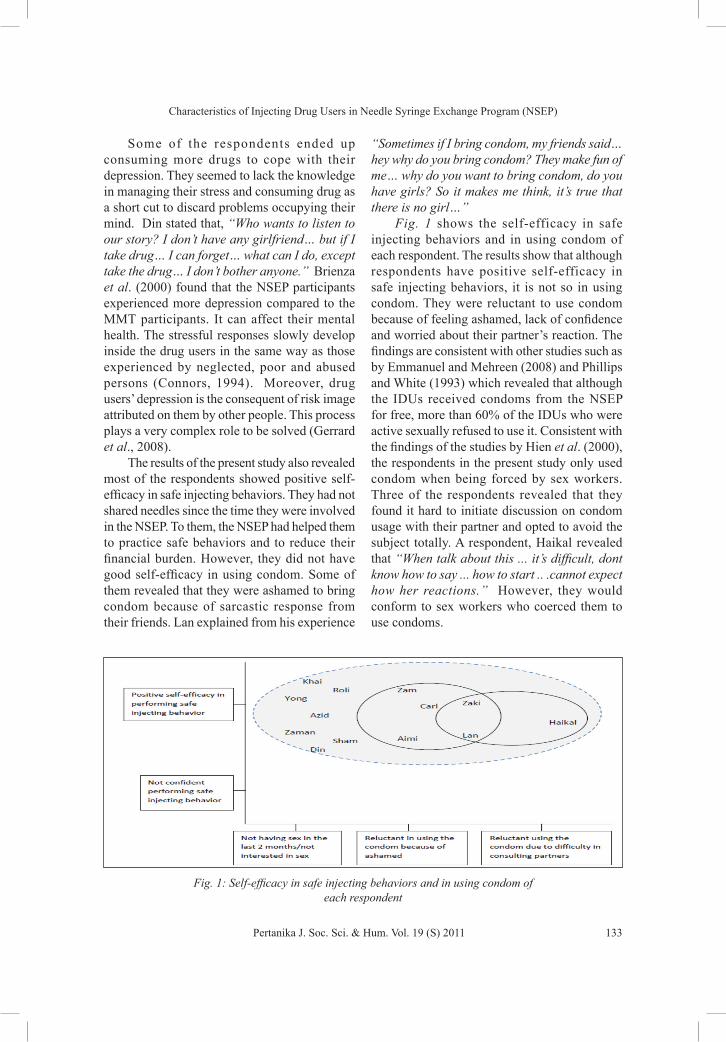
Characteristics of Injecting Drug Users in Needle Syringe Exchange Program (NSEP)
133Pertanika J. Soc. Sci. & Hum. Vol. 19 (S) 2011
Some of the respondents ended up consuming more drugs to cope with their depression. They seemed to lack the knowledge in managing their stress and consuming drug as a short cut to discard problems occupying their mind. Din stated that, “Who wants to listen to our story? I don’t have any girlfriend… but if I take drug… I can forget… what can I do, except take the drug… I don’t bother anyone.” Brienza et al. (2000) found that the NSEP participants experienced more depression compared to the MMT participants. It can affect their mental health. The stressful responses slowly develop inside the drug users in the same way as those experienced by neglected, poor and abused persons (Connors, 1994). Moreover, drug users’ depression is the consequent of risk image attributed on them by other people. This process plays a very complex role to be solved (Gerrard et al., 2008).
The results of the present study also revealed most of the respondents showed positive self-efficacy in safe injecting behaviors. They had not shared needles since the time they were involved in the NSEP. To them, the NSEP had helped them to practice safe behaviors and to reduce their financial burden. However, they did not have good self-efficacy in using condom. Some of them revealed that they were ashamed to bring condom because of sarcastic response from their friends. Lan explained from his experience
“Sometimes if I bring condom, my friends said… hey why do you bring condom? They make fun of me… why do you want to bring condom, do you have girls? So it makes me think, it’s true that there is no girl…”
Fig. 1 shows the self-efficacy in safe injecting behaviors and in using condom of each respondent. The results show that although respondents have positive self-efficacy in safe injecting behaviors, it is not so in using condom. They were reluctant to use condom because of feeling ashamed, lack of confidence and worried about their partner’s reaction. The findings are consistent with other studies such as by Emmanuel and Mehreen (2008) and Phillips and White (1993) which revealed that although the IDUs received condoms from the NSEP for free, more than 60% of the IDUs who were active sexually refused to use it. Consistent with the findings of the studies by Hien et al. (2000), the respondents in the present study only used condom when being forced by sex workers. Three of the respondents revealed that they found it hard to initiate discussion on condom usage with their partner and opted to avoid the subject totally. A respondent, Haikal revealed that “When talk about this ... it’s difficult, dont know how to say ... how to start .. .cannot expect how her reactions.” However, they would conform to sex workers who coerced them to use condoms.
Fig. 1: Self-efficacy in safe injecting behaviors and in using condom of each respondent

N. Sarnon et al.
134 Pertanika J. Soc. Sci. & Hum. Vol. 19 (S) 2011
The findings showed that there are four interpersonal characteristics among IDU who were involved in the NSEP in Malaysia, (i) the practice of sharing drug paraphernalia including lending needles for the sake of group acceptance, (ii) stigmatized by others, (iii) too dependent on NGO case workers, and (iv) estranged relationships with family members.
Most of the respondents confessed that they were happy and have a sense of belongingness when they were in a group. They shared the paraphernalia equipment and lend the needles to be accepted by the group. The interaction and activities within the group made them feel loved especially when they received none from their own families. Lending needles was also viewed as a considerate action towards friends and a way to help their friends. It is indeed a sub-culture norm which represent trust and unity towards other drug users and sharing is a must to avoid unnecessary risks among group members (Klee and Faugier, 1990).
The respondents admitted that sharing paraphernalia was a ritual activity in a group. Haikal explained, “It’s fun…when gathered with a lot of friends… sometimes even many people played with their own needles, sometimes they couldn’t inject themselves so they asked for help … then everyone shared the needles… its normal… we share everything.”
Sometimes, some of the IDUs had drugs but without sterilized needles, while some had no drug but with sterilized needles, thus they exchanged among themselves. In a group, contributing practices known as ‘payung’ is normal. Respondents admitted that they would “help” each other because others would take revenge if one refused to share (both drug and equipment). Khai said “Sometimes there is a grudge, they said used needles also can (be used). So many ways, they want to borrow from other people as long as they get that thing… don’t be stupid, damn.”
Addit ional ly, the respondents fe l t disappointed of being the target of stigmatization especially from members of the society who disapproved the government’s decision to
provide free sterilized needles to them. As Carl mentioned; “We are disgraced by outsiders … police, society… they look down on us, when the government gave us needles, they insult and are angry at us, they questioned why do they give needles to drug addicts, some are sent to rehabilitation centers but some are given needles. I told him, you have no idea actually …”
Many Malaysians have negative impression towards the NSEP (Edward, 2009, May 17). Various hypotheses and assumptions made by some of the stakeholders and members of the society that the NSEP will encourage drug addiction, a waste of money and against religious ideology.
Subsequently, the stigmatization of the society led to IDUs’ isolation and discrimination from the community. Therefore, the IDU embraced the NGO like the NSEP, which provides social support and services to them. The results showed that the respondents rely on the NSEP staff, especially the management of drug injecting. The respondents looked forward to sterilized needles provided by the NSEP and taking safety precaution into account. However, when they were running out of supply (of sterilized needles), they did not buy them from any authorized retail outlets. Instead, they continued using the contaminated needles. They also admitted to keep sharing needles if the NSEP stops providing the sterilized needles.
Moreover, most of the respondents also rely on the NSEP staff when dealing with personal problems. They also preferred to get assistance from the NSEP staff if they acquire illnesses such as fever, cough, abdominal pain and wounds rather than seeking treatment from clinic or hospital. Sometimes they expressed their feelings by complaining of various problems such as financial problems. Usually, the individuals who depend on the NGO’s services are those who are outcast by their family members and communities (Mclntyre-Mills, 2006). By receiving services from the NGOs, they feel safe, being cared for, have a sense of belongingness, respected apart from having non-judgmental friends who cared for their health and

Characteristics of Injecting Drug Users in Needle Syringe Exchange Program (NSEP)
135Pertanika J. Soc. Sci. & Hum. Vol. 19 (S) 2011
well-being. However, the researchers believed that the relationship between the IDU and their family can still be improved.
The respondents involved in the NSEP are mostly those who do not have close relationships with family members and thus lacking some ‘pillar of strengths’. They confessed on being addicted to drugs, spent more time on taking drugs rather than communicating with their family and hence affecting their relationship with family members. However, they yearn to be accepted and want to be part of their family although some of them have totally lost contact with theirs. Many respondents seemed to be sad when discussing about this matter especially when mentioning about their mother. Sham had a close relationship with his mother who already passed away and Zaman also remembered and recalled the word ‘mother’ during withdrawal syndrome. In fact, the interview session was interrupted for a short while when they became moved by the topic and they were too choked to say anything. As Zaman said, “If I miss them, I passed by the house … my grandma’s house in the village … I walked in front the house, look at the house from a distance … heard my nieces and nephews’ voices, sometimes I really want to see them like crazy … but if I’m still the same, I’m not going back…”
The act of consuming drugs is a separating factor between the drug users and their family. There were respondents who felt humiliated by their family members by calling nasty names such as a ‘beast’. However, a few respondents were lucky to be accepted by their family members. However, they had their own sense of isolation and inferiority that distant the relationship further. Carl mentioned, “They also know that I was involved with this thing but they did not bother. Its just me who wanted to be alone because I felt ashamed of myself, even my nephews are all grown up so I don’t want to be a bad example to them, so I decided to move out.” The perception of being useless and self-blamed made the IDUs felt that they were unable to perform family and community roles. When these attitudes embedded inside them, the IDUs found that it is not important to
change for a better behavior. If this issue remains unresolved, the awareness to change amongst the NSEP participants will not last long. Besides, the pressure to get drugs and financial problems would increase their stress level.
From this study, it is vital for the NSEP to provide a referral service of the IDUs to mental health professionals. Many studies suggested that the NSEP would be better if mental health services and health education programs were offered to the IDUs (Braine et al., 2004). In Malaysia, mental health services are beneficial to mental health clients such as receiving emotional support through counseling services, gaining information and practical knowledge, experiencing sense of community as well as financial aids (Mohamad et al., 2011).
The functions of the NSEP also can be enhanced and improved from only providing sterilized needles to offering aids such as health services, financial assistants, “shooting gallery” and emotional support. The researchers believe that the NSEP with fixed-site operations could extent their function by implementing the Drug Consumption Room (DCR). The DCR or the supervised injecting room is a facility for IDUs who still depend on drugs or in the process to reduce the drug intake (Rhodes et al., 2006; Strang and Fortson, 2004). This would assist the IDUs who refuse to bring injecting equipments due to fear of being arrested by the police. It is also important to promote safe self-injecting behavior and avoid needles sharing.
Besides, the IDUs need help to develop positive perception, self-esteem and motivation in themselves. The NSEP has to handle and organize every case systematically to ensure the needs of the IDUs are fulfilled. Therefore, it is suggested that the roles of social workers and counselors in the NSEP are crucial for the NSEP to run effectively.
CONCLUSIONIn conclusion, there are differences in characteristics between HIV and non-HIV respondents. The IDUs are also stigmatized by their family and society, resulting them to have
N. Sarnon et al.
136 Pertanika J. Soc. Sci. & Hum. Vol. 19 (S) 2011
high dependency on NSEP workers especially to obtain sterilized needles and sharing their personal problems. It is vital for IDUs to seek help from professionals such as social workers and psychologists for their positive survival.
REFERENCESAjzen, I., & Fishbein, M. (1980). Understanding
attitudes and predicting social behavior. Englewood Cliffs, NJ: Prentice Hall.
Bernama. (2007). 15,000 Drug Addicts Targeted For Harm Reduction Programme. 29 November 2007.
Braine, N., Des Jarlais, D. C., Ahmad, S., Purchase, D., & Turner, C. (2004). Long term effects of syringe exchange on risk behavior and HIV prevention. AIDS Education and Prevention, 16(3), 264-275.
Brienza, R. S., Stein, M. D., Chen, M., Gogineni, A., Sobota, M., Maksad, J., & Clarke, M. D. (2000). Pages depression among needle exchange program and methadone maintenance clients. Journal of Substance Abuse Treatment, 18(4), 331–337.
Connors, M. M. (1994). Stories of pain and the problem of AIDS prevention: Injection drug withdrawal and its effect on risk behavior. Medical Anthropology Quarterly New Series, 8(1), 47-68.
Cz, J. R., Gyarmathy, V. A., Neaigus, A., & Ujhelyi, E. (2007). Injecting equipment sharing and perception of HIV and hepatitis risk among injecting drug users in Budapest. AIDS Care, 19(1), 59-66.
De Simone, J. (2005). Needle exchange programs and drug injection behavior. Journal of Policy Analysis and Management, 24(3), 559-577.
Des Jarlais, C., Perlis, T., Friedman, S. R., Chapman, T., Kwok, J., Rockwell, R., & Monterosso, E. (2000). Behavioral risk reduction in a declining HIV epidemic: Injection drug users in New York City, 1990-1997. American Journal of Public Health, 90(7), 1112-1116.
Edward, A. (2009). Needle syringe exchange programme injects hope. The Star. Retrieved from http://Thestar.Com.My/News/Story.A s p ? S e c = F o c u s & F i l e = / 2 0 0 9 / 5 / 1 7 /Focus/3922295.
Emmanuel, F. E., & Mehreen, F. (2008). Coverage to curb the emerging HIV epidemic among injecting drug users in Pakistan: Delivering prevention services where most needed. International Journal of Drug Policy, 19(1), 59–64.
Furst, R. T., Johnson, B. D., Dunlap, E., & Curtis, R. (1999). The stigmatized image of the crack head: A socio-cultural exploration of a barrier to cocaine smoking among a cohort of youth in New York city. Deviant Behaviour, 20(29), 153-181.
Gamella, J. F. (1994). The spread of intravenous drug use and AIDS in a neighborhood in Spain. Medical Anthropology Quarterly, 8(2), 131-160.
Gerrard, M., Gibbons, X. F., Houlihan, A. M., Stock, M. L., & Pomery, E. A. (2008). A dual-process approach to health risk decision-making: The prototype willingness model. Developmental Review, 28(1), 29–61.
Guydish, J., Brown, C., Edgington, R., Edney, H., & Garcia, D. (2000). What are the impacts of needle exchange on young injectors? AIDS and Behavior, 4(2), 137-146.
Habil, H., & Mohd, M. A. (2003). Penyalahgunaan dadah: Hidup tak bererti, maut menanti. Kuala Lumpur: Dewan Bahasa dan Pustaka.
Hien, N. T., Giang, L. T., Binh, P. N., & Wolffers, I. (2000). The social context of HIV risk behaviour by drug injectors in Ho Chi Minh City, Vietnam. AIDS Care, 12(4), 483–495.
International Harm Reduction Association. (2010). What is harm reduction? A position statement from the International Harm Reduction Association. Retrieved from http://www.ihra.net/files/2010/08/10/Briefing-WhatisHR%28english%29.pdf
Kamarulzaman, A. (2009). Impact of HIV prevention programs on drug users in Malaysia. Journal of Acquired Immune Deficiency Syndromes, 52(1), 17-19.
Characteristics of Injecting Drug Users in Needle Syringe Exchange Program (NSEP)
137Pertanika J. Soc. Sci. & Hum. Vol. 19 (S) 2011
Klee, H., & Faugier, J. (1990). Factor associated with risk behavior among injecting drug users. AIDS Care, 2(2), 133-145.
Magura, S. (1994). Social workers should be more involved in substance abuse treatment. Health & Social Work, 19(1), 3-5.
Malaysian AIDS Council & Burnet Institute. (2004). Pandangan global terhadap HIV/AIDS & IDU. Kuala Lumpur: Universiti Malaya.
Malaysian AIDS Council-MAC, & Burnet Institute. (2005). Memahami pengurangan risiko. Kuala Lumpur: n. p.
Malaysian AIDS Council. (2011). NSEP. Retrieved from http://www.mac.org.my/v2/ what-we-do/injecting-drug-users/nsep/
McIntyre-Mills, J . J . (2006). Rescuing the enlightenment from itself: Critical and systemic implications for democracy. New York: Springer.
McIntyre-Mills, J . J . (2006). Rescuing the enlightenment from itself: Critical and systemic implications for democracy. New York: Springer.
Mohamad, S. M., Chong, S. T., Hoesni, S. M., Subhi, N., Sarnon, N., & Nen, S. (2011). Family caregiver’s experiences using community mental health services in Malaysia. e-BANGI, 6(2), 142-154.
Phillips, K., & White, D. (1993). Sexual issues and condom use among injecting drug users. AIDS Care, 5(4), 427-437.
Rahim, S. A., & Herman, I. (1996). Remaja dan AIDS: Media, nilai, personaliti dan tingkah laku. Kuala Lumpur: Ministry of Health Malaysia.
Rhodes, T., Kimber, J., Small, W., Fitzgerald, J., Kerr, T., Hickman, M., & Holloway, G. (2006). Public injecting and the need for ‘safer environment interventions’ in the reduction of drug-related harm. Addiction, 101(10), 1384-1393.
Roberts, C., & Crofts, N. (2000). Hitting up in the top end: Characteristics of needle exchange clients in Darwin. Australian and New Zealand Journal of Public Health, 24(1), 82-85.
Rousev, A., & Barendregt, C. (2004). Characteristics and risky behavior of injecting drug users in sofia effectiveness of outreach work in HIV Prevention and Harm Reduction. Research
Project of “Initiative for Health” Foundation with the assistance of the PHARE Program of European Commission. Netherlands: Erasmus Universiteit Rotterdam.
Sarnon, N., Baba, I., & Hatta, Z. A. (2007). Program pertukaran jarumdan picagari (NSEP): Cabaran mengurangkan tingkahlaku berisiko pengguna dadah secara suntikan (IDU). e-Bangi, 2(2), 16.
Sarnon, N., Baba, I., Jusoff, K., Chong, S. T., Azreena, W. J., Salina, N., Hoesni, S.M., Subhi, N., Mohamad, S. M., Fauziah, I., Lukman Z. M., & Alavi, K. (2011). Psychosocial reactions of injecting drug users (IDU) towards needle syringe exchange program in Malaysia. World Applied Sciences Journal, 12, 80-84.
Simmonds, L., & Coomber, R. (2009). Injecting drug users: A stigmatised and stigmatising population. International Journal of Drug Policy, 20, 121–130.
Strang, J., & Fortson, R. (2004). Supervised fixing rooms, supervised injectable maintenance clinics-understanding the difference. BMJ (Clinical Research Ed.), 328(7431), 102-103.
Strathdee, S. A., Fraga, W. D., Case, P., Firestone, M., Brouwer, K. C., Perez, S., & Magis, C. (2005). Vivo para consumirla y la consumo para vivir [I live to inject and inject to live]: High-risk injection behaviors in Tijuana, Mexico. Journal of Urban Health: Bulletin of the New York Academy of Medicine, 82(4), 58–73.
Strecher, V. J., & Rosenstock, I. M. (1997). The health belief model. In K. Glanz, F. M. Lewis, & B. K. Rimer (Eds.), Health behavior and health education: Research and practice (pp. 41-59). San Francisco, CA: Jossey-Bass Publishers.
Turner, F. (2002). Social workers’ desk reference. New York: Oxford University Press.
United Nations General Assembly Special Session. (2010). Ungass Country Progress Report. Reporting period: January 2008 – December 2009.
United Nations Office On Drug And Crime, International Labor Organisation & Centre for Drug Research, Universiti Sains Malaysia. (2004). HIV Prevention And Management Among Injecting Drug Users. Pulau Pinang.

N. Sarnon et al.
138 Pertanika J. Soc. Sci. & Hum. Vol. 19 (S) 2011
Woods, M .E., & Robinson, H. (1996). Psychosocial theory and social work treatment. In F. J. Turner (Ed.), Social work treatment: Interlocking theoretical approaches (4th ed). New York: The Free Press.
World Health Organization. (2004). Evidence for Action: Effectiveness of community-based outreach in preventing HIV/AIDS among injecting drug users. Geneva: World Health Organization.
Wynn, R., Karlsen, K., Lorntzsen, B., Bjerke, T. N., & Bergvik, S. (2009). Users’ and GPs’ causal attributions of illegal substance use: An exploratory interview study. Patient Education and Caunseling, 76(2), 227-232.

ISSN: 0128-7702Pertanika J. Soc. Sci. & Hum. 19 (S): 139 - 145 (2011) © Universiti Putra Malaysia Press
Received: 3 May 2011Accepted: 28 July 2011*Corresponding Author
INTRODUCTIONAwareness and strong interest have arisen in the use of personality tests for personnel selection process arising from the emergence of five-factor personality model (FFM) (Costa and McCrae, 1988; 1991). Previous studies have also proven the existence of FFM personality model to be robust predictors across different theoretical framework, using different measures of personality tests, in different cultures, as well as using the ratings obtained from various subjects (Barrick and Mount, 1991; Digman, 1990). There are also results, particularly using meta-analytic review, to suggest that personality factors (conscientiousness and emotional stability) are equally good as cognitive tests in predicting job performance (Barrick and
Mount, 1991; Barrick et al., 2001; 2005; Tett et al., 1991).
Various terminologies have been used to describe conscientiousness (Digman, 1990). Cattell (1993) defines conscientiousness as self-control while Goldberg (1993) and McCrae and Costa (2004) describe it as dependability. Emotional instability is regarded as anxiety especially by Cattell (1993). Many researchers agree that conscientiousness measures traits such as responsibility, disciplined and orderly. Whereas emotional stability measures an individual’s skills to control stress, anxiety and depression (Cattell, 1993; Goldberg, 1993; Digman, 1990; Costa and McCrae, 2004).
In the context of organization, job performance refers to the behavior, that is
Emotional Stability and Conscientiousness as Predictors towards Job Performance
F. W. Halim*, A. Zainal, R. Khairudin, W. S. Wan Shahrazad, R. Nasir and O. Fatimah
School of Psychology and Human Development, Faculty of Social Sciences and Humanities, Universiti Kebangsaan Malaysia, 43600 UKM, Bangi, Selangor, Malaysia
*E-mail: [email protected]
ABSTRACTThe predictive validity of personality traits toward proficient job performance has always been inconsistent. Thus, the purpose of this study was to determine the predictive validity of personality traits (emotional stability and conscientiousness) on job performance. This was done by distributing 16 Personality Factor Questionnaire to 450 civil servants employees. Job performance on the other hand was measured by self-reported and annual performance evaluation report received from the employer. SEM analysis was employed to test how well conscientiousness, emotional stability and job performance model fit the sample tested. SEM results confirmed the goodness-of-fit between the model and the sample. The two constructs were also predictors of job performance. It can be implied from the findings that personality traits can be used as predictors to evaluate the suitability of job applicants in personnel decision making. Future research studies can look into other indigenous traits for measure conscientiousness and emotional stability and should investigate indirect effect on job performance.
Keywords: Personality, conscientiousness, emotional stability, job performance

F. W. Halim, A. Zainal, R. Khairudin, W. S. Wan Shahrazad, R. Nasir and O. Fatimah
140 Pertanika J. Soc. Sci. & Hum. Vol. 19 (S) 2011
what the workers actually do in the context of their work and its relation to organizational goals. Job performance is also seen as actions performed by the employee in accordance with the objectives of the organization. Furthermore, job performance can be observed and measured by the efficiency and skills of individuals carrying out an assignment (Campbell, 1990; Campbell et al., 1993).
Employees who have high conscientiousness are more responsible, disciplined, reliable, and resilient and determined when carrying out the task entrusted to them. Thus they are able to maintain performance even in an environment of changing organization (Barrick and Mount, 1991). They also have a strong commitment to work, not giving up easily, aimed at motivating behavior, morale and competitive (Costa et al., 1991; Robie and Ryan, 1999). Accordingly, many researchers concluded that conscientiousness is the most prominent factor and acts as a predictor of job performance compared to other personality factors (Behling, 1998).
Emotional stability factor is the second significant predictor of job performance after conscientiousness. Employees who have high emotional stability show features of being calm, adaptable, do not like a hostile environment, self-confident, receptive and not easily depressed. A stable emotional state can help them adjust in an environment of self-knowledge workers (London and Mone, 1999), creative problem solving (Holyoak, 1991; Hatano and Inagaki, 1986), able to manage an uncertain and unpredictable environment (Hall and Mirvis, 1995), through continuous learning (Caligiuri, 2006). On the other hand, workers having low emotional stability (high concern) will show the characteristics of anxious, depressed, irritated, not confident, emotionally reactive, fear and insecure. As such, they are more vulnerable to stress at work, lack concentration, and lack skilled emotions when faced with stress at work (Barling and Boswell, 1995).
In the Western countries, meta-analytic findings indicate that emotional stability and conscientiousness significantly predict
job performance for all types of jobs (e.g., professionals, police, managers, salespeople, skilled, and unskilled). The other three FFM traits of extraversion, openness and agreeableness do not predict overall work performance. However, they only predict job performance in specific occupations or related to specific criteria and performance in the context of training and learning (Barrick and Mount, 1991; Barrick et al., 1999; Hurtz and Donovan, 2000; Salgado, 1997; Hogan and Ones, 1997; Barrick and Mount, 2001). Barrick et al. (1999) reviewed eight meta-analyses conducted since 1990 and reported that measures of conscientiousness and emotional stability predicted overall job performance with an average true score validity of 0.24 and 0.15 respectively.
Meta-analyt ical s tudies re la ted to personality as a predictor of job performance were also conducted in different cultures. The first survey was conducted in Europe by Salgado (1997) on 36 studies of the relationship between personality and job performance. The findings supported the hypotheses, namely the relationship between conscientiousness and emotional stability with job performance was r=0.25, p < 0.05 and r=0.19, p < 0.05 respectively. The study by Jiang et al. (2009) on the relationship between conscientiousness and job performance among 478 workers from middle-levels government officers in China also showed a positive correlation. Then the study by Smithikrai (2007) among 2518 employees from a variety of jobs in Thailand showed that anxiety was negatively related with job success while conscientiousness was the only personality trait that consistently predicted job success of employees across occupation. The study by Fatimah Wati (2006) on the relationship between five factor personality and job performance among 260 civil servants in Malaysia showed a positive correlation of conscientiousness (r=0.42, p<0.05) but no relationship between emotional stability (r = -0.10, p<0.05) with job performance.
In general, past results pertaining to conscientiousness and emotional stability have proven that they can be significant predictors to

Emotional Stability and Conscientiousness as Predictors towards Job Performance
141Pertanika J. Soc. Sci. & Hum. Vol. 19 (S) 2011
performance. Nevertheless, the consistencies of validity between these two factors as predictors are mixed. For example, most studies in the West show that conscientiousness could predict job performance much better than emotional stability (Barrick et al., 1999). In contrast, Tett et al.’s (1991) and Salgado’s (1997) study show that emotional stability is the better predictor, followed by conscientiousness.
H o w e v e r , t h e p r e d i c t a b i l i t y o f conscientiousness and emotional stability on job performance has not been studied much in Asian countries (Smithikrai, 2007). Salgado (1997) stated that it is possible that in other countries with cultural and organizational characteristics that differ from the United States and Canada, the Big Five may present different relations with job performance criteria. Moreover, recruitment and selection practices in the United States and Canada might be different from those in Malaysia because of cultural contextual difference, such as power distance, and also due to the typical differences of hierarchical and bureaucratic organization between Malaysia and the West (Robbins and Judge, 2009). This leads to the objective of the present study to investigate the predictability of conscientiousness and emotional stability on job performance. The aim of the study is also to determine which of the two predictors is the best toward job performance.
METHODSIn this study, data were collected from 450 middle level civil servant officers from a training institution in Malaysia. Among these participants, 269 were males, and 154 were females, with an average age of 40.85 and work experiences of 18.25 years. Respondents comprised of 390 Malays, 35 Chinese, 18 Indians, and 7 other ethnicities with 86.9% of them having higher education. Two standardized questionnaires were used to measure and they were:
1. The 16 Personality Factor Questionnaire (16PF) Fifth Edition. This questionnaire consists 185 items that yields subscale scores for each of the five major dimensions
of normal personality. The five global scales give an overview of an individual’s personality makeup at a broad level of functioning while the more specific primary scale provide an in-depth picture of the individual’s unique personality dynamic (Cattell and Schuerger, 2003). However, for the purpose of this study only two global scales were chosen which was conscientiousness and emotional stability. The primary traits of conscientiousness consist of rule-consciousness (G+), perfectionism (Q+), liveliness (F-) and abstractedness (M-) which include 42 items. The primary traits of emotional stability consist of emotional stability (C-), vigilance (L+), apprehension (O+) and tension (Q4+) which include 40 items. Therefore, only 82 items were selected from the 185 items of the original questionnaire.
The 16PF was translated (Fatimah Wati, 2010) into Malay using Brislin’s (1976) back translation method. Participants responded to the 16PF items using a three-point Likert scale. Alpha estimates for the Malay version based on 450 adults were lively (F) = 0.71, rule-consciousness (G) = 0.86, abstractness (M) = 0.81, perfectionism (Q3) = 0.86, emotionality stability (C) = 0.74, vigilance (L) = 0.76, apprehension (O) = 0.70, tension (Q4) = 0.70, dominance (E) = 0.71, social boldness (H) = 0.80 and openness to change (Q1) = 0.70.
2. Job performance measure was based on the self-report and annual performance evaluation report received from the employer in the form of overall job performance score (e.g 70, 80, or 90). Participants were also asked to report their ability to produce the best performance based on eight items constructed from job performance criteria as suggested by Borman and Motowidlo (1993; 1997). Four items were developed for task performance (essential/primary), while four other items were related to contextual performance. Items related to task performance were skills in a range of tasks, verbal and written

F. W. Halim, A. Zainal, R. Khairudin, W. S. Wan Shahrazad, R. Nasir and O. Fatimah
142 Pertanika J. Soc. Sci. & Hum. Vol. 19 (S) 2011
communication skills, supervisory skills and leadership, and finally, managerial and administrative skills. The items that measured contextual performance were items related to organizational citizenship behaviors (such as altruism, economic, civic good, courtesy and teamwork), several aspects of organizational spontaneity (such as helping co-workers and protect the organization), personal initiative and taking action (taking charge).
Participants responded to each item using a six-point Likert-type scale ranging from 1 (poor) to 6 (excellent). Alpha estimates were 0.88 for both task and contextual performance. Data were analyzed structural equation modeling (SEM) approach as recommended by Hair et al. (2006).
RESULTS AND DISCUSSIONThe proposed model was utilized to identify the direct effects of conscientiousness and emotional stability on job performance. Results in Table 1 showed that the proposed model for conscientiousness and emotional stability were significant predictors of job performance. All the goodness of fit indices of the model also met the recommended values as suggested by Hair et al. (2006).
TABLE 1 Results of goodness-of-fit index
Fit index Recommended value
Observed value
Chi-square/degree of freedom
≤ 3.00 2.40
GFI ≥ 0.90 0.967AGFI ≥ 0.80 0.940TLI ≥ 0.90 0.978CFI ≥ 0.90 0.986RMSEA ≤ 0.06 or ≤ 0.08 0.056
Results as shown in Fig. 1 found that conscientiousness and emotional stability (anxiety) have direct impacts on job performance. The proposed structural model showed that 11%
variance of job performance were explained by conscientiousness and emotional stability. Conscientiousness was significantly related with job with path coefficient 0.35 (critical ratio value = 2.18, p< 0.05). Therefore, this means that conscientiousness has a significant positive direct effect on job performance. This indicated that employees who have higher scores in conscientiousness scored higher in job performance. Next, SEM analysis indicated that perfectionism (Q3) trait has the highest loading (λ = 0.89, R2 = 0.80, p < 0.001) on conscientiousness, followed by abstractedness (M-) trait with a loading of λ = -0.89, R2 = 0.79, p < 0.001, liveliness (F-), λ =-0.82, R2= 0.67, p < 0.001, rule-consciousness (G), λ = 0.65, R2 = 0.86, p < 0.001, emotional stability (C-) trait, λ = -0.55, R2 = 0.30 , p < 0.001, and tension (Q4), λ = 0.40, R2 = 0.16, p < 0.001 respectively.
Results in Fig. 1 also showed that there was a significant direct path between emotional stability and job performance with path coefficient = -0.58 (critical ratio value =-2.78, p < 0.05). The results showed that emotional stability was the higher predictor of job performance. The results also indicated that vigilance (L) trait has the highest loading (λ = 0.82, R2 = 0.67, p < 0.001) on anxiety, followed by apprehension (O) trait with a loading of λ = -0.73, R2 = 0.54, p < 0.001, tension (Q4) trait, λ = 0.40, R2= 0.16, p < 0.001 and emotional stability (C-), λ = -0.27, R2 = 0.07, p < 0.001 respectively.
The main results of this study have shown the goodness-of-fit between the model of conscientiousness and emotional stability with job performance of public servants in Malaysia. The result provided some support for Smithikrai’s (2007) and Tyle and Newcombe’s (2006) findings where they have found that emotional stability can predict job performance better than conscientiousness in Asian countries. This is contrary to Barrick et al.’s (1999) and Salgado’s (1997) results where they suggested that in the West, conscientiousness is the most significant predictor for job performance, followed by emotional stability.
Civil servants officer who have higher emotional stability described themselves as

Emotional Stability and Conscientiousness as Predictors towards Job Performance
143Pertanika J. Soc. Sci. & Hum. Vol. 19 (S) 2011
trusting, unsuspecting and accepting (L-). They were also self-assured, unworried and complacent (O), relaxed, placid and patient (Q4) and emotionally stable, adaptive and mature (C+). All these traits contributed to high job performance especially on task performance, followed by contextual performance and supervisory assessment. This is contradictory to those who have low emotional stability. These individuals described themselves as vigilant, suspicious, and skeptical (L+). They were also apprehensive, self-doubting, and worried (O+), tense, high energy, impatient and driven (Q4+), reactive and emotionally changeable (C-). Consequently, these individuals portrayed lower job performance especially on task performance, contextual performance and supervisory assessment.
Civil servant officers who were high in conscientiousness described themselves as perfectionist, organized, self disciplined (Q3+), grounded, practical and solution-oriented (M-). They were also serious, restrained, careful (F-), rule-conscious and dutiful (G+). At the
same time the officers were tensed, possessed high energy, impatient and driven (Q4+), reactive and emotionally changeable (C-). However, civil servant officers who were low in conscientiousness described themselves as tolerable to disorder, unexacting and flexible (Q3-), abstracted, imaginative and idea-oriented (M+). They were also lively, animated and spontaneous (F+), as well as expedient and nonconforming (G-). The traits resulted in low job performance that included task performance, contextual performance, and supervisory assessment. Therefore, the results showed that emotional stability and conscientiousness model can be applied in a local context and personality measurement tools can be used as predictors to evaluate the suitability of job applicants in personnel decision making.
CONCLUSIONIn conclusion, the results of this study provided further support for the role of conscientiousness and emotional stability in predicting job
Fig. 1: Structural model on direct effects of conscientiousness and emotional stability on job performance

F. W. Halim, A. Zainal, R. Khairudin, W. S. Wan Shahrazad, R. Nasir and O. Fatimah
144 Pertanika J. Soc. Sci. & Hum. Vol. 19 (S) 2011
performance. The results can be used to imply that selection process should take into account candidates with personality that exhibit high conscientiousness and emotional stability traits to ensure that they can then perform well in the job. It is worth to suggest that future research should focus on other than Cattell’s four traits to measure conscientiousness and emotional stability. For example, studies can look into other traits like indigenous traits that may well measure conscientiousness and emotional stability. Furthermore, future research should not only examine direct effect (mechanism) of personality traits but also the indirect ones in relation to job performance.
REFERENCESBarling, J., & Boswell, R. (1995). Work performance
and achievement-striving and impatience varability dimension of Type A behaviors. Applied Psychology: An International Review, 44(2), 143-153.
Barrick, M. R., & Mount, M. K. (1991). The big five personality dimensions and job performance: A meta-analysis. Personnel Psychology, 44(1), 1-26.
Barrick, M. R., Mount, M. K., & Judge, T. A. (1999). The FFM personality dimensions and job performance: A meta-analysis of meta-analyses. Paper presented at the 14th Annual Conference of the Society for Industrial and Organizational Psychology. Atlanta, GA.
Barrick, M. R., Mount, M. K., & Judge, T. A. (2001). The FFM personality dimensions and job performance: Meta-Analysis of meta-analyses. International Journal of Selection and Assessment, 9(Special Issue), 9-30.
Barrick, M. R., Parks, L., & Mount, M. K. (2005). Self-monitoring as a moderator of the relationship between personality traits and performance. Personnel Psychology, 58(3), 745-767.
Behling, O. (1998). Employee selection: Will intelligence and conscientiousness do the job? Academy of Management Executive, 12(1), 77-86.
Borman, W. C., & Motowidlo, S. J. (1993). Expanding the criterion domain to include elements of contextual performance. In N. Schmitt & W. C. Borman (Eds.), Personnel selection (pp. 71-98)San Francisco: Josey-Bass.
Borman, W. C., & Motowidlo, S. J. (1997). Task performance and contextual performance: The meaning for personnel selection research. Human Performance, 10(2), 99-110.
Brislin, R. W. (1976). Comparative research methodology: Cross-cultural study. International Journal of Psychology, 11(3), 215-229.
Caligiuri, P. (2006). Global leadership development. Human Resource Management Review, 16(2), 219–228.
Campbell, J. P. (1990). Modeling the performance pred ic t ion p rob lem in indus t r i a l and organizational psychology. In M. D. Dunnette & L. M. Hough (Eds.), Handbook of industrial and organizational psychology, 2 (pp. 687-732). Palo Alto, CA: Consulting Psychology.
Campbell, J. P., McCloy, R. A., Oppler, S. H., & Sager, C. E. (1993). A theory of performance. In N. Schmitt, W. C. Borman & Associates (Eds.), Personnel selection in organizations (pp. 35-70). San Francisco: Jossey-Bass.
Cattell, R. B., Cattell, A. K., & Cattell, H. E. P. (1993). Sixteen personality factor fifth edition questionnaire. Champaign, IL: Institute for Personality and Ability Testing.
Cattell, H. E. P., & Schuerger, J. M. (2003). Essentials of 16PF assessment. USA: Wiley.
Costa, P. T. Jr., & McCrae, R. R. (1988). From catalog to classification: Murray’s needs and the Five-Factor Model. Journal of Personality and Social Psychology, 55(2), 258-265.
Costa, P. T. Jr., McCrae, R. R., & Dye, D. A. (1991). Facet scales for agreeableness and conscientiousness: A revision of the NEO Personality Inventory. Personality and Individual Differences, 12(9), 887-898.
Digman, J. M. (1990). Personality structure: Emergence of the five-factor model. Annual Review of Psychology, 41, 417-440.

Emotional Stability and Conscientiousness as Predictors towards Job Performance
145Pertanika J. Soc. Sci. & Hum. Vol. 19 (S) 2011
Fatimah wati Halim, & Arifin Zainal. (2010). Analisis pengesahan faktor personaliti super factor utama. Jurnal Psikologi, 24, 13-30.
Fatimah wati Halim. (2006). Peranan personaliti global untuk mengenalpasti pengupayaan dan membangunkan komuniti pekerja di kalangan pegawai tentera dan guru. Prosiding Seminar Psikologi Pembangunan Komuniti ISM-UKM: Pendekatan Psikososial Dalam Pemerkasaan Pembangunan Komuniti.
Goldberg, L. R. (1993). The structure of phenotypic personality traits. American Psychologist, 48(1), 26-34.
Hair, J. F., Black, W. C., Babin, B. J., Anderson, R. E., & Tatham, R. L. (2006). Multivariate data analysis (6th ed.). New Jersey: Pearson Education, Inc.
Hall, D. T., & Mirvis, P. H. (1995). The new career contract: Developing the whole person at midlife and beyond. Journal of Vocational Behavior, 47(3), 269-289.
Hatano, G., & Inagaki, K. (1986). Two courses of expertise. In H. A. H. Stevenson, & K. Hakuta (Ed.), Child development and education in Japan (pp. 262-272). New York: Freeman.
Hogan, J., & Ones, D. S. (1997). Conscientiousness and integrity at work. In R. Hogan, J. Johnson, & S. Briggs (Eds.), Handbook of personality psychology (pp. 849-870). San Diego, CA: Academic Press.
Holyoak, K. J. (1991). Symbolic connectionism: Toward third-generation theories of expertise. In K. A. Ericsson, & J. Smith (Eds.), Toward a general theory of expertise: Prospects and limits (pp. 301-355). Cambridge, England: Cambridge University Press.
Hurtz, G. M., & Donovan, J. J. (2000). Personality and job performance: The big five revisited. Journal of Applied Psychology, 85(6), 869–879.
Jiang, C., Wang, D., & Zhou, F. (2009). Personality traits and job performance in local Government Organizations in China. Social Behaviour and Personality, 37(4), 451-458.
London, M., & Mone, E. M. (1999). Continuous learning. In D. R. Ilgen, & D. E. Pulakos (Eds.), The changing nature of performance: Implication for staffing, motivation, and development (pp. 119-153). San Francisco, CA: Jossey-Bass.
McCrae, R. R., & Costa, P. T. (2004). A contemplated revision of the NEO Five-Factor Inventory. Personality and Individual Differences, 36(3), 587–596.
Robbins, S. P., & Judge. (2009). Organizational behaviour (13th ed). New Jersey: Pearson Prentice Hall.
Robie, C., & Ryan, A. M. (1999). Effects of nonlinearity and heteroscedasticity on the validity of conscientiousness in predicting overall job performance. International Journal of Selection and Assessment, 7(3), 157-169.
Salgado, J. F. (1997). The five factor model of personality and job performance in the European community. Journal of Applied Psychology, 82(1), 30-43.
Smithikrai, C. (2007). Personality traits and job success: An investigation in a Thai sample. International Journal of Selection and Assessment, 15(1), 134–138.
Tett, R. P., Jackson, D. N., & Rothstein, M. (1991). Personality measures as predictors of job performance: A meta-analytic review. Personnel Psychology, 44(4), 703-742.
Tyler, G., & Newcombe, P. (2006). Relationship between work performance and personality traits in Hong Kong organizational settings. International Journal of Selection & Assessment, 14(1), 37-50.


ISSN: 0128-7702Pertanika J. Soc. Sci. & Hum. 19 (S): 147 - 155 (2011) © Universiti Putra Malaysia Press
Received: 3 May 2011Accepted: 28 July 2011*Corresponding Author
INTRODUCTIONMuch of research regarding professionals’ experiences of working with sexually abused victims focuses on the psychological impacts as a result of interaction and/or exposure to trauma material, known as vicarious traumatization (VT). VT is a term specifically used to describe cumulative effects of working with traumatized clients, which consists of short and long term effects (Morrison, 2007). VT as described by Pearlman and Saakvitne (1995) includes therapists experiencing the same signs and symptoms as their clients including post traumatic stress disorder (PTSD) symptoms as well as disruption of therapists’ belief about
self, others, and the world; feeling helpless to witness clients destructive behavior; and feeling cynicism, despair and loss of hope. Nonetheless, it is also common to see other terms being used in the literature such as compassion fatigue, burnout and secondary traumatic stress (STS) (Figley, 1995). However, the term VT coined by McCann and Pearlman (1990) is considered to be the most comprehensive account so far (Dunkley and Wheland, 2006; Sexton, 1999) as the definition of VT encompasses both cognitive changes and symptomatic distress.
Research on professionals involved in child sexual abuse (CSA) cases also indicates similar results. For instance, a quantitative
The Impact of Vicarious Trauma on Professionals Involved in Child Sexual Abuse Cases (CSA)
S. Nen1*, Jill Astbury2, N. Subhi1, K. Alavi1, Z. M. Lukman1, N. Sarnon1, I. Fauziah1, S. M. Hoesni1 and M. S Mohamad1
1School of Psychology and Human Development, Faculty of Social Sciences and Humanities, Universiti Kebangsaan Malaysia, 43600 UKM, Bangi, Selangor, Malaysia
2School of Social Science and Psychology, Faculty of Arts, Education and Human Development,Victoria University, PO Box 1448, Melbourne 8001, Australia
*E-mail: [email protected]
ABSTRACTThere is an increasing awareness of psychological effects on working with trauma survivors (e.g., sexual abuse victims). However, little research focused on such issue. Adopting a qualitative approach, this study explored vicarious trauma (VT) among professionals working with child sexual abuse (CSA) cases in Malaysia. A total of 18 professionals (police officers, social workers, counselors, and medical social workers) were interviewed. Results indicated that respondents experienced shock and disbelief, confusion, fear, flashback, hyper vigilance, irritability, and sleep difficulties caused by work. Furthermore, their work also affected relationship with friends, family members, and children. This study disclosed the fact that most of the professionals were not even aware that they could be negatively affected by their work with CSA victims. Also, the study emphasized the importance of information and training about possible risks of working with trauma survivors to reduce the occurrence of VT.
Keywords: Vicarious trauma, child sexual abuse, sexual abuse, professionals’ trauma

S. Nen et al.
148 Pertanika J. Soc. Sci. & Hum. Vol. 19 (S) 2011
study of secondary traumatic stress among child protection workers showed a significant proportion of participants experienced high levels of distress (Cornille and Meyers, 1999). Symptoms reported included disruption in interpersonal relations, depression, phobic anxiety, paranoid ideation, hostility, and global distress symptoms. Pistorious (2006) found that therapists who worked with CSA victims reported symptoms of VT such as intrusive images or thoughts, dreams about the abuse, sadness, dissociation, and isolation. Similar results were found in a survey research by Follette et al. (1994) among mental health and law enforcement professionals who provided services to CSA survivors. Results from the study showed that law enforcement professionals reported higher level of traumatic symptoms, psychological distress and personal stress compared to mental health professionals.
Intense emotional responses such as anger, guilt, embarrassment, fear, lack of confidence, sadness, grief, feeling of discomfort, and empathy are also commonly reported among professionals working with CSA (Cheung and Queen, 2000; Couper, 2000; Lonergan et al., 2004; Walker, 2004; West, 1997). For example, West (1997) noted that working with physical, sexual, and emotional abuse is more difficult than working with other types of child abuse. Hearing and witnessing traumatized children left professionals with all kinds of negative feelings such as anger, revulsion, hatred, grief, sadness, and distress. They were also more likely to feel confused about what had happened as it went against their own preconceived beliefs about society. Likewise, Pistorious (2006) interviewed female therapists who worked with sexually abused children and found that working with victims had an impact on therapists, personally and professionally. The impact included changes of views about the world and relationships with others. Therapists viewed the world as not a safe place, became less intimate, overprotective, perceived people as untrustworthy and feared that sexual abuse might occur in their own families. The findings were consistent with research by Couper (2000) whose
respondents also suffered with symptoms of VT. The respondents viewed the world differently as they felt a lack of trust in others, fear for their children’s safety, had nightmares, were overprotective, and had feeling of alienation. Similarly, a qualitative study by Lonergan et al. (2004) reported that intense exposure to traumatized children changed therapists’ views about self and others. Respondents were inclined to generalize the abuse and were more likely to perceive that every child had been abused. Corovic (2006) indicated that participants felt that exposure to child abuse and neglect cases altered their preconceived belief about other people and the world.
Unaddressed VT can affect other people as well. For instance, therapists with VT may have difficulties in remaining emphatic towards clients, have difficulties in setting boundaries within the client-therapist relationship and be more likely to prematurely end the therapeutic work (Sexton, 1999; Walker, 2004). Other problems that could arise including counter transference, being emotionally detached with clients, boundary difficulties, over identification with a client’s experiences and a tendency to blame the client for the traumatization and view him or her as manipulative rather than placing trust in the client (Hesse, 2002). Conversely, affected professionals may act over protectively with their clients and go beyond appropriate levels of responsibility or capacity (Walker, 2004). These later may lead to other issues such as high levels of stress and burnout. Meanwhile, organizations’ failure to address these issues adequately can produce serious occupational health and safety issues when staff demand compensation due to organizational failures to prevent the risks involved (Sexton, 1999). Affected professionals may cause high worker turnover, ongoing conflict within and between organizations, poor productivity and/or over conscientiousness (Morrison, 2007). For organizations, the resignation of experienced and skilled professionals causes extra financial and resource burdens in terms of recruiting and replacing new staff.
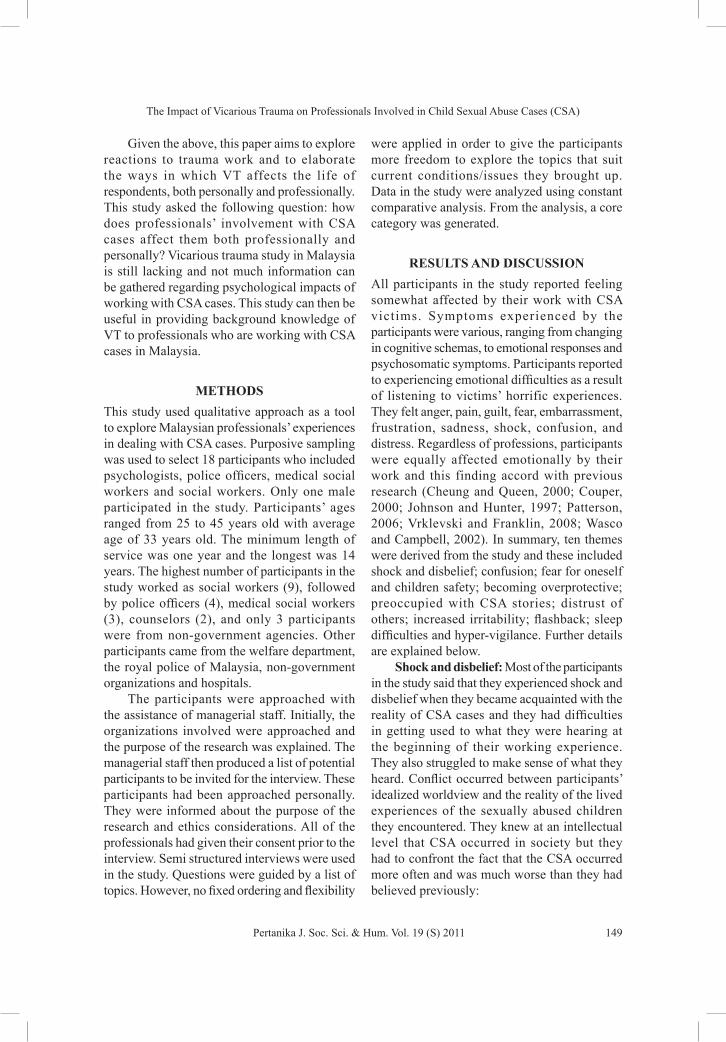
The Impact of Vicarious Trauma on Professionals Involved in Child Sexual Abuse Cases (CSA)
149Pertanika J. Soc. Sci. & Hum. Vol. 19 (S) 2011
Given the above, this paper aims to explore reactions to trauma work and to elaborate the ways in which VT affects the life of respondents, both personally and professionally. This study asked the following question: how does professionals’ involvement with CSA cases affect them both professionally and personally? Vicarious trauma study in Malaysia is still lacking and not much information can be gathered regarding psychological impacts of working with CSA cases. This study can then be useful in providing background knowledge of VT to professionals who are working with CSA cases in Malaysia.
METHODSThis study used qualitative approach as a tool to explore Malaysian professionals’ experiences in dealing with CSA cases. Purposive sampling was used to select 18 participants who included psychologists, police officers, medical social workers and social workers. Only one male participated in the study. Participants’ ages ranged from 25 to 45 years old with average age of 33 years old. The minimum length of service was one year and the longest was 14 years. The highest number of participants in the study worked as social workers (9), followed by police officers (4), medical social workers (3), counselors (2), and only 3 participants were from non-government agencies. Other participants came from the welfare department, the royal police of Malaysia, non-government organizations and hospitals.
The participants were approached with the assistance of managerial staff. Initially, the organizations involved were approached and the purpose of the research was explained. The managerial staff then produced a list of potential participants to be invited for the interview. These participants had been approached personally. They were informed about the purpose of the research and ethics considerations. All of the professionals had given their consent prior to the interview. Semi structured interviews were used in the study. Questions were guided by a list of topics. However, no fixed ordering and flexibility
were applied in order to give the participants more freedom to explore the topics that suit current conditions/issues they brought up. Data in the study were analyzed using constant comparative analysis. From the analysis, a core category was generated.
RESULTS AND DISCUSSIONAll participants in the study reported feeling somewhat affected by their work with CSA victims. Symptoms experienced by the participants were various, ranging from changing in cognitive schemas, to emotional responses and psychosomatic symptoms. Participants reported to experiencing emotional difficulties as a result of listening to victims’ horrific experiences. They felt anger, pain, guilt, fear, embarrassment, frustration, sadness, shock, confusion, and distress. Regardless of professions, participants were equally affected emotionally by their work and this finding accord with previous research (Cheung and Queen, 2000; Couper, 2000; Johnson and Hunter, 1997; Patterson, 2006; Vrklevski and Franklin, 2008; Wasco and Campbell, 2002). In summary, ten themes were derived from the study and these included shock and disbelief; confusion; fear for oneself and children safety; becoming overprotective; preoccupied with CSA stories; distrust of others; increased irritability; flashback; sleep difficulties and hyper-vigilance. Further details are explained below.
Shock and disbelief: Most of the participants in the study said that they experienced shock and disbelief when they became acquainted with the reality of CSA cases and they had difficulties in getting used to what they were hearing at the beginning of their working experience. They also struggled to make sense of what they heard. Conflict occurred between participants’ idealized worldview and the reality of the lived experiences of the sexually abused children they encountered. They knew at an intellectual level that CSA occurred in society but they had to confront the fact that the CSA occurred more often and was much worse than they had believed previously:
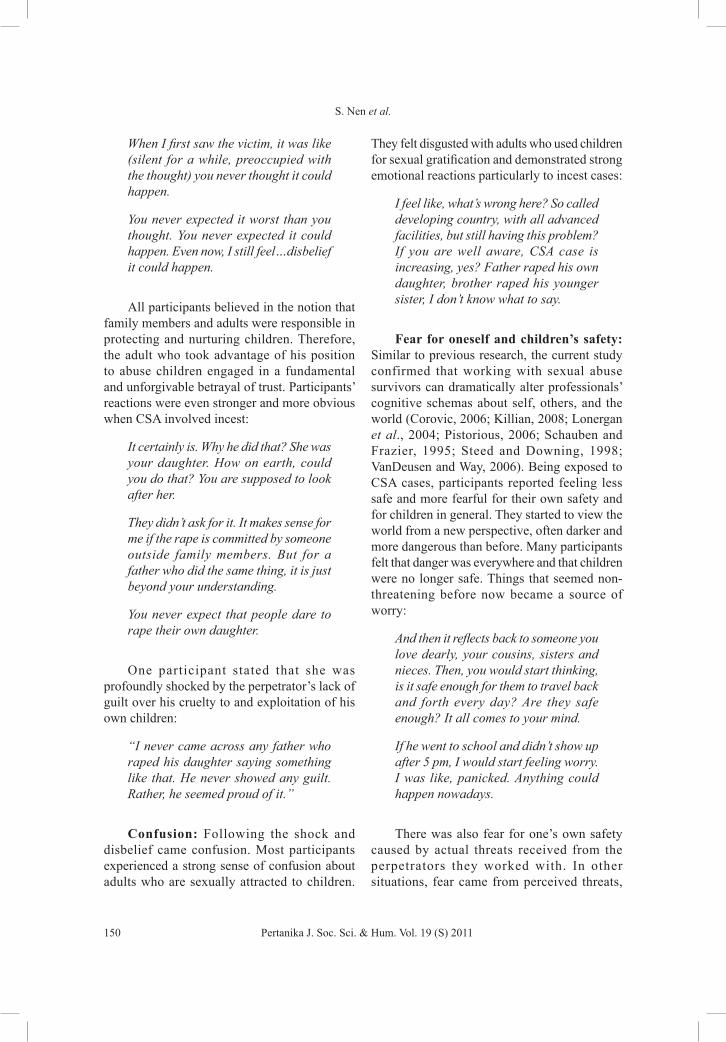
S. Nen et al.
150 Pertanika J. Soc. Sci. & Hum. Vol. 19 (S) 2011
When I first saw the victim, it was like (silent for a while, preoccupied with the thought) you never thought it could happen.
You never expected it worst than you thought. You never expected it could happen. Even now, I still feel…disbelief it could happen.
All participants believed in the notion that family members and adults were responsible in protecting and nurturing children. Therefore, the adult who took advantage of his position to abuse children engaged in a fundamental and unforgivable betrayal of trust. Participants’ reactions were even stronger and more obvious when CSA involved incest:
It certainly is. Why he did that? She was your daughter. How on earth, could you do that? You are supposed to look after her.
They didn’t ask for it. It makes sense for me if the rape is committed by someone outside family members. But for a father who did the same thing, it is just beyond your understanding.
You never expect that people dare to rape their own daughter.
One participant stated that she was profoundly shocked by the perpetrator’s lack of guilt over his cruelty to and exploitation of his own children:
“I never came across any father who raped his daughter saying something like that. He never showed any guilt. Rather, he seemed proud of it.”
Confusion: Following the shock and disbelief came confusion. Most participants experienced a strong sense of confusion about adults who are sexually attracted to children.
They felt disgusted with adults who used children for sexual gratification and demonstrated strong emotional reactions particularly to incest cases:
I feel like, what’s wrong here? So called developing country, with all advanced facilities, but still having this problem? If you are well aware, CSA case is increasing, yes? Father raped his own daughter, brother raped his younger sister, I don’t know what to say.
Fear for oneself and children’s safety: Similar to previous research, the current study confirmed that working with sexual abuse survivors can dramatically alter professionals’ cognitive schemas about self, others, and the world (Corovic, 2006; Killian, 2008; Lonergan et al., 2004; Pistorious, 2006; Schauben and Frazier, 1995; Steed and Downing, 1998; VanDeusen and Way, 2006). Being exposed to CSA cases, participants reported feeling less safe and more fearful for their own safety and for children in general. They started to view the world from a new perspective, often darker and more dangerous than before. Many participants felt that danger was everywhere and that children were no longer safe. Things that seemed non-threatening before now became a source of worry:
And then it reflects back to someone you love dearly, your cousins, sisters and nieces. Then, you would start thinking, is it safe enough for them to travel back and forth every day? Are they safe enough? It all comes to your mind.
If he went to school and didn’t show up after 5 pm, I would start feeling worry. I was like, panicked. Anything could happen nowadays.
There was also fear for one’s own safety caused by actual threats received from the perpetrators they worked with. In other situations, fear came from perceived threats,

The Impact of Vicarious Trauma on Professionals Involved in Child Sexual Abuse Cases (CSA)
151Pertanika J. Soc. Sci. & Hum. Vol. 19 (S) 2011
derived from stories participants gathered from CSA cases. Participants started to feel much more vulnerable to sexual violence than they had in the past. Such feelings had caused participants to restrict certain behaviors in their daily lives such as avoiding particular places or situations they believed were dangerous. Clearly, intense involvement with sexual abuse cases increased a sense of vulnerability:
You become more careful. Now, if I want to do something, or if I want to go to other places, I am a bit anxious.
It never changed. Sometimes I returned home quite late at night. You felt scared to step out into a parking lot. Whenever you saw a few guys near there, you didn’t dare to get out from your car. You felt nervous. Sometimes I thought, that would be much better if I didn’t know anything about it.
Some participants were concerned for their safety during fieldwork and/or while on duty because clients sometimes became aggressive. The feeling of uncertainty about how people would react to them intensified their fear reactions. Also, unpleasant experiences in dealing with similar cases in the past made the situation even worse. Although participants realized that their safety was protected by laws, they felt vulnerable to violence.
Becoming overprotective: Participants noted that their work also affected their relationships, particularly on parenting. They became more protective and cautious toward their children. Now everyone was perceived as potentially able to harm their children. Even family members and close friends were looked with suspicious eyes:
I have two daughters, so I become more protective toward them, it makes me more cautious, and particularly people I know, including my own good friends.
I told my daughter not to get too close to her father, to her cousins etc because it can happen. So for me, there is no safe place anymore for girls.
When I heard about a grandfather who raped his grandchildren, it makes me a bit anxious with my own father. I feel the same thing with my own brothers.
Rules were imposed for children to follow. These included rules inside and outside the home. Some felt uneasy whenever they left children without adequate supervision. They found themselves feeling suspicious all the time:
I become anxious if my children spend too much time in their bedrooms. I don’t like them to spend time alone without proper supervision.
Preoccupied with CSA stories: In this study, some of the participants reported having problems in getting rid of the horrific stories they heard from the victims. Participants remembered details of the abuse and found themselves preoccupied with thoughts about the abuse. Being overly immersed in CSA cases is not without a cost. For instance, participants found themselves starting to lose control and become restless, agitated and unable to focus on other things and were continuously anxious about the case progress and the victims’ conditions:
I only feel relieved when the case is completed. Otherwise, I become restless and keep thinking about it even at home. The case would preoccupy my mind.
In one incident, I couldn’t find my way home and got lost because I was so preoccupied by such things.
My friends used to tell me that, everybody has their problems, but they’re not like me, obsessed with negative thoughts until I feel exhausted.

S. Nen et al.
152 Pertanika J. Soc. Sci. & Hum. Vol. 19 (S) 2011
Distrust of others: Most participants in the study felt that working with CSA cases altered their trust of others, particularly men. Repetitive exposure to horrific stories of abuse decreased participants’ trust and perceived good in people. Participants were devastated by the stories. The feeling of betrayal quickly emerged while basic trust was destroyed. One of the participants in the study explained how her inability to trust created feelings of isolation from others:
Sometimes you worry. Maybe other people thought it was okay, but for me now, it’s difficult to trust others anymore. You must beware of other people, no matter where you work. I become more discreet about which person I choose to talk about my problems. If there’s no one for me to talk with, my problem would be hidden just like that. That affects me.
Some participants claimed that all men can be a potential abuser, whether they are family members, close friends or strangers. They looked at men as less trustworthy and were secretly suspicious and vigilant of their behavior. Participants became easily agitated and alarmed whenever they saw men having contact with children:
It makes me more cautious, and particularly people I know, including my own good friends. To that extent, because even family members could do that, let alone others.
Physical appearances and good personal characteristics no longer served as reliable bases for evaluating others. As explained by one of the participants, CSA made her realize that people are unpredictable creatures and increasingly difficult to judge:
I am concerned because sexual abuse can happen to anyone and you never
know what men really think. He may look okay but you never know. He could change in a second.
Often, the lack of trust in others particularly family members created a dilemma for the participants as they felt guilty for having such feelings toward their own husband, father and other family members. At the same time, however, they could not avoid being discreet and vigilant about men:
You thought, ‘Is it safe to leave her alone with her father?’ You have such negative thinking about yourself because you work with the victims. But then, I said back, ‘What’s wrong with me? I’m supposed to believe my own husband.’ Still, I have that kind of thought.
Contrast to previous research (Clemans, 2004; Killian, 2008), none reported on changes in the sexual relationship with their partners. It might be that social and cultural inhibitions regarding discussion of sexual matters may have influenced participants not to disclose changes that might have occurred in their sexual relationship although an effort was made to explore this issue further.
Increased irritability: Participants reported bodily symptoms such as flashbacks, obsessive thoughts, intense fear, sleep disturbance, anxiety, hyper-vigilance and panic attacks. This finding is supported by numerous studies on similar issues (Clemans, 2004; Schauben and Frazier, 1995; Steed and Downing, 1998; Way et al., 2004). Two participants in the study reported increased irritability as a result of their work with CSA. Both reported symptoms such as feeling stressed out, short-tempered, and agitated. One of the participants admitted being unaware that she was affected by her work at the time. Eventually, she decided to take leave to freshen up before started her work again:

The Impact of Vicarious Trauma on Professionals Involved in Child Sexual Abuse Cases (CSA)
153Pertanika J. Soc. Sci. & Hum. Vol. 19 (S) 2011
And hmm, I got angry, but you see all of these. I didn’t realize it was like vicarious trauma like I said.
It took quite some time for another participant before she realized she was affected by her work.
At first you thought it was nothing, but people around you started giving their comments that you had became more difficult to be with. Then you started to notice.
Flashback: A flashback is a sudden recollection of the past, which can take the form of visual, emotional, auditory or sensory recall. It is strongly associated with the PTSD symptoms suffered by trauma victims. However, it can also happen to people working with trauma clients (Pearlman and Saakvitne, 1995). One participant in the study reported that she once experienced a flashback right after she started her personal therapy. She was experiencing intrusive visual images of her clients being abused sexually. During this episode, she was unaware of the fact that she also might be affected by her clients’ trauma:
I didn’t realize it was like vicarious trauma like I said. And what is also interesting is that I was doing my play therapy at the same time. I’ve been learning and running play therapy for the past 10 years. So I do therapy myself and while I was doing it, I got visual or flashback of women telling me all their things and I was like ‘wow, where all these coming from?’ When I first started, not realizing that hearing it is actually affecting me, so now I know.
Sleep difficulties: At least three participants reported having trouble sleeping due to their involvement with CSA cases. In fact, one participant admitted that working with CSA
cases affected her more than any other cases. Two other participants echoed similar problems.
Hyper-vigilance: Hyper-vigilance is an enhanced state of sensory sensitivity accompanied by an exaggerated intensity of behaviors whose purpose is to detect threats. Hyper-vigilance is also accompanied by a state of increased anxiety which can cause exhaustion symptoms. Other symptoms include increased arousal, a high responsiveness to stimuli and a constant scanning of the environment for threats. Several participants in the study had reported symptoms of hyper-vigilance as explained above. For example, one participant admitted that she became so sensitive to her surroundings that even a minor sound would tense her up. Participants were not only overly sensitive to stimuli that emerged from environmental threats, but were also highly responsive and hyper sensitive to behaviors or acts they perceived as dangerous or threatening:
Whenever I see a father gets a bit too close with his daughter, I become suspicious and I have this feeling, to warn his wife not to let them overdo it. Your experience has taught you that. How would the child know if the father takes an advantage from that? First kissing, then hugging, then…you never know. That is how I feel. Sometimes I thought, ‘I am too sensitive. Maybe that was a normal behavior for the family.’ But yeah, you got that feeling.
CONCLUSIONVT is an issue that cannot be taken lightly as it can adversely affect not only professionals but also clients and organizations they work with. This study proves that Malaysian professionals are not immune to VT brought on by traumatised children. Therefore, professionals must be well equipped with knowledge on the potential effects of hearing horrific stories about maltreated children and have effective strategies for minimizing the harmful impacts

S. Nen et al.
154 Pertanika J. Soc. Sci. & Hum. Vol. 19 (S) 2011
of this aspect of their work. This can be done in both university program and those run by organizations that deal with CSA. Informing professionals about potential psychological risks should be perceived as not something to scare them but as necessary preparation. A therapy training course would emphasize self examination in an effort to increase therapeutic awareness among professionals and as a means of preventing vicarious traumatization. Despite valuable information, this study however, was not without its limitations. Physicians/pediatricians and child advocates who were also part of child intervention team were not included in the study, making their issues and experiences unable to be heard. It is suggested for future research to include other professionals as well. It is hoped that findings of the study can be used to formulate training programs for professionals involved in CSA cases in particular and trauma survivors in general.
REFERENCESAlpert, J. L., & Paulson, A. (1990). Graduate-level
education and training in child sexual abuse. Professional Psychology: Research and Practice, 21(5), 366-371.
Cavanagh, M., Read, J., & New, B. (2004). Sexual abuse inquiry and response: A New Zealand training programs. New Zealand Journal of Psychology, 33(3), 137-144.
Cheung, M., & Queen, N. M. B. (2000). Emotional responses to child sexual abuse: A comparison between police and social workers in Hong Kong. Child Abuse & Neglect, 24(12), 1613-1621.
Clemans, S. E. (2004). Life changing: The experience of rape-crisis work. Affilia, 19(2), 146-159.
Cornille, T. A., & Meyers, T. W. (1999). Secondary traumatic stress among child protective service workers: Prevalence, severity and predictive factors. Retrieved November 30, 2007 from http://tmt.sagepub.com/cgi/content/abstract/5/1/15.
Corovic, T. (2006). Child protection workers and vicarious trauma: A view from the edge. OACAS Journal, 50(1), 11-14. Retrieved from http://www.oacas.org/pubs/oacas/journal/ 2006May/journalspring2006.pdf
Couper, D. (2000). The impact of the sexually abused child’s pain on the worker and the team. Journal of Social Work Practice, 14(1), 9-16.
Cresswell, J. W. (2007). Qualitative inquiry & research design: Choosing among five approaches (2nd ed.). US: Sage Publications.
Dunkley, J., & Whelan, T. A. (2006). Vicarious traumatisation: Current status and future directions. British Journal of Guidance & Counselling, 34(1), 107-116.
Figley, C. R. (Ed.). (1995). Compassion fatigue: Coping with secondary traumatic stress disorder in those who treat the traumatized. New York: Brunner/Mazel.
Follette, V. M., Polusny, M. M., & Milbeck, K. (1994). Mental health and law enforcement professionals: Trauma history, psychological symptoms, and impact of providing services to child sexual abuse survivors. Professional Psychology: Research and Practice, 25(3), 275-282.
Fossey, E., Harvey, C., McDermott, F., & Davidson, L. (2002). Understanding and evaluating qualitative research. Australian and New Zealand Journal of Psychiatric, 36(6), 717-732.
Hesse, A. R. (2002). Secondary trauma: How working with trauma survivors affects therapists. Clinical Social Work Journal, 30(3), 293-309.
Johnson, C. N. E., & Hunter, M. (1997). Vicarious traumatisation in counsellors working in the New South Wales sexual assault service: An exploratory study. Work & Stress, 11(4), 319-328.
Killian, K. D. (2008). Helping till it hurts? A multimethod study of compassion fatigue, burnout, and self-care in clinicians working with trauma survivors. Traumatology, 14(2), 32-44.
Lonergan, B. A., O’Halloran, M. S., & Crane, S. C. M. (2004). The development of the trauma therapist: A qualitative study of the child therapist’s perspectives and experiences. Brief Treatment and Crisis Intervention, 4(4), 353-366.

The Impact of Vicarious Trauma on Professionals Involved in Child Sexual Abuse Cases (CSA)
155Pertanika J. Soc. Sci. & Hum. Vol. 19 (S) 2011
McCann, I. L., & Pearlman, L. A. (1990). Vicarious traumatisation: A Framework for understanding the psychological effects of working with victims. Journal of Traumatic Stress, 3, 131-149.
Morrison, Z. (2007). Feeling heavy: Vicarious trauma and other issues facing those who work in the sexual assault field. Retrieved October 22, 2007 from www.aifs.gov.au/acssa/ pubs/wrap/ acssa_wrap4.pdf
Padget, D. K. (1998). Qualitative methods in social work research: Challenges and rewards. Thousand Oaks, CA: Sage.
Patterson, G. T. (2006). Predictors of attitudes toward child physical abuse, sexual abuse and neglect. Retrieved June 12, 2007 from http://www.allacedemic.com/meta/ p104817_index.html
Patton, M. Q. (1990). Qualitative evaluation and research methods. London: Sage Publications.
Pearlman, L. A., & Saakvitne, K. W. (1995). Trauma and the therapist: Counter-transference and vicarious traumatisation in psychotherapy with incest survivors. New York: W.W. Norton & Company Inc.
Pistorious, K. D. (2006). The personal impact on female therapists from working with sexually-abused children. PhD thesis, Brigham Young University, Provo, Utah, United States.
Pross, C. (2006). Burnout, vicarious traumatization and its prevention. Torture, 16(1), 1-9.
Schauben L. J., & Frazier, P.A. (1995). Vicarious trauma: The effects on female counsellors of working with sexual violence survivors. Psychology of Women Quarterly, 19(1), 49-64.
Sexton, L. (1999). Vicarious traumatisation of counsellors and effects on their workplaces. British Journal of Guidance & Counselling, 27(3), 393-403.
Steed, L., & Downing, R. (1998). A phenomenological study of vicarious traumatisation amongst psychologists and professionals counsellors working in the field of sexual abuse/assault. Australasian Journal of Disaster and Trauma Studies. Retrieved on March, 12 2008 from http://www.massey.ac.nz/_trauma/issues/1998-2/steed.htm
Strauss, A., & Corbin, J. (1998). Basics of qualitative research: Techniques and procedures for developing grounded theory. California, USA: Sage Publication Inc.
Timlin-Scalera, R. M., Ponterotto, J. G., Blumberg, F. C., & Jackson, M. A. (2003). A grounded theory study of help-seeking behaviours among white male high school students. Journal of Counseling Psychology, 50(3), 339-350.
VanDeusen, K. M., & Way, I. (2006). Vicarious trauma: An exploratory study of the impact of providing sexual abuse treatment on clinicians trust and intimacy. Journal of Child Sexual Abuse, 15(1), 69-85.
Vrklevski, L. P., & Franklin, J. (2008). Vicarious trauma: The impacts on solicitors of exposure to traumatic material. Traumatology, 14(1), 106-118.
Walker, M. (2004). Supervising practitioners working wi th surv ivors of ch i ldhood abuse: Counter transference; secondary traumatisation and terror. Psychodynamic Practice. Retrieved October 1, 2007 from http://www.informaworld.com/smpp/content? content=10.1080/145753630410001686753
Wasco, S. M., & Campbell, R. (2002). Emotional reactions of rape victim advocates: A multiple case study of anger and fear. Psychology of Women Quarterly, 26(2), 120-130.
Way, I., Vandeusen, K. M., Martin, G., Applegate, B., & Jandle, D. (2004). Vicarious trauma: A comparison of clinicians who treat survivors of sexual abuse and sexual offenders. Journal of Interpersonal Violence, 19(1), 49-71.
West, J. (1997). Caring for ourselves: The impact of working with abused children. Child Abuse Review, 6(4), 291-297.
Wilkinson, G. (2008). Protecting client autonomy: A grounded theory of the processes nurses use to deal with challenges to personal values and beliefs. PhD thesis, University of Newcastle, Australia.


ISSN: 0128-7702Pertanika J. Soc. Sci. & Hum. 19 (S): 157 - 162 (2011) © Universiti Putra Malaysia Press
Received: 3 May 2011Accepted: 28 July 2011*Corresponding Author
INTRODUCTIONEquality is an important issue pertaining to both men and women worldwide. United Nations Development Program (UNDP, 2007) through its report for 2010 stated that Malaysia has made significant progress to reduce gender inequalities. However, the degree of gender inequalities is still high compared to some of the high human development countries. This fact is aligned with a report by Hausmann et al. (2010) in Global Gap Index 2010. The index shows that Malaysia has dropped 29 spots from 72 to 101 in making efforts to reduce the gap of inequality between men and women. Under the Laws of Malaysia Federal Constitution (2006), Article 8 (1) of the constitution states that all persons are equal before the law and entitled
to the equal protection of the law. Article 8 (2) explains that unless expressly authorized by the constitution, no discrimination against citizens on the ground only of religion, race, descent, place of birth or gender in any law or in the appointment to any office or employment under a public authority or in the administration of any law relating to the acquisition, holding or disposition of property or the establishing or carrying on of any trade, business, profession, vocation or employment. Both articles express the importance of not exercising any conducts that may lead to inequality. It is clear that under the eyes of law, inequality should not be imposed on any citizens of Malaysia.
Gucciardi et al. (2004) define single mothers as persons who are never married, or who are
Coping with Difficulties: Social Inequality and Stigmatization on Single Mothers with Low Income Household
H. M. Rusyda1*, Z. M. Lukman1, N. Subhi1, Sheau Tsuey Chong1, A. Abdul Latiff2, H. Hasrul2 and W. M. Wan Amizah2
1School of Psychology and Human Development,2School of Media and Communication, Faculty of Social Sciences and Humanities,
Universiti Kebangsaan Malaysia, 43650 UKM, Bangi, Selangor, Malaysia*E-mail: [email protected]
ABSTRACTSingle mothers with lower income and education experience pressure both physically and mentally and they are exposed to stigmatization by society. The purpose of this article is to examine how the status of low income single mothers led to social inequalities and stigmatization in a community. Analysis was based on qualitative interview data from two focus group discussions. The findings revealed that the perceived social inequality by other people towards low income single mothers has led to stigmatization to this particular group. In addition, the stigmatization was strengthened by the culture of society that subsequently labeled single mothers. With low income they were often ignored and treated differently. They received minimal opportunities financially or socially to improve themselves. The abrupt changes from being a married woman to a single mother brought a huge impact on their self-esteem and health. It is highly necessary for the society or the government to educate the society to change their attitude toward single mothers.
Keywords: Low income single mothers, stigmatization, culture and the society, social inequality
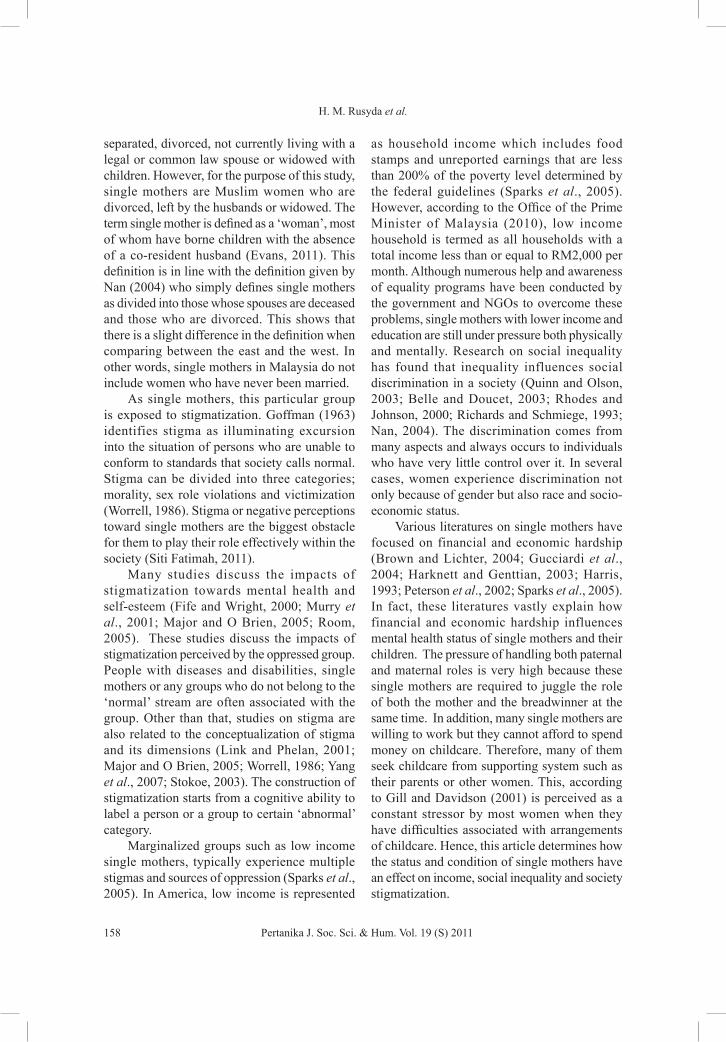
H. M. Rusyda et al.
158 Pertanika J. Soc. Sci. & Hum. Vol. 19 (S) 2011
separated, divorced, not currently living with a legal or common law spouse or widowed with children. However, for the purpose of this study, single mothers are Muslim women who are divorced, left by the husbands or widowed. The term single mother is defined as a ‘woman’, most of whom have borne children with the absence of a co-resident husband (Evans, 2011). This definition is in line with the definition given by Nan (2004) who simply defines single mothers as divided into those whose spouses are deceased and those who are divorced. This shows that there is a slight difference in the definition when comparing between the east and the west. In other words, single mothers in Malaysia do not include women who have never been married.
As single mothers, this particular group is exposed to stigmatization. Goffman (1963) identifies stigma as illuminating excursion into the situation of persons who are unable to conform to standards that society calls normal. Stigma can be divided into three categories; morality, sex role violations and victimization (Worrell, 1986). Stigma or negative perceptions toward single mothers are the biggest obstacle for them to play their role effectively within the society (Siti Fatimah, 2011).
Many studies discuss the impacts of stigmatization towards mental health and self-esteem (Fife and Wright, 2000; Murry et al., 2001; Major and O Brien, 2005; Room, 2005). These studies discuss the impacts of stigmatization perceived by the oppressed group. People with diseases and disabilities, single mothers or any groups who do not belong to the ‘normal’ stream are often associated with the group. Other than that, studies on stigma are also related to the conceptualization of stigma and its dimensions (Link and Phelan, 2001; Major and O Brien, 2005; Worrell, 1986; Yang et al., 2007; Stokoe, 2003). The construction of stigmatization starts from a cognitive ability to label a person or a group to certain ‘abnormal’ category.
Marginalized groups such as low income single mothers, typically experience multiple stigmas and sources of oppression (Sparks et al., 2005). In America, low income is represented
as household income which includes food stamps and unreported earnings that are less than 200% of the poverty level determined by the federal guidelines (Sparks et al., 2005). However, according to the Office of the Prime Minister of Malaysia (2010), low income household is termed as all households with a total income less than or equal to RM2,000 per month. Although numerous help and awareness of equality programs have been conducted by the government and NGOs to overcome these problems, single mothers with lower income and education are still under pressure both physically and mentally. Research on social inequality has found that inequality influences social discrimination in a society (Quinn and Olson, 2003; Belle and Doucet, 2003; Rhodes and Johnson, 2000; Richards and Schmiege, 1993; Nan, 2004). The discrimination comes from many aspects and always occurs to individuals who have very little control over it. In several cases, women experience discrimination not only because of gender but also race and socio-economic status.
Various literatures on single mothers have focused on financial and economic hardship (Brown and Lichter, 2004; Gucciardi et al., 2004; Harknett and Genttian, 2003; Harris, 1993; Peterson et al., 2002; Sparks et al., 2005). In fact, these literatures vastly explain how financial and economic hardship influences mental health status of single mothers and their children. The pressure of handling both paternal and maternal roles is very high because these single mothers are required to juggle the role of both the mother and the breadwinner at the same time. In addition, many single mothers are willing to work but they cannot afford to spend money on childcare. Therefore, many of them seek childcare from supporting system such as their parents or other women. This, according to Gill and Davidson (2001) is perceived as a constant stressor by most women when they have difficulties associated with arrangements of childcare. Hence, this article determines how the status and condition of single mothers have an effect on income, social inequality and society stigmatization.

Coping with Difficulties: Social Inequality and Stigmatization on Single Mothers
159Pertanika J. Soc. Sci. & Hum. Vol. 19 (S) 2011
METHODSThe information gathering for this qualitative research is through focus group discussion. Two groups of single mothers consisting of seven people for each group from Kuala Lumpur participated in this focus group discussion. They are the members of The Single Mothers Association of Federal Territory.
A semi structured list of questions was developed for the discussion based on the research objectives. The informants who participated earn less than RM1000 per month and reside in the area of Kerinci and Bangsar. After reviewing the literatures on single mothers, inequalities and stigmatization, a series of semi structure questions asking about demographic information, coping strategies, struggle and interpersonal communication with other single mothers and the mass were constructed and asked to the informants. The discussions were recorded using a voice recorder and later transcribed into Microsoft Word document.
RESULTS AND DISCUSSION
Economic and Financial HardshipDuring the focus group discussions, the informants shared their experiences in managing the family financial situation on their own after losing their husbands. Generally, they shared several similarities. The way they expressed their feelings was very intense and emotional. It showed that they really were and still struggling to make ends meet.
After my former husband divorced me, my life was very difficult. I did not receive any help from the government until year 1994. My son was entitled RM50 per month from Welfare Department. I worked very hard…..it was very, very tough.
I was lucky because my husband was a pensioner. After he died, it gives me
the right to receive his monthly pension. Money is a major issue in a big city like Kuala Lumpur. The monthly pension that I received is not enough.
My former husband left me and I have to bear the responsibilities of raising my kids since year 2000. I’m an odd job worker; sometimes people will call me to give them a massage and that’s all. I have no monthly income. Technically, I have nothing….
I’m a full time housewife when my husband died 13 years ago. My husband died and I was practically left with nothing. No pension, no EPF. It was dark and I lost my way. I made Nasi Lemak everyday and sent it to hawkers around my house. I do not know how and what to work as I was a full time housewife.
I have no stable monthly income. The first few months after the divorce, I fell sick…very sick. I guess that was due to pressure that I went through.
The informants consisted of women who were either divorced or widowed (Evans, 2011; Nan, 2004). The economic hardship was the first thing they experienced upon losing their husbands and having to start their lives as a single mother (Brown and Lichter, 2004; Gucciardi et al., 2004; Harknett and Genttian, 2003; Harris, 1993; Peterson et al., 2002; Sparks et al., 2005). The pressure of playing dual roles was very demanding and these were affecting their health (Fife and Wright, 2000; Murry et al., 2001; Major and O’ Brien, 2005; Room, 2005). Technically, the lack of education and skills has slowed them down in managing their economic and financial stability. All of them also claimed that they have insufficient earnings to support themselves and their children.

H. M. Rusyda et al.
160 Pertanika J. Soc. Sci. & Hum. Vol. 19 (S) 2011
Stigmatization and DiscriminationSometimes, as single mothers, they were exposed to stigmatization due to their status and social inequality. The single mothers were categorized as ‘good’ or ‘bad’. For example, if one became a single mother out of a divorce, she would be labeled as a ‘bad’ woman. However if the husband died, she was considered to be a ‘good’ woman. Divorced single mothers were considered bad as the society put the blame on them, accusing them to be the reason of the divorce.
The society has different perspectives on widowed or divorced women. If you are a widow, the society will be sympathetic. But if you are a widow, they always think that you are the reason of the divorces.
Once you hold the title of single mothers, the other married women tend to be protective of their husbands. They were worried that we might steal their husbands. They acted as if were desperate of men.
They were nice to me but they said bad things behind my back. They called me names and they said I was flirtatious.
The neighbors were so nasty to me. They always accused me of doing bad things just because I’m a single mother.
According to the discussion, the negative perceptions toward single mothers were normal to them. They experienced such negativities from neighbors, friends, and even relatives. This is related to the cultural belief that was adopted in Malay communities as a whole. This finding showed that the construction of stigmatization was rooted from the cognitive understanding of a person (Link and Phelan, 2001; Major and O’ Brien, 2005; Worrell, 1986; Yang et al., 2007; Stokoe, 2003).
Social Inequality and the SocietyThe discussion above mentioned about how single mothers were subjected to social inequality because of their status. However, as low income single mothers, they were also seen as unequal individual that received different treatment from the society and even relevant welfare bodies. This is reflected from the discussion below.
I went to Yayasan Salam, but they turned down my application for financial aid. I was very sad, they know that I am a single mother and I have no stable monthly income. Why must they do that?
I went to see an officer of Baitulmal and try to ask for some financial aid. But in return, I waited for nothing. They ended up asking me for things that I cannot produce…documents that I do not have and sometimes they asked for ridiculous things.
When my husband was still alive, relatives come and visit us frequently. When we visited them, I will bring food…or something. But now, they don’t. They don’t even call. I was also not comfortable going to their house. I feel embarrassed.
I guess that is normal. When we still have money, have a husband, people look up on us. But when I have no privileges anymore, I was distant.
The finding showed that as low income single mothers, this group was exposed to different treatment from the society (Quinn, and Belle and Doucet, 2003; Rhodes and Johnson, 2000; Richards and Schmiege, 1993; Nan, 2004). However, it was interesting to see a different perspective from the west and the east. Nan (2004) in her article did explain dissimilar treatment to the single mothers because of
Coping with Difficulties: Social Inequality and Stigmatization on Single Mothers
161Pertanika J. Soc. Sci. & Hum. Vol. 19 (S) 2011
the status while other studies explained about inequalities of gender and financial income. Again, the reason behind this finding was related to the culture of Malay people. Individuals who were single mothers were often perceived as people with ‘less’ value than others.
This research discovered that Malay Muslim single mothers were a group of persons who received different treatment from the society. As the informants were from relatively similar background; low income single mothers, low level of education, living among the society of similar characteristics (e.g. low education and low income), the practice of discriminating a person that was considered unequal should not be endorsed. The struggle of single mothers was huge, thus, it was hoped that additional pressure was avoided.
CONCLUSIONAs a conclusion, it is important for the society to change their thinking toward single mothers. The negative thinking has led to many other negative issues such as poverty among single mothers. This condition may affect both single mothers and their children. As stated in the Federal Constitution of Malaysia, every citizen is equal in the eyes of law. There is nothing in Muslim religion condoning this act. The teachings of Islam promote the spirit of helping each other. It is very important for a Muslim to carry out the responsibility as a Caliph. The practice of Malay conservative society needs to end as soon as possible so a better way of life can be achieved.
REFERENCESBelle, D., & Doucett, J. (2003). Poverty, inequality
and discrimination as sources of depression among US Women. Psychology of Women Quarterly, 27(35), 101-113.
Brown, J. B., & Lichter, D. T. (2004). Poverty, welfare, and the livelihood strategies of non-metropolitan single mothers. Rural Sociology, 69(2), 282-301.
Evans, M. (2011). Single mothers in Malaysia: Social protection as an exercise of definition in search of solution. Retrieve May 1, 2011 from www.ids.ac.uk/download.cfm?downloadfile= 210BCDBB-C9E3
Fife, B. L., & Wright, E. R. (2000). The dimensionality of stigma: A comparison of its impact on the self of persons with HIV/aids and cancer. Journal of Health and Social Behavior, 41(1), 50-67.
Gill, S., & Davidson, M. J. (2001). Problems and pressures facing lone mothers in management and professional occupations – A pilot study. Women in Management Review, 16(8), 383-399.
Goffman, E. (1963). Stigma: Notes on the management of spoiled identity inspired a profusion of research on the nature, sources, and consequences of stigma. London: Penguin.
Gucciardi, E., Celasun, N.S., & Stewart, D. E. (2004). Single-mother families in Canada. Canadian Journal of Public Health, 95(1), 70-74.
Harknett, K., & Gennetian, L. A. (2003). How an earnings supplement can affect union formation among low-income single. Demography, 40(3), 451- 478.
Harris, K. M. (1993). Work and welfare among single mothers in poverty. The American Journal of Sociology Source, 99(2), 317-352.
Hausmann, R., Tyson, L. D., & Saadia Zahidi. (2010). The global gender gap. Retrieve May 1, 2011 from http://www3.weforum.org/docs/WEF_GenderGap_Report_2010.pdf
Laws of Malaysia Federal Constitution. (2006). The commissioner of law revision, Malaysia.
Link, B. G., & Phelan, J. C. (2001). Conceptualizing stigma. Annual Review of Sociology, 27(1), 363-385.
Major, B., & O’Brien, L. T. (2004). The social psychology of stigma. Annual Review of Psychology, 56(1), 393-421.
Murry, V. M., Brown, P. A., Brody, H. G., Cutrona, C. E., & Simons, R. L. (2001). Racial discrimination as a moderator of the links among stress, maternal psychological, functioning, and family relationships. Journal of Marriage and Family, 63(4), 915-926.

H. M. Rusyda et al.
162 Pertanika J. Soc. Sci. & Hum. Vol. 19 (S) 2011
Nan, Puspa Melati. (2004). Single mothers in Malaysia: The interlocking systems of domination. Retrived May 1, 2011 from http://acadserv.usfca.edu/preview/artsci/ug/rhetoric_ composition/journal/wan2004.pdf
Office of the Prime Minister of Malaysia. (2010). Annual Report of Government Transition Plan. Retrieve May 1, 2011 from http://www.pemandu.gov.my/gtp/wpcontent/uploads/ reports/GTP_AR2010_ENG_FINAL.pdf
Peterson, J., Xue Song, & De-Weever, A. J. (2002). Life after welfare reform: Low income single parent families, pre- and post-TANF. Research-in-Brief (IWPR Publication, D446, p. 8). Washington, DC: Institute for Women’s Policy Research.
Quinn, K. A., & Olson, J. M. (2003). Framing social judgment: Self-in-group comparison and perceived discrimination. Personality and Social Psychology, 29(2), 228-236.
Rhodes, R., & Johnson, M. M. (2000). Students’ perceptions of single parents and social injustice: A women’s issue. Afilia, 15(3), 434-446.
Richards, L. R., & Schmiege, C. J. (1993). Source problems and strengths of single-parent families: Implications for practice and policy. Family Relations, 42(3), 277-285.
Room, R. (2005). Stigma, social inequality and alcohol and drug use. Drug and Alcohol Review, 24(2), 143-155.
Siti Fatimah Binti Abdul Rahman. (2011). Ibu tunggal: Semua pihak perlu lebih bertanggungjawab. Institut Kefahaman Islam Malaysia. Retrieved May 1, 2011 from http://www.ikim.gov.my/v5/index.php?lg=1&opt=com_article&grp=2&sec=&key=655&cmd=resetall.
Sparks, A. N., Peterson, A., & Tangenberg, K. (2005). Belief in personal control among low-income African American, Puerto Rican, and European American single mothers. Affilia, 20(4), 401-405.
Stokoe, E. (2003). Mothers, single women and sluts. Gender, morality and membership categorization in neighborhood disputes. Feminism & Psychology, 13, 317-344.
UNDP. (2007). Report on measuring and monitoring gender equality, Malaysia’s gender gap. Retrieve May 1, 2011 from http://www.undp.org.my/measuring-and-monitoring-gender-equality-malaysias-gender-gap-index.
Worrell, J. (1986). Single mothers: Issues of stigma. Paper presented at the 94th Annual Convention of the American Psychological Association, Washington DC.
Xiaoming, Li., Stanton, B., Fang, X., & Lin, Danhua. (2006). Social stigma and mental health among rural-to-urban migrants in China: A conceptual framework and future research needs. World Health Population, 8(3), 14-31.
Yang, L. H., Kleinman, A., Linka, B. G., Phelan, J. C., Leed, S., & Good, B. (2007). Culture and stigma: Adding moral experience to stigma theory. Social Science & Medicine, 64(7), 1524-1535.
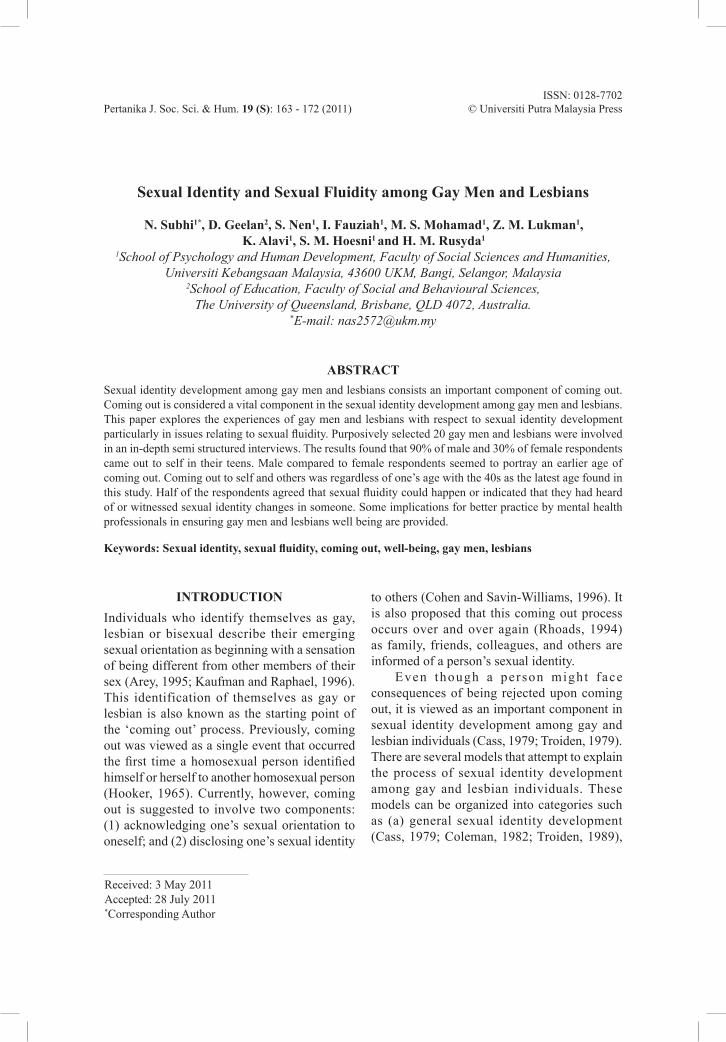
ISSN: 0128-7702Pertanika J. Soc. Sci. & Hum. 19 (S): 163 - 172 (2011) © Universiti Putra Malaysia Press
Received: 3 May 2011Accepted: 28 July 2011*Corresponding Author
INTRODUCTIONIndividuals who identify themselves as gay, lesbian or bisexual describe their emerging sexual orientation as beginning with a sensation of being different from other members of their sex (Arey, 1995; Kaufman and Raphael, 1996). This identification of themselves as gay or lesbian is also known as the starting point of the ‘coming out’ process. Previously, coming out was viewed as a single event that occurred the first time a homosexual person identified himself or herself to another homosexual person (Hooker, 1965). Currently, however, coming out is suggested to involve two components: (1) acknowledging one’s sexual orientation to oneself; and (2) disclosing one’s sexual identity
to others (Cohen and Savin-Williams, 1996). It is also proposed that this coming out process occurs over and over again (Rhoads, 1994) as family, friends, colleagues, and others are informed of a person’s sexual identity.
Even though a person might face consequences of being rejected upon coming out, it is viewed as an important component in sexual identity development among gay and lesbian individuals (Cass, 1979; Troiden, 1979). There are several models that attempt to explain the process of sexual identity development among gay and lesbian individuals. These models can be organized into categories such as (a) general sexual identity development (Cass, 1979; Coleman, 1982; Troiden, 1989),
Sexual Identity and Sexual Fluidity among Gay Men and Lesbians
N. Subhi1*, D. Geelan2, S. Nen1, I. Fauziah1, M. S. Mohamad1, Z. M. Lukman1, K. Alavi1, S. M. Hoesni1 and H. M. Rusyda1
1School of Psychology and Human Development, Faculty of Social Sciences and Humanities,Universiti Kebangsaan Malaysia, 43600 UKM, Bangi, Selangor, Malaysia
2School of Education, Faculty of Social and Behavioural Sciences,The University of Queensland, Brisbane, QLD 4072, Australia.
*E-mail: [email protected]
ABSTRACTSexual identity development among gay men and lesbians consists an important component of coming out. Coming out is considered a vital component in the sexual identity development among gay men and lesbians. This paper explores the experiences of gay men and lesbians with respect to sexual identity development particularly in issues relating to sexual fluidity. Purposively selected 20 gay men and lesbians were involved in an in-depth semi structured interviews. The results found that 90% of male and 30% of female respondents came out to self in their teens. Male compared to female respondents seemed to portray an earlier age of coming out. Coming out to self and others was regardless of one’s age with the 40s as the latest age found in this study. Half of the respondents agreed that sexual fluidity could happen or indicated that they had heard of or witnessed sexual identity changes in someone. Some implications for better practice by mental health professionals in ensuring gay men and lesbians well being are provided.
Keywords: Sexual identity, sexual fluidity, coming out, well-being, gay men, lesbians

N. Subhi et al.
164 Pertanika J. Soc. Sci. & Hum. Vol. 19 (S) 2011
(b) gay men identity development (Alderson, 2003; McDonald, 1982; Troiden, 1979), (c) lesbian identity development (Chapman and Brannock, 1987; Sophie, 1986), and (d) valuative frameworks on sexual identity development and synthesis (Yarhouse, 2001).
The l i terature often treats identi ty development and the coming out process as synonymous. Some of the earliest models of sexual identity development (e.g., Cass, 1979; Coleman, 1982; Troiden, 1989) made the assumption that gay men and lesbians have virtually identical developmental experiences. However, several models have since emerged that attempted to focus on a particular gender on the assumption that men and women have different sexual development because of their anatomical differences. Thus, attempts have been made to confine sexual identity development within gender. For some gay and lesbian youth, sexual identity development might occur simultaneously and in juxtaposition with other associated factors such as race, gender, and religious identity development. Newman and Muzzonigro (1993) found that race alone had no systematic effects on how coming out was experienced unless the presence of traditional family values, which included religion, were taken into consideration in the process of one accepting a gay identity.
The valuative frameworks on sexual identity development and synthesis proposed by Yarhouse (2001) emerged based on the missing element of an integrated religious perspective in previously developed sexual identity models. The valuative framework challenged the strong essentialist view of sexual identity, which considered same-sex attraction as a fixed part of who one was and suggested that one needed to act on the inclination towards achieving identity synthesis (Yarhouse and Jones, 1997). At the same time, it was also possible for someone to identify as gay and lesbian, and, based on their valuative framework, opted not to act in any form of same-sex behaviour (Yarhouse et al., 2005). Yarhouse (2001) cautioned that making this claim without empirical support (e.g., indicating homosexual people might experience self-hatred
and despair) might lead to potential bias against those homosexual people who identified with the valuative framework.
D’Augelli (1994) viewed coming out as a fluid process influenced by personal subjectivities and actions, interaction with others and socio-historical connections. In a broader sense, this relates to the concept of sexual fluidity. This has also been referred to in different terms such as ‘erotic plasticity’, defined as “the degree to which a person’s sexual drive can be shaped and altered by cultural and social factors, from formal socialization to situational pressures” (Baumeister, 2000, p. 348). For example, a qualitative research study conducted by Evan and Broido (1999) reported that sexual fluidity within identity development created challenges with regard to coming out. This research was carried out on 20 GLB undergraduate students at the University Park campus of Pennsylvania State University living in a residence hall. The study was conducted using a constructivist framework with the intention of emphasizing how respondents made meaning of their personal experiences. Nonetheless, a more detailed discussion of Evan and Broido’s (1999) finding on sexual fluidity could make a valuable contribution to the field of sexual identity.
In general, the female sex drive was considered to be more malleable than the male sex drive, indicating that females possessed a higher level of sexual fluidity (Baumeister, 2000). Specifically, lesbians were more likely than gay men to report having previously identified as something other than homosexual and generally the model prior identification for lesbian was heterosexual while for gay men it was bisexual (Kinnish et al., 2005). A longitudinal study by Rosario et al. (2006) on 156 GLB youth showed that sexual identity could change over time with 18% of their participants transitioning from a bisexual to a gay or lesbian identity. Furthermore, Rosario et al. (2006) found that youth who transitioned continue to change their sexual orientation and sexual behavior to match their new sexual identity compared to those whose identity remained consistent. In
Sexual Identity and Sexual Fluidity among Gay Men and Lesbians
165Pertanika J. Soc. Sci. & Hum. Vol. 19 (S) 2011
other words, this suggests that sexual identity development continues after the adoption of the newly chosen sexual identity. Political ideology was found to be among the few reasons that could contribute to sexual fluidity (Baumeister, 2000). For example Charbonneau and Lander (1991) found one third of their sample of women who came out as a lesbian during midlife cited reading feminist texts as a cause of their action and indicated that lesbianism was an extension of the commitment to feminism. In that sample, women who came out as lesbians as an act of self-discovery underwent less adjustment difficulties than those who came out as lesbians through an active choice. A similar stand was noted by Kitzinger (1987) on the issue of coming out as a lesbian due to political reasons through a quote asserted by a feminist, “I take the label ‘lesbian’ as a part of the strategy of the feminist struggle” (p. 113).
As mentioned sexual identity development might occur simultaneously and intertwining with factors such as race, gender and religious development which can lead to personal and psychological effects faced by gays and lesbians. For example, Subhi et al. (2011) found that 80% of their gay and lesbian respondents were affected by the conflict between their Christianity and their homosexuality and found that the most common personal effects of the conflict faced included depression, self-blame/guilt, anxiety, suicidal ideation, and alienation. Suggestively, if the conflict was not handled accordingly it can inflict negative implications on their well-being. This has led to the increment of current literature discussing issues of well-being among gays and lesbians (e.g., Bauermeister et al., 2010; Beals and Peplau, 2005; Bouris et al., 2010; Diamond and Lucas, 2004; Mallon et al., 2002).
Various models have been proposed relating to sexual identity development and it would be unfortunate to limit this study to one particular theoretical model considering that more than one model might fit the various experiences reported by each gay man and lesbian (Reynolds and Hanjorgiris, 2000). The aim of this paper is to explore the experiences of gay men and lesbians in and around Brisbane with respect to sexual
identity and sexual fluidity together with how they attempted to make sense of the experiences reflecting on their well-being.
METHODSThis study comprised of 10 gay men and 10 lesbians living in the Brisbane City area and surrounding suburbs. During the time of interview the respondents’ ages ranged from 20 to 51 years (mean age 36.5 years old). The mean ages for gay men and lesbians were 35.4 and 37.5 years old, respectively. The majority of respondents had a high level of education with 18 respondents having completed tertiary degrees (8 males and 10 females). Of the remaining two male respondents, one possessed a secondary education background while the other possessed a primary education background.
Respondents started to become aware of their attraction towards the same sex at a range of ages from as early as 10-11 years old up until 41 years old. Respondents started off coming out to themselves first then only proceeded to come out to others. In terms of coming out to self, a total of 90% gay men and 30% lesbians came out during their teens while 10% gay men and 60% lesbians came out in their 20s with the remaining 10% of lesbians came out in their 40s. In terms of coming out to others, a total of 50% gay men and 10% of lesbians came out in their teens, 40% gay men and 70% came out in their 20s. The remaining 10% gay men and 20% of lesbians subsequently came out in their 30s and 40s.
Participation of respondents was on voluntary basis. This study was part of a larger research on a better understanding of the potential conflict between Christianity and homosexuality (Subhi et al., 2011). Respondents participated in two interview sessions with each interview lasted approximately an hour. Written informed consent was obtained upon respondents’ agreement to participate. Confidentiality and anonymity were assured. Inductive thematic analysis as outlined by Braun and Clarke (2006) and Boyatzis (1998) was used to analyze the interview. By means of open-ended questions, themes were

N. Subhi et al.
166 Pertanika J. Soc. Sci. & Hum. Vol. 19 (S) 2011
allowed to emerge without prior pre-supposing the important themes. Through this way, patterns were formed and investigated which assisted the researcher to understand and make meaning of the data collected (Patton, 2002). The process of data analysis in this study adhered to the strategy outlined by Cresswell (2003).
RESULTS AND DISCUSSIONComing out to self as gay or lesbian is considered to be an important developmental step for many homosexual youth (Evans and Broido, 1999). Prior to coming out to themselves as gay or lesbian, three respondents had same-sex attractions without any sexual connotation. More often than not this same-sex attraction was to someone the respondents looked up to, idolized or perceived as a role model.
Bobby revealed that he had a strong attraction towards one of his male teachers while he was in primary school, which was without any sexual feelings. The attraction towards this particular teacher might be hypothesized as a substitute for what he was missing out on in his relationship with his aggressive and abusive stepfather at home:
Well I had, I wasn’t really aware of it, really when I was little. I do remember though that I had a very strong attraction to a teacher but it wasn’t a sexual attraction… It was my first feeling of wanting to reach out to a man that was safe and that was a teacher and at that point I would probably have done anything to have his affection but thankfully nothing sexual happened so I understood intimacy between men without a homosexual connotation.
It is common for homosexual people to begin the process of identifying themselves as gay or lesbian by having an attraction towards those of the same sex very early in their life, which is usually before the age of puberty (Floyd and Stein, 2002). In the case of the present study, several respondents specifically mentioned
having attraction towards those of the same sex without any sexual connotation. The person that respondents were attracted to was usually someone who they respected, admired or simply looked up to (e.g., primary school teachers).
Respondents came out at various stages of their lives. Table 1 provides a summary of the ages respondents came out to self and others. Sarah came out to herself in her early teens. Sarah started to notice that her attractions differed from those of her schoolmates of the same gender between the ages of 12 and 13. She remembered that girls her age loved to buy magazines that contained the photos of the latest pop stars, which they would display as pin-ups on their bedroom wall. Although she tried to mimic the action, she was unsuccessful in trying to get the same feelings that her girlfriends were getting from the action:
I actually got the stickers and stuck them up on the wall but they were not doing the same thing to me as they were doing for everyone else and it became very clear to me what they were feeling for men or young boys, whatever it was I was having those same feelings but for the same sex. I didn’t know why.
Besides those respondents who came out as gay and lesbian early in their adolescence, respondent such as Jules came out to themselves only when they reached adulthood. Jules came out to himself as a gay man at the age of 22 years old. Although he had sexual encounters with men during his childhood and adolescent period he did not identify the experience as being same-sex attracted. To him it was more a matter of trying to fulfill the needs of love from the void left by his absent father as he described himself as the “kid looking for love but I was looking for love from all the wrong places”. Before he came out at the age of 22 years old, it was more a case of trying to deny his homosexuality. He described this rationalization process by saying, “It’s more of you’re used to doing it with men. So you’re going back to men.”

Sexual Identity and Sexual Fluidity among Gay Men and Lesbians
167Pertanika J. Soc. Sci. & Hum. Vol. 19 (S) 2011
For all of the respondents, the process of coming out to others occurred after the respondents had already come out to themselves. In order to come out to others, usually the respondents tried to evaluate the character along with the relationship of the person that he or she intended to disclose to. Only when the respondents sensed that there was a high chance of acceptance did they come out. Nevertheless there were also occasions when miscalculations resulted in different reactions from what they expected.
For some respondents, their experience of coming out to others happened smoothly. This might be due to their accurate judgment and luck in terms of identifying the correct person that they intended to disclose their homosexuality to. Dan was an example who had a smooth experience when disclosing their homosexuality for the first time to others. Dan came to Brisbane to pursue his studies. While he was in his home country Dan did not have the chance to disclose his homosexuality. Because he came from a very religious family and because the culture
TABLE 1 Age (years) of coming out to self and coming out to others among male and female respondents
Respondents Age (years) of coming out to self Age (years) of coming out to others10-19 20-29 30-39 40-49 10-19 20-29 30-39 40-49
MalesDan ü ü
Ivan ü ü
Josh ü ü
Charles ü ü
Jules ü ü
Jason ü ü
Mike ü ü
Bobby ü ü
Clark ü ü
Roger ü ü
Respondents Age (years) of coming out to self Age (years) of coming out to others10-19 20-29 30-39 40-49 10-19 20-29 30-39 40-49
FemalesCasey ü ü
Maggie ü ü
Maria ü ü
Shawna ü ü
Sandra ü ü
Helena ü ü
Suzy ü ü
Ellen ü ü
Sarah ü ü
Wynona ü ü

N. Subhi et al.
168 Pertanika J. Soc. Sci. & Hum. Vol. 19 (S) 2011
within his home country was intolerant of homosexuality, Dan had to repress and suppress his homosexuality until he arrived in Brisbane. The first two people that Dan came out to were his student advisor and language advisor. The response he received was very comforting and supportive, which built his self-confidence:
Well, I had support last year and I have support this year. I came out to my student advisor and my language advisor at my previous campus, when I was doing foundation and they were both very supportive of me, and that was the first time. They were the first two straight people I’ve actually come out to. So that was very assuring.
Converse to the smooth experiences shared, the first coming out experiences of some respondents were negative. One example was the case of Wynona who possibly had made an incorrect intuition and judgment prior to coming out. Wynona was in her teens during the early 1970s. She explained that identifying as a GLBTI person then was very different from now, especially in terms of tolerance and acceptance. She perceived that society back then was not as open minded as society today and there were very limited services, if any that catered to the GLBTI community:
I think it’s easier now because you have services set up; you have counseling services, hotlines and Open Doors which is an organization specific to young people who might identify or might be questioning. There are places that you can go. I think it’s a lot more out and about than what it was back then. It wasn’t so acceptable, society wasn’t so embracing and communities weren’t so embracing. Police have now got liaison officers. None of that stuff happened back in the ‘70’s. I think you get a better chance of being able to find some sort of support than what you could back then.
Therefore Wynona stated that the coming out process was more complicated back then. She had a bad experience with her mother who confronted her after suspecting that she was having an intense relationship with a girl from church. This happened when Wynona was about 17 years old. Her mother was furious when Wynona confided that she was sexually attracted to her girlfriend. Her mother organized the pastor to counsel her about it and after that her mother became more vigilant about her behavior and whereabouts.
Coming out is seen as a recurring process in life (Rhoads, 1994), and, therefore, there are generally bound to be a mixture of positive and negative experiences of coming out to others. The case of Helena was chosen as the best example to illustrate such mixed experiences. Helena also received mixed responses in her experience of coming out to others. When she disclosed her sexual identity to her sisters they took it very well. She mentioned that they “never said anything bad” concerning her homosexuality. On the other hand her mother did have an issue about it and her most memorable phrase was, “I’m not accepting this!” With time, however, she was able to “get her head around it” and now after about eight years the issue has been resolved between them.
Helena also shared her experiences of the reactions that she had received from others besides her immediate family members regarding her homosexuality. Such reactions tended to become very intimidating and frustrating:
I find throughout my life people can say to you like you know… “I’m very gay friendly and I have nothing against you and your girlfriend,” and that’s all good and well just so long as it doesn’t encroach in their life. Once you get a little bit too close to their life the walls go up and you’re shut out and I had that done numerous times.
Because of the varied responses to her homosexuality, Helena had become a very private person in terms of living her daily life.

Sexual Identity and Sexual Fluidity among Gay Men and Lesbians
169Pertanika J. Soc. Sci. & Hum. Vol. 19 (S) 2011
She avoided socializing with friends from work and would much prefer to relax at home in the company of her partner or once in a while hung out with their close but limited number of friends.
The present study indicated that more males than females came out to themselves at an earlier stage of their life, a finding that concurs with other studies (e.g., D’Augelli, 2002; Floyd and Bakeman, 2006; Maguen et al., 2002), which also indicated that gay men would have an earlier awareness and self-identify sooner than lesbians. However, there seems to be a discrepancy in the timing of coming out to others between male and female respondents of the present study compared to other past studies. In the present study, more females came out to others later in their lives compared to males when 20 years and older was taken as the cut off age. This finding contrasts with previous studies, which all found females to have a lesser mean age of coming out to others compared to males (D’Augelli, 2002; Floyd and Bakeman, 2006; Maguen et al., 2002). One reason that might have contributed to the difference in the findings might be because the present research study has a slightly older cohort of female respondents compared to the three studies mentioned above – homophobia has decreased as time progressed (Loftus, 2001; Yang, 1997). Tentatively, this finding suggests that it may be easier to come out in the present social climate than it was in the past. Furthermore, the few respondents who were still in their 20s at the time of interview either attended church school or grew up in a small town that was considered to have a more homophobic environment. For example, farmer David Graham of television reality show Big Brother 2006 in an interview with Qnews answered, “Uber lonely. You feel like you can’t be open and therefore you can’t be honest. You feel like you have to deny your real self. A self imposed isolation for fear of being outed,” when asked, “What’s it like to be gay in the country?” (“David Graham,” 2006, p. 32).
When the respondents were asked whether in their opinion sexual preferences and identities may change over time, 50% responded that this
could happen or indicated that they had heard of or witnessed sexual identity changes in someone or even experienced it themselves. In a way this reflects on the fluidity issue that exists within the construct of sexual identity development (Baumeister, 2000). Roger agreed strongly with the idea of fluid sexual identities, saying,
Oh certainly! I know some friends that have come from being a heterosexual and then become gay and towards the end of their relationship in the gay scene they have actually gone back to being heterosexual.
In trying to understand more about the issue of fluidity in sexual identity development, the cases of Suzy was highlighted as the best possible example. Suzy also shed light on the issue of the fluidity of sexual identity. At the time of the study Suzy was a 50 year old woman who came out as a lesbian in her 40s, initially for a political reason, because of her understanding that heterosexuality was “by its very nature in our society bad for women because it means that we live oriented to what men want and what men think”. So for Suzy primarily it was about becoming “a woman centered woman and putting her energy into women and not into men”. The choice of fully coming out as a lesbian also coincided with her recently strong belief in feminism. Suzy’s personal choice of adopting feminism made her strongly want to identify as a lesbian and was consistent with reports of some females coming out as lesbians for political reasons associated with the women’s movement (Baumeister, 2000).
Before taking on feminism and becoming a lesbian Suzy was married to her ex-husband who worked for a Christian church for 22 years. Suzy bore two children in the marriage. She explained that during the whole period of her life while she was in the marriage they were “fairly like a conventional nuclear family with mum, dad and two kids”. After quite a number of years within the church organization they both became quite disillusioned with their congregation, which they felt was becoming like a cult and was also very
N. Subhi et al.
170 Pertanika J. Soc. Sci. & Hum. Vol. 19 (S) 2011
restrictive and misogynistic. Thus they both left the church. Not long after that their marriage also ended.
Previous to identifying as a lesbian Suzy admitted that she was never sexually attracted to any women, “I had close affective bonds with women but I have no awareness of being sexually attracted to women at all until my first girlfriend in ‘99 when I was 41”. For Suzy her transition in becoming a lesbian went quite smoothly because of two factors: (1) she had left Christianity and its proscription of homosexuality earlier and, therefore, experienced no guilt about the Christian stance on homosexuality; (2) she had been allowing her mind to fantasize about living a lesbian lifestyle before actually entering a lesbian relationship; “I took to it like a duck to water as they say.”
It seems that from the respondents’ perspective the issue of sexual fluidity remains an open debate. Of the total respondents, 50% agreed that sexual preferences and identities could change over time. The example of Suzy strongly suggests that sexual identity and preference could change throughout one’s course of life. Certain prominent events that occurred in life but would not immediately be associated with sexual identity, such as those previously mentioned, could trigger these sexual identity and preference changes.
The present study provides some support for the argument that sexual fluidity occurs within sexual identity development for both males and females. Half of the total respondents agreed to the notion that sexual preferences and identities could change over time. Excluding those who had been married before coming out as gay or lesbian, only representatives from the female group have actually ‘experimented’ with sexual activity with the opposite sex before later identifying as lesbian. This pattern relates to the reported higher level of sexual fluidity in females as compared to males (Kitzinger and Wilkinson, 1995).
CONCLUSIONIn conclusion, the present study revealed that male respondents came out sooner to themselves compared to female respondents. Moreover, male respondents were also found to be more at ease towards coming out to self and others compared to female respondents. Coming out to self and others occurs regardless of one age. At the same time the present study found that fluidity occurs within the sexual identity development of both males and females with half of the total respondents agreeing to the notion that sexual preferences and identities could change over time. The findings of this study can better assist mental health professionals especially counselors and therapists who deal with gay men and lesbians particularly during the turmoil process of coming out and securing a sexual identity.
This study has some implications for better practice by mental health professionals in ensuring gay men and lesbians well being are provided. Undeniably there may be some members of these professions still portraying feelings and attitudes that are heterosexist and sometimes homophobic. Rejection of sexual identity being experienced by respondents would be harmful (e.g., self-esteem shattered, trust robbed, self-guilt, and alienation increased). Therefore, mental health professionals who are incapable of dealing with the issues raised should refer clients to another mental health professionals or appropriate agency capable of dealing with it. Mental health professionals also need to respond to the request from clients wanting referral to other client facing the same issue (upon prior approval of the intended referral). For those mental health professionals that take up the challenge to deal with sexual identity issue among gay and lesbian they have to bear in mind of the possibility of sexual fluidity amongst their gay and lesbian clients in order to ensure their clients’ well being.

Sexual Identity and Sexual Fluidity among Gay Men and Lesbians
171Pertanika J. Soc. Sci. & Hum. Vol. 19 (S) 2011
REFERENCESAlderson, K. G. (2003). The ecological model of gay
male identity. The Canadian Journal of Human Sexuality, 12(2), 75-85.
Arey, D. (1995). Gay males and sexual child abuse. In L. A. Fontes (Ed.), Sexual abuse in nine North American cultures: Treatment and prevention (pp. 200-235). Thousand Oaks, CA: Sage Publications.
Baumeister, R. F. (2000). Gender differences in erotic plasticity: The female sex drive as socially flexible and responsive. Psychological Bulletin, 126(3), 347-374.
Bauermeister, J. A., Johns, M. M., Sandfort, T. G. M., Eisenberg, A., Grossman, A. H., & D’Augelli, A. R. (2010). Relationship trajectories and psychological well-being among sexual minority youth. Journal of Youth and Adolescence, 39, 1148-1163.
Beals, K. P., & Peplau, L.A. (2005). Identity support, identity devaluation, and well-being among lesbians. Psychology of Women Quarterly, 29, 140-148.
Bouris, A., Guilamo-Ramos, V., Pickard, A., Shiu, C., Loosier, P. S., Dittus, P., et al. (2010). A systematic review of parental influences on the health and well-being of lesbian, gay, and bisexual youth: Time for a new public health research and practice agenda. Journal of Primary Prevention, 31, 273-309.
Boyatzis, R. E. (1998). Transforming qualitative information: Thematic analysis and code development. Thousand Oaks, CA: Sage Publications.
Braun, V., & Clarke, V. (2006). Using thematic analysis in psychology. Qualitative Research in Psychology, 3, 77-101.
Cass, V. C. (1979). Homosexual identity formation: A theoretical model. Journal of Homosexuality, 4(3), 219-235.
Chapman, B. E., & Brannock, J. C. (1987). Proposed model for lesbian identity development: An empirical examinat ion. Journal of Homosexuality, 14(3/4), 69-80.
Charbonneau, C., & Lander, P. S. (1991). Redefining sexuality: Women becoming lesbian in midlife. In B. Sang, J. Warshow, & A. J. Smith (Eds.), Lesbian at midlife: The creative transition (pp. 35-43). San Francisco: Spinsters Books.
Cohen, K. M., & Savin-William, R. C. (1996). Developmental perspective on coming out to self and others. In K. M. Cohen, & R. C. Savin-William (Eds.), The lives of lesbians, gays, and bisexuals: Children to adults (pp. 113-151). Fort Worth, TX: Harcourt Brace College.
Coleman, E. (1982). Development stages of the coming out process. Journal of Homosexuality, 7(2/3), 31-43.
Cresswell, J. W. (2003). Research design: Qualitative, quantitative and mixed methods approaches. Thousand Oaks, California: Sage Publication.
D’Augelli, A. R. (1994). Identity development and sexual orientation: Toward a model of lesbian, gay, and bisexual development. In E. J. Trickett, R. J. Watts & D. Birman (Eds.), Human diversity: Perspectives on people in context (pp. 312-333). San Francisco, CA: Jossey-Bass.
D’Augelli, A. R. (2002). Mental health problems among lesbian, gay, and bisexual youths ages 14 to 21. Clinical Child Psychology and Psychiatry, 7(3), 433-456.
David Graham: The real former Dave (part 2). (2006, November). QNews, 156, 32.
Diamond, L. M., & Lucas, S. (2004). Sexual-minority and heterosexual youths’ peer relationships: Experiences, expectations, and implications for well-being. Journal of Research on Adolescence, 14(3), 313-340.
Evans, N. J., & Broido, E.M. (1999). Coming out in college residence halls: Negotiation, meaning making, challenges, supports. Journal of College Student Development, 40(6), 658-668.
Floyd, F. J., & Bakeman, R. (2006). Coming-out across the life course: Implications of age and historical context. Archives of Sexual Behavior, 35(3), 287.
Floyd, F. J. & Stein, T. S. (2002). Sexual orientation identity formation among gay, lesbian, and bisexual youths: Multiple patterns of milestone experiences. Journal of Research on Adolescence, 12(2), 167-191.
N. Subhi et al.
172 Pertanika J. Soc. Sci. & Hum. Vol. 19 (S) 2011
Hooker, E. A. (1965). Male homosexuals and their worlds. In J. Marmor (Ed.), Sexual inversion: The multiple roots of homosexuality (pp. 83-107). New York: Basic Books.
Kaufman, G., & Raphael, L. (1996). Coming out shame: Transforming gay and lesbian lives. New York: Doubleday.
Kinnish, K. K., Strassberg, D. S., & Turner, C. W. (2005). Sex differences in the flexibility of sexual orientation: A multidimensional retrospective assessment. Archives of Sexual Behavior, 34(2), 173.
Kitzinger, C. (1987). The social construction of lesbianism. London: Sage Publications.
Kitzinger, C., & Wilkinson, S. (1995). Transitions from heterosexuality to lesbianism: The discursive production of lesbian identities. Developmental Psychology, 31(1), 95-104.
Loftus, J. (2001). America’s liberation in attitudes toward homosexuality, 1973 to 1998. American Sociological Review, 66(5), 762-782.
Maguen, S., Floyd, F. J., Bakeman, R., & Armistead, L. (2002). Developmental milestones and disclosure of sexual orientation among gay, lesbian, and bisexual youths. Journal of Applied Developmental Psychology, 23(2), 219-233.
Mallon, G. P., Aledort, N., & Ferrera, M. (2002). There’s no place like home: Achieving safety, permanency, and well-being for lesbian and gay adolescents in out-of-home care settings. Child Welfare, LXXX1(2), 407-439.
McDonald, G. J. (1982). Individual differences in the coming out process for gay men: Implications for theoretical models. Journal of Homosexuality, 8(1), 47-60.
Newman, B. S., & Muzzonigro, P. G. (1993). The effect of traditional family values on the coming out process of gay male adolescents. Adolescence, 28(109), 213-226.
Patton, M. Q. (2002). Qualitative research & evaluation methods (3rd ed.). Thousand Oaks: Sage Publications.
Reynolds, A. L., & Hanjorgiris, W. F. (2000). Coming out: Lesbian, gay, and bisexual identity development. In R. M. Perez, K. A. DeBord, & K. J. Bieschke (Eds.), Handbook of counseling
and psychotherapy with lesbian, gay, and bisexual clients (pp. 35-55). Washington DC: American Psychological Association.
Rhoads, R. A. (1994). Coming out in college: The struggle for a queer identity. Westport, CT: Bergin & Garvey.
Rosario, M., Schrimshaw, E. W., Hunter, J., & Braun, L. (2006). Sexual identity development among lesbian, gay, and bisexual youths: Consistency and change over time. The Journal of Sex Research, 43(1), 46.
Sophie, J. (1986). A critical examination of stage theories of lesbian identity development. Journal of Homosexuality, 12(2), 39-51.
Subhi, N., Geelan, D., McMahon, M., Jusoff, K., Mohamad, M. S., & Sarnon, N. (2011). A better understanding of the potential conflict between Christianity and homosexuality. World Applied Sciences Journal, 12(Special Issue of Social and Psychological Sciences for Human Development), 13-19.
Troiden, R. R. (1979). Becoming homosexual: A model of gay identity acquisition. Psychiatry, 42.
Troiden, R. R. (1989). The formulation of homosexual identities. Journal of Homosexuality, 17(1/2), 43-73.
Yang, A. S. (1997). The poles-trends: Attitudes toward homosexuality. Public Opinion Quarterly, 61(3), 477-507.
Yarhouse, M. A. (2001). Sexual identity development: The influence of valuative frameworks on identity synthesis. Psychotherapy, 38(3), 331-341.
Yarhouse, M. A., Brooke, H. L., Pisano, P., & Tan, E. S. N. (2005). Project inner compass: Young adults experiencing sexual identity confusion. Journal of Psychology and Christianity, 24(4), 352-360.
Yarhouse, M. A., & Jones, S. L. (1997). A critique of materialist assumptions in interpretations of research on homosexuality. Christian Scholar’s Review, 26(4), 478-495.
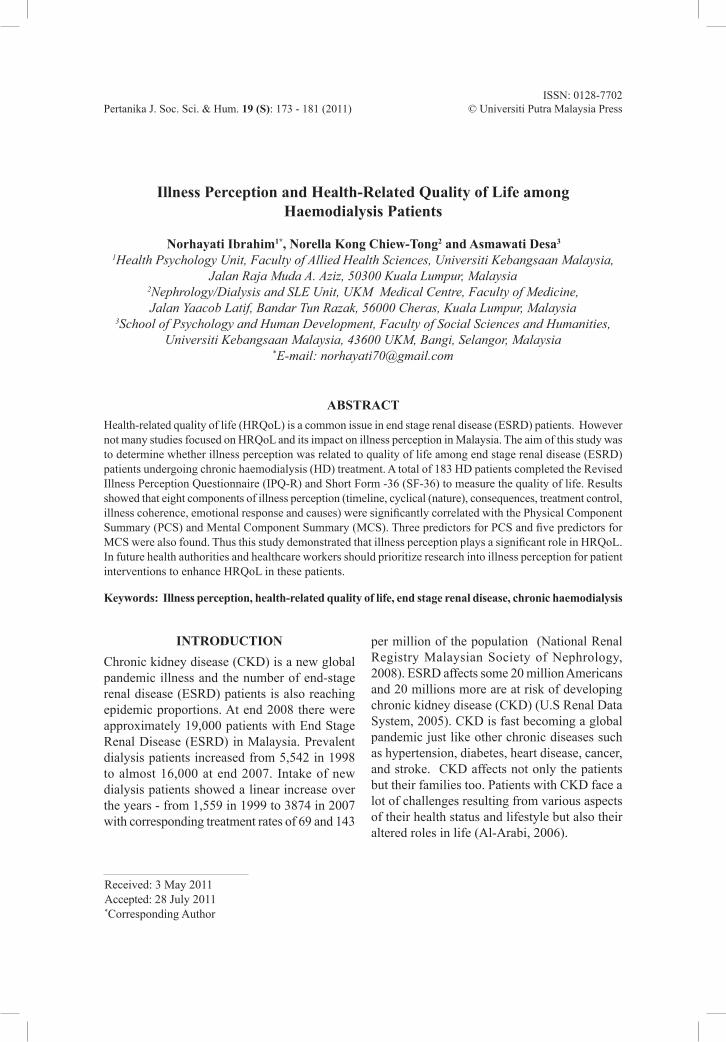
ISSN: 0128-7702Pertanika J. Soc. Sci. & Hum. 19 (S): 173 - 181 (2011) © Universiti Putra Malaysia Press
Received: 3 May 2011Accepted: 28 July 2011*Corresponding Author
INTRODUCTIONChronic kidney disease (CKD) is a new global pandemic illness and the number of end-stage renal disease (ESRD) patients is also reaching epidemic proportions. At end 2008 there were approximately 19,000 patients with End Stage Renal Disease (ESRD) in Malaysia. Prevalent dialysis patients increased from 5,542 in 1998 to almost 16,000 at end 2007. Intake of new dialysis patients showed a linear increase over the years - from 1,559 in 1999 to 3874 in 2007 with corresponding treatment rates of 69 and 143
per million of the population (National Renal Registry Malaysian Society of Nephrology, 2008). ESRD affects some 20 million Americans and 20 millions more are at risk of developing chronic kidney disease (CKD) (U.S Renal Data System, 2005). CKD is fast becoming a global pandemic just like other chronic diseases such as hypertension, diabetes, heart disease, cancer, and stroke. CKD affects not only the patients but their families too. Patients with CKD face a lot of challenges resulting from various aspects of their health status and lifestyle but also their altered roles in life (Al-Arabi, 2006).
Illness Perception and Health-Related Quality of Life among Haemodialysis Patients
Norhayati Ibrahim1*, Norella Kong Chiew-Tong2 and Asmawati Desa3
1Health Psychology Unit, Faculty of Allied Health Sciences, Universiti Kebangsaan Malaysia,Jalan Raja Muda A. Aziz, 50300 Kuala Lumpur, Malaysia
2Nephrology/Dialysis and SLE Unit, UKM Medical Centre, Faculty of Medicine,Jalan Yaacob Latif, Bandar Tun Razak, 56000 Cheras, Kuala Lumpur, Malaysia
3School of Psychology and Human Development, Faculty of Social Sciences and Humanities,Universiti Kebangsaan Malaysia, 43600 UKM, Bangi, Selangor, Malaysia
*E-mail: [email protected]
ABSTRACTHealth-related quality of life (HRQoL) is a common issue in end stage renal disease (ESRD) patients. However not many studies focused on HRQoL and its impact on illness perception in Malaysia. The aim of this study was to determine whether illness perception was related to quality of life among end stage renal disease (ESRD) patients undergoing chronic haemodialysis (HD) treatment. A total of 183 HD patients completed the Revised Illness Perception Questionnaire (IPQ-R) and Short Form -36 (SF-36) to measure the quality of life. Results showed that eight components of illness perception (timeline, cyclical (nature), consequences, treatment control, illness coherence, emotional response and causes) were significantly correlated with the Physical Component Summary (PCS) and Mental Component Summary (MCS). Three predictors for PCS and five predictors for MCS were also found. Thus this study demonstrated that illness perception plays a significant role in HRQoL. In future health authorities and healthcare workers should prioritize research into illness perception for patient interventions to enhance HRQoL in these patients.
Keywords: Illness perception, health-related quality of life, end stage renal disease, chronic haemodialysis

Norhayati Ibrahim, Norella Kong Chiew-Tong and Asmawati Desa
174 Pertanika J. Soc. Sci. & Hum. Vol. 19 (S) 2011
ESRD occurs when the kidneys are no longer able to clean and filter waste products and remove excess fluids from the blood circulation. This endangers the patient’s life due to the accumulation of fluid and waste products of metabolism. The disease can have an impact on patients’ health-related quality of life (HRQoL), potentially affecting their physical and mental health, functional status, independence, general well-being, inter-personal relationships, and social functioning (Lok, 1996; Fallon et al., 1997; Blake et al., 1999; Suet-Ching, 2001; Bakewell et al., 2002). The importance of assessing HRQoL in patients with ESRD has been increasingly recognized over the past two decades. Indeed, HRQoL in hemodialysis (HD) patients has recently been shown to be a significant predictor of mortality and hospitalization (Mapes et al., 2003). In order to optimize dialysis therapy, HRQoL of ESRD patients is also important and needs to be improved. To improve the HRQoL of these patients, it is important to identify factors that affect their illness (Kalantar-Zadeh et al., 2001; Stull et al., 2001; Rumsfeld et al., 1999; DeOreo, 1997; Tibblin et al., 1993).
The terms “illness perception”, “illness representation”, “illness cognition”, and “illness belief” are often used interchangeably in the literature. Illness perception is the organized cognitive representation or belief that patients have about their illness. This perception has been found to be an important determinant of behavior and has been associated with a number of important outcomes such as treatment adherence, functional recovery (Leventhal et al., 1997) and HRQoL (Timmers et al., 2008; Fowler et al., 2006). The idea patients have about their illness have been most effectively researched within the Model of Common-Sense, previously referred to as the Theory of Self-Regulation developed by Leventhal and colleagues (Diefenbach and Leventhal, 1996). Such representations come into play as soon as patients experience their initial symptoms and typically change with disease progression, emergent symptoms and treatment responses. Leventhal et al. (1984) proposed that the
representations reflect the patients’ cognitive responses to symptoms and illness and that emotional responses are processed in parallel with these illness representations.
Although understanding how patients’ perception of their illness will impact on how they cope with and adapt to their disease, only few and limited studies have been carried out to date. There is evidence to show that response to an event is flavored by the individual’s knowledge, capabilities, life experiences, and socio-cultural background (Holaday, 1989). Some patients may perceive illness in wholly negative terms and define it as a freedom adversary. When illness is perceived with the sense of doom or viewed solely in terms of decline and loss, a negative experience is likely to follow. A negative perception of illness seeds unhappiness and depression. Perception improves when illness is viewed as something that occurs within a context. Viewing illness as a normal part of life allows patients to live more fully in the present, such a view seeds positive return.
Quality of life in patients with chronic illness has been studied extensively and results have shown that the level of disability as experienced by the patients cannot be explained by mere biomedical variables. Therefore, research on HRQoL has focused on other factors that influence the perceived impact of the illness. The patients’ own perceptions of an illness were found to play an important role on their HRQoL. Timmers and colleagues (2008) had reported that the illness perceptions of ESRD patients on both HD and peritoneal dialysis (PD) therapies markedly impacted on their HRQoL. Their study involved 91 HD and 42 PD patients assessed with the Revised-Illness perception Questionnaire (IPQ-R) and SF-36. Their results showed that PD patients experienced more personal control and had a better understanding of their illness compared to HD patients. Their illness perception scores ranged from 17% to 51% of the variance in HRQoL. Perception of more symptoms, more consequences and reduced personal control were associated with a lower well-being.

Illness Perception and Health-Related Quality of Life among Haemodialysis Patients
175Pertanika J. Soc. Sci. & Hum. Vol. 19 (S) 2011
Fowler and Baas (2006) studied illness representations in 42 patients with CKD on maintenance haemodialysis. Illness perception was examined based on the Common-sense Model of Illness as described by Leventhal et al. (1997). Their study used the IPQ-R, the Index of Well-being (IWB) and brief demographic forms. Their results showed that there was a strong association between the emotional component of illness perception and QoL. The second subscale used was Consequences which is a strong component of the cognitive process involved in illness perception. That is, as consequences increased, the HRQoL decreased. There was an inverse relationship between consequences and HRQoL. Other scales which included identity, timeline, personal control and illnesses coherence were not associated with HRQoL.
Covic and colleagues (2004) studied illness representations and HRQoL scores in 82 HD patients. In this cross-sectional study, they examined the impact of illness representation on HRQoL of HD patients and the influence of HD duration. They used the Health- related quality of life questionnaire to assess HRQoL and the Revised Illness Perception Questionnaire for assessing illness representations. They found a relatively low HRQoL among HD patients, with a significant proportion scoring less than 43 for the physical component summary (65.9%) and less than 51 for the mental component summary (58.5%). HD patients consider their illness as having a chronic course, which they understood and controlled quite well. A higher personal control was associated with a lower emotional response and a better understanding of their disease. However, the perceived negative consequences of the disease upon patients’ personal lives and their emotional response were considerable.
Given the importance of HRQoL measures in predicting patient outcomes and the modifiable nature of illness representations held by ESRD patients on chronic maintenance HD, we aimed to investigate the relationship between their illness perception and HRQoL and to determine whether illness perception predicts HRQoL in these patients.
METHODSThis was a prospective cross-sectional study. Participants were assessed using the Short Form - 36 (SF-36) and Revised Illness Perception Questionnaire (IPQ-R). Patients receiving HD for less than three months were excluded. It was approved by the Hospital Universiti Kebangsaan Malaysia (HUKM) Ethics and Research Committee and informed consent was also obtained from the patients. HRQoL was the dependent variable and illness perception was the independent variable.
The participants in this study included 183 patients with ESRD who were undergoing HD treatment at outpatient facilities affiliated with HUKM. These involved satellite HD centres at Bandar Tasik Selatan, HUKM and Universiti Kebangsaan Malaysia (UKM) Bangi in Selangor. Dialysis patients at MAA- Medicare Kidney Charity Fund Dialysis Centre at Jalan Ipoh, Kajang, and Cheras were also recruited.
Short Form - 36 (SF-36): Quality of life was assessed using the Short Form-36 (SF-36). The SF-36 evaluates various aspects of functioning and well-being so as to provide an overall impression of HRQoL and was developed as the best compromise between response burdens. It is a generic self completed questionnaire with eight dimensions. These eight dimensions include physical functioning, physical role limitation, emotional role limitation, social functioning, pain, mental health, social functioning, and general health perception. These contribute to the evaluation of two major aspects of patients’ functioning - physical (physical component summary, PCS) and mental (mental component summary, MCS) (Ware et al., 1993). It takes about 15 minutes to answer the question. Scoring is by summing the responses for each of the items in the dimensions and converting them by a scoring algorithm to a scale from 0 (poor health) to 100 (good health). A higher score indicates better functioning, less pain or greater well-being.
Revised Illness Perception Questionnaire (IPQ-R): Illness perception was assessed with the well-validated Revised Illness Perception

Norhayati Ibrahim, Norella Kong Chiew-Tong and Asmawati Desa
176 Pertanika J. Soc. Sci. & Hum. Vol. 19 (S) 2011
Questionnaire developed by Moss-Morris et al. (2002). The IPQ-R assesses nine components of illness representation in three sections. The first section asks about the subscale Identity – in which participants are asked yes/no questions about 18 different symptoms and whether they believe these symptoms to be related to being on HD. The second section consists of 38 questions which address seven subscales - time-line, cyclical (nature), consequences, personal control, treatment control, coherence and emotional response. The patients rate the items on a five-point scale, ranging from ‘strongly
disagree’ to ‘strongly agree’. The Time-line dimension is assessed by six items. A higher score on this dimension indicates the patient’s perception of the chronic course of the disease. Cyclical is assessed by four items whereby patients view their illness as episodes that come and go over time. The Consequence dimension is assessed by six items and a higher score indicates that the patient considers the disease as having serious consequences upon his/her life. Personal control dimension assessment comprises five items and a higher score indicates the perception of better personal control of the disease.
Treatment control is assessed by five items, and a higher score indicates that the patient considers HD to be efficient in controlling ESRD. Coherence is a measure of how well the patient understands his illness. It is evaluated by five items - a higher score indicates the patient’s increased understanding of ESRD. The last dimension assesses Emotional response and has six items. A higher score in this dimension indicates more intense emotional reaction to the disease. The final section focuses on the subscale Causes. This scale consists of 18 possible causes for being on dialysis (e.g., lifestyle, hereditary factors, chance, behaviour, uncertainty). This scale also uses the five point Likert scale.
A cross-sectional design to investigate illness perception and HRQoL at a certain moment in time was used. Data were analysed with SPSS for Windows (version 18.0). Correlation analysis used the Pearson correlation coefficient. A stepwise multiple regression
procedure was conducted to predict illness perception on patients’ HRQoL (PCS and MCS).
RESULTS AND DISCUSSIONThe patients’ demographic profiles are as shown in Table 1. Of the 183 patients 54.1% were male and 44.9% were female. There were 40.4% Malays, 44.8% Chinese, 12% Indians, and 2.7% others. With regards to their religious affiliation, there were 44.3% Muslims, 31.1% Buddhists, 12% Hindus, 4.9% Christians, and 7.7% others. Majority (80.3%) of the participants were married.
TABLE 1 Demographic profile of study patients
Variable Frequency Percentage (%)Gender Male Female
9984
54.144.9
EthnicityMalayChineseIndianOthers
7482225
40.444.8122.7
Religion IslamBuddhismHinduismChristianityOthers
815722914
44.331.112.04.97.7
Marital status MarriedSingleDivorcedWidowed
14715516
80.38.212.78.7
Total (n) 183 100%
The reliability of both the instruments - SF 36 and IPQ-R - was first assessed in the study. The Cronbach alpha reliability coefficients were calculated for each of the subscales of the IPQ-R and the SF-36. The alpha levels are presented in Table 2. All illness perception subscales demonstrated adequate reliability

Illness Perception and Health-Related Quality of Life among Haemodialysis Patients
177Pertanika J. Soc. Sci. & Hum. Vol. 19 (S) 2011
(alpha levels > 0.70) with the exception of the treatment control subscale of the IPQ-R, which had a reliability of only 0.51. The SF-36 demonstrated excellent internal consistency in this sample of patients with ESRD with Cronbach alpha values 0.65 to 0.89.
Results in Table 2 showed that patients described their illness as chronic and perceived the symptoms of their disease as changing over time. Patients also perceived that the disease had a high impact on their life style. However, they still believed that the treatment they received could control their illness. Patients also strongly believed in personal control towards the disease and understood their illness well. In terms of emotional response, a high emotional instability was evident. Patients also described that although many causes had led to the ESRD, they experienced few symptoms.The patients in this study had a high HRQoL
in all eight components namely, physical functioning, physical role limitation, emotional role limitation, social functioning, pain, mental health, and general health perception.
The relationship between the dimensions of Illness perception and HRQoL are presented in Table 3. Except for personal control with PCS, all other components of illness perception which included identity, timeline, cyclical, consequences, illness coherence, emotional response, and causes were highly correlated with PCS and MCS. However, the correlations with identity, time line, cyclical, consequences, emotional response and causes were in a negative direction. Thus patients perceived their illness to be of a chronic and cyclical nature (comes and goes over time) with associated low PCS and MCS. Patients who perceived their disease as having serious consequences also had associated low PCS and MCS. On the other hand, patients
TABLE 2 Mean scores, standard deviation and reliability analysis
Scale Score range Mean SD Alpha valueIllness perception(IPQ-R)
Time line (acute-chronic) 6-30 23.94 4.91 0.82Cyclical 4-20 13.60 3.36 0.72Consequences 6-30 21.60 4.63 0.70Personal control 6-30 18.70 4.25 0.70Treatment control 2-25 16.91 3.23 0.51Illness coherence 5-25 16.03 4.49 0.77Emotional response 2-30 18.13 5.30 0.72Causes 19-95 49.51 10.79 0.79Identity 0-18 8.84 3.96 0.80Quality of Life (SF 36)Physical functioning 0-100 72.57 18.15 0.89Role physical 0-100 68.44 19.78 0.84General health 0-100 74.07 22.34 0.68Vitality 0-100 58.56 15.54 0.82Bodily pain 0-100 60.22 19.77 0.75Social functioning 0-100 77.32 21.53 0.65Role emotional 0-100 74.95 21.74 0.84Mental health 0-100 71.04 19.44 0.87

Norhayati Ibrahim, Norella Kong Chiew-Tong and Asmawati Desa
178 Pertanika J. Soc. Sci. & Hum. Vol. 19 (S) 2011
with a lower emotional response to the disease attained a better PCS and MCS. Patients who perceived more symptoms and causes related to their illness also had a lower PCS and MCS.
However, there was a positive association between personal control with MCS and illness coherence components with PCS and MCS. Patients who scored higher on personal control had a better MCS. Positive correlation for illness coherence means that the more the patient understood his/her disease, the better his/her PCS and MCS.
TABLE 3 Pearson’s correlations between illness
perception and health related quality of life - physical component score (PCS) and mental
component score (MCS)
Variable illness perceptions PCS MCS
Identity -0.40** -0.35**
Time-line -0.17* -0.18*
Cyclical -0.25** -0.21**
Consequences -0.48** -0.40**
Personal control 0.13 0.15*
Treatment control 0.17* 0.23*
Illness coherence 0.31** 0.35**
Emotional response -0.36** -0.44**
Causes -0.29** -0.22**
**p<0.01 *p<0.05
A stepwise multiple regression procedure was conducted to examine the relationship between Illness perception with PCS and MCS. Results are shown in Table 4. Of the nine predictors, only three (Model 3) contributed to the variance in PCS with 33.3%. The highest contribution came from the Consequences variable (22.6%).
TABLE 4 Predictors of PCS using multiple
regression analysis
Model R R Square Adjusted R square
1 0.475a 0.226 0.2212 0.552b 0.304 0.2963 0.577c 0.333 0.322
a. Predictors:(Constant), IPQ consequencesb. Predictors:(Constant), IPQ consequences, Identityc. Predictors:(Constant), IPQ consequences, Identity, IPQ coherenced. Dependent Variable: PCS
The results in Table 5 show that five predictors (Model 5) had contributed 31.8% to the variance in MCS. The highest contribution came from the emotional variable (18.9%).
TABLE 5 Predictors of MCS using multiple regression
analysis
Model R R square Adjusted R square
1 0.435a 0.189 0.1852 0.485b 0.235 0.2273 0.517c 0.267 0.2554 0.543d 0.295 0.2795 0.564e 0.318 0.299
a. Predictors: (Constant), IPQ emotionalb. Predictors: (Constant), IPQ emotional, IPQ consequencesc. Predictors: (Constant), IPQ emotional, IPQ consequences, Identityd. Predictors: (Constant),IPQ emotional, IPQ consequences, Identity, IPQ treatment controle. Predictors: (Constant),IPQ emotional, IPQ consequences, Identity, IPQ treatment control, IPQ coherencef. Dependent Variable: MCS

Illness Perception and Health-Related Quality of Life among Haemodialysis Patients
179Pertanika J. Soc. Sci. & Hum. Vol. 19 (S) 2011
The results of this study showed the reliability of the majority of subscales on the IPQ-R to be an adequate and well-developed tool for measuring illness perception in the sampled Malaysian ESRD patients. All subscale items via timeline (acute/chronic), timeline (cyclical, illness coherence, consequences, personal and treatment control, emotional response, illness symptoms, and the quality of life scales (SF-36)) had item-total correlations greater than 0.51. Eight out of nine subscales in the illness perception and six HRQoL subscales showed high internal consistency. However, the treatment control subscale may perform poorly because there is little that one can do to improve or reverse the effects of ESRD other than dialysis with its attendant chronic complications. As the Revised Illness Perception Questionnaire was only recently revised, lower reliabilities on these newly developed subscales are to be expected and further development is needed.
This study is one of the few reported in the literature which systematically investigate the illness perception of patients with ESRD on chronic HD and how their illness perception may impact their HRQoL. Except for the personal control component of the illness perception which did not correlate with the PCS, all the other eight components performed well and were correlated with the PCS and MCS. There were negative correlations between identity, timeline, cyclical, consequences, emotional response, and causes. Personal control and illness coherence had positive significant correlations with the PCS and MCS.
In th i s chronic HD s tudy cohor t , the perception of more symptoms, more consequences, more causes to the illness and higher emotional response was associated with lower PCS and MCS. Patients who perceived their illness to come and go over time (cyclical) also experienced lower PCS and MCS. Perception of more personal control and better understanding of the illness (coherence) were associated with a higher quality of life. Whereas Fowler and Baas (2006) found that consequences
and emotional response were correlated with HRQoL. These differences can be explained by the larger number of the patients in our study - 183 compared with Fowler’s 42 subjects.
Three predictors were identified to contribute to the variance in PCS viz consequences, identity and illness coherence and five predictors to MCS namely emotional, consequences, identity, treatment control, and illness coherence. Consequences and emotional response were major predictors of PCS and MCS in our patients on chronic HD treatment. Covic et al. (2004) reported similar findings in studies using the Common Sense Model as a theoretical framework. They reported that lower emotional responses were related to and were predictive of better physical and mental health scores. In their study of ESRD patients, Diefenbach and Leventhal (1996) reported that a higher emotional score provoked by the illness was significantly correlated with HRQoL (Fowler and Baas, 2006). In post-myocardial infarction patients, Moss-Morris et al. (2002) found that lower scores on the emotional representation subscale were associated with a positive effect. Albeit somewhat different in the various subscale scores, the findings from this and other studies emphasize the importance of how illness perception may determine the HD patients’ HRQoL. In other words, what the patient feels and believes regarding him or herself, their disease and the treatment affects all aspects of their physical and mental functioning.
CONCLUSIONThe results of this study showed that various aspects of illness perception can predict the HRQoL of ESRD patients on chronic HD. Some of these factors are amenable to modification and intervention. Hence there is an urgent need for healthcare authorities and healthcare workers to prioritize research into illness perception for patient interventions to enhance HRQoL in these ESRD patients on chronic HD.
Norhayati Ibrahim, Norella Kong Chiew-Tong and Asmawati Desa
180 Pertanika J. Soc. Sci. & Hum. Vol. 19 (S) 2011
REFERENCES Al-Arabi. (2006). Quality of life: Subjective
description of challenges to patients with end stage renal disease. Nephrology Nursing Journal, 33(3), 285-291.
Blake, C. W., & Courts, M. F. (1996). Coping strategies & style of hemodialysis patients by gender. ANNA Journal, 23(5), 477-482.
Bakewell, A. B., Higgins, R. M., & Edmunds, M. E. (2002). Quality of life in peritoneal dialysis patients: decline over time and association with clinical outcomes. Kidney International, 61(1), 239-248.
Covic, Adrian, Seica, Anca, Gusbeth-Tatomir, Paul, Gavrilovici, Ovidiu, Goldsmith, & David, J. A. (2004). Illness representations and quality of life scores in hemodialysis patients. Nephrology Dialysis Transplant, 19(8), 2078-2083.
DeOreo, P. B. (1997). Hemodialysis patient-assessed functional health status predicts continued survival, hospitalization, and dialysis-attendance compliance. American Journal of Kidney Diseases, 30(2), 204–212.
Diefenbach, M. A., & Leventhal, H. (1996). The common-sense model of illness representation: Theoretical and practical considerations. Journal of Social Distress and the Homeless, 5(1), 11-38.
Fallon, M., Gould, D., & Dainwright, S. P. (1997). Stress and quality of life in the renal transplant patients: A preliminary investigation. Journal of Advance Nursing, 25(3), 562-570.
Fowler, C., & Baas, L.S. (2006). Illness representations in patients with chronic kidney disease on maintainance Hemodialysis. Nephrology Nursing Journal, 33(2), 173-187
Holaday, B. (1989). The family with a chronically ill child. In C. L. Gilles (Ed.), Toward a science in family nursing. New York: Addison-Wesley.
Kalantar-Zadeh, K., Kopple, J. D., & Block, G. (2001). Association among SF36 quality of life measures and nutrition, hospitalization, and mortality in hemodialysis. Journal of American Society of Nephrology, 12(12), 2797–2806.
Leventhal, H., Benyamini, Y., & Brownlee, S. (1997). Illness representations: theoretical foundations. In K. J. Petrie & J. Weinman (Eds.), Perceptions of health and illness. pp. 155-188. Amsterdam: Harwood Academi.
Leventhal, H., Nerenz, D., & Steele, D. (1984). Illness representations and coping with health threats. In A. Baum, & J. Singer (Eds), A Handbook of psychology and health. (pp. 219-252). NJ; Lawrence Erlbaum Associates.
Lok, P. (1996). Stressors, coping mechanisms and quality of life among dialysis patients in Australia. Journal of Advanced Nursing, 23(5), 873-881.
Mapes, D. L., Lopes A. A., & Satayathum, S. (2003). Health-related quality of life as a predictor of mortality and hospitalization: The dialysis outcomes and practice patterns study (DOPPS). Kidney International, 64(1), 339–349.
Moss-Morris, R., Weinman, J., Petrie. K. J., Horne, R., Cameron, L. D. & Buick, D. (2002). The revised illness perception questionnaire (IPQ-R). Psychology and Health, 17(1), 1-16.
National Renal Registry Malaysian Society of Nephrology. (2008). 16th Report of the Malaysian Dialysis and Transplant Registry 2008. Kuala Lumpur.
Rumsfeld, J. S., MaWhinney, S., & McCarthy, M. Jr. (1999). Health-related quality of life as a predictor of mortality following coronary artery bypass graft surgery. Participants of the Department of Veterans Affairs Cooperative Study Group on Processes, Structures, and Outcomes of Care in Cardiac Surgery. JAMA, 28(4), 1298–1303.
Stull, D. E., Clough, L. A., & Van Dussen, D. (2001). Self-report quality of life as a predictor of hospitalization for patients with LV dysfunction: a life course approach. Research in Nursing & Health, 24(6), 460–469.
Suet-Ching, W. L. (2001). The quality of life for Hong Kong dialysis patients. Journal of Advanced Nursing, 35(2), 218-227.

Illness Perception and Health-Related Quality of Life among Haemodialysis Patients
181Pertanika J. Soc. Sci. & Hum. Vol. 19 (S) 2011
Timmers, L., Thong, M., Dekker, F. D., Boeschotten, E. W., Heijmans, M., Rijken, M., & Weinman, J. (2008). Illness perceptions in dialysis patients and their association with quality of life. Psychology& Health, 23(6), 679-690.
Tibblin, G., Svardsudd, K., Welin, L., et al. (1993). Quality of life as an outcome variable and a risk factor for total mortality and cardiovascular disease: a study of men born in 1913. Journal of Hypertens Suppl, 11(4), S81–S86.
U.S Renal Data system . (2005). USRDS 2005 Annual Data Report: Atlas of end stage renal disease in the United State.
Ware, J. E., Snow, K. K., Kosinski, M., & Gandek, B. (1993). SF-36 health survey manual and interpretation guide. Boston, MA, Health Institute.


REFEREES FOR THE PERTANIKA JOURNAL OF SOCIAL SCIENCES AND HUMANITIES
VOL 19 (S) OCT 2011
(JSSH Special Issue)
The Executive Editor and the Editorial Board of the Journal of Social Sciences and Humanities wish to thank the following for acting as referees for manuscripts published in this Special Issue.
Lukman Z. MohamadRohany NasirRozainee KhairudinWan Shahrazad Wan Sulaiman
While every effort has been made to include a complete list of referees for the period stated above, however if any name(s) have been omitted unintentionally or spelt incorrectly, please notify the Executive Editor, Pertanika Journals at [email protected]. Any inclusion or exclusion of name(s) on this page does not commit the Pertanika Editorial Office, nor the UPM Press or the University to provide any liability for whatsoever reason.


PertanikaOur goal is to bring high quality research to the widest possible audience
Journal of Social Sciences and Humanities
INSTRUCTIONS TO AUTHORS(Manuscript Preparation & Submission Guidelines)
Revised July 2011
We aim for excellence, sustained by a responsible and professional approach to journal publishing. We value and support our authors in the research community.
Please read the guidelines and follow these instructions carefully; doing so will ensure that the publication of your manuscript is as rapid and efficient as possible. The Editorial Board reserves the right to return manuscripts that are not prepared in accordance with these guidelines.
About the JournalPertanika is an international peer-reviewed journal devoted to the publication of original papers, and it serves as a forum for practical approaches to improving quality in issues pertaining to tropical agriculture and its related fields. Pertanika began publication in 1978 as Journal of Tropical Agricultural Science. In 1992, a decision was made to streamline Pertanika into three journals to meet the need for specialised journals in areas of study aligned with the interdisciplinary strengths of the university. The revamped Journal of Social Sciences & Humanities (JSSH) aims to develop as a pioneer journal for the Social Sciences with a focus on emerging issues pertaining to the social and behavioural sciences as well as the humanities, particularly in the Asia Pacific region. Other Pertanika series include Journal of Tropical Agricultural Science (JTAS); and Journal of Science and Technology (JST).
JSSH is published in English and it is open to authors around the world regardless of the nationality. It is currently published two times a year i.e. in March and September.
Goal of PertanikaOur goal is to bring the highest quality research to the widest possible audience.
Quality We aim for excellence, sustained by a responsible and professional approach to journal publishing. Submissions are guaranteed to receive a decision within 12 weeks. The elapsed time from submission to publication for the articles averages 5-6 months.
Indexing of PertanikaPertanika is now over 30 years old; this accumulated knowledge has resulted in Pertanika journals being indexed in SCOPUS (Elsevier), EBSCO, AGRICOLA, and CABI. etc. JSSH is indexed in SCOPUS (Elsevier), and EBSCO.
Future visionWe are continuously improving access to our journal archives, content, and research services. We have the drive to realise exciting new horizons that will benefit not only the academic community, but society itself. We also have views on the future of our journals. The emergence of the online medium as the predominant vehicle for the ‘consumption’ and distribution of much academic research will be the ultimate instrument in the dissemination of the research news to our scientists and readers.
Aims and scopePertanika Journal of Social Sciences & Humanities aims to provide a forum for high quality research related to social sciences and humanities research. Areas relevant to the scope of the journal include: Accounting, Agricultural & resource economics, Anthropology, Communication, Community and peace studies, Design and architecture, Disaster and crisis management, Economics, Education, Extension education, Finance, Gerontology, Hospitality and tourism, Human ecology, Human resource development, Language studies (education, applied linguistics, acquisition, pedagogy), Language literature (literary & cultural studies), Management, Marketing, Psychology, Safety and environment, Social and behavioural sciences, Sociology, Sustainable development, and Ethnic relations.
Editorial StatementPertanika is the official journal of Universiti Putra Malaysia. The abbreviation for Pertanika Journal of Social Sciences & Humanities is Pertanika J. Soc. Sci. Hum.
Guidelines for AuthorsPublication policiesPertanika policy prohibits an author from submitting the same manuscript for concurrent consideration by two or more publications. It prohibits as well publication of any manuscript that has already been published either in whole or substantial part elsewhere. It also does not permit publication of manuscript that has been published in full in Proceedings. Please refer to Pertanika’s Code of Ethics for full details.
Editorial processAuthors are notified on receipt of a manuscript and upon the editorial decision regarding publication.
Manuscript review: Manuscripts deemed suitable for publication are sent to the Editorial Board members and/or other reviewers. We encourage authors to suggest the names of possible reviewers. Notification of the editorial decision is usually provided within to eight to ten weeks from the receipt of manuscript. Publication of solicited manuscripts is not guaranteed. In most cases, manuscripts are accepted conditionally, pending an author’s revision of the material.
Author approval: Authors are responsible for all statements in articles, including changes made by editors. The liaison author must be available for consultation with an editor of The Journal to answer questions during the editorial process and to approve the edited copy. Authors receive edited typescript (not galley proofs) for final approval. Changes cannot be made to the copy after the edited version has been approved.
Please direct all inquiries, manuscripts, and related correspondence to:
The Executive EditorPertanika JournalsOffice of the Deputy Vice Chancellor (R&I)IDEA Tower II, UPM-MTDC Technology CentreUniversiti Putra Malaysia43400 UPM, Serdang, Selangor MalaysiaPhone: + (603) 8947 [email protected]
or visit our website at http://www.pertanika2.upm.edu.my/jpertanika/index.htm for further information.
Manuscript preparationPertanika accepts submission of mainly four types of manuscripts. Each manuscript is classified as regular or original articles, short communications, reviews, and proposals for special issues. Articles must be in English and they must be competently written and argued in clear and concise grammatical English. Acceptable English usage and syntax are expected. Do not use slang, jargon, or obscure abbreviations or phrasing. Metric measurement is preferred; equivalent English measurement may be included in parentheses. Always provide the complete form of an acronym/abbreviation the first time it is presented in the text. Contributors are strongly recommended to have the manuscript checked by a colleague with ample experience in writing English manuscripts or an English language editor.
Linguistically hopeless manuscripts will be rejected straightaway (e.g., when the language is so poor that one cannot be sure of what the authors really mean). This process, taken by authors before submission, will greatly facilitate reviewing, and thus publication if the content is acceptable.
The instructions for authors must be followed. Manuscripts not adhering to the instructions will be returned for revision without review. Authors should prepare manuscripts according to the guidelines of Pertanika.
1. Regular articleDefinition: Full-length original empirical investigations, consisting of introduction, materials and methods, results and discussion, conclusions. Original work must provide references and an explanation on research findings that contain new and significant findings.
Size: Should not exceed 5000 words or 8-10 printed pages (excluding the abstract, references, tables and/or figures). One printed page is roughly equivalent to 3 type-written pages.

2. Short communicationsDefinition: Significant new information to readers of the Journal in a short but complete form. It is suitable for the publication of technical advance, bioinformatics or insightful findings of plant and animal development and function.
Size: Should not exceed 2000 words or 4 printed pages, is intended for rapid publication. They are not intended for publishing preliminary results or to be a reduced version of Regular Papers or Rapid Papers.
3. Review articleDefinition: Critical evaluation of materials about current research that had already been published by organizing, integrating, and evaluating previously published materials. Re-analyses as meta-analysis and systemic reviews are encouraged. Review articles should aim to provide systemic overviews, evaluations and interpretations of research in a given field.
Size: Should not exceed 4000 words or 7-8 printed pages.
4. Special issuesDefinition: Usually papers from research presented at a conference, seminar, congress or a symposium.
Size: Should not exceed 5000 words or 8-10 printed pages.
5. OthersDefinition: Brief reports, case studies, comments, Letters to the Editor, and replies on previously published articles may be considered.
Size: Should not exceed 2000 words or up to 4 printed pages.
With few exceptions, original manuscripts should not exceed the recommended length of 6 printed pages (about 18 typed pages, double-spaced and in 12-point font, tables and figures included). Printing is expensive, and, for the Journal, postage doubles when an issue exceeds 80 pages. You can understand then that there is little room for flexibility.
Long articles reduce the Journal’s possibility to accept other high-quality contributions because of its 80-page restriction. We would like to publish as many good studies as possible, not only a few lengthy ones. (And, who reads overly long articles anyway?) Therefore, in our competition, short and concise manuscripts have a definite advantage.
FormatThe paper should be formatted in one column format with the figures at the end. A maximum of eight keywords should be indicated below the abstract to describe the contents of the manuscript. Leave a blank line between each paragraph and between each entry in the list of bibliographic references. Tables should preferably be placed in the same electronic file as the text. Authors should consult a recent issue of the Journal for table layout.
There is no need to spend time formatting your article so that the printout is visually attractive (e.g. by making headings bold or creating a page layout with figures), as most formatting instructions will be removed upon processing.
Manuscripts should be typewritten, typed on one side of the A4 paper with at least 4cm margins and double spacing throughout. Every page of the manuscript, including the title page, references, tables, etc. should be numbered. However, no reference should be made to page numbers in the text; if necessary, one may refer to sections. Underline words that should be in italics, and do not underline any other words.
Authors are advised to use Times New Roman 12-point font. Be especially careful when you are inserting special characters, as those inserted in different fonts may be replaced by different characters when converted to PDF files. It is well known that ‘µ’ will be replaced by other characters when fonts such as ‘Symbol’ or ‘Mincho’ are used.
We recommend that authors prepare the text as a Microsoft Word file.
1. Manuscripts in general should be organised in the following order:
o Page 1: Running title. (Not to exceed 60 characters, counting letters and spaces). This page should only contain the running title of your paper. In addition, the Subject areas most relevant to the study must be indicated on this page. Select one or two subject areas (refer to the Scope Form). A list of number of black and white / colour figures and tables should also be indicated on this page. Figures submitted in color will be printed in colour. See “5. Figures & Photographs” for details.
o Page 2: Author(s) and Corresponding author information. This page should contain the full title of your paper with name(s) of all the authors, institutions and corresponding author’s name, institution and full address (Street address, telephone number (including extension), hand phone number, fax number and e-mail address) for editorial correspondence. The names of the authors must be abbreviated following the international naming convention. e.g. Salleh, A.B., Tan, S.G., or Sapuan, S.M.

Authors’ addresses. Multiple authors with different addresses must indicate their respective addresses separately by superscript numbers:
George Swan1 and Nayan Kanwal2 1Department of Biology, Faculty of Science, Duke University, Durham, North Carolina, USA.2Research Management Centre, Universiti Putra Malaysia, Serdang, Malaysia.
o Page 3: This page should repeat the full title of your paper with only the Abstract (the abstract should be less than 250 words for a Regular Paper and up to 100 words for a Short Communication). Keywords must also be provided on this page (Not more than eight keywords in alphabetical order).
o Page 4 and subsequent pages: This page should begin with the Introduction of your article and the rest of your paper should follow from page 5 onwards.
Abbreviations. Define alphabetically, other than abbreviations that can be used without definition. Words or phrases that are abbreviated in the introduction and following text should be written out in full the first time that they appear in the text, with each abbreviated form in parenthesis. Include the common name or scientific name, or both, of animal and plant materials.
Footnotes. Current addresses of authors if different from heading.
2. Text. Regular Papers should be prepared with the headings Introduction, Materials and Methods, Results and Discussion, Conclusions in this order. Short Communications should be prepared according to “8. Short Communications.” below.
3. Tables. All tables should be prepared in a form consistent with recent issues of Pertanika and should be numbered consecutively with Arabic numerals. Explanatory material should be given in the table legends and footnotes. Each table should be prepared on a separate page. (Note that when a manuscript is accepted for publication, tables must be submitted as data - .doc, .rtf, Excel or PowerPoint file- because tables submitted as image data cannot be edited for publication.)
4. Equations and Formulae. These must be set up clearly and should be typed triple spaced. Numbers identifying equations should be in square brackets and placed on the right margin of the text.
5. Figures & Photographs. Submit an original figure or photograph. Line drawings must be clear, with high black and white contrast. Each figure or photograph should be prepared on a separate sheet and numbered consecutively with Arabic numerals. Appropriate sized numbers, letters and symbols should be used, no smaller than 2 mm in size after reduction to single column width (85 mm), 1.5-column width (120 mm) or full 2-column width (175 mm). Failure to comply with these specifications will require new figures and delay in publication. For electronic figures, create your figures using applications that are capable of preparing high resolution TIFF files acceptable for publication. In general, we require 300 dpi or higher resolution for coloured and half-tone artwork and 1200 dpi or higher for line drawings. For review, you may attach low-resolution figures, which are still clear enough for reviewing, to keep the file of the manuscript under 5 MB. Illustrations may be produced at extra cost in colour at the discretion of the Publisher; the author could be charged Malaysian Ringgit 50 for each colour page.
6. References. Literature citations in the text should be made by name(s) of author(s) and year. For references with more than two authors, the name of the first author followed by ‘et al.’ should be used.
Swan and Kanwal (2007) reported that …The results have been interpreted (Kanwal et al. 2009).
o References should be listed in alphabetical order, by the authors’ last names. For the same author, or for the same set of authors, references should be arranged chronologically. If there is more than one publication in the same year for the same author(s), the letters ‘a’, ‘b’, etc., should be added to the year.
o When the authors are more than 11, list 5 authors and then et al.
o Do not use indentations in typing References. Use one line of space to separate each reference. The name of the journal should be written in full. For example:
Mellers, B. A. (2006a). Choice and the relative pleasure of consequences. Psychological Bulletin, 126, 910-924.
Mellers, B. A. (2006b). Treatment for sexually abused children and adolescents. American Psychologist, 55, 1040-1049.
Hawe, P. (2005). Capturing the meaning of “community” in community intervention evaluation: Some contributions from community psychology. Health Promotion International, 9,199-210.
Braconier, H. and Ekholm, K. (2006). Swedish multinationals and competition from high and low wage location. Review of International Economics, 8, 448-461.

o In case of citing an author(s) who has published more than one paper in the same year, the papers should be distinguished by addition of a small letter as shown above, e.g. Mellers (2006a); Mellers (2006b).
o Unpublished data and personal communications should not be cited as literature citations, but given in the text in parentheses. ‘In press’ articles that have been accepted for publication may be cited in References. Include in the citation the journal in which the ‘in press’ article will appear and the publication date, if a date is available.
1. Examples of other reference citations:
Monographs: Kalimapour, Y.R. (2004). Images of the U.S. Around the World: A Multicultural Perspective. Albany, NY: State University of New York Press.
Chapter in Book: Bjork, R. A. (2007). Retrieval inhibition as an adaptive mechanism in human memory. In H. L. Roediger III & F. I. M. Craik (Eds.), Varieties of memory & consciousness (pp. 309-330). Hull: Hull University Press.
o Proceedings: Amir Awang. (2006). Counseling, human resources development and counseling services. In Sulaiman M. Yassin, Yahya Mat Hassan, Kamariah Abu Bakar, Esah Munji and Sabariah Mohd. Rashid (Eds.), Proceedings of Asia Pacific Conference on Human Development (p. 243-246). Serdang: Universiti Putra Malaysia.
2. Short Communications should include Introduction, Materials and Methods, Results and Discussion, Conclusions in this order. Headings should only be inserted for Materials and Methods. The abstract should be up to 100 words, as stated above. Short Communications must be 5 printed pages or less, including all references, figures and tables. References should be less than 30. A 5 page paper is usually approximately 3000 words plus four figures or tables (if each figure or table is less than 1/4 page).
*Authors should state the total number of words (including the Abstract) in the cover letter. Manuscripts that do not fulfill these criteria will be rejected as Short Communications without review.
STYLE OF THE MANUSCRIPTManuscripts should follow the style of the latest version of the Publication Manual of the American Psychological Association (APA). The journal uses American or British spelling and authors may follow the latest edition of the Oxford Advanced Learner’s Dictionary for British spellings.
SUBMISSION OF MANUSCRIPTSAll articles submitted to the journal must comply with these instructions. Failure to do so will result in return of the manuscript and possible delay in publication.
The four copies of your original manuscript, four sets of photographic figures, as well as a CD with the electronic copy in MS Word (including text and figures) together with a cover letter, declaration form, referral form A, scope form need to be enclosed. They are available from the Pertanika’s home page at http://www.pertanika2.upm.edu.my/jpertanika/index.htm or from the Executive Editor’s office upon request.
Please do not submit manuscripts directly to the editor-in-chief or to the UPM Press. All manuscripts must be submitted through the executive editor’s office to be properly acknowledged and rapidly processed:
Dr. Nayan KANWALExecutive EditorPertanika JournalsOffice of the Deputy Vice Chancellor (R&I)IDEA Tower II, UPM-MTDC Technology CentreUniversiti Putra Malaysia43400 UPM, Serdang, Selangor, Malaysiaemail: [email protected]; tel: + 603-8947 1622
Authors should retain copies of submitted manuscripts and correspondence, as materials can not be returned.
Cover letterAll submissions must be accompanied by a cover letter detailing what you are submitting. Papers are accepted for publication in the journal on the understanding that the article is original and the content has not been published or submitted for publication elsewhere. This must be stated in the cover letter.
The cover letter must also contain an acknowledgement that all authors have contributed significantly, and that all authors are in agreement with the content of the manuscript.
The cover letter of the paper should contain (i) the title; (ii) the full names of the authors; (iii) the addresses of the institutions at which the work was carried out together with (iv) the full postal and email address, plus facsimile and telephone numbers of the author to whom correspondence about the manuscript should be sent. The present address of any author, if different from that where the work was carried out, should be supplied in a footnote.
As articles are double-blind reviewed, material that might identify authorship of the paper should be placed on a cover sheet.
The editorial review processWhat happens to a manuscript once it is submitted to Pertanika? Typically, there are seven steps to the editorial review process:
1. The executive editor and the editorial board examine the paper to determine whether it is appropriate for the journal and should be reviewed. If not appropriate, the manuscript is rejected outright and the author is informed.
2. The executive editor sends the article-identifying information having been removed, to three reviewers. Typically, one of these is from the Journal’s editorial board. Others are specialists in the subject matter represented by the article. The executive editor asks them to complete the review in three weeks and encloses two forms: (a) referral form B and (b) reviewer’s comment form along with reviewer’s guidelines. Comments to authors are about the appropriateness and adequacy of the theoretical or conceptual framework, literature review, method, results and discussion, and conclusions. Reviewers often include suggestions for strengthening of the manuscript. Comments to the editor are in the nature of the significance of the work and its potential contribution to the literature.
3. The executive editor, in consultation with the editor-in-chief, examines the reviews and decides whether to reject the manuscript, invite the author(s) to revise and resubmit the manuscript, or seek additional reviews. Final acceptance or rejection rests with the Editorial Board, who reserves the right to refuse any material for publication. In rare instances, the manuscript is accepted with almost no revision. Almost without exception, reviewers’ comments (to the author) are forwarded to the author. If a revision is indicated, the editor provides guidelines for attending to the reviewers’ suggestions and perhaps additional advice about revising the manuscript.
4. The authors decide whether and how to address the reviewers’ comments and criticisms and the editor’s concerns. The authors submit a revised version of the paper to the executive editor along with specific information describing how they have answered’ the concerns of the reviewers and the editor.
5. The executive editor sends the revised paper out for review. Typically, at least one of the original reviewers will be asked to examine the article.
6. When the reviewers have completed their work, the executive editor in consultation with the editorial board and the editor-in-chief examine their comments and decide whether the paper is ready to be published, needs another round of revisions, or should be rejected.
7. If the decision is to accept, the paper is sent to that Press and the article should appear in print in approximately two to three months. The Publisher ensures that the paper adheres to the correct style (in-text citations, the reference list, and tables are typical areas of concern, clarity, and grammar). The authors are asked to respond to any queries by the Publisher. Following these corrections, page proofs are mailed to the corresponding authors for their final approval. At this point, only essential changes are accepted. Finally, the article appears in the pages of the Journal and is posted on-line.
Peer reviewIn the peer-review process, three referees independently evaluate the scientific quality of the submitted manuscripts. The Journal uses a double-blind peer-review system. Authors are encouraged to indicate in referral form A, the names of three potential reviewers, but the editors will make the final choice. The editors are not, however, bound by these suggestions.
Manuscripts should be written so that they are intelligible to the professional reader who is not a specialist in the particular field. They should be written in a clear, concise, direct style. Where contributions are judged as acceptable for publication on the basis of content, the Editor or the Publisher reserves the right to modify the typescripts to eliminate ambiguity and repetition, and improve communication between author and reader. If extensive alterations are required, the manuscript will be returned to the author for revision.
English language editing Authors are responsible for the linguistic accuracy of their manuscripts. Authors not fully conversant with the English language should seek advice from subject specialists with a sound knowledge of English. The cost will be borne by the author, and a copy of the certificate issued by the service should be attached to the cover letter.
Note: When your manuscript is received at Pertanika, it is considered to be in its final form. Therefore, you need to check your manuscript carefully before submitting it to the executive editor.

Author material archive policyAuthors who require the return of any submitted material that is rejected for publication in the journal should indicate on the cover letter. If no indication is given, that author’s material should be returned, the Editorial Office will dispose of all hardcopy and electronic material.
CopyrightAuthors publishing the Journal will be asked to sign a declaration form. In signing the form, it is assumed that authors have obtained permission to use any copyrighted or previously published material. All authors must read and agree to the conditions outlined in the form, and must sign the form or agree that the corresponding author can sign on their behalf. Articles cannot be published until a signed form has been received.
Lag time The elapsed time from submission to publication for the articles averages 5-6 months. A decision of acceptance of a manuscript is reached in 2 to 3 months (average 9 weeks).
Back issuesSingle issues from current and recent volumes are available at the current single issue price from UPM Press. Earlier issues may also be obtained from UPM Press at a special discounted price. Please contact UPM Press at [email protected] or you may write for further details at the following address:
UPM PressUniversiti Putra Malaysia43400 UPM, SerdangSelangor Darul EhsanMalaysia.


Living Arrangement Preference and Family Relationship Expectation of Elderly Parents
65
K. Alavi, Rahim M. Sail, Khairuddin Idris, Asnarulkhadi Abu Samah and M. Omar
Cognitive Distortion as a Predictor towards Depression among Delinquent Adolescents
75
R. Nasir, A. Z. Zainah, R. Khairudin, W. S. Wan Shahrazad, S. Nen and N. Subhi
Family Functioning as Predictor towards Self-Concept among Delinquent Adolescents
83
A. Z. Zainah, R. Nasir, R. Khairudin and W. S. Wan Shahrazad
Social Support and Religious Coping Strategies in Health-Related Quality of Life of End-Stage Renal Disease Patients
91
Norhayati Ibrahim, Asmawati Desa, Norella Kong Chiew-Tong, R. Ismail and A. Z. Zainah
Consistency and Validity of Psychopathological Measure among Drug Addicts in Developing Culture
99
W. S. Wan Shahrazad, A. R. Roseliza Murni, Z. M. Lukman, I. Fauziah, A. Z. Zainah and Z. Arifin
Employment Barriers against People with Drug Use Histories 109I. Fauziah, M. Omar, Z. M. Lukman, K. Alavi, N. Sarnon, S. Nen and N. Subhi
The Relationships between Organizational Justice, Organizational Citizenship Behavior and Job Satisfaction
115
O. Fatimah, A. M. Amiraa and F. W. Halim
Procrastination’s Relation with Fear of Failure, Competence Expectancy and Intrinsic Motivation
123
O. Fatimah, Z. M. Lukman, R. Khairudin, W. S. Wan Shahrazad and F. W. Halim
Characteristics of Injecting Drug Users in Needle Syringe Exchange Program (NSEP)
129
N. Sarnon, I. Baba, M. S. Mohamad, W. J. Wan Azreena, Z. M. Lukman, N. Subhi, S. M. Hoesni, I. Fauziah, S. Nen, H. M. Rusyda and M. A. Nur Saadah
Emotional Stability and Conscientiousness as Predictors towards Job Performance
139
F. W. Halim, A. Zainal, R. Khairudin, W. S. Wan Shahrazad, R. Nasir and O. Fatimah


The Impact of Vicarious Trauma on Professionals Involved in Child Sexual Abuse Cases (CSA)
147
S. Nen, Jill Astbury, N. Subhi, K. Alavi, Z. M. Lukman, N. Sarnon, I. Fauziah, S. M. Hoesni and M. S Mohamad
Coping with Difficulties: Social Inequality and Stigmatization on Single Mothers with Low Income Household
157
H. M. Rusyda, Z. M. Lukman, N. Subhi, Sheau Tsuey Chong, A. Abdul Latiff, H. Hasrul, and W. M. Wan Amizah
Sexual Identity and Sexual Fluidity among Gay Men and Lesbians 163N. Subhi, D. Geelan, S. Nen, I. Fauziah, M. S. Mohamad, Z. M. Lukman, K. Alavi, S. M. Hoesni and H. M. Rusyda
Illness Perception and Health-Related Quality of Life among Haemodialysis Patients
173
Norhayati Ibrahim, Norella Kong Chiew-Tong and Asmawati Desa