Journal of Purchasing & Supply Management...Journal of Purchasing & Supply Management 23 (2017)...
12
A proactive approach to supply chain risk management: Shifting orders among suppliers to mitigate the supply side risks Oguzhan Kırılmaz n , Serpil Erol Department of Industrial Engineering, Gazi University, Ankara, Turkey article info Article history: Received 1 February 2015 Received in revised form 20 March 2016 Accepted 7 April 2016 Available online 15 April 2016 Keywords: Supply side risks Procurement planning Risk mitigation Linear programming Automotive industry abstract Globalization, e-trade, advanced technologies and emerging production techniques have increased supply chains’ efficiency and added value. However, despite numerous advantages, these factors make supply chains more fragile and vulnerable to risks. For this reason, companies that perform supply chain risk management gain competitive advantage. In the past, supply chain managers mainly focused on reducing costs; but recently, they have begun to give importance to supply chain continuity and re- siliency which have significant impacts on costs as well. Hence, conventional reactive planning has given way to proactive planning in supply chain risk management. In this study, the supply chain risk man- agement process is investigated and a procedure is proposed in the risk mitigation phase. In the first stage of the proposed procedure, an initial procurement plan is obtained via a linear programming model, considering the cost criterion as the first priority. In the second stage, this plan is revised by including the risk criterion into the planning as the second priority. The aim of this procedure that enables proactive planning is to reduce the supply side risks. The model is tested with a hypothetical data set and the cost analysis is performed to evaluate the performance of the procedure. Finally, the whole supply chain risk management process including the proposed procedure is applied to an international automotive company. & 2016 Elsevier Ltd. All rights reserved. 1. Introduction We face many risks in our daily life and consent to live with them to some level in order to survive and conduct activities. For instance, driving a car embodies the risk of accident and potential consequences of life and material loss. People accept these con- sequences for the sake of the driving benefits and they prefer safer cars, fasten seat belts and obey traffic rules to mitigate the prob- ability and/or the adverse impacts of risky events. They could not simply refrain from driving their cars to avoid risks because using other transportation methods also involves some other risks. As in human life, it is impossible to survive and make money without taking risk in business life as well. Companies also must accept some degree of risk and apply risk mitigation strategies to gain a competitive advantage and make profit. For example, in- creasing globalization and e-trade yields lower raw material or product costs especially when procured from the Far East and provides economies of scale. However, long supply chains (SC) and intercontinental transportation are subject to numerous risks arising from communication, geopolitical, cultural, transportation or legal complexities. If one or more of these risks emerge, firms are likely to encounter much higher costs rather than the financial advantage of supplying from intercontinental instead of local suppliers. Chopra et al. (2007) show that ignoring two kinds of risk sources as disruption and supply delays not only increases the use of more unreliable and cheap suppliers but also decreases the use of reliable suppliers. For example, Schmitt and Singh (2011) have expressed that one consumer packaged goods company’s SC came to a halt due to a customs strike. When customs went on strike in a South American country, no raw materials could be shipped to their plant. While the plant had planned to carry three weeks’ worth of raw material inventory, they happened to only have one weeks’ worth on hand because additional material was in transit. Thus after a week, production shut down at that facility. This was a serious issue, as facility fixed costs and labor costs were still in- curred. Only a few days’ worth of production was not shipped on time, but the total cost to the company was estimated at a million dollars. This incident shows the importance of SC continuity and planning of facilities as back up for each other. The art of risk management is not just in responding to antici- pated events but in building a culture and organization that can respond to risk and withstand unanticipated events (Coleman, 2011). Most companies recognize the importance of risk assessment Contents lists available at ScienceDirect journal homepage: www.elsevier.com/locate/pursup Journal of Purchasing & Supply Management http://dx.doi.org/10.1016/j.pursup.2016.04.002 1478-4092/& 2016 Elsevier Ltd. All rights reserved. n Corresponding author. E-mail addresses: [email protected] (O. Kırılmaz), [email protected] (S. Erol). Journal of Purchasing & Supply Management 23 (2017) 54–65
Transcript of Journal of Purchasing & Supply Management...Journal of Purchasing & Supply Management 23 (2017)...
Journal of Purchasing & Supply Management 23 (2017) 54–65
Contents lists available at ScienceDirect
Journal of Purchasing & Supply Management
http://d1478-40
n CorrE-m
erolserp
journal homepage: www.elsevier.com/locate/pursup
A proactive approach to supply chain risk management: Shifting ordersamong suppliers to mitigate the supply side risks
Oguzhan Kırılmaz n, Serpil ErolDepartment of Industrial Engineering, Gazi University, Ankara, Turkey
a r t i c l e i n f o
Article history:Received 1 February 2015Received in revised form20 March 2016Accepted 7 April 2016Available online 15 April 2016
Keywords:Supply side risksProcurement planningRisk mitigationLinear programmingAutomotive industry
x.doi.org/10.1016/j.pursup.2016.04.00292/& 2016 Elsevier Ltd. All rights reserved.
esponding author.ail addresses: [email protected] (O. Kırı[email protected] (S. Erol).
a b s t r a c t
Globalization, e-trade, advanced technologies and emerging production techniques have increasedsupply chains’ efficiency and added value. However, despite numerous advantages, these factors makesupply chains more fragile and vulnerable to risks. For this reason, companies that perform supply chainrisk management gain competitive advantage. In the past, supply chain managers mainly focused onreducing costs; but recently, they have begun to give importance to supply chain continuity and re-siliency which have significant impacts on costs as well. Hence, conventional reactive planning has givenway to proactive planning in supply chain risk management. In this study, the supply chain risk man-agement process is investigated and a procedure is proposed in the risk mitigation phase. In the firststage of the proposed procedure, an initial procurement plan is obtained via a linear programmingmodel, considering the cost criterion as the first priority. In the second stage, this plan is revised byincluding the risk criterion into the planning as the second priority. The aim of this procedure thatenables proactive planning is to reduce the supply side risks. The model is tested with a hypothetical dataset and the cost analysis is performed to evaluate the performance of the procedure. Finally, the wholesupply chain risk management process including the proposed procedure is applied to an internationalautomotive company.
& 2016 Elsevier Ltd. All rights reserved.
1. Introduction
We face many risks in our daily life and consent to live withthem to some level in order to survive and conduct activities. Forinstance, driving a car embodies the risk of accident and potentialconsequences of life and material loss. People accept these con-sequences for the sake of the driving benefits and they prefer safercars, fasten seat belts and obey traffic rules to mitigate the prob-ability and/or the adverse impacts of risky events. They could notsimply refrain from driving their cars to avoid risks because usingother transportation methods also involves some other risks.
As in human life, it is impossible to survive and make moneywithout taking risk in business life as well. Companies also mustaccept some degree of risk and apply risk mitigation strategies togain a competitive advantage and make profit. For example, in-creasing globalization and e-trade yields lower raw material orproduct costs especially when procured from the Far East andprovides economies of scale. However, long supply chains (SC) andintercontinental transportation are subject to numerous risks
az),
arising from communication, geopolitical, cultural, transportationor legal complexities. If one or more of these risks emerge, firmsare likely to encounter much higher costs rather than the financialadvantage of supplying from intercontinental instead of localsuppliers. Chopra et al. (2007) show that ignoring two kinds of risksources as disruption and supply delays not only increases the useof more unreliable and cheap suppliers but also decreases the useof reliable suppliers. For example, Schmitt and Singh (2011) haveexpressed that one consumer packaged goods company’s SC cameto a halt due to a customs strike. When customs went on strike in aSouth American country, no raw materials could be shipped totheir plant. While the plant had planned to carry three weeks’worth of raw material inventory, they happened to only have oneweeks’ worth on hand because additional material was in transit.Thus after a week, production shut down at that facility. This was aserious issue, as facility fixed costs and labor costs were still in-curred. Only a few days’ worth of production was not shipped ontime, but the total cost to the company was estimated at a milliondollars. This incident shows the importance of SC continuity andplanning of facilities as back up for each other.
The art of risk management is not just in responding to antici-pated events but in building a culture and organization that canrespond to risk and withstand unanticipated events (Coleman,2011). Most companies recognize the importance of risk assessment

O. Kırılmaz, S. Erol / Journal of Purchasing & Supply Management 23 (2017) 54–65 55
programs and use different methods, ranging from formal quanti-tative models to informal qualitative plans, to assess SC risks.However, most companies invested little time or resources for mi-tigating SC risks (Jianlin, 2011).
Although the number of academic studies on supply chain riskmanagement (SCRM) has increased since the year 2000, use ofquantitative models remained insufficient. Application of riskmanagement by organizations has not been at the desired level. Ina recent survey by Poirier and Quinn (2004), only one-third of theresponding firms reported that they paid sufficient attention to SCvulnerability and risk mitigation actions. One finding is that theintellectual structure of the SCRM field made a statistically sig-nificant increase during 2000–2005 and evolved from passivelyreacting to vague general issues of disruptions towards moreproactively managing SC risk from system perspectives (Tang andMusa, 2011). Ghadge and Dani (2012) have conducted a thoroughstudy on the academic literature of the SCRM. They have notedthat SCRM gathered more focus only after the 9/11 terrorist attacksin the USA and the radical increase is after 2004. According to thisstudy which examines 120 papers published between 2000 and2010; 54.16% are qualitative, 36.66% are quantitative and 9.16% aremixed regarding the research approach; 35.00% are risk identifi-cation, 14.33% are risk assessment, 5.83% are risk mitigation/con-trol and 44.16% are holistic regarding risk management process;56.33% are proactive, 23.33% are reactive and 20.83% are holisticregarding the risk mitigation approach.
Popular trends of our time such as lean manufacturing and JITproduction, improving optimization techniques, shortening ofproduct life, extending of transportation networks but shorteningof lead times all expose SCs to more risks. Because of these rea-sons, firms should put more emphasis on the risk managementprocess and create their procurement and production plans in thelight of their risk assessment. A SC manager should consider everyelement of a SC while planning and executing SCRM. Since everymember in a SC as a supplier, manufacturer, warehouse, retailer,customer etc. wants to achieve their own goals individually; thegoal of one may increase the risk of another. A disruption in anypart of a SC negatively affects every part of it. Hence, SC managersshould see and evaluate the whole picture and navigate everymember in one direction in terms of risk management. Risk cri-terion as well as cost criterion should be considered while makingstrategic decisions on significant issues regarding transportationroutes, amount of production in each manufacturing facility, de-termination of risk attitude in case of a risk, and while choosingbetween two alternatives such as multiple versus single supplier,in-house versus global procurement.
A proactive planning procedure is proposed in this paper inlight of these views. The main aim of this procedure is to takeprecaution against risky suppliers and to decrease the level ofdamage in case a disruption occurs. In a multi-supplier, multi orsingle manufacturer system, the initial procurement plan of asingle commodity is obtained via the linear programming modelwith the objective of cost (purchasing and transportation cost)minimization. Then, risk assessments of all suppliers are con-ducted qualitatively and the risk profiles are obtained to be used inthe second linear programming model that modifies the initialprocurement plan. Since the identification of risk impact in termsof cost is very difficult prior to the occurrence of risk, including therisk criterion into a model in terms of cost is usually unrealistic. Toprevent this handicap and reflect real world situations into amodel more accurately, risk profiles are directly used to reflect therisk status of a supplier and to modify the initial procurementplan. The initial purchasing quantity of each supplier is propor-tioned to its risk profile and the product quantities to be main-tained and to be transported to a less risky supplier are identifiedby this way. If the risk profile of a supplier is higher than the risk
criteria of the purchasing company as a result of the risk evalua-tion, that supplier can be eliminated directly from the supplierbase. Both the first and the second models are capacity con-strained. If the unit purchasing cost of a certain supplier is low butthat supplier is more risky than the others, the purchasing quan-tity planned via the cost minimization merely is proportioned toits risk profile and some of the products may be purchased fromthe relatively less risky supplier considering the capacity of thatsupplier. The product transfusions from risky suppliers to rela-tively less risky (reliable) suppliers are modeled as a network. If adisruption occurs, the severity of any risk on the purchasingcompany will be low by means of this pre-disruption preparationprocedure owing to the fact that the product quantity is reduced inadvance according to the risk profile of that supplier. The proposedprocedure is theoretical and can be used by manufacturers/as-semblers of all sectors procuring single product from multi-suppliers.
The remainder of this paper is organized as follows. Secondpart is literature review. In the third part, we identify the frame-work for the risk management process consisting of five phasesand propose a proactive approach as a risk mitigation strategy. Inthe fourth part, the proposed model is tested and verified with ahypothetical data set and cost analysis is performed to evaluatethe performance of the procedure. In the fifth part, the proposedprocedure and the model is applied to an automotive company. Inthe last part, we discuss the results and conclude with suggestionsfor future work.
2. Literature review
Effective mathematical tools for analyzing and understandingappropriate supply chain risk management are attracting muchattention due to increasing interest on supply chain vulnerabilities.Although the studies on supply chain risk management are mostlyqualitative and empirical, there are also qualitative and model-based researches in literature. For example; Arntzen et al. (1995)implemented a mixed integer programming model that is used fordetermining optimal supplier relationship, optimal supply net-work design, optimal supplier order allocation and optimal supplycontract. Camm et al. (1997) propose an integer programmingmodel for Proctor and Gamble that deals with supply networkdesign and supplier selection. Levy (1995) presents a simulationmodel to examine the impact of demand uncertainty and supplierreliability on the performance of different supply networks andsupply contracts. Lee and Tang (1998a, 1998b) propose a stochasticinventory model to examine the tradeoff between the consign-ment and turnkey arrangements under demand uncertainty (Tang,2006). Kouvelis and Rosenblatt (2002) have studied the design ofglobal facility networks and presented a mixed integer program-ming model. They investigate essential design tradeoffs of suchnetworks and incorporate government subsidies trade tariffs andtaxation issues. Smith and Huchzermeier (2003) have studied theglobal supply chain and risk optimization, and showed how realoptions add value to global manufacturing firms (Goh et al., 2007).Bogataj and Bogataj (2007) develop a parametric linear program-ming approach for measuring supply chain risks in terms of leadtime perturbations. Mark et al. (2007) present a stochastic modelof the multi-stage global supply chain network problem, in-corporating a set of related risks as supply, demand, exchange anddisruption. The firm’s objective is to maximize its global after-taxprofit subject to capacity constraints in each plant and demandrequirements in each market. Hopp and Yin (2006) used a non-linear mixed integer programming (NLMIP) formulation to explainsupply disruption caused by catastrophic failure. The aim of thestudy is minimizing total cost comprising of inventory and

O. Kırılmaz, S. Erol / Journal of Purchasing & Supply Management 23 (2017) 54–6556
protection costs. Effects of several different protection policieswere analyzed for mitigating disruption risks. Buffa and Jackson(1983) used multi-objective mathematical programming to modela supplier selection problem. Wadhwa and Ravindran (2007) de-veloped a three-criterion mathematical model to select supplierswith capacity constraints. Xia and Wu (2007) developed a four-objective mixed integer formulation for supplier selection undervolume price discounts. Bundschuh et al. (2003) used an NLMIPmodel to investigate reliability and robustness in supply chains.Sodhi (2005) presents two risk measures for demand risk andinventory risk. He has proposed two linear programming modelsto manage demand and inventory risk in a consumer electronicssupply chain.
There are also studies investigating strategies that enable supplychains to become more flexible so as to reduce the negative im-plications of the occurrence of certain events associated with sup-ply, process and demand risks (Tsay and Lovejoj, 1999; Tomlin andWang, 2005). Tomlin (2006) analyses the efficiency of differentstrategies (multiple sourcing, excessive inventory, contingent re-routing) through an analytical model focusing on a single-productsetting. Zsidisin et al. (2004) advocate proactive supply manage-ment tools, particularly those that focus on addressing supplierquality issues, improving supplier performance and preventingsupply interruptions. Berger et al. (2004) use the decision analysisapproach to determine the number of suppliers. They suggest theuse of a Critical Ratio to make the single versus dual sourcing de-cision. Treleven and Schweikhart (1988) present a conceptual risk/benefit assessment model for sourcing decisions, suggesting thatsourcing risks can be managed by either decreasing the probabilityof risk components or decreasing the impact for each of the riskcomponents (Manuj and Mentzer, 2008). Tang and Tomlin (2008)present a stylized model for examining the impact of the number ofsuppliers on the supply cost. As a risk mitigation strategy, theypropose that it is sufficient to order from a handful of suppliers toreduce supply cost risks. Kull and Talluri (2008) propose a combi-nation of analytical hierarchy process and goal programming as adecision tool for supplier selection in the presence of risk measuresand product life cycle considerations. Tomlin (2006) analyzed thesupplier selection problem under supply disruptions via stochasticoptimization. In his study, two suppliers are investigated; one re-liable but more costly and the other less reliable but cheaper. Hefound that supplier’s working performance and the nature of thedisruptions are critical for supplier selection.
Xiao and Yu (2006) analyzed the effect of supply disruption onretailers. Profit maximization and revenue maximization are takeninto account as strategy for retailers. Babich (2005) deals with theuncertainty problem via the theory of financial options. Supplychain disruption is considered as a Bernoulli random variable inthe model. Hendricks and Singhal (2005) ran an empirical studyusing data from 885 firms and reported performance changes. Inthis study, inventory level and economic growth are used as per-formance indicators. They indicated that disruptions have negativeeffects on the performance of the firms. Chen et al. (2006) and Haqand Kannan (2006) applied fuzzy MCDM techniques for the se-lection of suppliers. Mendoza et al. (2008) proposed a three-phasemulti-criteria method that uses AHP and goal programming to thesupplier selection problem (Ravindran et al.,2010).
Deng and Elmaghraby (2005) proposed a tournament methodfor selecting the best set of suppliers. According to the tournamentapproach, a firm starts with a set of suppliers first, then tests andallows them to improve their specifications without any financialsupport.
There are also artificial intelligence applications associated withsupplier selection. Choy et al. (2003) proposed an artificial neuralnetwork model to select and benchmark suppliers. The model isused to reduce the time of supplier selection in a company.
3. Methodology
The risk management process generally consists of threestages; risk identification, risk evaluation and risk mitigation(Wagner and Bode, 2009; Kleindorfer and Saad, 2005; Tang, 2006).In literature, some scientists separate the risk evaluation phaseinto two phases: risk measurement and risk assessment. All theassessments in risk management are based on the prediction of anunknown future. It should be monitored, revised and updated allthe time because it is a dynamic process. Therefore, risk mon-itoring and control phase has also been included in the SCRMprocess recently.
In this study, risk analysis is performed in five stages, which are:risk identification, risk measurement, risk evaluation, risk mitigationand risk monitoring and control. The proposed risk mitigation proce-dure is explained in detail in Section 3.4 and basic information aboutthe other phases is given in the following sub-sections to acquaint thereaders with the risk management process.
3.1. Risk identification
Risk identification is the first and the most important stage ofthe risk management. For an efficient risk management, SC mustbe divided into elements such as suppliers, manufacturers, ware-houses, distribution channels etc. and the risks associated witheach element should be examined and identified specifically andelaborately. This is called SC mapping and risk registering.
Firms should form an SCRM department in their organizationstructure. The SC manager or logistics manager is responsible forSCRM in an organization. However, all employees in an organiza-tion are elements of SCRM. In all phases of SCRM, especially therisk identification and risk mitigation phases, the experience ofevery member of an organization should be taken into account.The more information sharing and flow there is in an SC, thegreater the chance of having an effective SC. Total quality groupsconsisting of every kind of workers should be established to havean efficient risk register. Christopher and Peck (2004) and Neigeret al. (2009) propose the application of supply chain re-en-gineering techniques for the risk source and risk identification.
Registered risks in literature, historical records of the firm,opinions and experiences of workers and experts, internet sitescreated for this phase can all be used in this phase (Jereb et al.,2012). Identified risks can either be the same for all kinds of sec-tors or be specific to a sector such as automotive, electronics,chemistry etc. SC risks are categorized in various ways in litera-ture. For example, Jianlin (2011) categorized SC risks as operationaland disruption risks. Operational risks are referred to as the in-herent uncertainties such as uncertain customer demand, un-certain supply and uncertain cost. Disruption risks are referred toas the major disruptions caused by natural and man-made dis-asters as earthquakes, floods, hurricanes, terrorist attacks, etc., oreconomic crises as currency evaluation or strikes. More detailedviews of the SC risks are described as internal risks which eitherare inherent or arise more directly from management decisions,risks within the SC or risks in the external environment. Internalrisks arise from operations within an organization. They might beinherent risks in operations as accidents, the reliability of equip-ment, loss of an information technology system, human errors andquality issues, or risks that arise more directly from managers’decisions as the choice of batch sizes, safety stock levels, financialproblems and delivery schedules. There are SC risks which areexternal to the organizations but within the SC. These occur fromthe interactions between members of the SC and are principallyrisks from suppliers (reliability, availability of materials, leadtimes, delivery problems, industrial action, etc.) and risks fromcustomers (variable demand, payments, problems with order

Table 1World economic forum’s categorization of global risks.
Economic risks Environmental risks Geopolitical risks Societal risks Technological risks
Chronic fiscal imbalances Vulnerability to geomagneticstorms
Critical fragile states Backlash againstglobalization
Critical systems failure
Chronic labor market imbalances Failure of climate changeadaptation
Failure of diplomatic conflictresolution
Rising rates of chronicdisease
Cyber attacks
Extreme volatility in energy andagriculture prices
Irremediable pollution Entrenched organized crime Rising religiousfanaticism
Failure of intellectual propertyregime
Hard landing of an emergingeconomy
Land and waterway usemismanagement
Pervasive entrenchedcorruption
Vulnerability topandemics
Massive incident of data fraud/theft
Major systemic financial failure Unprecedented geophysicaldestruction
Terrorism Water supply crises Massive digital misinformation
Unmanageable inflation ordeflation
Persistent extreme weather Widespread illicit trade Food shortage crises Unintended consequences of climatechange mitigation
O. Kırılmaz, S. Erol / Journal of Purchasing & Supply Management 23 (2017) 54–65 57
processing, customized requirements, etc.). The main causes ofthese risks are inadequate cooperation between members and lackof visibility. External risks are external to the SC and arise frominteractions with its environment, including accidents, extremeweather, legislation, pressure groups, crime, natural disasters,wars, etc. (Mason-Jones and Towill, 1998). World Economic ForumInsight Report’s (2012) categorization of global risks and SC relatedrisks in each category are presented in Table 1.
3.2. Risk measurement
There are two criteria used for the risk measurement; theprobability and the impact of a risky event. Expected impact,which is the product of probability and impact, is referred to as therisk measurement.
A probability distribution function or occurrence frequency of arisky event is used to find the value of probability. In order to useprobability functions, we must have historical data on that eventfirst. The type of distribution function must be identified by fittingtests. Then, the parameters of the distribution function must becalculated and the probability of a risky event can be found. Al-though the probability values found by this method are more re-liable and accurate, it is difficult to find the type of distributionfunction due to lack of required data. Data might be available forsome risks such as currency rate and lead time but might be rareand insufficient for events as earthquake, terrorism etc. In thissituation, the likelihood of an event can be used. Likelihood isrelated to the frequency of occurrence of an event. This method ismore practical than and might be as accurate as the other methodwhen experts evaluate the risky event meticulously.
The second component of the risk measurement is the impactof a risky event. It is very difficult to estimate and compute theimpact in advance because a disruption in any part of the SCusually affects other parts as well. Risk impact is usually expressedin terms of cost but performance loss, physical loss, psychologicalloss, social loss, time loss etc. are also other types of impacts(Harland et al., 2003). Moreover, the impact of environmentalevents varies according to the firm’s size. For instance, smallcompanies might be affected more than large-scale companiesfrom an economic crisis or currency rate risk.
The assessment model of risks must be simple because iden-tification of the probability and the effect of the risk are based onsubjective estimation. The model must therefore be understood asa method that provides direction. The primary aim of the model isnot to provide an absolute value of risk, but rather to providesupport in the decision-making process (Hallikas et al., 2002). TheMilitary Standard, System Safety Program Requirements (MIL-STD882C), which was released in 1993 by the USA Department ofDefense, can be regarded as a cornerstone in risk analysis. Thisdocument proposes very practical and applicable methods in
determining the impact and likelihood of a risky event. Since MIL-STD 882C was prepared for the risk analysis of military units,impacts of risky events are identified in terms of death, injury,system failure or environmental loss. Tummala and Schoenherr(2011) have adapted the impact and likelihood categories of MIL-STD 882C to industry in their study. Impact categories are relatedto the performance of a firm that is exposed to a risky event.
As mentioned earlier, expected impact is the product of impactand probability of a risky event. The probability-impact matrix is auseful tool to visualize and define the expected impacts (Table 2)and is widely used in literature.
A risky event which is unlikely but has a high impact has anindex of 8 out of 25. Both the likelihood and impact index of a riskyevent increases as we move towards the lower right of the matrix.
3.3. Risk evaluation
Risk evaluation is the process of comparing the results of riskanalysis with risk criteria to determine whether the risk is ac-ceptable or tolerable. Risk criteria are based on organizationalobjectives and can be derived from standards, laws, policies andother requirements (ISO Guide 73, 2009). It is impossible andunreasonable to refrain from all risks. At the end of the risk eva-luation phase, a risk owner can select one of the four differentstrategies: avoid risk, reduce the probability and/or impact of risk,accept the occurrence of risk and prepare contingency plans (Bairdand Thomas, 2008). Selection of the strategy mainly depends onthe trade-off between the expected impact and the cost associatedwith the implementation of the selected strategy. Micheli et al.(2014) propose a quantitative decision support system (DDS) toselect appropriate mitigation measures for supply chain risks.They do not propose a new mitigation measure but formulates astochastic integer linear programming framework, which elabo-rates the supply chain managers’ judgments’ by way of utilityfunctions and fuzzy-extended pairwise comparisons.
Risk profile is a measure that indicates the risk level of a sup-plier. It is calculated by summing the risk indices greater than therisk criteria of the firm.
⎧⎨⎪⎪
⎩⎪⎪
= ∑ *
=
=
=
= Z
k
R R
Rt Total risk value
Z0, risk index of k identified risk is less than the risk criteria of the firm
1, risk index of k identified risk is greater than or equal to the risk
criteria of the firmidentified risks from 1 to K
kt 1K
k k
k
th
th
This categorization and the actions regarding risk indices canvary according to sector and the managers’ risk attitude.

Table 2Probability–impact matrix
Impact
Very low Low Medium High Very high
1 2 3 4 5
Likelihood Very unlikely 1 1 2 3 4 5Unlikely 2 2 4 6 8 10Medium 3 3 6 9 12 15Likely 4 4 8 12 16 20Very likely 5 5 10 15 20 25
Table 3Risk mitigation strategies in supply chains.
Avoidance Dropping specific products/geographical markets/supplier and/or customer organizations
Control Vertical integrationIncreased stockpiling and the use of buffer inventoryMaintaining excess capacity in productions, storage, handlingand/or transportImposing contractual obligations on suppliers
Co-operation Joint efforts to improve SC visibility and understandingJoint efforts to share risk-related informationJoint efforts to prepare SC continuity plans
Flexibility PostponementMultiple sourcingLocalized sourcing
Creating the Minimum Cost Procurement Plan via Linear
Programming
Performing Risk Analysis and Identifying the Risk Profiles of
Suppliers
Determination of the Product Quantity to be Transferred in
Proportion to the Supplier Risk Profile
Product Transfer from a Risky Supplier to a Relatively Less Risky (Reliable) Supplier via a Network
Model
Creating the New Cost and Risk Based Procurement Plan
Fig. 1. Flowchart of the procedure.
O. Kırılmaz, S. Erol / Journal of Purchasing & Supply Management 23 (2017) 54–6558
3.4. Risk mitigation and the proposed procedure
Risk mitigation makes use of the data collected in the previousstage to address potential risks with the right countermeasures.This includes classic mitigation strategies which are implementedbefore the risky event and contingency plans implemented afterthe risky event (Kern, 2012). Kleindorfer and Saad (2005) arguethat prevention is better than a cure, requiring risk managers toact fast and treat urgent risks first.
Risk mitigation strategies can be classified into two groups:reactive and proactive. In a reactive approach, no action is takenbefore the occurrence of a risky event but it is implemented tomitigate the impact and/or probability after it occurs. In thesekinds of strategies, there is no plan to reduce the risk probability.Although there are plans to reduce the impact, they are im-plemented after the occurrence of the risky event. In a proactiveapproach, plans are implemented to mitigate the risks before theyoccur. This approach may include the execution of plans either todecrease the probability or to reduce the impact of the risky eventin advance.
Jüttner et al. (2003) summarize examples of some risk miti-gation strategies as in Table 3.
In this study, a mitigation strategy is proposed to decrease theexpected impact of risk. The flowchart of the procedure is pre-sented in Fig. 1.
In this procedure, cost is considered to be the first priority goal.The problem can be modeled through a bipartite complete direc-ted graph ( ∪ )G V V A,1 2 , where the vertices in V1 stand for thesuppliers, the vertices in V2 represent the manufacturing/assemblyplants and the arcs in A¼V1�V2 are associated with the productflows between the suppliers and the manufacturing/assemblyplants. In the first stage of this method, an initial procurementplan is created by the following linear programming model.
∑ ∑ ∑ ∑= + *( )ϵ ϵ ϵ ϵ
Mincost P y T y1i V
ij V
iji j V
ij ijV1 2 1 2
∑ ≤ ϵ( )ϵ
y C i V2j V
ij i 1
2
∑ ≥ ϵ( )ϵ
y D j V3i V
ij j 2
1
≥ ϵ ϵ ( )y i V j V0 , 4ij 1 2
i; suppliersj; manufacturers/assemblersPi¼ unit purchasing price of supplier iyij¼ quantity to be transported from supplier i to manufacturer j
Tij¼ unit transportation cost from supplier i to manufacturer jCi¼ capacity of supplier iDj¼demand of manufacturer j

O. Kırılmaz, S. Erol / Journal of Purchasing & Supply Management 23 (2017) 54–65 59
In the second stage, this plan is modified considering the riskprofiles of suppliers. The order quantity from a supplier which isfound by the minimum cost criterion is proportioned to the riskprofile of that supplier and this amount is transferred to a morereliable supplier. To achieve this aim, the difference betweensuppliers in terms of risk is identified. For this, the total risk index(Rt) (risk profile) of the least risky supplier is set to zero and therisk profile value of this supplier is subtracted from the risk pro-files of other suppliers and then values are normalized. By thisway, the risk differentiation between all suppliers is maintained(Table 4). (Let Supplier-2 be the least risky among n suppliers).
These normalized risk values represent the risk status of sup-pliers according to the least risky supplier. So, they can also beused to find the quantity to be transferred as a percentage of theinitial procurement quantity (Table 5).
There is not an actual product movement in this transfer but itis a transfer in plans. In other words, the revised procurement planis put in action and products are ordered only after the analysis isdone. Suppliers with relatively less cost and lower risk profiles arehighly utilized considering capacity constraint. Since the modelincludes capacity constraints, the quantity to be transferred fromsuppliers with high risk profiles to suppliers with low profiles arelimited to the capacity of the latter. After the transfer quantity iscalculated, how much of it will be transferred to which supplier isdetermined via a linear programming model. In this directednetwork, there is an arc from supplier i to a relatively less riskysupplier j.
Decision variables (Xij) in the linear programming model arethe product quantities transferred from supplier i to supplier j. Theobjective is to maximize the product flow from a risky supplier toa relatively less risky supplier. So the parameters of the decisionvariables in the objective function are the positive differencesbetween the normalized risk values of suppliers. The objectivefunction value does not represent any quantity but since the ob-jective function is maximization, it satisfies the condition oftransfer from a risky supplier to a less risky supplier. There is oneconstraint for the lowest and the highest risky nodes (suppliers)each and two constraints for all other nodes.
∑= *( )
Maxz N X5
ij ijij
Table 4Normalized risk values.
Suppliers Total riskvalue
Relative total risk valuesbased on the least riskysupplier
Normalized values
Supplier-1 Rt1 Rt1�Rt2 RN1¼(Rt1�Rt2)/RGT
Supplier-2 Rt2 0 RN2¼0Supplier-. Rt. Rt.�Rt2 RN.¼(Rt.�Rt2)/RGT
Supplier-n Rtn Rtn�Rt2 RNn¼(Rtn�Rt2)/RGT
Total RGT 1
Table 5Parameters used in the model.
Suppliers Number of products procured ac-cording to min cost
Normalized risk values Produtransf
Supplier-1 Qc1 RN1 Qc1* RSupplier-2 Qc2 RN2 Qc2* RSupplier-. Qc. RN. Qc.* RN
Supplier-n Qcn RNn Qcn* R
∑ ≤ ∀ ≠( )
X Q i ji6j
J
ij Ti
∑ ∑− ≤( )
X X C7k
K
kij
J
ij Ri
where Nij is the positive difference between the normalized riskvalue of the node (supplier) i and node j,.
J indicates all suppliers less risky than supplier i,QTi is the quantity to be transferred from supplier i,K indicates all suppliers more risky than supplier i,CRi is the remained capacity of supplier i.
Constraint (7) satisfies the condition that the difference be-tween the quantity entering and leaving the node cannot begreater than the remained capacity of that supplier.
Multi-supplier vs. single supplier strategy is still an ongoingdebate. A multi-supplier is a kind of alternative course of actiontowards disruptions and provides cost advantage due to compe-titiveness but it causes extra burden in management activities andincreases paperwork costs. Besides, it may not be possible to find anumber of suppliers in some sectors or regions. A single supplierstrategy enables a close relationship with suppliers and controlbut may be more risky and costly. For these reasons, optimumstrategy should be to limit the supplier base and increase the co-ordination, cooperation and information flow (Cruz and Liu, 2011).Regarding these ideas and in accordance with real world situa-tions, we use multiple but limited suppliers in our model.
3.5. Risk monitoring and control
The risk management process is a cycle and the risk monitoringand control phase enables this process to be dynamic. Since risk isrelated to the future, events should be observed and the data aboutevents should be updated and assessed all the time. This phaseincludes both observations about previous assessments and ob-servations about changing situations and environment. New risksmay be identified and/or new judgments about previously identi-fied risks may be revised by means of this phase. Information sys-tems should be utilized and a high coordination and informationsharing system should be established for efficient monitoring andcontrol. Real time observation and tracking is also very critical forefficient risk monitoring.
4. Numerical example and verification of the model
4.1. Numerical example
A single-echelon with suppliers and manufacturers that arein the same and/or different geographical region, single com-modity, single period, capacitated model is proposed in thisstudy (Fig. 2).
ct to beerred
Product to be kept in thesupplier
Remaining capacity of thesupplier
N1 Qc1–(Qc1* RN1) RC1
N2 Qc2–(Qc2* RN2) RC2
. Qc.–(Qc.* RN.) RC.Nn Qcn–(Qcn* RNn) RCn

Table 6Capacity and unit purchasing price of each supplier.
Supplier 1 2 3 4 5 Total
Capacity (Ci) 47,000 92,000 49,000 95,000 44,000 327,000Unit price (Pi) 29.5 24 21.5 20.5 24.5
Table 7Demand of each manufacturer/assembler.
Manufacturers/assemblers 1 2 3 Total
Demand (Di) 95,000 74,000 80,000 249,000
Table 8Risk profile of each supplier.
Supplier-1 Supplier-2 Supplier-3 Supplier-4 Supplier-5
Risk profiles(RTi)
50 32 66 56 60
Table 9Transportation costs from suppliers to manufacturers/assemblers (Tij).
Manufacturers/assemblers (j)
1 2 3
Suppliers (i) 1 8.5 13 132 8.5 13 143 7 10 74 10 11 5.55 8 8 9
Table 10Optimal solution.
Manufacturers/assemblers (j)
1 2 3 Total
Suppliers (i) 1 0 0 0 02 61,000 0 0 61,0003 34,000 15,000 0 49,0004 0 15,000 80,000 95,000
O. Kırılmaz, S. Erol / Journal of Purchasing & Supply Management 23 (2017) 54–6560
The capacity and unit purchasing price of each supplier is inTable 6, the demand of each manufacturer is in Table 7, the riskprofile of each supplier is in Table 8 and the transportation costsfrom suppliers to manufacturers/assemblers are in Table 9.
The model to find the minimum procurement cost satisfyingthe demand of manufacturers is;
= * + * + * + * + * + *
+ * + * + * + * + *
+ * + * + * + * ( )
y y y y y y
y y y y y
y y y y
Min cost 38 42.5 42.5 32.5 37 38
28.5 31.5 28.5 30.5 31.5
26 32.5 32.5 33.5 8
11 12 13 21 22 23
31 32 33 41 42
43 51 52 53
+ + ≤ ( )y yy 47000 911 12 13
+ + ≤ ( )y yy 92000 1021 22 23
+ + ≤ ( )y yy 49000 1131 32 33
+ + ≤ ( )y yy 95000 1241 42 43
+ + ≤ ( )y yy 44000 1351 52 53
+ + + + ≥ ( )y y y yy 95000 1411 21 31 41 51
+ + + + ≥ ( )y y y yy 74000 1512 22 32 42 52
+ + + + ≥ ( )y y y yy 80000 1613 23 33 43 53
≥ ( )y 0 17ij
Model is solved with Microsoft Excel and the optimal solutionis presented in Table 10.
Total cost¼7,860,000 unit.This procurement plan is obtained without the consideration of
risk criterion. The procurement quantity for each supplier foundby the cost criterion should be modified in proportion to its riskprofile.
According to Table 8, Supplier-2 is the most reliable and Sup-plier-3 is the most risky supplier. Product transfer will be per-formed from a risky supplier to a relatively less risky supplier byusing the values in Table 8. In order to achieve this, the value of 32,
Fig. 2. Supply chain network.
5 0 44,000 0 44,000Total 95,000 74,000 80,000 249,000
the most reliable, is subtracted from other supplier’s risk profilevalues. Since there will be no product transfer from Supplier-2 tothe others, zero is the base value and the differences between therisk profiles of suppliers remain the same. Finally, these values arenormalized (Table 11).
The product transfer network based on the risk profiles ofsuppliers is presented in Fig. 3 and the parameters used in themodel are presented in Tables 12 and 13.
The model to transfer the products from a risky supplier to arelatively less risky supplier is:
= * + * + *
+ * + * + *
+ * +
+ * + * + * ( )
X X X
X X X
X
X X X
Max z 0.173 0.231 0. 269
0.327 0.058 0.096
0.154
0.038 0.096 0.058 18
12 42 52
32 41 51
31
54 34 35
+ + − ≤ ( )X X XX 47000 1931 41 51 12

Table 11Normalized risk values.
Suppliers Total risk value(risk profile)
Relative risk value basedon the least riskysupplier
Normalizedvalues
Supplier-1 50 18 0.173Supplier-2 32 0 0Supplier-3 66 34 0.327Supplier-4 56 24 0.231Supplier-5 60 28 0.269
Total 104 1
Fig. 3. Product transfer network based on the risk profiles of suppliers.
Table 13Difference between the normalized risk values of suppliers (Rij).
R12 R42 R52 R32 R41 R51 R31 R54 R34 R35
0.173 0.231 0.269 0.327 0.058 0.096 0.154 0.038 0.096 0.058
Table 14Optimal solution.
X12 X42 X52 X32 X41 X51 X31 X54 X34 X35
0 3135 16,019 11,846 18,788 0 0 0 0 0
O. Kırılmaz, S. Erol / Journal of Purchasing & Supply Management 23 (2017) 54–65 61
≤ ( )X 0 2012
+ + + ≤ ( )X X XX 31000 2112 32 42 52
+ + + ≤ ( )X X XX 16019 2231 32 34 35
+ − − ≤ ( )X X XX 0 2334 54 41 42
+ ≤ ( )XX 21923 2441 42
+ + ≤ ( )X XX 11846 2551 52 54
− − − ≤ ( )X XX X 0 2635 51 52 54
≥ ( )X 0 27ij
where Xij is the number of products to be transferred fromsupplier i to supplier j.
Eqs. (19), (21), (23) and (26) are the capacity constraints, (20),(22), (24), and (25) are for the products to be transferred. Themodel is solved via Microsoft Excel in seconds and the optimalsolution is presented in Table 14.
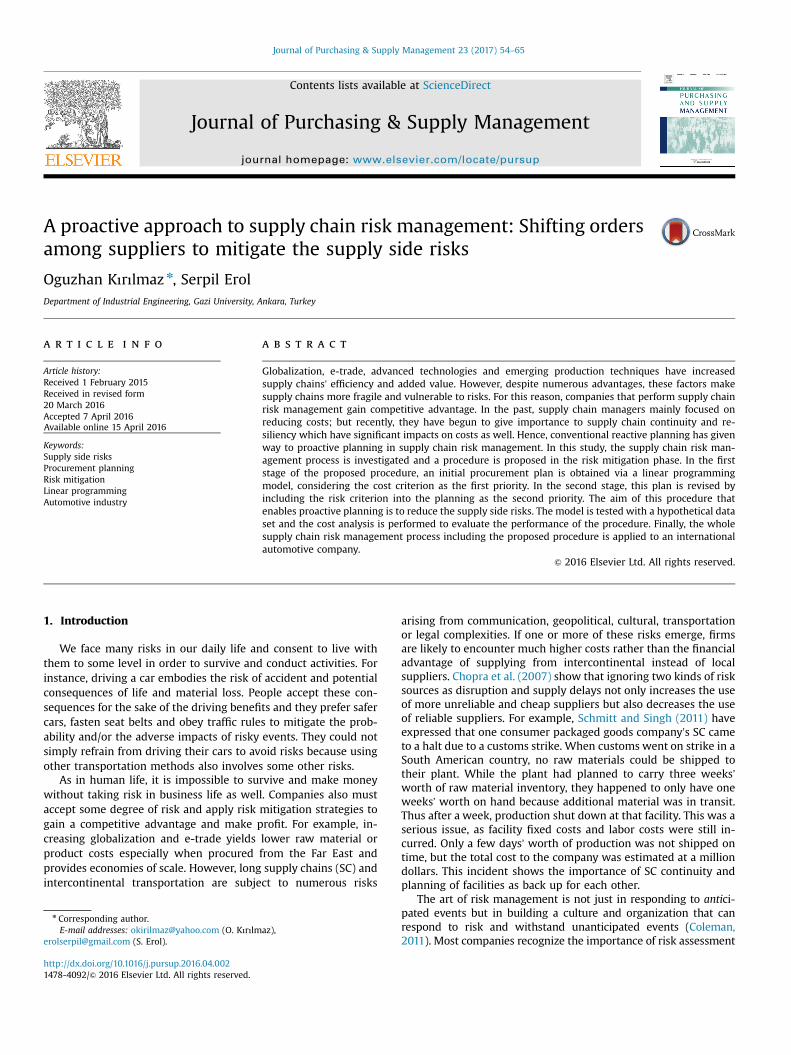
The modified procurement plan is presented in Table 15.
Table 12Parameters used in the model.
Suppliers Min cost procurementplan
Normalized riskvalues
Number of produtransferred
Supplier-1 0 0.173 0Supplier-2 61,000 0 0Supplier-3 49,000 0.327 16,019Supplier-4 95,000 0.231 21,923Supplier-5 44,000 0.269 11,846
4.2. Verification of the model
The proposed model is tested 10 times with randomly gener-ated data and verified. Although five suppliers are more than en-ough for a single commodity in a real world situation, the model isalso tested 10 times for 10 suppliers (nodes) and the solution isobtained in seconds without malfunction.
The benefits of the SCRM process cannot be realized before theoccurrence of a risky event. For this reason, the costs incurred bythe risk management process may be seen as unnecessary and thismay prevent the application of SCRM. However, costs that thecompanies will face in case a disruption occurs are very likelymuch more than the costs incurred by the SCRM activities. It iscertain that there should be a trade-off between these two costs.For this reason, cost analysis is performed for the 10 data set andstatistical results are presented in Table 16.
As it is seen in Table 16, the inclusion of risk criterion into theprocurement plan yields average of 2.60% increase in costs. Basedupon the sample data, a 95% confidence interval for the populationmean of cost increase is between 1.32% and 3.88%. Based on ananalysis of 827 disruption announcements made over a 10 yearperiod, Hendricks and Singhal (2005a) found that companiessuffering from the occurrence of uncertain events experienced 33–40% lower stock returns relative to their industry benchmarks.When compared to this reality, the cost increase incurred by theproposed procedure is considerably low. By means of this proac-tive approach which reduces the risk, companies can decrease thevulnerability of their SCs and gain competitive advantage.
5. Automotive industry application
In the automotive industry, protecting the assembly line fromdelays due to missing or non-conforming parts is a paramountconcern because automotive SCs are set to the pace of assemblylines. Automotive assembly lines may stop if even a minor supplierhas a production interruption. Any disruption along the chainthreatens the whole operation. A production breakdown in theautomotive industry can cause economic losses of more than $100million per day. So they take great care to protect themselves fromthe risks involved (James, 2001). An ordinary car is composed of
cts to be Number of products to be keptin the supplier
Remaining capacity of thesupplier
0 47,00061,000 31,00032,981 073,077 032,154 0
Table 15Initial and revised procurement plans.
Suppliers Min cost procure-ment plan
Riskprofile
Procurement plan consider-ing cost and risk criteria
1 0 50 18,7882 61,000 32 92,0003 49,000 66 32,9814 95,000 56 73,0775 44,000 60 32,154Total 249,000 – 249,000
Table 16Statistical results of the cost analysis.
Test # Increase in pro-curement cost
Increase in trans-portation cost
Increase in to-tal cost
1 3.626% 8.559% 4.741%2 3.235% 16.859% 5.801%3 0.983% �1.080% 0.473%4 1.999% �0.426% 1.383%5 2.260% 6.179% 3.250%6 2.706% 0.206% 2.156%7 1.659% 0.615% 1.395%8 3.542% 6.109% 4.188%9 0.229% 5.176% 1.338%10 0.806% 3.160% 1.286%Mean 2.10% 4.54% 2.60%StandardDeviation
1.19% 5.43% 1.79%
Variance 0.01% 0.30% 0.03%Confidence in-terval (%95)
1.25%rmr2.95% 0.65%rmr8.42% 1.32%rlr3.88%
Table 18Likelihood categorization for automotive supply chain.
Risk Likelihood Definition Likelihood Index
Usually At least once a week 5Often 1–2 times a month 4Sometimes 1–2 times in 6 months 3Seldom Once a year 2Rare Once every 2 years and up 1
O. Kırılmaz, S. Erol / Journal of Purchasing & Supply Management 23 (2017) 54–6562
nearly 5000 parts and hence, OEMs work with lots of suppliers.For these reasons, automobile sector is chosen for application.
Logistics and procurement managers of an international auto-motive company in Turkey are interviewed for the procedure. Inthe risk identification phase, list of common risks is created vialiterature review first. Then this list is examined with the man-agers and consensus is achieved. The impact (Table 17) and like-lihood (Table 18) of risky events are determined by taking afore-mentioned characteristics of the automotive SC and case studies inliterature (Waters, 2011; Thun and Hoenig, 2011; Wagner et al.,2009; Singh et al., 2005; Iyer et al., 2009; Blome et al., 2012;Wagner and Camargos, 2012) into account and by interviewing theexpert group.
As it is seen in Table 17 and Table 18, time intervals for auto-motive sector are so narrow in our current economic environment.
The probability-impact matrix (Table 19) is formed by usingTable 17 and Table 18.
In this study, risk evaluation categories and risk criteria areobtained from the managers of the firm (Table 20).
In this table, a risk index of 2 is identified as a lower boundbecause no risk mitigation strategy is necessary for such kind ofrisks. A risk index of 16 is identified as an upper bound because asupplier with this level of risk is should be eliminated. It is most
Table 17Risk impact categories for automotive supply chain.
Risk impact Definition Impact index
Catastrophic Cease of production for 1 week and more 5Serious Cease of production for 2–3 days 4Moderate Slowdown of production for 3–5 days 3Minor Decrease in customer service level 2Negligible Unaffected customer service level due to in-
ventory on hand1
likely unreasonable to try to mitigate such a high level risk index.Risk criteria of the firm is determined as 6. So indexes between 6(inc.) and 15 (inc.) are undesirable and measures should be takento them.
The product under consideration is a safety camera systeminside a bus. It is procured from three different firms in Germany.Demand for the camera system is 650 pieces a year. 70% of cam-eras (455 pcs.) are procured from firm A, 20% (130 pcs.) is procuredfrom firm B and 10% (65 pcs.) is procured from firm C. The yearlycapacities of firms are 600 pcs., 250 pcs. and 100 pcs. respectively.
The results of risk identification, measurement, evaluation andrisk profiles of suppliers are in Table 21.
Since three firms are in the same country, some risk values (e.g.currency rate risk) are same for all. For this reason, these kinds ofrisks are eliminated in the evaluation phase.
As it is seen in Table 21, Supplier-B is the most risky and C is themost reliable supplier.
Normalized risk values of Suppliers are in Table 22.The number of cameras to be transferred from a supplier to a
relatively less risky supplier is calculated via normalized valuesand presented in Table 23.
The product transfer network is presented in Fig. 4.Linear programming model for the product transfer is;
= * + * + * ( )Max z X X X0. 625 0. 375 0. 25 28BC AC BA
+ ≤ ( )X X 35 29BC AC
− ≤ ( )X X 145 30BA AC
+ ≤ ( )X X 81 31BA BC
≤ ( )X 170 32AC
Optimal solution of the model is;.
XAC¼0XBC¼35XBA¼46
The procurement plan modified according to the risk criterionis in Table 24.
As it is seen in the results, the number of cameras procuredfrom Supplier-B is reduced 81 pcs. 35 pcs. of this amount will beprocured from the most reliable Supplier-C and since its capacity is100, the remaining 46 cameras will be procured from Supplier-A.
6. Conclusion and suggestions
Lower costs, commercial treaties, new markets, developingcommunication and internet opportunities are some of the ad-vantages of globalization. However, cultural diversities, standar-dization difficulties, political instabilities and extended distancesmake SCs more vulnerable to risks. Today, SCRM ensures not onlycost advantage but also competitive advantage. As presented in

Table
19Prob
ability
-im
pactmatrix.
Riskim
pac
tindex
Risklikelihoodindex
Unaffected
custom
erserviceleve
ldue
toinve
ntory
onhan
d(1)
Decreasein
custom
erserviceleve
l(2)
Slow
dow
nof
produ
ction
for3–
5day
s(3)
Cea
seof
production
for2–
3day
s(4)
Cea
seof
production
for1wee
kan
dmore(5)
Once
every2ye
arsan
dup(1)
12
34
5Once
aye
ar(2)
24
68
101–
2times
in6mon
ths(3)
36
912
151–
2times
amon
th(4)
48
1216
20Atleaston
ceawee
k(5)
510
1520
25
Table 20Risk evaluation categories.
Risk index Definition
1 – 2 Acceptable, no action required3 – 4 – 5 Acceptable, should be monitored6 – 8 – 9 – 10 – 12 – 15 Undesirable and measures should be taken
16 – 20 – 25 Unacceptable
Table 21Risk Profiles of suppliers.
Supplier-A Supplier-B Supplier-CRisk identification Risk index Risk index Risk index
Quality problems 6 12 3Inability to adapt changes in customerdemand
9 6 6
Increasing raw material prices 2 2 4Bankruptcy of supplier 4 4 4Supplier capacity risk 3 6 9Machine breakdowns 9 6 3Delivery chain disruptions 6 6 6Malfunction of IT system 1 3 1Accident (e.g. fire) risk 1 1 1Industrial action risk (strike, lockoutetc.)
2 2 2
Transportation failure 6 6 6Import restrictions 4 4 4Terrorist attack 2 2 2Extreme weather conditions 2 2 2Increasing customs duty 6 6 6Risk profile 42 48 33
Table 22Normalized risk values of suppliers.
Risk profile Normalized risk profile values
A 42 0.375B 48 0.625C 33 0
Table 23Number of cameras to be transferred and retained.
Number of cameras to betransferred
Number of cameras retained in thesupplier
A 455*0.375¼170 285B 130*0.625¼81 49C 0 65
O. Kırılmaz, S. Erol / Journal of Purchasing & Supply Management 23 (2017) 54–65 63
the literature review, the number of quantitative and model-basedstudies is more limited when compared to the number of quali-tative and empirical ones. Within this context, a proactive plan-ning procedure is proposed in this paper. The aim of this proce-dure is to take necessary precautions against the risky suppliersand decrease the level of damage in case a disruption occurs. Thefirst stage of the proposed procedure is obtaining the initial pro-curement plan via linear programming with the objective of costminimization, and the second stage is revising the initial pro-curement plan by integrating the risk criteria into the planningprocess. Risk assessment is conducted so as to identify risk profilesof all suppliers in the first step of this second stage. In the secondstep, the product quantities in the initial procurement plan areproportioned to risk profiles of the suppliers, and then the quan-tities to be kept in a supplier and those to be transferred to lessrisky suppliers are identified. In the third step, a product transferlinear programming model is established and in the last step, the

Table 24Modified procurement plan.
Supplier Current procurement plan Modified procurement plan
A 455 501B 130 49C 65 100Total 650 650
Fig. 4. Network for product transfusion.
O. Kırılmaz, S. Erol / Journal of Purchasing & Supply Management 23 (2017) 54–6564
new procurement plan is created by solving this linear program-ming model. This procedure is unique in that risk is quantified andincluded in the model not in terms of cost but as a profile valueand it proposes a transfer of product strategy. This transfer plan ismade before the order and suppliers receive the final product or-der prepared according to the cost and risk criteria. In the nu-merical example, the model is tested 10 times with a randomlygenerated hypothetical data set and verified. The cost increaseincurred by the inclusion of risk criterion into the model is ana-lyzed and a 95% confidence interval for the population mean ofcost increase is observed to be between 1.32% and 3.88%. This costincrease is likely to be less than the cost that will be encounteredin the case that a disruption occurs.
In the industry application phase, the whole supply chain riskmanagement process including the proposed risk mitigation pro-cedure is applied to an international automotive company inTurkey. Interior cameras are currently being supplied from 3 dif-ferent suppliers in Germany according to the cost criterion only.The impact and likelihood of risky events for each supplier areidentified by taking the characteristics of automotive SC and casestudies in literature into account and by interviewing the expertgroup. The current procurement plan is modified via the proposedprocedure and risk criterion is included in the procurementplanning. Results are shared with the managers for future plans.Observing the results of risk mitigation strategies may take a longtime due to the rare occurrence of some risks. Therefore, the ob-servation of results and output of this procedure is still ongoing.
The procedure can be extended to multi-period, multi-com-modity and multi-echelon SCs in further studies. Additionally,periodic and time-based risks, product risks and risks of othermembers of a SC can be investigated as well. Finally, the proposedprocedure can be applied to different industries in order to eval-uate its overall performance.
References
Arntzen, B., Brown, G., Harrison, T., Trafton, L., 1995. Global supply chain manage-ment at digital equipment corporation. Interfaces 25, 69–93.
Babich, V., 2005. Vulnerable options in supply chains: effects of supplier compe-tition. Nav. Res. Logist. 53 (7), 656–673.
Baird, I.S., Thomas, H., 2008. Toward a contingency model of strategic risk taking.Acad. Manag. Rev. 10, 230–243.
Berger, P.D., Gerstenfeld, A., Zeng, A.Z., 2004. How many suppliers are best? Adecision analysis approach. Omega 32 (1), 9–15.
Blome, C., Groetsch, V.M., Henke, M., Tang, C.S., 2012. A comparative study of fi-nancial and operational measures in the automotive industry. In: Khan, O.,Zsidisin, G.A. (Eds.), Handbook for Supply Chain Risk Management. J. RossPublishing Inc., Fort Lauderdale, FL, pp. 153–162.
Bogataj, D., Bogataj, M., 2007. Measuring the supply chain risk and vulnerability infrequency space. Int. J. Prod. Econ. 108 (1–2), 291–301.
Buffa, F., Jackson, W., 1983. A goal programming model for purchase planning. J.Purch. Mater. Manag. 19 (3), 27–34.
Bundschuh, M., Klabjan, D., Thurston, D.L., 2003. Modeling robust and reliablesupply chains. Optimization Online e-print, available at www.optimization-online.org.
Camm, J., Chorman, T., Dull, F., Evans, J., Sweeney, D., Wegryn, G., 1997. BlendingOR/MS, judgment, and GIS: restructuring P&G’s supply chain. Interfaces 27 (1),128–142.
Chen, C.T., Lin, C.T., Huang, S.F., 2006. A fuzzy approach for supplier evaluationand selection in supply chain management. Int. J. Prod. Econ. 102 (2),289–301.
Chopra, S., Reinhardt, G., Mohan, U., 2007. The Importance of decoupling recurrentand disruption risks in a supply chain. Nav. Res. Logist. 54, 544–555.
Choy, K., Lee, W., Lo, V., 2003. Design of an intelligent supplier relationship man-agement system: a hybrid case based neural network approach. Expert Syst.Appl. 24 (2), 225–237.
Christopher, M., Peck, H., 2004. Building the resilient supply chain. Int. J. Logist.Manag. 15 (2), 1–13.
Coleman, T.S., 2011. A Practical Guide to Risk Management. The Research Founda-tion of CFA Institute, New York, USA.
Cruz, J.M., Liu, Z., 2011. Modeling and analysis of the multi-period effects of socialrelationship on supply chain networks. Eur. J. Oper. Res. 214, 39–52.
Deng, S., Elmaghraby, W., 2005. Supplier selection via tournaments. Prod. Oper.Manag. 14 (2), 252–267.
Ghadge, A., Dani, S., 2012. Supply chain risk management: present and future scope.Int. J. Logist. Manag. 23 (3), 313–339.
Goh, M., Lim, J.Y.S., Meng, F., 2007. A stochastic model for risk management inglobal supply chain networks. Eur. J. Oper. Res. 182, 164–173.
Hallikas, J., Virolainen, V., Tuominen, M., 2002. Risk analysis and assessment innetwork environments: a dyadic case study. Int. J. Prod. Econ. 78, 45–55.
Haq, A.N., Kannan, G., 2006. Design of an integrated supplier selection and multi-echelon distribution inventory model in a built-to-order supply chain en-vironment. Int. J. Prod. Res. 44 (10), 1963–1985.
Harland, C., Brenchley, R., Walker, H., 2003. Risk in supply networks. J. Purch.Supply Manag. 9, 51–62.
Hendricks, K.B., Singhal, V.R., 2005a. An empirical analysis of the effect of supplychain disruptions on long-run stock price performance and equity risk of thefirm. Prod. Oper. Manag. 14 (1), 35–52.
Hendricks, K.B., Singhal, V.R., 2005b. Association between supply chain glitches andoperating performance. Manag. Sci. 51 (5), 695–711.
Hopp, W.J., Yin, Z., 2006. Protecting Supply Chain Networks Against CatastrophicFailures. Working paper, Northwestern University.
ISO Guide 73, 2009. Risk Management Vocabulary.Iyer, A., Seshadri, S., Vasher, R., 2009. Toyota Supply Chain Management: A Strategic
Approach to Toyota's Renowned System. McGraw Hill, USA.James, B.A., 2001. Handbook of Supply Chain Management. St. Lucie Press, Auer-
bach Publications, Boca Raton, FL.Jereb, A., Cvahte, T., Rosi, B., 2012. Mastering supply chain risks. Serb. J. Manag. 7,
271–285.Jianlin Y., 2011. The Risk Management of Supply Chain. In: Proceedings of the In-
ternational Conference on Management and Service Science (MASS) 2010,Wuhan, China, pp. 1–4.
Jüttner, U., Peck, H., Christopher, M., 2003. Supply chain risk management: out-lining an agenda for future research. Int. J. Logist. Res. Appl.: Lead. J. SupplyChain Manag. 6, 197–210.
Kern, D., Moser, R., Hartmann, E., Moder, M., 2012. Supply risk management: modeldevelopment and empirical analysis. Int. J. Phys. Distrib. Logist. Manag. 42,60–82.
Kleindorfer, P.R., Saad, G.H., 2005. Managing disruption risks in supply chains. Prod.Oper. Manag. 14, 53–68.
Kouvelis, P., Rosenblatt, M.J., 2002. A mathematical programming model for globalsupply chain management: conceptual approach and managerial insights. In:Geunes, J., Pardalos, P.M., Romeijn, H.E. (Eds.), Supply Chain Management:Models, Applications and Research Directions. Kluwer Academic Publishers,Boston.
Kull, T.J., Talluri, S., 2008. A supply risk reduction model using integrated multi-criteria decision making. IEEE Trans. Eng. Manag. 55 (3), 409–419.
Lee, H., Tang, C.S., 1998a. Variability reduction through operations reversal. Manag.Sci. 44, 162–173.
Lee, H.L., Tang, C.S., 1998b. Managing supply chains with contract manufacturing.In: Lee, H.L., Ng., S.M. (Eds.), Global Supply Chain and Technology Management.Production and Operations Management Society Publishers, Florida.
Levy, D., 1995. International Sourcing and supply chain stability. J. Int. Bus. Stud. 26,343–360.
Manuj, I., Mentzer, J.T., 2008. Global supply chain risk management. J. Bus. Logist.29 (1), 133–155.

O. Kırılmaz, S. Erol / Journal of Purchasing & Supply Management 23 (2017) 54–65 65
Mark, G., Lim, Y.S.J., Meng, F., 2007. A stochastic model for risk management inglobal supply chain networks. Eur. J. Oper. Res. 182, 164–173.
Mason-Jones, R., Towill, D.R., 1998. Shrinking the Supply Chain Uncertainty Cycle.Working paper. Logistics Systems Dynamics Group, Cardiff University, pp. 17–22.
Mendoza, A., Santiago, E., Ravindran, A., 2008. A three-phased multi-criteriamethod to the supplier selection problem. Int. J. Ind. Eng. 15 (2), 195–210.
Micheli, G.J.L., Mogre, R., Perego, A., 2014. How to choose mitigation measures forsupply chain risks. Int. J. Prod. Res. 52 (1), 117–129.
Neiger, D., Rotaru, K., Churilov, L., 2009. Supply chain risk identification with value-focused process engineering. J. Oper. Manag. 27 (2), 154–168.
Poirier, C.C., Quinn, F.J., 2004. How are we doing: a survey of supply chain progress.Supply Chain Manag. Rev. 8, 24–31.
Ravindran, A.R., Bilsel, U., Wadhwa, V., Yang, T., 2010. Risk adjusted multi-criteriasupplier selection models with applications. Int. J. Prod. Res. 48 (2), 405–424.
Schmitt, A., Singh, M., 2011. A Quantitative Analysis of Disruption Risk in a Multi-echelon Supply Chain. Working paper, Center for Transportation and Logistics.Massachusetts Institute of Technology, Cambridge, USA.
Singh, P., Smith, A., Sohal, A.S., 2005. Strategic supply chain management issues inthe automotive industry: an Australian perspective. Int. J. Prod. Res. 43,3375–3399.
Smith, R., Huchzermeier, A., 2003. Global supply chain and risk optimization: realoptions add value for global manufacturing firms. In: Kummar, K., Van Nunen,J., Van Wassenhove, L.N. (Eds.), Global Supply Chains. Stanford University Press.
Sodhi, M., 2005. Managing demand risk in a tactical supply chain planning for aglobal consumer electronics company. Prod. Oper. Manag. 14 (1), 69–79.
Tang, C.S., 2006. Perspectives in supply chain risk management. Int. J. Prod. Econ.103, 451–488.
Tang, O., Musa, S.N., 2011. Identifying risk issues and research advancements insupply chain risk management. Int. J. Prod. Econ. 133, 25–34.
Tang, C., Tomlin, B., 2008. The power of flexibility for mitigating supply chain risks.Int. J. Prod. Econ. 116, 12–27.
Thun, J., Hoenig, D., 2011. An empirical analysis of supply chain risk management inthe German automotive industry. Int. J. Prod. Econ. 131, 242–249.
Tomlin, B., Wang, Y., 2005. On the value of mix flexibility and dual sourcing inunreliable newsvendor networks. Manuf. Serv. Oper. Manag. 7 (1), 37–57.
Tomlin, B., 2006. On the value of mitigation and contingency strategies for mana-ging supply chain disruption risks. Manag. Sci. 52 (5), 639–657.
Tsay, A.A., Lovejoj, W.S., 1999. Quantity flexibility contracts and supply chain per-formance. Manuf. Serv. Oper. Manag. 1 (2), 89–111.
Treleven, M., Schweikhart, S.B., 1988. A risk/benefit analysis of sourcing strategies:Single vs. multiple sourcing. J. Oper. Manag. 7 (4), 93–114.
Tummala, R., Schoenherr, T., 2011. Assessing and managing risks using the SupplyChain Risk Management Process (SCRMP). Supply Chain Manag.: Int. J. 16,474–483.
Wadhwa, V., Ravindran, A., 2007. Vendor selection in outsourcing. Comput. Oper.Res. 34 (12), 3725–3737.
Wagner, S.M., Bode, C., Koziol, P., 2009. Supplier default dependencies: empiricalevidence from the automotive industry. Eur. J. Oper. Res. 199, 150–161.
Wagner, S.M., Bode, C., 2009. Dominant risks and risk management practices insupply chains. In: Zsidisin, G.A., Ritchie, B. (Eds.), Supply Chain Risk: A Hand-book of Assessment, Management and Performance. Springer, New York, NY,pp. 271–290.
Wagner, S.M., Camargos, V.S., 2012. Managing risks in just in sequence supplynetworks: exploratory evidence from automakers. IEEE Trans. Eng. Manag. 59,52–64.
Waters, D., 2011. Supply Chain Risk Management, Vulnerability and Resilience inLogistics. Replica Press Pvt. Ltd., New Delhi, India.
World Economic Forum Insight Report 7th Ed., 2012. Global Risks 2012.Xia, W., Wu, Z., 2007. Supplier selection with multiple criteria in volume discount
environments. Omega 35 (5), 494–504.Xiao, T., Yu, G., 2006. Supply chain disruption management and evolutionarily
stable strategies of retailers in the quantity–setting duopoly situation withhomogeneous goods. Eur. J. Oper. Res. 173 (2), 648–668.
Zsidisin, G.A., Ellram, L.M., Carter, J.R., Cavinato, X., 2004. An analysis of supply riskassessment techniques. Int. J. Phys. Distrib. Logist. Manag. 34 (5), 397–413.