Journal of Politics & Governance
31
ISSN (Print): 2278 473X ISSN (Online): 2456-8023 Journal of Politics & Governance Vol. 8 No. 3 March 2020 Editor Shailesh Academy of Politics & Governance, Management Development Research Foundation, D-453, Sector 7 Dwarka, New Delhi, Delhi 110077 E-mail: [email protected] Editorial Board Dr. Abhinav Sharma Associate Professor, Department of Political Science, Banaras Hindu University, Varanasi –221005 E-mail:[email protected] Dr Nupur Tiwari Associate Professor, Indian Institute of Public Administration, IP Estate Ring Road, New Delhi –110020 E-mail:[email protected] Dr Rose Mary George Assistant Professor, Department of Political Science, School of Distance Education, University of Kerala, Thiruvananthapuram –695 034 E-mail: [email protected] Dr Satishkumar L. Patel Professor, Department of Public Administration, V. N. South Gujarat University, Surat –395 007 E-mail: [email protected]
Transcript of Journal of Politics & Governance

ISSN (Print): 2278 473X ISSN (Online): 2456-8023
Journal of Politics & Governance
Vol. 8 No. 3 March 2020
Editor Shailesh Academy of Politics & Governance, Management Development Research Foundation, D-453, Sector 7 Dwarka, New Delhi, Delhi 110077 E-mail: [email protected] Editorial Board Dr. Abhinav Sharma Associate Professor, Department of Political Science, Banaras Hindu University, Varanasi –221005 E-mail:[email protected] Dr Nupur Tiwari Associate Professor, Indian Institute of Public Administration, IP Estate Ring Road, New Delhi –110020 E-mail:[email protected] Dr Rose Mary George Assistant Professor, Department of Political Science, School of Distance Education, University of Kerala, Thiruvananthapuram –695 034 E-mail: [email protected] Dr Satishkumar L. Patel Professor, Department of Public Administration, V. N. South Gujarat University, Surat –395 007 E-mail: [email protected]

Journal of Politics & Governance, Vol. 8, No. 3, March 2020
2
Journal of Politics & Governance (JPG) is a peer-reviewed monthly journal. JPG is an independent publishing platform with profound interest in an interdisciplinary critique of contemporary issues revolving around politics, governance, management, development, public affairs, socio-economic concerns of communities, justice, ethics, corporate social responsibility, human rights, poverty, social action, quality of life of diverse communities, gender discourse, media, international relations, etc. All editorial positions are honorary/non-remunerative. JPG invites research papers, reflective essays, review articles, conceptual notes, interviews, and book reviews from thinkers, academics, journalists, administrators, social and political activists, research scholars and larger community of students from any discipline. Length of the contributions should be 3000-5000 words including references. Editorial and Subscription Enquiry: [email protected] Copyright © All rights reserved. No part of this publication can be reproduced without written permission of the editor/publisher except for the purpose of quotes in research papers, doctoral work or book chapters. Any dispute arising out of publication of Journal of Politics & Governance (JPG) will be settled in the courts of Delhi. Disclaimer
Views expressed in the articles published in JPG are those of the contributors and not necessarily that of the Editorial Board, Editor or Publisher.
All the articles are published in good faith considering that the contributors have not violated copyrights of any other authors/publishers. In case of any such violation, contributors alone will be held responsible.
Due care and diligence have been exercised while editing and printing this issue of JPG. However, the editor, publisher and printer will not be liable for any damage and losses arising out of the content of the journal.
Printed & Published by Academy of Politics & Governance, Management Development Research Foundation, D-453, Sector 7 Dwarka, New Delhi, Delhi 110077

Journal of Politics & Governance, Vol. 8, No. 3, March 2020
3
Contents
Circular Instrument Management as Corporate Social Responsibility Initiative for Sustainable Healthcare B.J. van Straten and Nupur Tiwari 4-15 Fifty Years of Nuclear Non-Proliferation Treaty: A Review of Indian Perspective Baruna Kumar Behera 16-19 Political Spectrum and Six-Axis Political Compass: A Critique Pitamber Kaushik 20-24 Jobless Growth in India: The Way Forward Srirang K Jha and Amiya Kumar Mohapatra 25-31

Journal of Politics & Governance, Vol. 8, No. 3, March 2020
4
Journal of Politics & Governance Vol. 8 No. 3, March 2020, Pp. 4-15 ISSN: 2278473X (Print) 2456-8023 (Online)
Circular Instrument Management as Corporate Social
Responsibility Initiative for Sustainable Healthcare
B.J. van Straten* and Nupur Tiwari**
ABSTRACT
The paper analyses the relationship between Corporate Social Responsibility (CSR) and the Circular Economy (CE). This paper is based on a literature review complemented by an analysis of the outcome of a real business case of instrument repair and circular reprocessing of surgical instruments. The authors have examined the impact of extending the product life cycle of surgical instruments using certified repair and refurbishment instead of replacing it with new instruments. Surgical instruments were collected, repaired and refurbished into new manufacturing condition. More than one ton of rejected instruments were collected from four different hospitals during a period of six months. One container of 100 Kg with disposable and contaminated instruments was collected and, after disinfection in a thermal washing machine, melted and recycled to new raw material. This raw material was used on a water jet cutting machine to make new components for surgical instrument mesh baskets. The outcome indicates that circular models such as the reprocessing of medical waste are feasible, leading to the prevention of waste and reduction of costs associated with waste management. Keywords: Corporate Social Responsibility, Circularity, Circular Economy, Circular Instrument Management, Sustainable Healthcare,
INTRODUCTION Research questions Socially responsible management practices and Corporate Social Responsibility (CSR) may provide sustainable benefits to society and contribute to sustainable business. Corporate Social Responsibility is also termed as CSR, sustainable business, responsible business1, 2, 3. To address the impact and effectiveness of such benefits, the following research questions are proposed:
How can circularity and circular economy models contribute to sustainable healthcare?
*General Manager at Van Straten Medical and external Ph. D. Candidate, Delft University of Technology, Delft, The Netherlands E-mail: [email protected] ** Associate Professor, Political Science & Rural Development and Head, Centre of Excellence (CoE) for Tribal Affairs (Ministry of Tribal Affairs, Govt. of India), Indian Institute of Public Administration, New Delhi

Journal of Politics & Governance, Vol. 8, No. 3, March 2020
5
How will circularity concerning CSR contribute to society and protection of our natural
resources? In essence, Corporate Social Responsibility is about making ethical decisions and contributing to society. These research questions are formulated from the assumption that business ethics leads to the central question of how responsible one wants to be to society. The term ethics is derived from the Greek word ethikos which itself is derived from the Greek word ethos, meaning custom or character. In philosophy, ethical behaviour is something that is ‘good’. The field of ethics or moral philosophy involves developing, defending, and recommending concepts of right and wrong behavior4. Business ethics often referred to as corporate ethics, is a form of applied ethics or professional ethics, that examines ethical principles and moral or ethical problems that can arise in a business environment. It applies to all the aspects of business conduct and is relevant to the conduct of individuals and entire organisations5. OBJECTIVE The objective of this paper is to create an overview of the relation between Corporate Social Responsibility (CSR) and the Circular Economy (CE). Seen from the perspective of a circular business case, the paper presents conceptualisation of CSR in healthcare using ‘Circular Instrument Management’ in hospitals. Furthermore, the objective is to determine the effectiveness of Circular Instrument Management as a circular tool within Corporate Social Responsibility. CORPORATE GOVERNANCE VERSUS CORPORATE SOCIAL RESPONSIBILITY Literature review of Corporate Governance shows that it is a broad term defining different methods, structures and processes of an organisation. It describes the business and affairs of the organisation managed and directed towards fair play in business conduct. Corporate Governance furthermore, enhances the long term shareholder value by means of accountability of managers and augmentation of the organisation's performance. It furthermore, eliminates the conflict of ownership and control by separately defining the interest of shareholders and management7. The development of the link between Corporate Governance and Corporate Social Responsibility at an organisational level seems to be a global phenomenon8. Corporate Governance and Corporate Social Responsibility may not always be aligned, where Corporate Governance is a system of mechanisms helping to ensure that investors get a return on their investments9. Corporate Social Responsibility is concerned with creating a balance between economic and social goals of business encompassing the effective use of resources, accountability in the use of its power, and the behaviour of the company in its social environment10. Such behaviour may positively influence all of its stakeholders if it results in a contribution to the society. There are many forms and CSR programs which result in increased customer loyalty. Even more, it may result in increased acceptance of the organization by the society. These days, many businesses adopt and determine sustainable strategies which are embedded in Corporate Social Responsibility programs which are used as powerful reputation management tools as well. Some examples of common Corporate Social Responsibility programs are given as under6:
Reduction of carbon footprints to mitigate climate change.

Journal of Politics & Governance, Vol. 8, No. 3, March 2020
6
Improving labour policies and embrace fair trade. Engaging in charitable giving and volunteer efforts within the local community. Changing corporate policies to benefit the environment. Making socially and environmentally conscious investments. Reducing carbon footprints and climate change.
Corporate Social Responsibility programs not only bring an economic benefit; it may also lead to buying loyalty from all of the stakeholders. In fact, Corporate Social Responsibility is a fundamental choice of the organization to give back to the society in a meaningful manner. CIRCULAR ECONOMY MODELS AS A POSSIBLE APPROACH WITHIN CORPORATE SOCIAL RESPONSIBILITY The Circular Economy has gained significant interest around the world. Circularity means an economic system in which waste is minimised or even completely reused11. Circularity can be achieved through maintenance, repair, reuse, remanufacturing, refurbishing and recycling of materials. This is in contrast to a linear economy which is based on a 'take, make, dispose' model of consumption patterns12. The challenge in the circular economy is to change the chain from ‘make-use-throw away’ to ‘make-use-reuse’. In this way, we prevent to deplete our natural resources using reusing these resources after using them. The current economic paradigm based on increasing human population, economic development, and standard of living, is no longer compatible with the biophysical limits of the finite earth. The continuing global crisis is also due to the scarcity of critical resources13. The constant need for raw materials is gradually depleting natural resources. Our mass consumption society contributes to our constant need for more products, and therefore there is a growing need for products that require natural resources at a rapidly growing rate resulting in further depletion of these resources. The earth’s population in 1800 counted 1 billion, having taken all of human history to reach that number. Only two centuries later, the global population is 6 billion, half of which lives in cities14. The world’s population has touched a mark of 7.3 billion in 2015 and could attain growth level of 9-12 billion before the year 205015. If the growth of the demand from the growing population continues at this rate, by 2030 with a global population of 10 billion people, two piles of the earth will be needed to satisfy all of the population’s demands. Planet Earth cannot resist such demands on natural resources. The environmental impact will be too significant. Since the 1970s, the global population has doubled, and the global Gross Domestic Product has grown fourfold16. The earth will not be able to cope with these growth rates and demands on natural resources, which means that renewable resources such as water and forests cannot exceed the rate of regeneration. For non-renewable resources such as fuels, the rate of use cannot exceed the rate of inventing sustainable substitutes of these non-renewable resources. Metal-ore extraction and metal production increased three-fold from 1970 to 2010. The steepest increase occurred from 2000 to 201017. The Report of the International Resource Panel, 2017 (assessing global resource use, based on a material resources database that covers almost five decades (1970 to 2017) and 191 countries) shows that existing trends forecast global material reached 88.6 billion tonnes in 2017 –more than three times the amount used in 1970. The report further explains the demand for materials which

Journal of Politics & Governance, Vol. 8, No. 3, March 2020
7
have shifted from renewable to non-renewable resources, reflecting the global trend away from traditional towards modern technologies, and from agriculture-based economies to urban and industrial economies. This creates new waste flows - thereby increasing emissions and pollution. Data in this report show the steep increases in demand for metal ores, like iron, have contributed to sharp rises in greenhouse gas emissions, aquatic ecotoxicity and emissions of smog-forming substances. Materials and products have historically been sourced from low-income countries bearing the burden of local impacts of resource extraction but also resulting in long-distance transportation routes to high-income countries. On the other hand, however, waste export of high-income countries to low-income countries seems to be significant too. In 2018, the Netherlands exported 6.847 thousand tonnes of recyclable metal waste only. That is 3 per cent more than in 201018. The recyclable plastic waste that was exported to foreign countries in 2018 amounted to 361 thousand tons, which was 6 per cent less than in 2017. Although a large part of the waste is processed in the Netherlands, still Indonesia imported 25.000 tons of Dutch plastic in 2018, compared to 1.000 in 2017. Furthermore, the Netherlands export waste to other countries, including Germany, Vietnam and Turkey. Taking into account the CO2 emission when transporting the waste by Sea Freight towards its destination, it may be considered to find alternatives such as the application of circular methods locally. FORMULATION OF THE UNITED NATIONS (UN) SUSTAINABLE DEVELOPMENT GOAL 12 (SDG 12) Ensuring Sustainable Consumption and Production Patterns The United Nations defines that at the current time, material consumption of natural resources is increasing, particularly within Eastern Asia. Countries are also continuing to address challenges regarding air, water and soil pollution. Since sustainable consumption and production aims at ‘doing more and better with less’, the UN further elaborates on net welfare gains from economic activities which can increase by reducing resource use, degradation and pollution along the whole life cycle, while increasing quality of life. There also needs to be a significant focus on operating on the supply chain, involving everyone from producer to the final consumer. This includes educating consumers on sustainable consumption and lifestyles, providing them with adequate information through standards and labels and engaging in sustainable public procurement, among others. The formulation of goal number 12 by the UN regards the responsible consumption and production, which aims to reshape consumption and production by transforming resource use in a way that reduces pressures on the environment and climate while at the same time promoting human and economic development. The Circular Economy A new economic paradigm, such as the circular economy, is needed to improve the protection of our natural resources. Responsible consumption and productivity with lower material and energy requirements, as well as reducing waste and emissions are the worthy imperatives. Circular Economy models aim at minimising waste. Minimising such waste with circularity in an economic system can be achieved through maintenance, repair, reuse, remanufacturing, refurbishing, recycling of products. This is in contrast to a linear economy which is based on a 'take, make, dispose' model of consumption patterns19. A closed economy system and a renewed economic model in which materials from discarded products are reprocessed and reintroduced as new products in the market. Furthermore, circular

Journal of Politics & Governance, Vol. 8, No. 3, March 2020
8
economy products may be offered as services, paying for a product per time of use instead of purchasing the product. One method is to collect the product at the end of the product life cycle and either refurbish it to new manufacturing’s condition or reuse its materials to manufacture new products. Recycling is, therefore, an essential aspect of the circular economy. Components and products need to be recycled at the end of the life cycle if we want to prevent it from becoming waste. This means that maximising the effort for collecting discarded products, materials and waste requires investigation and experiments to explore the possibilities as well as the limits and the dynamics of the circular system. Recovering materials such as metals and plastics in such a way that is not only efficient but also economical is a welcome initiative. Separating these collected materials is an important aspect to take into consideration, meaning the separation based on material specifications before reprocessing these materials. The composition of products and all of the losses of materials, metals, alloys. These losses ideally should be minimised, resulting in optimal recycle potential. Unique processes need to be developed for products consisting of multiple compositions such as metal and plastics. Furthermore, the quality of recycled material needs to be secured. With metal materials, one of the possibilities is to regulate the process and supplying material certificates. A quality document often used in the metals industry, confirming the properties of the material as supplied after recycling. These properties often are referred to international standards, including ANSI and ASME. All parties involved in the circular chain include those who initially designed and supplied the products, the users, parties involved with the collection of the waste, waste separation, waste recycling, material supply and manufacturers using the recycled material, notified bodies and authorities as well as the end-users and possibly other stakeholders. The performance of the circular economy depends on all of these stakeholders and their willingness to co-operate. Maximising circular economy efficiency means that maximising resource efficiency and processing is of crucial importance. The recyclability of materials will generate possibilities shortly helping to protect our earth’s natural resources by making it possible to use the same metals or other materials that have been used before. All depends upon the availability of the materials to be recycled. These quantities should be equal to our annual need for consumption. The use of metals, for instance, is increasing exponentially due to needing in construction, resulting in a life cycle and long-lasting use. This limits the possibilities for recycling since the materials will be available after a long period. However, unlike other raw materials, metals have great potential for recycling. They do not lose their properties during recycling resulting in possibilities for multiple uses. They seem to have more permanent characteristics than other materials such as food, fossil fuels, etc. Especially materials such as stainless steel have great possibilities as a permanently available resource when appropriately recycled. However, the complete circular chain needs to have specific attention when optimising circular models. Circular product designs, low-carbon transport, limiting transport and freight distance and using renewable energies. Keeping track of and continuous analyses of the impact on the environment of all the process steps in this chain are essential in order to determine the impact on society. The demand for materials keeps on increasing as the world population remains to grow. As

Journal of Politics & Governance, Vol. 8, No. 3, March 2020
9
the costs for conventional sourcing of raw materials increases, the opportunity for recycling and reusing materials efficiently and the reintroduction of valuable materials results in significant benefits. A CIRCULAR BUSINESS CASE A circular model was introduced by Van Straten Medical, a developer, manufacturer and global supplier of surgical instruments, with facilities in Europe in The Netherlands as well as in Germany. The circular approach was introduced using reusing hospital instrument waste, in particular discarded and rejected surgical instruments and other stainless steel waste –using it as a material for reuse in manufacturing of new medical products such as surgical instrument mesh baskets and components for mesh baskets. The objective was to demonstrate that cost savings could be realised for hospitals using instrument repair and refurbishment on the one hand and recycling of instruments if they could not be repaired in order to be reused on the other hand. A program was implemented named ‘Circular Instrument Management’ (CIM) and divided into two categories:
Focus on instrument repair instead of instrument replacement in order to extend the life cycle of medical instruments.
Recycling of rejected medical instruments when they could not be repaired using melting it into new raw material. Also, single-use instruments were included.
The services and experiments were setups having diverse machinery through which instrument repair and refurbishment is carried out for hospitals. The process of instrument repair and refurbishment, including instrument maintenance activities, was validated on forehand. The measurement of quality and consistency of the quality was seen as of great importance about the high standard of instrument repair services. The quality of a refurbished instrument should meet the standard of new manufacturing’s condition. A quality assurance program was implemented according to ISO 13485:2016 in order to validate the refurbishment process. ISO 13485 is a tool which reassures that the medical devices are being manufactured through a systematic approach to make them safer for use. Device manufacturers need to follow ISO 13485 for marketing their device globally. If a manufacturer meets the requirements of ISO 13485, the device can quickly meet the quality requirements in many regulated countries including the US20. Repair and refurbishment were regarded as having a nexus with manufacturing processes resulting in the application of ISO 13485:2016. The ISO 9001 in the case of instrument repair and refurbishment was not regarded as sufficient since ISO 13485 is a Quality Management Standard, specifically targeted for the manufacturing of medical devices. These quality standards refer to continued improvements in products or manufacturing processes as instrument repair and refurbishment may be regarded as such. The new revision of the ISO 13485 (Medical devices – Quality management systems – Requirements for regulatory purposes) underlines both risk management and usability engineering21. For this reason, a Risk Assessment, according to ISO 14971 was conducted on the process of instrument repair, refurbishment and instrument maintenance. ISO 13485 and ISO 14971 standards were applied in the repair and maintenance of surgical instruments in order to maintain regulatory compliance accurately. It furthermore, combines the GMP and ISO requirements (ISO 13485 and ISO 14971).

Journal of Politics & Governance, Vol. 8, No. 3, March 2020
10
Next to instrument repair, experiments were conducted with rejected instruments made from stainless steel as well as with single-use instruments. The objective was to determine whether the instruments could be recycled using melting and reuse as new raw material. Surgical instruments are generally made from stainless steel, in particular stainless steel type 316SS. Stainless steel is an alloy of mainly iron, chromium, nickel and carbon. Stainless steel should have a minimum of chromium, usually 11 to 12% and a maximum of carbon, usually 1.2%. Molybdenum, titanium, manganese, nitrogen and silicon are also present in many types of stainless steel. The stainless steel type 316L –where L stands for low carbon- has less carbon in order to limit corrosion sensitivity after welding. The objective of this type of material is that corrosion is prevented as is needed with surgical instruments. These instruments are washed intensively in hospitals in thermo disinfectors using chemicals to disinfect. After disinfection, the instruments are sterilised in most European countries in autoclaves reaching temperatures of 134 degrees Celsius. The characteristics of stainless steel are very suitable under these conditions but also to have it used as raw material for making surgical instruments. The material is furthermore, suitable for recycling and reuse. The combination of repair and refurbishment with the recycling of medical instruments when they could not be repaired anymore resulted in the program ‘Circular Instrument Management’ (CIM). Prominent within this CIM program was to create effective outcomes. The circular approach is intended to save not only locally but should have positive effects globally. Waste management, primarily when exported to other countries, leads to global effects with footprints. Globalisation, therefore, has its effects on Corporate Social Responsibility. Increased awareness of what happens next door, environmental changes, and other influences may lead to a drive for a sustainable global economy. International guidelines such as the UN, millennium goals and Organization for Economic Co-operation and Development (OECD) set the tone for international social norms. Reducing carbon footprints on the one hand and protecting our scarce natural resources, on the other hand. When using a circular approach by refurbishing surgical instruments and recycling to new materials when they cannot be refurbished lead to less replacement with new instruments. Generally, medical instruments are imported from other countries and therefore, shipped across the globe. The shipment and movement of these products can be measured in terms of carbon footprint using various methods for carbon footprint calculations. The carbon footprint can be defined as a measurement of the total Greenhouse Gas (GHG) emissions caused directly and indirectly by an individual, an organisation, event or product and is expressed as a carbon dioxide equivalent (CO2e)
22. The CO2 of a new medical or surgical instrument supplied in order to replace a discarded instrument can be calculated taking into consideration the carbon footprint of the manufacturing of the instrument, generating the packaging which is often made out of plastic as well as the calculation of CO2 emissions along freight transport chains. Furthermore, some surgical instruments are partly manufactured in Asia, then shipped to Germany to be further processed and packed before being exported to various other countries. A great deal of the surgical instrument manufacturers are concentrated in Tüttlingen, Germany, which is located in the south of the country near the border of Switzerland. These German-based companies manufacture a large part of the world's surgical instrument supply. Tüttlingen's instrument manufacturers are closely linked with medical manufacturing’s concentrations in Pakistan.

Journal of Politics & Governance, Vol. 8, No. 3, March 2020
11
The surgical instruments sector exemplifies how globalisation promotes the emergence of commodity chains and in turn, how commodity chains foster globalisation. Dominated by two clusters of small scale producers in Sialkot (Pakistan), Tüttlingen (Germany) and a few large subsidiaries like in Penang (Malaysia), the industry's dynamic depends on global buyers and their shifting ties to end-customers, hospitals and surgeons23. Semi-finished instruments are, therefore, frequently imported from countries such as Malaysia and Pakistan. These semi-finished products are generally finished in Tüttlingen, laser marked, branded and packed. The carbon footprint of these instruments when part-manufactured in Asia or Pakistan, freighted to Tüttlingen and exported to any country in the world, contributes to higher CO2 emissions than when it would be manufactured at one destination or when locally circularly refurbished and recycled. Local circular instrument programs could, therefore, contribute to lower CO2 emissions when compared to the conventional approach. Comparing local circular programs with conventional ‘replace-with-new-products’ would be beneficial for determining the impact of the different approaches. A wide range of methodologies and tools are available for the calculation of carbon footprints of freight transport, based on varying emissions data, routing and allocation assumptions and conflicts between actual and assumed vehicle loading performance. The European EN 16258 standard provides the most comprehensive framework to date about global emission calculation standard applicable to the carbon footprinting of freight transport. Stakeholders have quickly become aware of EN 16258 and are keen to understand its requirements and the implications for the way that they currently approach their carbon footprint calculations24. Understanding the effects on aspects such as carbon footprint, waste reduction and contribution to society is of great importance within Corporate Social Responsibility. Corporate Social Responsibility programs need to prove their effectiveness and not used in terms of greenwashing. The term greenwashing is typically used as a pejorative, referring to the practice of construing an activity as more environmentally friendly than it really is25. Social auditing could be of benefit in proving the effectiveness of Corporate Social Responsibility programs. A social audit is a process in which details of the resources, both financial and non-financial, used by public agencies for development initiatives are shared with the people, often through a public platform. Social audits allow people to enforce accountability and transparency, providing the ultimate users of services and projects with an opportunity to scrutinise development initiatives. It is a form of citizen advocacy based on the power of knowledge and is grounded in the right to information26. A social audit is a formal review or examination of a company's responsibility and impact on society, regarded as an assessment of how effective the company’s goals and strategy are in terms of social responsibility. These audits may help any type of organisation to determine if their objectives are reasonable and practical. A social audit is a method to determine if the actions taken are being received and relates that information to the organisation’s public image meeting environmental and social standards. Social audits can help companies create, improve, and maintain a positive public image. The circular business case, as described in this article, leads to effective reuse of waste and even further prevents waste. In terms of effectiveness, it seems that what is claimed is effectively there, namely new products manufactured out of collected waste. The complete circular chain within this

Journal of Politics & Governance, Vol. 8, No. 3, March 2020
12
business case was given special attention and could even be possibly further optimised. Collection of the waste in the four hospitals was done by road; however, combined with other collections in order to limit the logistical movements. In order to have the melting process as efficient as possible, the stainless steel waste collected was separated by Van Straten Medical based on material specification. After reprocessing, the metal sheets were stored in a central warehouse 6.4 km from the location of Van Straten Medical. The metal sheets were cut into smaller plates and transported 6.4 km to Van Straten Medical when used for further manufacturing of medical components. Effects of the carbon footprint of the supply of these components depend on the location of the end-user. METHODOLOGY This paper consists of a literature review in combination with the analysis of the outcome of an existing business case of instrument repair and circular reprocessing of old instruments. The combination of the outcome was reflected in the definition of corporate social responsibility. First, papers and abstracts were screened using researchgate.net and Google Scholar using search terms ‘Corporate Social Responsibility (CSR)’, ‘Responsible Corporate Management (CRM)’ and ‘Corporate Governance’. A review was conducted of the papers selected. The selection process has been expanded to search for the CG-CSR nexus. Afterwards, a nexus was made to a real business case and practical experiments with circular reprocessing of hospital waste in The Netherlands. These experiences were included in this paper. A Dutch company implemented corporate Social Responsibility within a real-life context -Van Straten Medical-, a manufacturer and supplier of surgical instruments who investigated and implemented a program to collect hospital waste, in particular stainless steel waste consisting of rejected stainless steel surgical instruments, rejected stainless steel mesh baskets as well as used stainless steel disposable instruments. This waste was collected at different hospitals during a period of six months. The company has been active since 1975 on the healthcare market, introducing instrument repair services actively since 2008. These activities were started-up as a commercial service upon the hospital’s request. In 2018 these services were expanded to collect instruments which were discarded as well as stainless waste such as obsolete instruments and instrument mesh baskets from different hospitals. The material was deposited since September 2018 in dedicated containers. These containers, when full, were collected by a metal reprocessing and recycling company. This company reprocessed the stainless steel waste and had it melted in melting furnaces, after which it was processed into metal sheet of 1 – 1.5 mm thickness. These metal sheet plates were cut into smaller plates. The metal sheet in turn was acquired from the same metal reprocessing company and used to manufacture new medical products and parts such as components used for instrument fixation where surgical instruments are fixated into stainless steel mesh baskets. Furthermore, complete mesh baskets were made from recycled stainless steel. Van Straten Medical aimed to close the circular loop by:
Extending the product life cycle of surgical instruments using certified repair and refurbishment instead of replacing it with new instruments.
Preventing waste by collecting used disposable instruments, rejected/scrapped instruments and other waste, and had it melted and reprocessed into sheet metal for reuse in the manufacturing new medical components and products.

Journal of Politics & Governance, Vol. 8, No. 3, March 2020
13
Experiments were conducted with rejected and disposable instruments and waste made from stainless steel, grades 304SS and 316SS. It was determined whether it could be recycled using melting and reprocessing to the sheet metal of plates of 1 – 1.5 mm thickness. The plates were cut in smaller pieces and supplied to Van Straten Medical who used it as new raw material for the manufacturing of components used in instrument and mesh basket fixation. RESULTS Surgical instruments were collected, repaired and refurbished into new manufacturing’s condition. These instruments -if not repaired- would have been discarded otherwise and processed through the conventional waste procedure. A total of 1.380 Kg of rejected and disposable instruments and stainless steel waste was collected from four different hospitals during the same period between 25 September–30 March 2019. One container of 100 Kg with disposable used and contaminated instruments was collected by Van Straten Medical and, after disinfection in a thermal washing machine, melted through a reprocessing company. All of the collected materials were melted and recycled to the sheet material. The sheet material was cut into smaller pieces and used to manufacture components for instrument mesh baskets and stainless steel components used in instrument fixation. The sheet metal cut plates were used in a Water Jet Cutting Machine at Van Straten Medical to cut components for surgical instrument mesh baskets and mesh basket instrument fixation. The leftover machining material was then returned to the circular container to be picked up for circular melting. In this way, no waste would be generated during the process. This paper reviewed the outcome of the circular approach of reprocessing stainless steel waste into new raw material and reflected this approach with a literature review on Corporate Social Responsibility. One of the outcomes of this research is that circular models such as the processing of medical waste is feasible, leading to the prevention of waste and reduction of costs associated with waste management? The environmental impact, although needed to be researched further, is positively influenced by the reuse of waste and therefore has a nexus with Corporate Social Responsibility and may, therefore, be seen as a possible method of Corporate Social Responsibility. CONCLUSION Reflecting on Corporate Governance about Corporate Social Responsibility comes down to comparing the separation of ownership from control and effective management to the impact on the social environment. Corporate governance is a broad term defining different methods, structures, whereas Corporate Social Responsibility is concerned with creating a balance between economic and social goals; however, they may contribute to one another. Such programs may have a positive influence on all of its stakeholders if it results in a positive contribution to society. It may even contribute to buying loyalty from its stakeholders. Focussing on Corporate Social Responsibility is a fundamental choice and may be carried through a variety of programs. The circular program -named circular instrument management- was regarded as a Corporate Social Responsibility program. The results of this circular program demonstrate that circular reprocessing of surgical instruments and stainless steel waste into new raw material can be used for the manufacturing of new medical products. Furthermore, it may not only contribute to waste prevention but also to save costs, as is the case with contaminated and non-contaminated hospital waste management.
Journal of Politics & Governance, Vol. 8, No. 3, March 2020
14
Further research in recycling, refurbishment, remanufacturing, and reuse of medical products is needed primarily due to its impact on society and CO2 emissions. Future research could further identify which alternatives could reduce the CO2 footprint associated with hospital waste. Waste is not only processed locally but also exported overseas over long distances to other countries resulting in CO2 emissions which could be reduced using local circular reprocessing. A comparison in terms of CO2 footprint of refurbished surgical instruments as opposed to replacement with new instruments is necessary, taking into account not only the manufacturing of new instruments but also the shipment of these instruments as well as the impact of creating waste when throwing away these instruments. The various methodologies could be further examined such as the different circularity approaches, possible surgical designs of medical products, facilitating easier circular reprocessing after use of the products as well as circular reprocessing of other materials then stainless steel. It may be concluded that Circularity and circular economy models contribute to Corporate Social Responsibility –a contribution to the entire society, involving multiple countries. The final conclusion is one of optimism. Metals are excellent materials for a circular economy and Circular Instrument Management. The instruments can be recycled again and again without losing their properties. There is an alternative to the use of natural resources. Circular methods such as refurbishment and reprocessing of waste seem to be valid with surgical products made from stainless steel grades 304SS and 316SS. These sustainability programs contribute to international ambitions, preserving our planetary natural resources. The scarcity of our natural resources, leading to price increases and longer lead times of products, maybe resolved by innovative and circular solutions being part of Corporate Social Responsibility programs. AUTHOR CONTRIBUTIONS AND DISCLOSURE This paper formed part of a Ph. D. research. Dr. Nupur Tiwari supervised the research, advised and proofread the paper. Dr. Nupur Tiwari was lecturing professor on a Ph. D. seminar ‘Corporate Social Responsibility’ at the International Business School, The Hague, The Netherlands. B. J. van Straten is General Manager at Van Straten Medical and is specialising on Circular Economy models as alternatives for sustainable healthcare and has joined the research line of Dr. Ir. Ing. T. Horeman Delft University of Technology – Circularity for Sustainable Surgery. ENDNOTES 1. Wood, Donna J. (1991). "Corporate Social Performance Revisited". The Academy of Management
Review. 16 (4): 691–718. doi:10.2307/258977. JSTOR 258977. 2. Mackey, John and Sisodia, Rajendra, Conscious Capitalism (2013) 3. Lin, Tom C. W., Incorporating Social Activism (December 1, 2018). 98 Boston University Law
Review 1535 (2018) 4. A B C Internet Encyclopaedia of Philosophy "Ethics" 5. Business Ethics (Stanford Encyclopedia of Philosophy)". Plato.stanford.edu. 2008-04-16. Retrieved
2013-06-04. 6. https://www.reputationmanagement.com/blog/corporate-social-responsibility-examples/ 7. Khan, Humera. (2019). A Literature Review of Corporate Governance. 8. KPMG, 2013; Verdantix, 2015. 9. Jo and Harjoto, 2012; Miroshnychenko, 2015. 10. Boesso et al., 2013, Husted and Allen, 2013.

Journal of Politics & Governance, Vol. 8, No. 3, March 2020
15
11. Geissdoerfer, Martin; Savaget, Paulo; Bocken, Nancy M. P.; Hultink, Erik Jan (2017-02-01). "The Circular Economy – A new sustainability paradigm?". Journal of Cleaner Production. 143: 757–768. doi:10.1016/j.jclepro.2016.12.048.
12. Towards the Circular Economy: an economic and business rationale for an accelerated transition. Ellen MacArthur Foundation. 2012. p. 24.
13. Macroecology meets macroeconomics: Resource scarcity and global sustainability. James H.Brown, Joseph R.Burger. Ecological Engineering, Volume 65, April 2014, Pages 24-32.
14. Mittal, Rahul. (2013). IMPACT OF POPULATION EXPLOSION ON ENVIRONMENT. Weschool Knowledge builder - the national journal.
15. Uniyal, Shivani & Paliwal, Rashmi & Saun, Bhumija & K. Sharma, R. (2017). Human Overpopulation:. 10.4018/978-1-5225-1683-5.ch001.
16. Oberle, Bruno & Bringezu, S & Hatfield-Dodds, Steve & Hellweg, Stefanie & Schandl, Heinz & Clement, Jessica & Cabernard, Livia & Che, Nhu & Chen, Dingjiang & Droz-Georget, Helen & Ekins, Paul & Fischer-Kowalski, Marina & Floerke, Martina & Frank, Stefan & Froemelt, Andreas & Geschke, Arne & Haupt, Melanie & Havlík, Petr & Hüfner, Rebekka & Zhu, Bing. (2019). Global Resources Outlook 2019: Natural Resources for the Future We Want (A Report of the International Resource Panel).
17. Bringezu, S & Ramaswami, Anu & Schandl, Heinz & O'Brien, Meghan & Pelton, Rylie & Acquatella, Jean & T. Ayuk, Elias & Shun Fung Chiu, Anthony & Flanegin, Robert & Fry, Jacob & Giljum, Stefan & Hashimoto, Seiji & Hellweg, Stefanie & Hosking, Karin & Hu, Yuanchao & Lenzen, Manfred & Lieber, Mirko & Lutter, F. Stephan & Miatto, Alessio & Zivy, Romain. (2017). Assessing global resource use: A systems approach to resource efficiency and pollution reduction (A Report of the International Resource Panel). P.10
18. Central Bureau of Statistics (CBS), Ministry of Infrastructure and Water Management, waste figures at national level, 2019 - https://www.cbs.nl/nl-nl/maatwerk/2019/11/export-van-afval -
19. Towards the Circular Economy: an economic and business rationale for an accelerated transition. Ellen MacArthur Foundation. 2012. p. 24.
20. Jain, Achin & Ganesh, Neenu & Venkatesh, Porika. (2018). QUALITY STANDARDS FOR MEDICAL DEVICES. International Journal of Drug Regulatory Affairs. 2. 19-24. 10.22270/ijdra.v2i4.149.
21. Scholtes, Michael & Buedenbender, Stephanie & Behrend, Annemarie & Sohrabi, Keywan & Gross, Volker. (2018). Integrating a Usability Engineering Process into a Consisting Risk Management. Current Directions in Biomedical Engineering. 4. 645-647. 10.1515/cdbme-2018-0155.
22. Gao, T., Liu, Q. and Wang, J., 2014, A Comparative Study of Carbon Footprint and Assessment Standards. International Journal of Low-Carbon Technologies, 9(3), 237-243.
23. Halder, G. (2005). Surgical instruments in Tuttlingen (Germany) and Sialkot (Pakistan). Local production for the world market. 57. 12-20.
24. Lewis, Alan & Ehrler, Verena & Auvinen, Heidi & Maurer, Hedi & Davydenko, Igor & Burmeister, Antje & Seidel, Saskia & Lischke, Andreas & Kiel, Jan. (2016). Harmonising Carbon Footprint Calculation for Freight Transport Chains. 10.1002/9781119307761.ch20.
25. Lippert, Ingmar. (2011). Greenwashing. 10.4135/9781412975711.n67. 26. Eavani, F & Nazari, Kamran & Emami, Mahmood. (2012). Social audit: From theory to practice.
Journal of Applied Sciences Research. 8. 1174-1179.

Journal of Politics & Governance, Vol. 8, No. 3, March 2020
16
Journal of Politics & Governance Vol. 8 No. 3, March 2020, Pp. 16-19 ISSN: 2278473X (Print) 2456-8023 (Online)
Fifty Years of Nuclear Non-Proliferation Treaty:
A Review of Indian Perspective
Baruna Kumar Behera*
ABSTRACT
Implementation of the Nuclear Non-Proliferation Treaty (NPT) is going to complete 50 years in 2020. In the domain of nuclear arms control and disarmament, NPT is regarded as an essential milestone as more than 190 countries have become parties to NPT, making it one of the most successful disarmament treaties in the world history. Debate on its success generates a mixed response highlighting some positive and negative dimensions of the nuclear arms race. Under this background, an effort has been made in this article to understand NPT and its relevance for India, who declared herself as a nuclear weapon state after the Pokhran – II nuclear test in Rajasthan in May 1998. At present only five countries namely India, Pakistan, Israel, North Korea and South Sudan remain out of the domain of NPT. Keywords: Nuclear Non-Proliferation Treaty, Nuclear Weapons, P-5 Countries, United Nations, India
INTRODUCTION After many years of negotiations, the Nuclear Non – Proliferation Treaty (NPT) was voted by the UN General Assembly in June 1968. The treaty was finally signed on July 01, 1968, and came into operation on March 05, 1970. More than 190 countries have signed the treaty, making it one of the most successful arms control agreements in the world history. The main objective of this treaty is to eliminate the further spread of nuclear weapons1. MAIN PROVISIONS OF THE NPT
It instructed all the countries holding nuclear weapons not to propagate nuclear knowhow and transfer manufactured nuclear weapons to non-nuclear weapon countries.
It seeks to prevent the spread of nuclear weapons and nuclear technology. Nuclear weapon countries agreed to give preferential treatment to non-nuclear weapon
countries in the matter of peaceful uses of nuclear energy. Such kind of assistance is available only for the peaceful use of nuclear energy, but not for the military application of nuclear energy.
It seeks to promote co-operation in the peaceful uses of nuclear energy.
*Assistant Professor, Department of Political Science, Government Science College, Chatrapur, Odisha, India E-mail: [email protected]

Journal of Politics & Governance, Vol. 8, No. 3, March 2020
17
Non-nuclear weapon countries are assured to be provided with immediate assistance by nuclear weapon countries in case of any attack or aggression.
Non-nuclear weapon countries should accept the verification measures set by the International Atomic Energy Agency (IAEA) to ensure a peaceful application of nuclear energy. This provision has been designed to prevent diversion of nuclear assistance from peaceful to the military application of nuclear energy.
Nuclear disarmament is its main goal; however, it has not set the dateline for achieving this objective.
Initially, the treaty was designed to remain valid for 25 years, i.e. up to the year 1995, however in 1995 during the fifth review meeting held at New York, and member countries agreed to extend the treaty for indefinitely and without conditions. INTERPRETATION OF PROVISIONS OF THE NPT From the provisions of NPT, it is clear that NPT divides the countries of the world into two categories, i.e. nuclear haves and nuclear have-nots. The main objective of NPT is to rule out further spread of nuclear weapons, and accordingly, it laid down various provisions to achieve this. NPT also seeks to achieve nuclear disarmament, but it does not mention the timeline for accomplishing this task. Nuclear proliferation is of two types, i.e. Horizontal and Vertical. NPT has been successful in checking the horizontal proliferation of nuclear weapons since 1970. In 1968, only five countries viz. USA, USSR, UK, France and China had nuclear weapon capabilities. Now this list enlarges to include India, Pakistan, Israel and North Korea. However in case of vertical proliferation, it can be said that NPT has been failed to check nuclear proliferation as P-5 countries (USA, USSR, UK, France and China) continue to develop more lethal nuclear warheads. From the provisions of NPT, it seems that it perpetuates the phenomenon of nuclear imperialism. It seems that NPT has assigned the role of protector and guardianship to P-5 countries and rest other countries are made to accept the superiority of P-5 countries. An environment where nuclear weapons are seen as the greatest symbol of political power and pride, NPT has been contemplating to achieve nuclear disarmament by artificially dividing countries into nuclear haves and nuclear have-nots. From a realist perspective, this objective is nothing but a mirage. In a world where there is an intense struggle for power, why a nation would jeopardize its security by accepting such a false narrative of nuclear disarmament2. According to western scholars, P-5 countries are responsible powers and do a careful cost-benefit analysis before any move in the direction of application of nuclear weapons. Such perception is nothing but a false explanation that aims to maintain the status quo favouring big five powers. Under the UN charter, all the member states of the UN are regarded as equal sovereign states. This principle seems to have no place when big powers make efforts for nuclear disarmament. When NPT aims at nuclear disarmament, then questions arise, i.e. why this double standard has been adopted in favour of nuclear weapon countries, why they have been allowed to increase their nuclear arsenal vertically and qualitatively. When the cold war ended in 1991, it was hoped that thrust for nuclear weapons would come down, but this thinking proved as a utopian concept. Nuclear weapons and nuclear strategies are still very much relevant, and they will remain so considering objective laws that govern human nature. Under this background, it is imperative to examine the status of nuclear weapons being held by P – 5 countries to evaluate the worth of the NPT treaty since 1968.

Journal of Politics & Governance, Vol. 8, No. 3, March 2020
18
[Source: SIPRI Year Book 2019]
[Source: Global Nuclear Weapons Inventories 1945-2010, Bulletin of atomic scientists, July – August 2010.] From these two graphs, it is clear that countries like France and China have increased their nuclear weapon capabilities significantly over the last 50 years. From the graph, it is evident that countries like USA, Russia and the UK have reduced their nuclear weapons in number but at the same time, these countries have taken steps to upgrade their nuclear arsenals qualitatively. A new generation of nuclear weapons has been developed. Battlefield nuclear weapons or mini-nukes or tactical nuclear weapons are being developed as new-age weapons. Factors responsible behind the desire of countries to have nuclear weapons are as follows3:
Given the destructive capacity of nuclear weapons, an attack on nuclear power is unlikely.
6185 6500
200 300 290
USA Russia UK France China
No.Of Nuclear Weapons in 2018
29561
9399
394 36 35
USA Russia UK France China
No.Of Nuclear Weapons in 1968

Journal of Politics & Governance, Vol. 8, No. 3, March 2020
19
Nuclear weapons have substantial symbolic significance as well as political prestige. It is a ticket for sitting around the high tables of world politics.
The international environment is more or less anarchical, where might is right. In such a background, nation-states must enhance their power, and in this regard, nuclear weapons are the best options to ensure security.
The nuclear-weapon-free world is a myth as long as concepts like power, and national interests have remained major factors of international politics. Such a myth cannot be translated into reality.
INDIA’S STAND ON THE NPT India has criticized provisions of NPT as discriminatory and unrealistic. It is also argued that the NPT treaty has ignored security scenario of India. Security paradigm of India is very precarious as from two fronts India has chances of war. Relations of India with China and Pakistan remain hostile and will remain so shortly. While China is a recognized nuclear-weapon state, clandestine nuclear and missile relationship between China and Pakistan has remained a matter of great alert for India; therefore, India wants to keep its nuclear option open and flexible. Under such circumstances, India must maintain a minimum nuclear deterrent for ensuring its security4. CRITICISMS OF THE NPT TREATY
In 2020, NPT is going to complete 50 years of its operation, and still, now it has not achieved its objective of nuclear disarmament.
No set timeline for nuclear weapon states to get rid of their nuclear weapons. It is discriminatory and artificially divides countries of the world into nuclear haves, and
nuclear have nots. Pursues the policy of nuclear imperialism. UN principle of sovereign equality seems to have no application in the operation of NPT.
CONCLUSION Traditionally India has been a strong votary of elimination of Weapons of Mass Destruction (WMD) including nuclear weapons; however, no concrete steps have been taken in this regard in the real sense of the term at the global level. India should not become a party to NPT given its discriminatory provisions. Only one option is there for India for becoming a member state of NPT, i.e. as a nuclear-weapon state. This pre-condition is very unlikely to happen; therefore, India should continue its policy of unilateral moratorium in respect of further nuclear testing and do all such strategies necessary for becoming a responsible power of the present century. India is a de-facto nuclear weapon state, a fact well recognized by the major powers of the world; therefore, India should continue its policy of opposition of NPT in its present form. ENDNOTES 1 Vinay Kumar Malhotra, International Relations, Disarmament and Arms Control (New Delhi: Anmol Publication Pvt.Ltd.) pp. 353-373. 2 Andrew Heywood, Global Politics, Nuclear Proliferation and Disarmament (Palgrave Macmillan) pp. 263-267. 3 Andrew Heywood, Global Politics, Nuclear Proliferation and Disarmament (Palgrave Macmillan) pp 263-267. 4 U.R Ghai, Foreign Policy of India, India’s Nuclear Policy (Jalandhar: New Academic Publishing Co.)
pp. 494-508.

Journal of Politics & Governance, Vol. 8, No. 3, March 2020
20
Journal of Politics & Governance Vol. 8 No. 3, March 2020, Pp. 20-24 ISSN: 2278473X (Print) 2456-8023 (Online)
Political Spectrum and Six-Axis Political Compass: A Critique
Pitamber Kaushik*
ABSTRACT
The paper depicts why the prevalent biaxial arrangement that used to depict the Political Spectrum is inadequate and suffers from irreconcilable internal contradictions, by furnishing theoretical arguments, highlighting unaccounted considerations and offering concrete counterexamples. The paper proposes augmentation of a further four axes, i.e. bifurcation of the economic aspect into two independent axes and of the social axis into four such distinct, independent axes to suffice for comprehensively encompassing the wide variety and expanse of the political spectrum, both theoretically and practically, thus, yielding a holistic six-axis political compass. Keywords: Political Spectrum; Ideology; Nolan Chart; Taxation
A Political Spectrum is a diagram to visually represent an individual’s or an administration’s political-ideological standings, viewpoints and perspectives1, commonly, on a two-dimensional plot, composed of an economic and a so-called social axis2. The Nolan Chart and sister constructs are two-dimension (biaxial) graphs that attempt to approximate the political allegiance of an individual, based on their responses by quantifying two, mutually-independent parameters, on the two axes and thus ascertaining the ordered pair Cartesian Coordinates of their ideological standpoint3. The two axes are, with subtle specifications and minor variations, invariably one economic and one socio-political, which is almost always mentioned either as just Social or just Political label. The ambiguity in resolving the latter component, i.e. the socio-political axis often leads to internal contradiction - frequent and stark clashes within the (never explicitly mentioned) social and political connotations composing it4. The charts as mentioned above invariably have a single economic axis, described as being a measure of “economic freedom”, in the sense that whether the economy is cooperatively collectively managed (either by The State, i.e. centralised agency or as collective communes) or be left open to competition with minimal interference from the state. The former is traditionally labelled as the economic “left” and the latter “right”. It is also widely closely associated with and assumed to be characterised by taxation. The former sanctions a high level of taxation while the latter calls for low to no taxation5, 6.
*Independent Researcher based in Bangalore, India E-mail: [email protected]

Journal of Politics & Governance, Vol. 8, No. 3, March 2020
21
However, advocacy for the free market does not necessarily imply espousing and vouching for low taxations, nor vice versa. To illustrate this, one can take the case of Scandinavian nations Norway, Sweden, Denmark, which are apparent counterexamples to the above paradigm of free-market being synonymous with low taxations. According to data from the OECD7 for the year 2017, total tax revenue comprised 45.7% of the GDP of Denmark. The same statistic was 44.4 for Sweden and 38.8 for Norway7. Leaders of Scandinavian nations, despite advocating a free market economy, continue to have very high levels of taxation, as part of their welfare policy and to support their extensive Public Distribution System and Social Security Safety Nets. Consider the nations of Mexico and Norway in 2017. According to the 2017 annual report of The Index of Economic Freedom, Mexico was ranked 76th in terms of economic freedom among the nations of the world8, and according to data from the OECD, Mexico in 2017 had its total tax revenue from taxes on incomes, profits and capital gains comprise a mere 7.2% of its GDP[7]. Meanwhile, Norway, in the same year, i.e. 2014, was ranked 25th in terms of economic freedom by The Index of Economic Freedom8. On the other hand, Norway’s tax revenue from taxes on incomes, profits and capital gains were a staggering 15.1% of its GDP, for the year 2017, one of the highest in the world, according to OECD statistics7. Even in terms of incomes, profits, and capital gains from Corporates, the difference is similarly pronounced9. Thus, despite the leaders of Norway being significantly more vehement advocates of free-market than Mexico, support much higher taxes than those of the latter. Numerous such counterexample pairs are debunking the tying of free-market advocacy with crusading for tax repeal. It necessitates the conception of two economic axes, to do justice to the distinct concepts: Market Freedom and Taxation. Taxation is closely tied to ‘Big Governments’ - Government Breadth (as compared to its depth and penetration and authoritarianism), Public Welfare System, and post-action wealth redistribution. It is quite different from measuring the extent of government intervention in regulating the economy and Keynesianism. Anti-free market governments or Governments on the “Left” of the Market Freedom axis are opposed to a Darwinian economy and all-out laissez-faire competition. They yearn and tend to regulate the economy and design, structure and run the market under government control to ensure, as they see fit, for optimising production, the fulfilment of demand and economic equality. This high degree of penetrative interventionism and control is one way of striving towards imposing and achieving economic egalitarianism. Meanwhile, Anti-Free Market advocates may or may not be Pro-Taxation. Pro-Taxation ideology is another way of striving towards economic egalitarianism, by seeking monetary redistribution at the terminal of performance of an economic activity or value generation. These two aspects of Economic Freedom and Equality: Taxation and Free Market are distinct and independent and thus four possible mutual combinations within them, exist viz. (Pro-Free Market, Pro-Taxation), (Anti-Free Market, Pro-Taxation), (Anti-Free Market, Anti-Taxation) and (Pro-Free Market, Anti-Taxation). Multiple major non-economic facets to a consistent political system of belief and ideology (concerning political standpoint, agenda and policymaking) cannot be generalised and composed into a dichotomy, because there neither exists an underlying theoretic continuum unifying them, nor a practically consistent grouping observed in the real world. Thus, the prevalent authoritarian-libertarian divide is misleading and must be resolved into at least three distinct components, as is proposed ahead.

Journal of Politics & Governance, Vol. 8, No. 3, March 2020
22
The Political axis parameterises the penetration of the government into the lives of people. It provides for the scope and extent of authority, intervening into the lives of the citizens with its wills, legislation, directives, norms, prohibitions, regulation and other direct and indirect means of exertion of administrative control, at various collective and individual levels. It is further divisible into two subcategories - hence appropriating two axes. “Depth” is the intensity of penetration within each field and aspect of individual life. The traditional concept of “authoritarianism”, i.e. the depth of scope, inflexibility and state/authority’s intrusion upon increasingly intimate and private zones and freedoms of the individual, is a measure of the severity of confinement of the available degrees of freedom of operation - the intimacy of penetration of authoritative control over increasingly personal, private and natural freedoms lower in the pyramid. Its extremes are statism (maximal) and anarchy (minimal). On the other hand, “Political Breadth” can be defined as the level of comprehensiveness or the number of aspects of collective and individual life regulated by the state, as opposed to the extent (up to what level of privacy or what sphere/zone of intimacy and individualism) of regulation into each those aspects or level of intimacy of freedoms encroached upon (Depth). The Welfare States are often Broad Governments - an Interventionist “Big Government” or “Nanny State”, a milder version of which, is endorsed by the contemporary Left in the United States of America. Take, for instance, the state of Cuba under the Fidel Castro Ruz and the Islamic Republic, a quasi-theocracy, both have a considerable depth of government but differ in their non-overlapping breadths, i.e. in the different qualitative points and aspects of citizen’s lives that they govern and impose their will upon. While Cuba has a significant and expansive Healthcare and Education system, Iran lacks accessible and efficacious Healthcare and Education sectors10, 11. A Broad Government may require citizens to ensure a daily nutritious diet and dosage of milk to their children, enforce elaborate provisions and safeguarding alimony laws for divorcees. Direct citizens are expected to act in various ways in varied walks of life to ensure that various rights are upheld, and a general sense of well-being prevails. On the other hand, a Deep Government could monitor the internet connections or be concerned with what transpires behind closed doors of the citizen’s homes, with the citizen’s daily activities, as in blasphemy and so-called unnatural sex laws in a theocracy or civilian surveillance for the prosecution of dissent and criticism of the authority, in an oppressive autocracy. Broad Governments are likelier to ask you to report relevant data, so they can serve you the best, while Deep Governments perniciously monitor every single layer of your life. A Broad-Government’s expansive control is an insurance of the general well-being of the citizen, prevention of self-harm, and assurance of delivery of welfare measures to every single individual, whether independent or a dependant. On the other hand, a Deep Government penetrates every sphere of an individual’s life and exerts such enormous authority that it restricts the individual’s free will, hinders their creative fulfilment, impedes their personal growth, and curbs their individuality - passive, soft enslavement. The Socio-cultural axis provides a measure of the staunchness of adherence to traditional socio-cultural paradigms and values, in general. It gives an idea of the inflexibility and absoluteness of social structure and culturally prescribed and inculcated normative directives of action, ethics, and ethos deemed ideal, by the established social order. For example, The People’s Republic of China actively discourages religion and proclaims to be seeking to abolish all, not just organised and

Journal of Politics & Governance, Vol. 8, No. 3, March 2020
23
institutionalised, collective religion.[12] This is merely just another expression of the aforementioned Political aspect of Depth of Authority, and is neither an indicator of Socio-culturally Conservative nor Liberal nor Centrist nature. On the other hand, in the wake of Dengist Reforms, China experienced a cultural resurgence, which is a change qualifiable on the Socio-cultural axis and shifted it slightly rightwards thereby. Today, the self-proclaimed “Communist” Regime of China, already laden with myriad contradictions, supports amongst others, the practice of pseudoscientific folk medicine despite the ecological and epidemiological risk posed by the consumption of exotic and rare wild animals for the purpose. Folk-medicine centres were suddenly encouraged (after the initial era of crackdown) and are today government-sponsored and authorised13. Finally, an Ethnic axis should define resistance (pro-stasis) to change in the ethnicity-based composition of demography, or lack thereof (pro-cosmopolitanism). A socio-culturally liberated society, for example, Japan, can continue to resist immigration and diversification of its demography and be predominantly composed of a uniform, non-cosmopolitan, mono-ethnic demography. Its demographic composition has remained mostly unaltered in terms of race, ethnicity and religion, over decades14. The Post-Deng People’s Republic of China, despite experiencing an economic and socio-cultural resurgence and revival, continues to resist immigration and diversification of the demography, as Hanisation (State promoted predominance of the Han race and culture) continues to be the paradigm, markedly embraced by the ruling regime15. The above demonstrates why the universally prevalent notion of a biaxial left-right divide is grossly deficient in sufficing for the distinctions underscored and suffers from irreconcilable contradictions. To devise a holistic diagram to suffice for the diversity, nuance, and combinatorics exhibited by the real world (by both theoretical and empirical considerations) and span the entirety of the Political Spectrum, one needs six mutually independent axes as follows: Freedom of Market, Taxation, Political Depth (Authoritarianism and Interdiction), Political Breadth (Scope and Range of Expanse of Regulation), Sociocultural Conservatism, and Ethnic Conservatism (Resistance to the diversification of composition: Stasis versus Cosmopolitanism). The Political Spectrum claims to “depict” or “represent” the entirety of the range of Political ideologies and viewpoints possible - in order to substantiate this, and it is vital to account for all possible combinations, niches, nuances, and peculiarities. Representing beliefs using the six-axis chart poses obvious difficulties owing to the inability to represent more than three dimensions in a typical plot. A workaround is using three two-dimensional plots or only representing beliefs as an ordered set of 6 numbers, i.e. a coordinate denoting location in 6 dimensions, each as a number separated by a comma, in a traditional sense of order. Another way is to use a Radar Chart - using no negative axes and initiating each axis at 0 and all diverging outwards. All six axial rays emanate from the Origin, and the respective coordinates on each are interconnected to form a polygon, which provides an elegant and holistic visualisation of an individual’s ideology. ENDNOTES 1Heywood, Andrew (2017). Political Ideologies: An Introduction (6th ed.). Basingstoke: Macmillan International Higher Education. pp. 14–17. 2Bryson, Maurice C.; McDil, William R. (Summer 1968). The Political Spectrum: A Bi-Dimensional Approach. Rampart Journal of Individualist Thought. 3Mitchell, Brian Patrick (2007). Eight Ways to Run the Country: A New and Revealing Look at Left and Right. Greenwood Publishing Group. p. 7. ISBN 978-0-275-99358-0.

Journal of Politics & Governance, Vol. 8, No. 3, March 2020
24
4Claborn, David; Tobias, Lindsey (2015). "If You Can't Join 'Em, Don't : Untangling Attitudes on Social, Economic and Foreign Issues by Graphing Them". Olivet Nazarene University. 5Shin, Jungshub (2016). The Consequences of Government Ideology and Taxation on Welfare Voting. Political Research Quarterly. 6Lozza, E.; Kastlunger, B.; Tagliabue, S.; Kirchler E. (2013). The Relationship Between Political Ideology and Attitudes Toward Tax Compliance: The Case of Italian Taxpayers. Journal of Social and Political Psychology. 7https://www.oecd-ilibrary.org/sites/0bbc27da-en/1/2/4/index.html?itemId=/content/publication/0bbc27da-en&_csp_=fb150f38de3d79feb040c95e33debbe5&itemIGO=oecd&itemContentType=book 8https://www.fraserinstitute.org/sites/default/files/economic-freedom-of-the-world-2017.pdf 9https://stats.oecd.org/index.aspx?datasetcode=REV 10http://hdr.undp.org/en/content/education-index 11https://www.who.int/healthinfo/paper30.pdf 12https://www.pewforum.org/2019/07/15/a-closer-look-at-how-religious-restrictions-have-risen-around-the-world/ 13https://www.economist.com/leaders/2017/08/31/china-is-ramping-up-its-promotion-of-its-ancient-medical-arts 14Doak, K. (2001). Building National Identity through Ethnicity: Ethnology in Wartime Japan and After. Journal of Japanese Studies, 27(1), 1-39. doi:10.2307/3591935 15 Lele, Ajey; Goswami, Namrata; Dahiya, Brig Rumel (2014). Asia 2030: The Unfolding Future. Lancer Publishers LLC.

Journal of Politics & Governance, Vol. 8, No. 3, March 2020
25
Journal of Politics & Governance Vol. 8 No. 3, March 2020, Pp. 25-31 ISSN: 2278473X (Print) 2456-8023 (Online)
Jobless Growth in India: The Way Forward
Srirang K. Jha* and Amiya Kumar Mohapatra**
ABSTRACT
Indian economy was opened up in 1991 to boost productivity and augment job opportunities while resolving the balance of payment crisis. However, contrary to widespread expectations of the economists and policy makers, liberalization, privatization and globalization resulted in dismal job growth during the initial years and the negative trend continues even today. It is paradoxical but true that India’s GDP growth rate is highest in the world at present while job growth rate is slowest globally. The first decade of 21st century has been characterized by remarkably lower average employment elasticity in India (0.2) i.e. less than the global average (0.3). By 2009-10, the average employment elasticity touched the lowest ebb –0.1 which implied onset of the jobless growth. For last ten years the government as well as the economists and policy makers have been grappling with the issue and trying to figure out how to reverse the trend and intensify job creation across India. This article examines the reasons behind the jobless growth and how those factors can be addressed to unleash job creation in a big way. Keywords: Jobless Growth, Employment Elasticity, India
INTRODUCTION Liberalization, privatization and globalization unlocked the vast potential of Indian economy in 1991. It ushered in a knowledge economy based on competitiveness, innovations and technology. As a result, productivity increased many fold. However, jobs in manufacturing sector declined tremendously. The economists and policy makers thought that the impact of job losses in manufacturing sector may be offset by mushrooming service sector. However, service sector had its own limitations –low paying jobs, requirement of special skills and knowledge of English language competency. Thus, large number of workers, who lost their jobs in the manufacturing sector thanks to automation, technological advancement and right-sizing policies of the companies to remain competitive by cutting cost, could not find alternative employment. As the governments at the centre or state did not focus on rural industrialization, development of non-farm sector and agricultural reforms, the unemployment scenario further worsened. Unfortunately, most of the
*Associate Professor & Head, General Management Area, Apeejay School of Management, New Delhi, India E-mail: [email protected] **Associate Professor, Fortune Institute of International Business, New Delhi, India E-mail: [email protected]

Journal of Politics & Governance, Vol. 8, No. 3, March 2020
26
states of India continue to focus on big ticket projects with foreign investment through Foreign Direct Investment (FDI) route as is evident from annual jamboree organized by them to attract potential investors. Now the rural as well as urban unemployment rates have sky-rocketed that needs to be addressed through big-impact surgeries rather than band-aids and quick-fixes. Already the government has launched several policy initiatives like ‘Make in India’, ‘Skill India’, ‘Digital India’, Start-up India’, etc. during the last five years. However, the outcomes vis-à-vis job creations have been less than satisfactory as evident from the available job statistics. On the contrary, there is a slugfest between the government and opposition on the issue of job creation versus job losses as well as jobless growth. Both sides have plausible data sets to prove their point. In the meantime, common people continue to suffer due to lack of appropriate job opportunities both in rural and urban areas. Further, those who are somehow employed are reeling under increasing work pressure, lower wages and virtually no job security and social security. Hence the jobless growth is a real problem even if the government tries to act in dismissive manner in the wake of onslaught from the opposition. However, despite being contemptuous about the discourse on jobless growth, the government seems serious and concerned regarding the burgeoning unemployment scenario in the country. INCIDENCE OF JOBLESSNESS IN INDIA Government of India began measuring joblessness in the country in 1972-73 through its agency National Sample Survey Office (NSSO). However, the agency has reported worst ever rate of joblessness in the country during 2017-18 at 6.1% of the total labour force (Barman, 2019). Global trends with regard to declining job opportunities are no different. The unemployed population constitutes 5.5% of the labour force (Jagannathan, 2018) Interestingly, the unemployment crisis cuts across every category i.e. rural and urban, men and women --27.2% urban women are worst-affected, followed by their 18.7% of male counterparts while more men (17.4%) in villages are jobless than women (13.6%) (Barman, 2019). Another state agency which captures job related data is Labour Bureau. Even the Labour Bureau report on joblessness is quite disappointing. The scenario vis-à-vis incidence of joblessness in India has certainly depreciated since 2011-12 which is a matter of serious concern for the policymakers and the government (Padmanabhan, 2019). However, a section of scholars dismiss the job data spawned by NSSO or Labour Bureau. Instead they advocate use of payroll data to figure out incidence of employment and unemployment. Even in advanced countries like USA, payroll data is used to capture rate of employment/unemployment. Only limitation of payroll data is that it excludes self-employed and farmers. Also, in India, there are no payroll data readily available to make conclusive assertions regarding incidence of employment or non-employment. Ghosh and Ghosh (2018) have attempted to collate data from Employee Provident Fund Organization (EPFO), Employee State Insurance Corporation (ESIC) and National Pension Scheme (NPS) to figure out incidence of employment in India. As such the formal sector payroll is around 91.9 million (taking both old subscribers and those added in the latest year, and the payroll estimates show that 5.9 lakh jobs are being generated every month, making an estimated 7 million new jobs in 2017-18 (Ghosh and Ghosh, 2018). One may only hope that NSSO and Labour Bureau adopt payroll based data to come up with better quality statistics on employment scenario in the country. Employment/unemployment data provided by Centre for Monitoring Indian Economy (CMIE) is equally alarming. According to CMIE report (based on a survey of tens of thousands of households
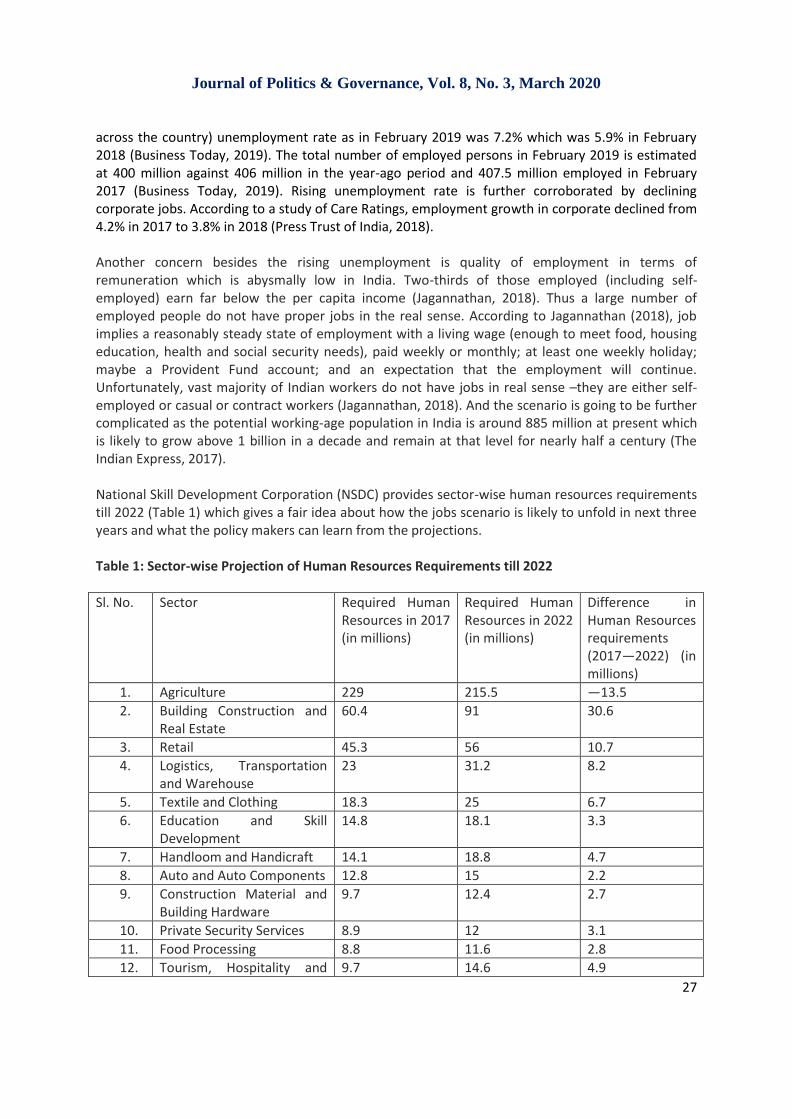
Journal of Politics & Governance, Vol. 8, No. 3, March 2020
27
across the country) unemployment rate as in February 2019 was 7.2% which was 5.9% in February 2018 (Business Today, 2019). The total number of employed persons in February 2019 is estimated at 400 million against 406 million in the year-ago period and 407.5 million employed in February 2017 (Business Today, 2019). Rising unemployment rate is further corroborated by declining corporate jobs. According to a study of Care Ratings, employment growth in corporate declined from 4.2% in 2017 to 3.8% in 2018 (Press Trust of India, 2018). Another concern besides the rising unemployment is quality of employment in terms of remuneration which is abysmally low in India. Two-thirds of those employed (including self-employed) earn far below the per capita income (Jagannathan, 2018). Thus a large number of employed people do not have proper jobs in the real sense. According to Jagannathan (2018), job implies a reasonably steady state of employment with a living wage (enough to meet food, housing education, health and social security needs), paid weekly or monthly; at least one weekly holiday; maybe a Provident Fund account; and an expectation that the employment will continue. Unfortunately, vast majority of Indian workers do not have jobs in real sense –they are either self-employed or casual or contract workers (Jagannathan, 2018). And the scenario is going to be further complicated as the potential working-age population in India is around 885 million at present which is likely to grow above 1 billion in a decade and remain at that level for nearly half a century (The Indian Express, 2017). National Skill Development Corporation (NSDC) provides sector-wise human resources requirements till 2022 (Table 1) which gives a fair idea about how the jobs scenario is likely to unfold in next three years and what the policy makers can learn from the projections. Table 1: Sector-wise Projection of Human Resources Requirements till 2022
Sl. No. Sector Required Human Resources in 2017 (in millions)
Required Human Resources in 2022 (in millions)
Difference in Human Resources requirements (2017—2022) (in millions)
1. Agriculture 229 215.5 —13.5
2. Building Construction and Real Estate
60.4 91 30.6
3. Retail 45.3 56 10.7
4. Logistics, Transportation and Warehouse
23 31.2 8.2
5. Textile and Clothing 18.3 25 6.7
6. Education and Skill Development
14.8 18.1 3.3
7. Handloom and Handicraft 14.1 18.8 4.7
8. Auto and Auto Components 12.8 15 2.2
9. Construction Material and Building Hardware
9.7 12.4 2.7
10. Private Security Services 8.9 12 3.1
11. Food Processing 8.8 11.6 2.8
12. Tourism, Hospitality and 9.7 14.6 4.9

Journal of Politics & Governance, Vol. 8, No. 3, March 2020
28
Travel
13. Domestic Help 7.8 11.1 3.3
14. Gems and Jewellery 6.1 9.4 3.3
15. Electronics and IT Hardware 6.2 9.6 3.4
16. Beauty and Wellness 7.4 15.6 8.2
17. Furniture and Furnishings 6.5 12.2 5.7
18. Healthcare 4.6 7.4 2.8
19. Leather and Leather Goods 4.4 7.1 2.7
20. IT and ITeS 3.8 5.3 1.5
21. Banking, Financial Services and Insurance
3.2 4.4 1.2
22. Telecommunications 2.9 5.7 2.8
23. Pharmaceuticals 2.6 4 1.4
24. Media and Entertainment 0.7 1.3 0.6
Total 510.8 614.2 103.4
[Source: Environmental Scan Report 2016, NSDC] CAUSES OF JOBLESS GROWTH Economy is doing fairly well if we take the GDP as an indicator. However, there is no concomitant expansion of employment opportunities for the people which are a natural corollary of the economic growth and prosperity. Lack of job opportunities is further compounded by job losses on account of technological advancement, automation, consolidation and rightsizing. As many as 1.5 million jobs, the author says, have been lost in India between 2016 and 2017 in the BFSI, IT and Telecom sectors due to consolidation (Madhavan, 2018). Further, in 2009-10 it took 31,846 employees to deliver $1 billion worth of exports in IT sector while in 2015-16 it needed just 16,055 employees (Madhavan, 2018). Hence, it appears that job losses contribute to jobless growth in a big way. The problem of jobs lies in the interplay of two surpluses –excess capital and excess labour (Jagannathan, 2018). Excess capital is generally invested in labour saving technologies and automation which address the issue of high wages in developed countries and archaic labour laws in developing countries. Without exception, Indian companies are also deploying robots as labour substitute. For example, Suzuki Motors India Ltd. is using 5000 robots in its Manesar and Gurugram plants (Raj, 2017) and Honda scooter plant in Vithalpur has got giant robots in theor shop floor bringing the number of workers down to 14 from earlier 72 (Das, 2017). According to a World Bank research, 69% jobs in India may be consumed by automation (World Bank, 2016). Apart from automation and robotization, a formidable reason behind jobless growth is reluctance of the corporate houses to employ people due to rigid labout laws in India. The country has failed to reap demographic dividends as a consequence of policy paralysis so far as labour reforms are concerned –sporadic changes in labour laws have been ineffectual in attracting foreign investors or provide an impetus to domestic entrepreneurs interested in expanding manufacturing facilities (Jha, 2014). Employment opportunities can be unlocked beyond all measures if the government makes necessary changes in the labour laws while balancing the interests of workers and employers. IMPERATIVES AND THE WAY FORWARD India urgently needs to draw and implement a comprehensive National Employment Policy on the lines of National Education Policy. A policy document will provide guiding principles on action

Journal of Politics & Governance, Vol. 8, No. 3, March 2020
29
agenda and resource allocation. While drafting, approving and implementing the National Employment Policy may take longer, it is worthwhile to heed action agenda for employment generation suggested by Jagannathan (2018):
Reform of factor markets: Land and labour constitute the totally unreformed part of Indian markets. Reforms in land markets will increase supplies of land, and labour reforms that make employment contract more flexible will make businesses more willing to hire workers.
Devolve more power to states, cities, and district- and village-level local bodies: The centre’s job is to create the right macroeconomic conditions to enable higher economic activity. But it is at the state, city and district levels that action to enable job creation can be most fruitful, whether it is to improve labour market information systems, skill building or implement reforms in factor markets that enable job creation.
Rebalance tax policies: Tax policies must remove the tilt against wage incomes as opposed to incomes generated from capital. This will inevitably make overuse of capital and automation less attractive in a labour-surplus economy without necessarily impacting the use of more technology to improve productivity.
Building a more agile education and skilling ecosystem: Policies need to emphasize the creation of new skilling and educational institutions that are able to capture skill-demand trends and quickly translate this into courses and certifications that are useful to job seekers and employers.
Replace current physical subsidy system with universal (or even targeted) income support systems: The direct benefits transfer scheme that shifts subsidies to cash needs to be extended to almost all subsidies by making them cash-based. This will create genuine new markets for food, fertilizer, and fuel among other things, and also free labour to be more mobile.
Focus on sectors with maximum employment elasticity: Sectors like construction, real estate, logistics, transport, apparel and leather products, furniture, education, and healthcare –apart from app-based services –must be given maximum support with minimum regulatory friction to generate jobs.
Scale up the apprentices scheme and legislate fixed period job contracts: If we raise apprenticeship opportunities about twenty fold, half our skilling and jobs problems will be over. Moreover, if the employers are enabled, by supportive legislation, to offer fixed-term contracts along with portable social security benefits, suddenly the bias towards capital intensive investment will start reducing. Millions of companies will formalize employment contract and create jobs.
Other steps that the government can take to promote employment opportunities and augment livelihoods include reducing the farm sector distress by way of periodic farm loan waivers based on exigencies such as famine, lack of rainfall, etc. while simultaneously improving other factors to improve agricultural yields as well as storage and fair price accruals to the farmers (Jha, Mohapatra and Lodha, 2019). Besides, the government also needs to reorient its focus on ‘Make in India’ initiative launched with much fanfare in the first stint of Narendra Modi as Prime Minister so as to open up job opportunities in the manufacturing sector (Jha, 2015). Further, in order to arrest the lower mood of the consumers in the wake of economic slowdown in India, the government needs to boost the capacity of the banks to lend more liberally. Rise in consumption will automatically cheer up the labour market by way of increased demands. However, that is a bit challenging in view of the capital adequacy norms of the banks as well as rising non-performing assets. However, the

Journal of Politics & Governance, Vol. 8, No. 3, March 2020
30
government can recapitalize the banks to foster overall improvement in economy as a matter of public policy (Mohapatra and Jha, 2018). CONCLUSION Let us accept it –jobless growth is here to stay in India for long. According to Jagannathan (2018), every 1% increase in GDP increases jobs by only 0.18% --theoretically if India achieves 10% growth for a considerable number of years, it would mean jobs will growat 1.8% annually –hardly enough to take care of the numbers entering the jobs market in ny year (about 12 million) and the possible increase in people seeking jobs, especially women who are underrepresented in the labour force. While jobs will not grow commensurate with GDP rates, the unemployment scenario is unlikely to be gloomy. General sense is that jobs in India will be created by micro, small and medium enterprises provided the government creates an enabling ecosystem for them. As India is moving towards a gig economy, neglecting the rights of workers might be counterproductive. While gig economy may create many more new jobs, the impact on productivity may not be significant if it comes at the cost of denying workers basic benefits like leave pay, sickness pay, and social security (Jagannathan, 2018). Of course the job scenario is challenging for people of India but there is always a ray of hope and that is the new policy thrusts of the government to reform education and create a positive eco system for skill development and entrepreneurship. REFERENCES Barman, A. (2019). Looking deeper into the report on jobless growth. The Economic Times, 31
January 2019, https://economictimes.indiatimes.com/blogs/folk-theorem/looking-deeper-into-the-report-on-jobless-growth/
Business Today. (2019). At 7.2%, India's unemployment rate in Feb worst in 29 months; labour force down 25.7 million: CMIE. Business Today, 6 March 2019, https://www.businesstoday.in/current/economy-politics/at-7-2-percent-india-unemployment-rate-feb-worst-29-months-labour-force-down-25-7-million-cmie/story/325083.html
Das, G. (2017). Going, going, gone: Automation can lead to unprecedented job cuts in India. Business Today, 18 June 2017, https://www.businesstoday.in/magazine/cover-story/going-going-gone/story/253260.html
Ghosh, P and Ghosh, S. K. (2018). Towards a payroll reporting in India. Indian Institute of Management, Bangalore, https://www.iimb.ac.in/sites/default/files/inline-files/Payroll%20in%20India-detailed_0.pdf
Jagannathan, R. (2018). Jobs crisis in India. New Delhi: Macmillan. Jha, S. (2014). Labour reforms in India: Issues & challenges. Journal of Management & Public Policy, 5
(2), 45-50. Jha, S. (2015). Make in India: The road ahead. FIIB Business Review, 4(2), 3-8, https://doi.org/10.1177/2455265820150201 Jha, S., Mohapatra, A. K., and Lodha, S. S. (2019). Political economy of farm loan waivers in India. FIIB
Business Review, 8 (2), 88-93, https://doi.org/10.1177/2319714519844128 Madhavan, N. (2018). The spectre of jobless growth. The Hindu Businessline, 22 November 2018,
https://www.thehindubusinessline.com/opinion/books/the-spectre-of-jobless-growth/article25419369.ece
Mohapatra, A. K., & Jha, S. (2018). Bank Recapitalization in India: A Critique of Public Policy Concerns. FIIB Business Review, 7(1), 10-15, https://doi.org/10.1177/2319714518766113
https://www.thehindubusinessline.com/opinion/books/the-spectre-of-jobless-growth/article25419369.ece
Journal of Politics & Governance, Vol. 8, No. 3, March 2020
31
Padmanabhan, A. (2019). Jobless growth 2.0: NDA govt’s and India’s challenge. Mint, 4 February 2019, https://www.livemint.com/opinion/columns/opinion-jobless-growth-2-0-nda-govt-s-and-india-s-challenge-1549215724446.html
Press Trust of India. (2018). Corporate India's job creation moderates to 3.8% in FY18 from 4.2% in FY17: Care Ratings report. First Post, 17 October 2018 https://www.firstpost.com/business/corporate-indias-job-creation-moderates-to-3-8-in-fy18-from-4-2-in-fy17-care-ratings-report-5397331.html
Raj, A. (2017). Robots sweep across Maruti Suzuki’s shop floor. Mint, 9 May 2017, https://www.livemint.com/Companies/0qexlea1C0MelXiAXcveOJ/Robots-sweep-across-Maruti-Suzukis-shop-floor.html
The Indian Express. (2017). India to lead next wave of economic growth with 1.08 billion working population by 2050: Report. The Indian Express, 19 September 2017, https://indianexpress.com/article/business/economy/india-to-lead-next-wave-of-economic-growth-with-1-08-billion-working-age-population-by-2050-deloitte-report-japan-china-4850841/
World Bank. (2016). Speech by World Bank President Jim Yong Kim: The World Bank Group’s mission: To end extreme poverty. http://www.worldbank.org/en/news/speech/2016/10/03/speech-by-world-bank-president-jim-yong-kim-the-world-bank-groups-mission-to-end-extreme-poverty