Journal of Plankton Research plankt.oxfordjournals · 2006 in the central part of the grid (see...
20
Journal of Plankton Research plankt.oxfordjournals.org J. Plankton Res. (2016) 00(00): 1–20. doi:10.1093/plankt/fbw037 Coastal-oceanic distribution gradient of coccolithophores and their role in the carbonate flux of the upwelling system off Concepción, Chile (36°S) EDUARDO MENSCHEL 1,2 *, HUMBERTO E. GONZÁLEZ 2,3 AND RICARDO GIESECKE 2,3,4 PROGRAMA DE POSTGRADO EN OCEANOGRAFÍA, DEPARTAMENTO DE OCEANOGRAFÍA, UNIVERSIDAD DE CONCEPCIÓN, CASILLA -C, CONCEPCIÓN, CHILE, CENTRO FONDAP-IDEAL, UNIVERSIDAD AUSTRAL DE CHILE, CASILLA , VALDIVIA Y PUNTA ARENAS, CHILE, INSTITUTO DE CIENCIAS MARINAS Y LIMNOLÓGICAS, UNIVERSIDAD AUSTRAL DE CHILE, CASILLA , VALDIVIA, CHILE AND CENTRO DE ESTUDIOS EN ECOLOGÍA Y LIMNOLOGÍA CHILE, GEOLIMNOS, CARELMAPU N° , VALDIVIA, CHILE *CORRESPONDING AUTHOR: [email protected] Received March 7, 2016; accepted April 22, 2016 Corresponding editor: Roger Harris The role of coccolithophores in the biogenic carbonate cycle was studied in the coastal upwelling zone off Concepción, Chile (36°S), and in adjacent oceanic waters during spring 2004. Coccolithophore abundance and diversity increased steadily from coastal to oceanic regions. The presence of an active coastal upwelling center clearly partitioned the study area into coastal, transition and two oceanic zones. Coccolithophores and diatoms showed an inverse relationship: coccolithophores with higher abundances in oceanic zones and diatoms more abundant in coastal zones. The suspended coccolithophore carbonate reached maximum values in the oceanic zones. Emiliania huxleyi was the only coccolithophore species observed in the coastal, upwelling-influenced region. The vertical export of coccolithophore carbonate offshore from Concepción (traps deployed between December 2005 and October 2006) was highly variable, with greatest flux during summer, dominated by cocco- liths and coccospheres of large species: Calcidiscus leptoporus and Helicosphaera carteri. The contribution of cocco- liths and coccospheres carried downward in appendicularian fecal pellets to total carbonate flux was low (1%); however, they contributed a major fraction to the coccolithophore carbonate export (mean of 27%). Our results highlight the relevance of large and less abundant coccolithophores and their coccoliths to the vertical flux of coccolithophore carbonate to the deep sea. KEYWORDS: coccolithophores; carbonate flux; upwelling front; Humboldt Current System available online at www.plankt.oxfordjournals.org © The Author 2016. Published by Oxford University Press. All rights reserved. For permissions, please email: [email protected] JPR Advance Access published May 26, 2016 at Universidad Austral de Chile on May 27, 2016 http://plankt.oxfordjournals.org/ Downloaded from
Transcript of Journal of Plankton Research plankt.oxfordjournals · 2006 in the central part of the grid (see...

Journal of
Plankton Research plankt.oxfordjournals.org
J. Plankton Res. (2016) 00(00): 1–20. doi:10.1093/plankt/fbw037
Coastal-oceanic distribution gradientof coccolithophores and their role in thecarbonate flux of the upwelling systemoff Concepción, Chile (36°S)EDUARDO MENSCHEL1,2*, HUMBERTO E. GONZÁLEZ2,3 AND RICARDO GIESECKE2,3,4
PROGRAMA DE POSTGRADO EN OCEANOGRAFÍA, DEPARTAMENTO DE OCEANOGRAFÍA, UNIVERSIDAD DE CONCEPCIÓN, CASILLA -C, CONCEPCIÓN, CHILE,CENTRO FONDAP-IDEAL, UNIVERSIDAD AUSTRAL DE CHILE, CASILLA , VALDIVIA Y PUNTA ARENAS, CHILE, INSTITUTO DE CIENCIAS MARINAS Y
LIMNOLÓGICAS, UNIVERSIDAD AUSTRAL DE CHILE, CASILLA , VALDIVIA, CHILE ANDCENTRO DE ESTUDIOS EN ECOLOGÍA Y LIMNOLOGÍA CHILE,
GEOLIMNOS, CARELMAPU N° , VALDIVIA, CHILE
*CORRESPONDING AUTHOR: [email protected]
Received March 7, 2016; accepted April 22, 2016
Corresponding editor: Roger Harris
The role of coccolithophores in the biogenic carbonate cycle was studied in the coastal upwelling zone offConcepción, Chile (36°S), and in adjacent oceanic waters during spring 2004. Coccolithophore abundance anddiversity increased steadily from coastal to oceanic regions. The presence of an active coastal upwelling centerclearly partitioned the study area into coastal, transition and two oceanic zones. Coccolithophores and diatomsshowed an inverse relationship: coccolithophores with higher abundances in oceanic zones and diatoms moreabundant in coastal zones. The suspended coccolithophore carbonate reached maximum values in the oceaniczones. Emiliania huxleyi was the only coccolithophore species observed in the coastal, upwelling-influencedregion. The vertical export of coccolithophore carbonate offshore from Concepción (traps deployed betweenDecember 2005 and October 2006) was highly variable, with greatest flux during summer, dominated by cocco-liths and coccospheres of large species: Calcidiscus leptoporus and Helicosphaera carteri. The contribution of cocco-liths and coccospheres carried downward in appendicularian fecal pellets to total carbonate flux was low (1%);however, they contributed a major fraction to the coccolithophore carbonate export (mean of 27%). Our resultshighlight the relevance of large and less abundant coccolithophores and their coccoliths to the vertical flux ofcoccolithophore carbonate to the deep sea.
KEYWORDS: coccolithophores; carbonate flux; upwelling front; Humboldt Current System
available online at www.plankt.oxfordjournals.org
© The Author 2016. Published by Oxford University Press. All rights reserved. For permissions, please email: [email protected]
JPR Advance Access published May 26, 2016 at U
niversidad Austral de C
hile on May 27, 2016
http://plankt.oxfordjournals.org/D
ownloaded from

INTRODUCTION
Coccolithophores represent ~10% of the global phyto-plankton biomass (Tyrrell and Young, 2009). They playan important role in climate and biogeochemical cycles(Westbroek et al., 1993; Winter et al., 2002), including thoseof sulfur (Malin and Steinke, 2004), carbon (Zondervan,2007; O’Brien et al., 2013) and carbonate (Sprengel et al.,2002). In several oceanic regions, coccolithophores contrib-ute between 60 and 80% of the vertical carbonate flux atdepths below 1000m (Honjo, 1977; Deuser and Ross,1989; Fabry, 1989). They represent up to 70% of the bur-ied carbonate in the oligotrophic gyres of the SouthAtlantic and up to 20% along the continental margins ofthat ocean (Baumann et al., 2004). Coccolithophores canbe found in the photic zones of all the oceans (Jordan andChamberlain, 1997), and large-scale abundance is com-mon in mid to high latitudes in both hemispheres (Brownand Yoder, 1994; Moore et al., 2012).
Coccolith plates detached from cells and suspendedin near-surface waters cause light to scatter, makingblooms visible in ocean color satellite imagery (Mooreet al., 2012). These blooms are usually dominated byEmiliania huxleyi and Gephyrocapsa spp. (Rhodes et al., 1995;Yang et al., 2001; Gravalosa et al., 2008), and E. huxleyi oftenconstitutes 40–90% of the total population (Mitchell-Innesand Winter, 1987; Chen et al., 2007).
The physical and chemical characteristics of seawatercontrolling the distribution and abundance of coccolitho-phores in the ocean have been widely discussed, althoughno consensus has been reached. Many reports indicatethat these organisms are more successful in stratified,oligotrophic (including low silicic acid and N:P ratio ~20),warm oceanic regions (Winter and Siesser, 1994; Haginoet al., 2000). However, other authors highlight the occur-rence of coccolithophores in more turbulent, nutrient-richareas (Moita et al., 2010; Guerreiro et al., 2013).
In oceanic regions of the Humboldt Current System(HCS) off Chile, the calcite flux to the deep sea consider-ably exceeds the organic carbon flux, with coccolitho-phores the second most important taxon after foraminifera(González et al., 2004). In coastal sediments off Chilebetween 22 and 45°S, the orders Isochrysidales andCoccolithales are dominant (Saavedra-Pellitero et al., 2010,2013).
The objectives of this study were (i) to determinethe abundance, community structure and key speciesof coccolithophores in the coastal and oceanic areasoff Concepción; (ii) to analyze the physical and chem-ical variables that best explain the distribution andabundance of these organisms; (iii) to assess the contri-bution of coccolithophores to the total vertical fluxof biogenic carbonate and to elucidate the potential
processes/factors involved in coccolithophore exportto the deep regions of the ocean.
Regional setting
The study area is located offshore of Concepción (36.5°S),one of the most biologically productive regions within thecentral HCS off Chile (Fossing et al., 1995; Montero et al.,2007). This active upwelling area contributes up to 50%of Chile’s (and 3% of the world’s) annual fishery landings(Mathiesen, 2012; Sernapesca, 2014). It experiencesconditions favorable for upwelling during spring andsummer, bringing to the surface Equatorial SubsurfaceWaters (ESSW) characterized by low dissolved oxygenconcentrations and high nutrient loads (Strub et al.,1998; Silva et al., 2009). Off Concepción, the continentalplatform is at its widest (40 km) and experiencesnumerous cyclonic (36°S–75°W) and anticyclonic (37.5°S–77.5°W) eddies and filaments that propagate from the coast,expanding the productive coastal zone (Hormazabalet al., 2004).In the coastal system, the freshwater discharge of two
large rivers (Itata: 240 m3 s−1 and Bio-Bio: 1000 m3 s−1)(Supplementary Fig. 1) affect the water stratification,silicate and organic/inorganic matter inputs (Saldíaset al., 2012). The outflows modify the biogeochemicalfluxes and trophic state of these coastal waters (Iriarteand González, 2004; Sánchez et al., 2008).During spring/summer, high levels of photosynthetic-
ally active radiation at 100–400Wm−2 s−1 (Hernándezet al., 2012) result from relatively reduced cloud cover(<50%) (Supplementary Fig. 2) and promote highphytoplankton biomass as estimated from chlorophyll-a(Chl-a) (>5 mg m−3). That stock is dominated by largediatom genera, particularly Skeletonema, Chaetoceros,Thalassiosira and Detonula in the study area (Gonzálezet al., 2007). During winter, lower biomass (<2 mg m−3)is dominated by pico- and nano-autotrophic fractions(Anabalón et al., 2007; Böttjer and Morales, 2007).Information on coccolithophores in the study area islimited, only based on data from surface sediments(Saavedra-Pellitero et al., 2010, 2013).
METHODS
General sampling
Sampling was carried out off Concepción from 14 to 24November 2004, onboard the R/V AGOR VidalGormáz on a 31-station grid between 35.5 and 38°Sand 72.7 and 77.7°W (Fig. 1). In addition, a sedimenttrap was deployed from December 2005 to October
JOURNAL OF PLANKTON RESEARCH j VOLUME j NUMBER j PAGES – j at U
niversidad Austral de C
hile on May 27, 2016
http://plankt.oxfordjournals.org/D
ownloaded from

2006 in the central part of the grid (see below andFig. 1). Hydrographic information was obtained using aSea Bird SBE-25 CTD, equipped with fluorescence sen-sors. Water samples for dissolved oxygen, nutrients andphytoplankton were taken at three depth levels (0, 20,50 m) with a rosette equipped with 24 10-L Niskin bot-tles. Oxygen was measured using the Winkler method(Carpenter, 1965), while nutrient concentrations (PO4,Si(OH)4, NO3) were analyzed with an auto analyzer(Alpkem flow solution IV) according to Strickland andParsons (1972).Ekman transport was estimated according to Wu
(1982) using daily average wind data from November2004, obtained from the meteorological Station ofCarriel Sur Airport. We used the weekly AVISO+ dataproducts of absolute geostrophic velocities from thestudy area (http://las.aviso.oceanobs.com/), and surfacewind data were obtained from monthly mean scatterom-eter data products for November 2014 (25 km reso-lution, QuikSCAT output).
Phytoplankton community compositionin the upper water column
The study focused on phytoplankton composition, andfluorescence data from a CTD were used to defineChl-a profiles. As most phytoplankton was distributed inthe upper 50 m of the water column, water samples(250 mL) were obtained from 0, 20 and 50 m, preservedin 3% sodium tetraborate–buffered formaldehyde sea-water and stored in the dark at room temperature.Subsamples (50 mL) were settled in Hydrobios chambersand examined with inverted microscopy following
standard methods (Utermöhl, 1958; Zeiss Axiovert 200).Phytoplankton taxa were counted and identified at mag-nifications of ×200–400 for diatoms and ×400–1000 forcoccolithophores. Diatoms were quantified by observingthe entire sedimentation chamber, or a fraction of it athigh abundance (e.g. transects or half the chamber).The taxa were identified with taxonomic keys and rele-vant supporting literature (Rivera, 1973; Tomas, 1997;Bown, 1998; Cros and Fortuño, 2002; Young et al.,2003). For coccolithophores, the same sample was eval-uated using a Scanning Electron Microscope (SEM,LEO-420) and Light Microscopy; the morphology andappearance of the species observed with these two methodswere compared (Supplementary Fig. 3). Phytoplanktondensities were integrated by trapezoidal integration of thethree estimates from the upper 50m to compare cell dens-ities among stations.
To calculate the number of cells per liter (Ct), weapplied the following formula:
= [ × × ] ( )CC F
V
1000, 1t
c
s
where Cc is the count of phytoplankton in the settlingchamber (e.g. number of coccospheres or diatomsobserved), F is the ratio between the total area and theobserved area of the settling chamber and Vs is the vol-ume of the analyzed sample (mL).
The quantification of coccolithophores was per-formed with preliminary observation at ×400 magnifica-tion to identify large (~10–30 µm) and less abundantcoccospheres (e.g. genera Helicosphaera, Calcidiscus) byexamining half or all of the sedimentation chamber.
Fig. 1. Grid showing the stations sampled during the oceanographic cruise (November 2004) off the coast of Concepción, Chile. The dots indi-cate water-sampling sites and the circle with the triangle marks the location of the sediment trap. Six transects (T1–T6) were carried out from thecoast westward. Each transect (T1–T6) is represented by a line on the dots.
E. MENSCHEL ET AL. j COCCOLITHOPHORES AND CARBONATE FLUX IN AN UPWELLING SYSTEM at U
niversidad Austral de C
hile on May 27, 2016
http://plankt.oxfordjournals.org/D
ownloaded from

Small coccospheres (<10 µm in diameter; e.g. generaEmiliania and Gephyrocapsa) were quantified by observing500–1500 visual fields distributed randomly over theentire sedimentation chamber at ×1000 magnification.After collection, some subsamples were prepared forobservation in the SEM by gentle filtration (0.2-µmfilter). These subsamples were then washed with degassedmineral water to eliminate salts (L. Cros, personalcommunication), dried and analyzed by SEM. The cal-cium carbonate contents of the coccoliths and cocco-spheres (CarC) for each species of coccolithophorewere determined using conversion factors according toYoung and Ziveri (2000), Broerse et al. (2000) andZiveri et al. (2000).
Sediment trap
Coccolithophore fluxesAn automated, cone-shaped sediment trap (SMT 230;Salzgitter Electronic, Kiel, Germany) was deployed at1000m depth on a mooring located 150 km offConcepción, over the open abyssal plain (37° 05′S, 74°50′W) where the maximum depth was 4500m (Fig. 1).The trap was located far from the continental slope toreduce the possible collection of sediment transported lat-erally from the continental shelf. Sample collection cupswere changed every 18 days from December 2005 toOctober 2006. Before deployment, each collection cupwas filled with a hypersaline NaCl–seawater solution (38–40 g kg−1, prepared with water collected at 2000m with1% (v/v) saturated HgCl2) (Lee et al., 1992). Aliquots of1.5 mL were poured into a settling chamber and ana-lyzed by light microscopy. All coccospheres and coccolithswere quantified on 20 to 200 visual fields, following theprocedure described for phytoplankton samples. Thetotal coccosphere and coccolith counts were converted toflux rates (number m−2 d−1) according to:
= [ × × ( ) × ] ( )N F V V A
T
COC /2c c t a tt
where COCt represents the flux rate of coccospheres orcoccoliths exported (number m−2 d−1); Nc the number ofcoccospheres or coccoliths counted in a fraction of thesettling chamber; Fc the fraction of the chamber areaanalyzed; Vt the total sample volume (mL); Va the sub-sample volume (mL) in the settling chamber; At the par-ticle collection area of the automatic sediment trap(m−2); and T the collecting interval (days). Fluxes of coc-cospheres and coccoliths (COCt) were reported asspecies-specific contributions to carbonate flux of cocco-lithophores by applying factors from the literature(Young and Ziveri, 2000).
POC analyses were done after removal of CaCO3
(with HCl 2 N), while for total particulate carbon (TPC)a fraction of the sample was filtered and dried at 50°C.Later, these samples were analyzed in a Carlo ErbaC/N-analyzer using acetanilide as a standard. We applieda stoichiometric balance formula (Eq. 3) for the finaldetermination of the total particulate carbonate (TCarex)in the sediment trap samples, according to Hebbeln et al.
(2000):
= [ − ] × ( )TCar TPC POC 8.333 3ex
where TPC is the total flux of particulate carbon (µgC m−2 d−1); POC is the flux of particulate organic car-bon (µg C m−2 d−1) and 8.333 is (molar mass ofCaCO3)/(atomic mass of carbon).
CaCO3 from appendicularian fecal pellets and tintinnidsA total of 65 undamaged appendicularian fecal pellets(70–340 µm in diameter) were removed from the sedi-ment trap samples using a stereomicroscope (Leica modelMZ6) at ×15 magnification and placed in a Petri dishwith 0.2 µm pre-filtered de-carbonated mineral water toprevent coccolith dissolution. Fecal pellets were washedfive to eight times with filtered de-carbonated water andphotographed. Photographs were processed using ImageJsoftware to estimate the fecal pellet volume.In order to analyze the composition of coccospheres
and coccoliths in the appendicularian fecal pellets, 1–10pellets (number depending on their size) were removedfrom the Petri dish and gently placed in 2.5-mL vialscontaining 2 mL of de-carbonated mineral water andsonicated at 50/60 Hz for 30 seconds followingBairbakhish et al. (1999). The contents of the vials wereplaced in sedimentation chambers and analyzed usingan inverted light microscope (×1000 magnification).Other samples were analyzed by SEM to corroboratethe light microscopy species identifications. Numbers ofcoccoliths per fecal pellet were estimated as follows:
⎡⎣ ⎤⎦=
∑ ×( )
( + )C
Sp F
V4t
n c
f
1
where Ct represents the total number of coccoliths percubic millimeter, Sp(n+1) the number of coccoliths of dif-ferent species observed in the analyzed chamber area; Fcthe ratio of the total chamber area to the analyzed areaand Vf the total volume (in mm3) of analyzed fecalpellets.All coccoliths and coccospheres removed from feces
were observed and counted at species-level and con-verted into CaCO3 using factors from Young and Ziveri
JOURNAL OF PLANKTON RESEARCH j VOLUME j NUMBER j PAGES – j at U
niversidad Austral de C
hile on May 27, 2016
http://plankt.oxfordjournals.org/D
ownloaded from

(2000). Thus, an average concentration of 0.056 mgCaCO3 per mm3 was determined for appendicularianfecal pellets (E. Menschel, unpublished data), and used toestimate the amount of CaCO3 in fecal pellets collectedby the sediment trap. The calcium carbonate contributedby coccoliths attached to the loricae of the three mostcommon tintinnid genera (Tintinnopsis, Codonellopsis andDictyocysta) was estimated using SEM by direct quantifica-tion of coccoliths according to Young and Ziveri (2000)and multiplied by 2, assuming that the faces of the loricaeagainst the cell membrane contained the same quantityof CaCO3.The carbonate of coccolithophores exported (CarCex)
and collected in the sediment trap was defined as thesum of coccoliths and coccospheres detached, adheredto loricae of tintinnids and inside the fecal pellets ofappendicularians.
Statistical analyses
Phytoplankton abundances at 0, 20 and 50 m weretested to determine significant differences in vertical dis-tribution using Kruskal–Wallis analysis. In addition, acluster analysis was carried out to explore similarities incoccolithophore compositions among stations using theBray–Curtis similarity coefficient calculated for root-transformed data (Clarke and Warwick, 2001). TheSIMPER routine (PRIMER v.6) was used to determineboth the percentages of similarity within each of thegroups identified by the cluster analysis and the dissimi-larities among those groups. The coccolithophore abun-dance was related to the physical–chemical variablesusing the statistical package BIO-ENV to determinewhich variable, or combination of variables, best explainsthe grouping of the stations. The BIOENV routineincluded a permutation test following the methodologyproposed by Clarke et al. (2008). The Shannon–Wienerdiversity index was calculated following Brower and Zar(1977) for the five longitudinal and latitudinal transects.Maps of the spatial distribution of physical (temperature),chemical (nutrients, salinity) and biological (coccolitho-phore and diatom abundances) data were plotted usingkriging interpolation. Possible latitudinal and vertical dif-ferences among coccolithophore distributions were testedusing the Mann–Whitney U test.
RESULTS
Hydrography
Offshore Ekman transport was highest at the beginning ofthe study (15–20 November 2004) due to meridional,
upwelling-favorable winds, which decreased toward theend of the campaign (21–24 November 2004) (Fig. 2A).In November, the wind pattern was predominantly north-ward, with maximum intensities (7.6–8.2 m s−1) in a
Fig. 2. (A) Ekman transport (kg m−1 s−1) during November 2004.Negative values represent active seaward transport and, thus,upwelling-favorable events during the sampling period (dashedsquare). (B) to (G) show the averaged distribution (0–50m) of physicaland chemical parameters in the study area and the dotted line indi-cates the 13°C isotherm and the oceanic border of the CoastalUpwelling Front (CUF). Temperature (B), salinity (C), dissolved oxy-gen (D) and macronutrient (E, F and G) off Concepción, Chile.
E. MENSCHEL ET AL. j COCCOLITHOPHORES AND CARBONATE FLUX IN AN UPWELLING SYSTEM at U
niversidad Austral de C
hile on May 27, 2016
http://plankt.oxfordjournals.org/D
ownloaded from

narrow band extending from the outer margin of the con-tinental slope seaward to 75.5°W (Supplementary Fig. 4).
The physicochemical variables of the upper 50m watercolumn (Fig. 2) were defined by a strong CUF boundedoffshore by the 13°C isotherm. This isotherm followed theedge of the continental shelf, roughly marked by the1000-m isobath (Fig. 1), but weakened to the south nearthe Lebu River (Fig. 2; see also Letelier et al., 2009).Average temperature and dissolved oxygen values werelow in the coastal region (11.9°C and 4.1 mL L−1) andhigh in the oceanic region (~15°C and >6mL L−1).Nutrient concentrations (NO3, PO4 and Si(OH)4) and sal-inity showed a pattern inverse to temperature, with highervalues in the coastal regions (25 µML−1, 2.7 µML−1,24 µML−1 and 34.6 g kg−1) than well offshore (0.6 µML−1,0.3 µML−1, 2.7 µML−1 and 33.3 g kg−1).
Phytoplankton community structure
The phytoplankton distribution indicated that diatomswere mostly concentrated in the coastal region, east ofthe CUF, ranging from 4 × 10⁶ to 2.2 × 10¹⁰ and aver-aging 1.6 × 10⁹ cells m−2 (González et al., 2007).Diatoms were closely associated with the coastal regionadjacent to the core of the upwelling, where nutrientconcentrations were highest and temperature and oxygenconcentrations lowest. Thalassiosira spp., Pseudo-nitzschia
spp., Skeletonema spp., Chaetoceros spp., Leptocylindrus spp.and Corethron spp. constituted 80% of the specimensobserved. More than 90% of the diatoms quantified werecollected in the coastal zone, and the remainder (<10%)were found in the oceanic region. Coccolithophores werepredominantly recorded west of the CUF (84%), with theremaining 16% (mostly E. huxleyi) found east of it. No dif-ferences were noted with latitude in the vertically inte-grated abundances of coccolithophores or among thediscrete depths (0, 20 and 50m) (U-Test, P > 0.05).
Coccolithophore abundance and distributionWe identified 18 coccolithophore species (Table I), whichshowed abundance gradients from coastal to oceanic sta-tions as well as among depths (Supplementary Table 1).Emiliania huxleyi (on average, 62%) and Gephyrocapsa muel-
lerae (18%) were the dominant forms within the studyarea. Less abundant taxa, including Coronosphaera mediterra-nea, Syracosphaera spp., Calcidiscus leptoporus, Syracosphaera pul-chra and Helicosphaera carteri, made up 14%, and theremaining 6% of specimens were rare.
Total integrated coccolithophore abundances averaged1.98 × 109 cells m−2, highest at oceanic Stations 7 and53 and lowest at coastal Stations 1 and 31 (Table II; Figs3 and 4). Slightly higher mean abundances were found at
20 m depth (46 × 103 cells L−1) than at the surface(30 × 103 cells L−1) or 50m depth (34 × 103 cells L−1),with increased numbers at the oceanic stations (Stations7, 17, 18, 25, 30 and 37).
Coastal-oceanic biogeographic zones
The coccolithophore community structure varied signifi-cantly along the coastal-ocean gradient, with increasingspecies diversity towards the oceanic regions (Fig. 5A). Acluster analysis of stations was performed based on thestock estimates for the most abundant coccolithophorespecies (>95% of the whole community). The resultingfour groups were named according to their coastal-oceanic positions: Z1 (east of the CUF), Z2-CUF (asso-ciated with the CUF), Z3 (west of the CUF), andZ2-Oceanic (west of Z3) (Fig. 6).
(i) Z1 consisted mostly of the coastal border offConcepción. Emiliania huxleyi was the most import-ant species in the coastal zone and the only cocco-lithophore found at the surface. That dominanceremained with depth to 50 m, but other species(probably from the genus Papposphaera, but notclearly identifiable) were observed in low abun-dance. Z1 showed an average similarity, per theSIMPER test, of 67%; E. huxleyi contributed 100%of this similarity. This zone was characterized by
Table I: Taxonomic list of coccolithophorespecies observed in coastal and oceanic regions,off Concepción, Chile.
Species
1. Calcidiscus leptoporus (Murray & Blackman, 1898) Loeblich & Tappan,1978
2. Calciosolenia murrayi Gran, 19123. Coccolithus pelagicus Kamptner, 19414. Coronosphaera mediterranea (Lohmann, 1902) Gaarder & Heimdal,
19775. Discosphaera tubifera (Murray & Blackman, 1898) Ostenfeld, 19006. Emiliania huxleyi (Lohmann, 1902) Hay & Mohler, 1967 var. huxleyi7. Florisphaera profunda Okada & Honjo, 19738. Gephyrocapsa muellerae Kamptner, 19439. Gephyrocapsa oceanica Kamptner, 1943
10. Helicosphaera carteri (Wallich, 1877) Kamptner, 195411. Pontosphaera syracusana Lohmann,190212. Palusphaera vandeli Lecal 1965 emend. Norris 198413. Rhabdosphaera clavigera Murray & Blackman, 189814. Scyphosphaera apsteinii Lohmann,190215. Syracosphaera anthos (Lohmann, 1912) Jordan & Young, 199016. Syracosphaera pulchra Lohmann, 190217. Syracosphaera prolongata Gran ex Lohmann,191318. Umbilicosphaera sibogae (Weber-van Bosse, 1901) Gaarder, 1970
var. sibogae
The taxa Papposphaera sp. and Syracosphaera spp. were included in theSupplementary Table 1.
JOURNAL OF PLANKTON RESEARCH j VOLUME j NUMBER j PAGES – j at U
niversidad Austral de C
hile on May 27, 2016
http://plankt.oxfordjournals.org/D
ownloaded from
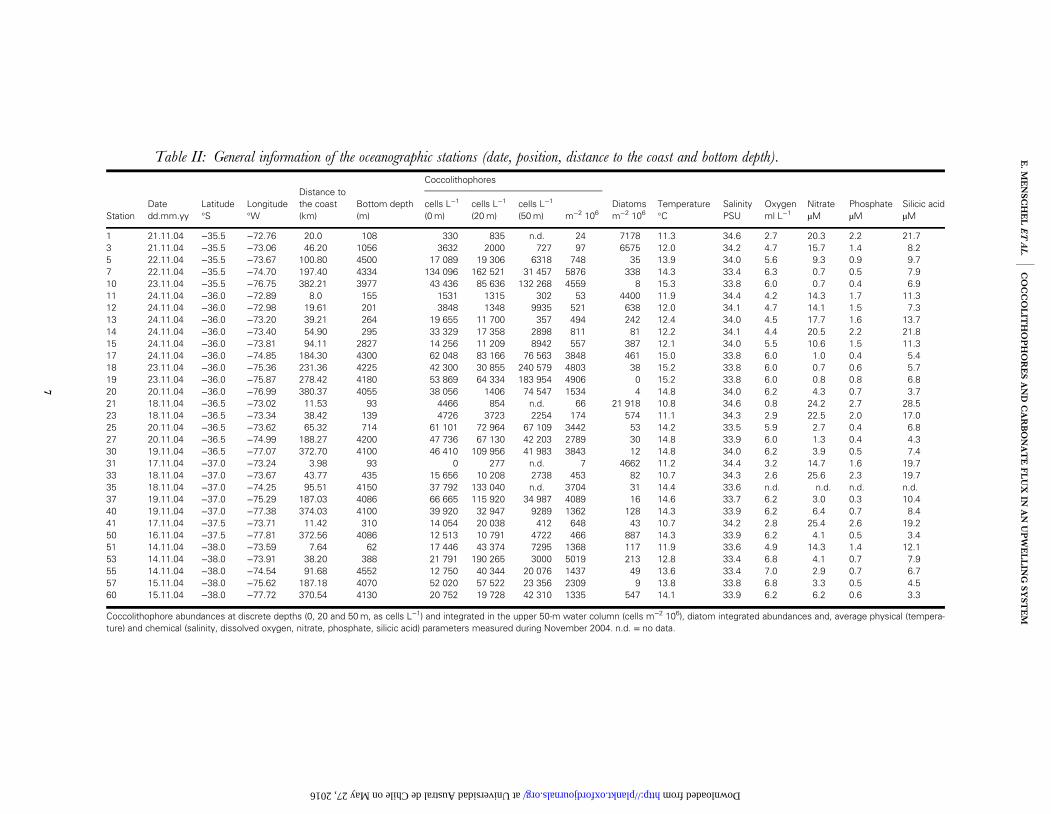
Table II: General information of the oceanographic stations (date, position, distance to the coast and bottom depth).
Distance tothe coast(km)
Coccolithophores
StationDatedd.mm.yy
Latitude°S
Longitude°W
Bottom depth(m)
cells L−1
(0m)cells L−1
(20m)cells L−1
(50m) m−2 106Diatomsm−2 106
Temperature°C
SalinityPSU
Oxygenml L−1
NitrateµM
PhosphateµM
Silicic acidµM
1 21.11.04 −35.5 −72.76 20.0 108 330 835 n.d. 24 7178 11.3 34.6 2.7 20.3 2.2 21.73 21.11.04 −35.5 −73.06 46.20 1056 3632 2000 727 97 6575 12.0 34.2 4.7 15.7 1.4 8.25 22.11.04 −35.5 −73.67 100.80 4500 17 089 19 306 6318 748 35 13.9 34.0 5.6 9.3 0.9 9.77 22.11.04 −35.5 −74.70 197.40 4334 134 096 162 521 31 457 5876 338 14.3 33.4 6.3 0.7 0.5 7.910 23.11.04 −35.5 −76.75 382.21 3977 43 436 85 636 132 268 4559 8 15.3 33.8 6.0 0.7 0.4 6.911 24.11.04 −36.0 −72.89 8.0 155 1531 1315 302 53 4400 11.9 34.4 4.2 14.3 1.7 11.312 24.11.04 −36.0 −72.98 19.61 201 3848 1348 9935 521 638 12.0 34.1 4.7 14.1 1.5 7.313 24.11.04 −36.0 −73.20 39.21 264 19 655 11 700 357 494 242 12.4 34.0 4.5 17.7 1.6 13.714 24.11.04 −36.0 −73.40 54.90 295 33 329 17 358 2898 811 81 12.2 34.1 4.4 20.5 2.2 21.815 24.11.04 −36.0 −73.81 94.11 2827 14 256 11 209 8942 557 387 12.1 34.0 5.5 10.6 1.5 11.317 24.11.04 −36.0 −74.85 184.30 4300 62 048 83 166 76 563 3848 461 15.0 33.8 6.0 1.0 0.4 5.418 23.11.04 −36.0 −75.36 231.36 4225 42 300 30 855 240 579 4803 38 15.2 33.8 6.0 0.7 0.6 5.719 23.11.04 −36.0 −75.87 278.42 4180 53 869 64 334 183 954 4906 0 15.2 33.8 6.0 0.8 0.8 6.820 20.11.04 −36.0 −76.99 380.37 4055 38 056 1406 74 547 1534 4 14.8 34.0 6.2 4.3 0.7 3.721 18.11.04 −36.5 −73.02 11.53 93 4466 854 n.d. 66 21 918 10.8 34.6 0.8 24.2 2.7 28.523 18.11.04 −36.5 −73.34 38.42 139 4726 3723 2254 174 574 11.1 34.3 2.9 22.5 2.0 17.025 20.11.04 −36.5 −73.62 65.32 714 61 101 72 964 67 109 3442 53 14.2 33.5 5.9 2.7 0.4 6.827 20.11.04 −36.5 −74.99 188.27 4200 47 736 67 130 42 203 2789 30 14.8 33.9 6.0 1.3 0.4 4.330 19.11.04 −36.5 −77.07 372.70 4100 46 410 109 956 41 983 3843 12 14.8 34.0 6.2 3.9 0.5 7.431 17.11.04 −37.0 −73.24 3.98 93 0 277 n.d. 7 4662 11.2 34.4 3.2 14.7 1.6 19.733 18.11.04 −37.0 −73.67 43.77 435 15 656 10 208 2738 453 82 10.7 34.3 2.6 25.6 2.3 19.735 18.11.04 −37.0 −74.25 95.51 4150 37 792 133 040 n.d. 3704 31 14.4 33.6 n.d. n.d. n.d. n.d.37 19.11.04 −37.0 −75.29 187.03 4086 66 665 115 920 34 987 4089 16 14.6 33.7 6.2 3.0 0.3 10.440 19.11.04 −37.0 −77.38 374.03 4100 39 920 32 947 9289 1362 128 14.3 33.9 6.2 6.4 0.7 8.441 17.11.04 −37.5 −73.71 11.42 310 14 054 20 038 412 648 43 10.7 34.2 2.8 25.4 2.6 19.250 16.11.04 −37.5 −77.81 372.56 4086 12 513 10 791 4722 466 887 14.3 33.9 6.2 4.1 0.5 3.451 14.11.04 −38.0 −73.59 7.64 62 17 446 43 374 7295 1368 117 11.9 33.6 4.9 14.3 1.4 12.153 14.11.04 −38.0 −73.91 38.20 388 21 791 190 265 3000 5019 213 12.8 33.4 6.8 4.1 0.7 7.955 14.11.04 −38.0 −74.54 91.68 4552 12 750 40 344 20 076 1437 49 13.6 33.4 7.0 2.9 0.7 6.757 15.11.04 −38.0 −75.62 187.18 4070 52 020 57 522 23 356 2309 9 13.8 33.8 6.8 3.3 0.5 4.560 15.11.04 −38.0 −77.72 370.54 4130 20 752 19 728 42 310 1335 547 14.1 33.9 6.2 6.2 0.6 3.3
Coccolithophore abundances at discrete depths (0, 20 and 50m, as cells L−1) and integrated in the upper 50-m water column (cells m−2 106), diatom integrated abundances and, average physical (tempera-ture) and chemical (salinity, dissolved oxygen, nitrate, phosphate, silicic acid) parameters measured during November 2004. n.d. = no data.
E.M
ENSCHELETAL.j
COCCOLIT
HOPHORESAND
CARBONATEFLUX
INAN
UPWELLIN
GSYSTEM
at Universidad Austral de Chile on May 27, 2016 http://plankt.oxfordjournals.org/ Downloaded from
active upwelling with high nutrient concentrations,low temperature and oxygen and relatively highsalinity (Fig. 2 and 6) (Table III).
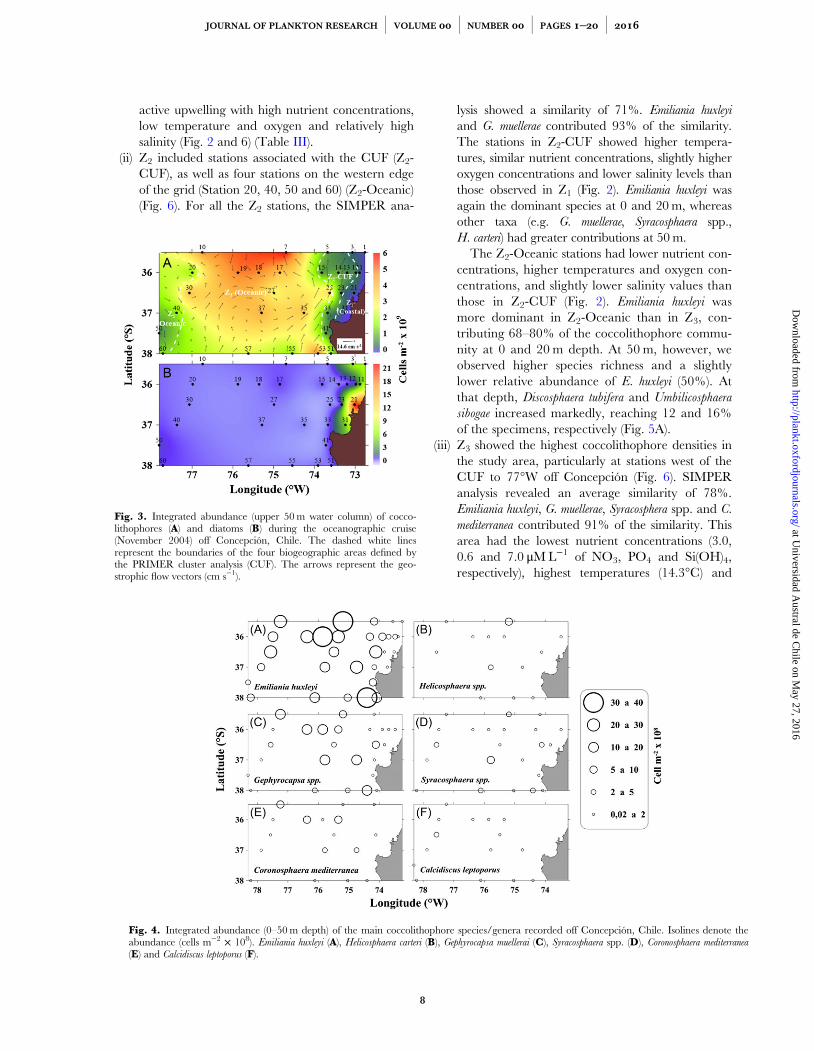
(ii) Z2 included stations associated with the CUF (Z2-CUF), as well as four stations on the western edgeof the grid (Station 20, 40, 50 and 60) (Z2-Oceanic)(Fig. 6). For all the Z2 stations, the SIMPER ana-
lysis showed a similarity of 71%. Emiliania huxleyi
and G. muellerae contributed 93% of the similarity.The stations in Z2-CUF showed higher tempera-tures, similar nutrient concentrations, slightly higheroxygen concentrations and lower salinity levels thanthose observed in Z1 (Fig. 2). Emiliania huxleyi wasagain the dominant species at 0 and 20m, whereasother taxa (e.g. G. muellerae, Syracosphaera spp.,H. carteri) had greater contributions at 50 m.
The Z2-Oceanic stations had lower nutrient con-centrations, higher temperatures and oxygen con-centrations, and slightly lower salinity values thanthose in Z2-CUF (Fig. 2). Emiliania huxleyi wasmore dominant in Z2-Oceanic than in Z3, con-tributing 68–80% of the coccolithophore commu-nity at 0 and 20 m depth. At 50 m, however, weobserved higher species richness and a slightlylower relative abundance of E. huxleyi (50%). Atthat depth, Discosphaera tubifera and Umbilicosphaera
sibogae increased markedly, reaching 12 and 16%of the specimens, respectively (Fig. 5A).
(iii) Z3 showed the highest coccolithophore densities inthe study area, particularly at stations west of theCUF to 77°W off Concepción (Fig. 6). SIMPERanalysis revealed an average similarity of 78%.Emiliania huxleyi, G. muellerae, Syracosphera spp. and C.
mediterranea contributed 91% of the similarity. Thisarea had the lowest nutrient concentrations (3.0,0.6 and 7.0 μML−1 of NO3, PO4 and Si(OH)4,respectively), highest temperatures (14.3°C) and
Fig. 3. Integrated abundance (upper 50 m water column) of cocco-lithophores (A) and diatoms (B) during the oceanographic cruise(November 2004) off Concepción, Chile. The dashed white linesrepresent the boundaries of the four biogeographic areas defined bythe PRIMER cluster analysis (CUF). The arrows represent the geo-strophic flow vectors (cm s−1).
Fig. 4. Integrated abundance (0–50m depth) of the main coccolithophore species/genera recorded off Concepción, Chile. Isolines denote theabundance (cells m−2 × 10⁸). Emiliania huxleyi (A), Helicosphaera carteri (B), Gephyrocapsa muellerai (C), Syracosphaera spp. (D), Coronosphaera mediterranea(E) and Calcidiscus leptoporus (F).
JOURNAL OF PLANKTON RESEARCH j VOLUME j NUMBER j PAGES – j at U
niversidad Austral de C
hile on May 27, 2016
http://plankt.oxfordjournals.org/D
ownloaded from

oxygen concentrations (6.2 mL L−1), and the lowestsalinity (33.7 g kg−1). The dominance of E. huxleyidecreased, and other species became more con-spicuous including G. muellerae (15–20%) and, to alesser extent, H. carteri and Syracosphaera spp. (1–3%). The oceanic zone (Z3) displayed an inversepattern (compared with Z1), with increased relativeabundance of E. huxleyi at depth (Fig. 5A).
The analysis of rank correlation (BIO-ENV) for theintegrated abundances of all coccolithophore speciesand physico-chemical variables revealed that two combi-nations, temperature-salinity (pw = 0.689; P < 0.05) andsalinity-nitrate (pw = 0.675; P < 0.05), explain the spatialvariability of coccolithophores in the study area reason-ably well (Table IV).
The Shannon–Wiener diversity index, calculated forfive transects and arranged along longitudinal gradi-ents, showed increased coccolithophore species diver-sity from the coast toward the ocean (Fig. 7), whereasthe latitudinal range showed no significant differencesin diversity.
Particulate calcium carbonate in coccolitho-phores (CarC) in the upper water column
Integrated average concentrations of CarC were 378 mgCaCO3 m−2. Values were highest at oceanic stations 7,30 and 37 (2700, 1100 and 1200 mg CaCO3 m−2,respectively), and lowest at coastal stations 1 and 31(1.1 and 0.3 mg CaCO3 m
−2, respectively) (Figs. 8A, B).Coccolithophore taxa contributing most (98%) to thetotal CarC off Concepción were H. carteri, C. leptoporus,E. huxleyi, G. muellerae, C. mediterranea, Syracosphera spp.,Rhabdosphaera clavigera and U. sibogae (Fig. 8B).
Estimated concentrations of CarC at the surface ran-ged from 0 to 47.7 µg CaCO3 L−1 (average 5.7 µgCaCO3 L−1). Oceanic Stations 7 and 37 showed thegreatest surface concentrations of CarC (42 and 25 µgCaCO3 L−1), more than 40% of the total CaCO3 ofthe surface. In contrast, the concentrations were lower(< 0.24 µg CaCO3 L−1) at the coastal stations north ofPunta Lavapie (Stations 1, 3, 11, 12, 21, 23 and 31).Five taxa constituted 94.5% of the total biogenic car-bonate in surface layers of the study area: H. carteri
(38.7%), E. huxleyi (17.3%), C. mediterranea (15.4%), C. lep-toporus (12.8%) and G. muellerae (10.3%), while S. pulchra,
R. clavigera, Gephyrocapsa oceanica, U. sibogae, D. tubifera andSyracosphaera spp. made up of the remaining 5.5%.
At 20 m depth, the CarC varied between 0.01 and89 μg CaCO3 L−1, (averaging 10.1 μg CaCO3 L−1).Concentrations were highest at the oceanic Stations 7,10, 17 and 25 representing 50% of all the CarC at thisdepth, whereas Stations 1, 3, 12, 13, 14, 15, 20, 21, 23,33, 37 and 55 only contributed < 1.5% of the CarC forthe 20 m of depth. The major contributions were fromH. carteri (46%), C. leptoporus (17%), E. huxleyi (13%),G. muellerae (10%) and C. mediterranea (8%), the remaining6% came from S. pulchra, R. clavigera, Coccolithus sp.,D. tubifera and Syracosphaera spp.
At 50 m depth, the CarC ranged from 0 to 26.7 μgCaCO3 L−1 (averaging 4.9 μg CaCO3 L−1). Highestestimates were at Oceanic Stations 10, 18, 19, 20, 25,30, 37 and 60, constituting 74% of the CarC at 50 mdepth. The most important species at this depth wereC. leptoporus (21.7%), E. huxleyi (21.1%), H. carteri (20.9%),G. muellerae (18.7%), R. clavigera (5.9%), U. sibogae (4.8%)and Scyphosphaera apsteinii (2%). The contributions of inte-grated CarC were lowest in Z1 (0.1%) and highest in
Fig. 5. (A) Vertical distribution of the main species (>85% of pooledabundance) recorded in the study area. The missing portion of the piegraph denotes all species pooled representing >5% of the total cocco-lithophore abundance and is split by a vertical bar. The item “others”includes Coccolithus pelagicus, Calciosolenia murrayi, Florisphaera profunda,Gephyrocapsa oceanica, Papposphaera sp., Pontosphaera syracusana, Palusphaera van-delii, Rhabdosphaera clavigera, Syphosphaera apsteinii, Syracosphaera anthos and S.prolongata (in Z1, 20 and 50m depth, “others” included only Papposphaerasp.). The biogeographical zones Z1, Z2-CUF, Z3 and Z2-oceanic are alsoshown. (B) Conceptual model of the main physical mesoscale processesoff Concepción, (from Morales et al., 2010 and Letelier et al., 2009). Thedashed lines represent the geostrophic currents, while CG: clockwise gyre(white arrows) and AG: anti-clockwise gyre (black arrows) denotes thecharacteristic and persistent mesoscale gyres in the study area. UPZ:denotes a narrow upwelling coastal zone (shown by the black zone).
E. MENSCHEL ET AL. j COCCOLITHOPHORES AND CARBONATE FLUX IN AN UPWELLING SYSTEM at U
niversidad Austral de C
hile on May 27, 2016
http://plankt.oxfordjournals.org/D
ownloaded from
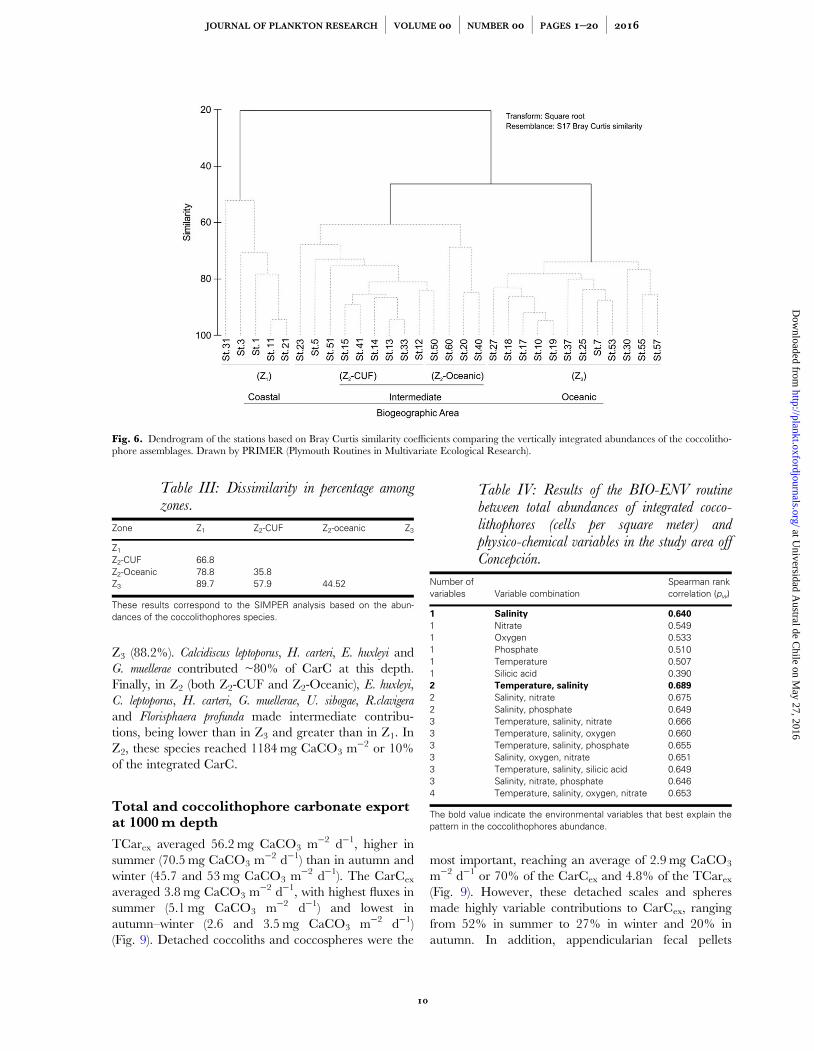
Z3 (88.2%). Calcidiscus leptoporus, H. carteri, E. huxleyi andG. muellerae contributed ~80% of CarC at this depth.Finally, in Z2 (both Z2-CUF and Z2-Oceanic), E. huxleyi,C. leptoporus, H. carteri, G. muellerae, U. sibogae, R.clavigeraand Florisphaera profunda made intermediate contribu-tions, being lower than in Z3 and greater than in Z1. InZ2, these species reached 1184 mg CaCO3 m
−2 or 10%of the integrated CarC.
Total and coccolithophore carbonate exportat 1000m depth
TCarex averaged 56.2 mg CaCO3 m−2 d−1, higher insummer (70.5 mg CaCO3 m
−2 d−1) than in autumn andwinter (45.7 and 53 mg CaCO3 m−2 d−1). The CarCex
averaged 3.8 mg CaCO3 m−2 d−1, with highest fluxes in
summer (5.1 mg CaCO3 m−2 d−1) and lowest inautumn–winter (2.6 and 3.5 mg CaCO3 m−2 d−1)(Fig. 9). Detached coccoliths and coccospheres were the
most important, reaching an average of 2.9 mg CaCO3
m−2 d−1 or 70% of the CarCex and 4.8% of the TCarex(Fig. 9). However, these detached scales and spheresmade highly variable contributions to CarCex, rangingfrom 52% in summer to 27% in winter and 20% inautumn. In addition, appendicularian fecal pellets
Fig. 6. Dendrogram of the stations based on Bray Curtis similarity coefficients comparing the vertically integrated abundances of the coccolitho-phore assemblages. Drawn by PRIMER (Plymouth Routines in Multivariate Ecological Research).
Table IV: Results of the BIO-ENV routinebetween total abundances of integrated cocco-lithophores (cells per square meter) andphysico-chemical variables in the study area offConcepción.
Number ofvariables Variable combination
Spearman rankcorrelation (pw)
1 Salinity 0.6401 Nitrate 0.5491 Oxygen 0.5331 Phosphate 0.5101 Temperature 0.5071 Silicic acid 0.3902 Temperature, salinity 0.6892 Salinity, nitrate 0.6752 Salinity, phosphate 0.6493 Temperature, salinity, nitrate 0.6663 Temperature, salinity, oxygen 0.6603 Temperature, salinity, phosphate 0.6553 Salinity, oxygen, nitrate 0.6513 Temperature, salinity, silicic acid 0.6493 Salinity, nitrate, phosphate 0.6464 Temperature, salinity, oxygen, nitrate 0.653
The bold value indicate the environmental variables that best explain thepattern in the coccolithophores abundance.
Table III: Dissimilarity in percentage amongzones.
Zone Z1 Z2-CUF Z2-oceanic Z3
Z1Z2-CUF 66.8Z2-Oceanic 78.8 35.8Z3 89.7 57.9 44.52
These results correspond to the SIMPER analysis based on the abun-dances of the coccolithophores species.
JOURNAL OF PLANKTON RESEARCH j VOLUME j NUMBER j PAGES – j at U
niversidad Austral de C
hile on May 27, 2016
http://plankt.oxfordjournals.org/D
ownloaded from

contributed 27% (0.8 mg CaCO3 m−2 d−1) of theCarCex or 1.2% of the TCarex.We recorded 11 coccolithophore genera (considering
both coccoliths and coccospheres) in the sediment trapsamples. Emiliania huxleyi was the most important (50.6%of the coccoliths exported or 46 × 106 coccoliths ofE. huxleyi m−2 d−1) followed by G. muellerae (19.5%),C. leptoporus (14%), H. carteri (11.2%), Syracosphaera spp.(2.6%), Coccolithus sp. (0.7%) and U. sibogae (0.6%), andfinally as a group P. syracusana, Umbellosphaera sp., R. clavigeraand S. apsteinii (0.8% and 0.7 × 10⁶ coccolith m−2 d−1).The average CaCO3 exported by these species followeda contrasting pattern. Helicosphaera carteri contributedmost to the export of CaCO3 as coccoliths and cocco-spheres (42% or 1.3 mg CaCO3 m−2 d−1), followed byC. leptoporus (40%), G. muellerae (4.5%), Coccolithus sp. (4%),E. huxleyi (3.4%) and P. syracusana (1.2%). The remaining4.9% was shared among Syracosphaera spp., U. sibogae,R. clavigera, S. apsteinii and undetermined coccoliths.Tintinnid contributions were minor, both to the total
carbonate from coccolithophores (2.8%) and to the totalexported carbonate (0.1%). The loricate ciliate,Dictyocysta spp., contributed on average to 48% of thetotal carbonate exported by tintinnids, followed byCodonellopsis spp. (26.5%) and Tintinnopsis spp. (25.5%).
DISCUSSION
Phytoplankton community structure
Diatoms were mainly abundant in a relatively narrowband close to the coast, largely covering Z1, whereas the
coccolithophores occupied the more oceanic regions(mainly Z3). In Z1, the high diatom density was domi-nated by the genera Skeletonema and Thalassiosira, whichtogether contributed >80% of the standing stock of dia-toms. This situation can be partially explained by thehigh kinetic energy of the coastal area that creates a tur-bulent environment in which coastal upwelling brings
Fig. 7. Shannon–Wiener diversity index for coccolithophores in a coastal–ocean gradient off Concepción, Chile along the transects T1–T6(Figure 3). The diversity is given for each transect (T1–T6) with the most coastal (Z1) and oceanic (Z2-oceanic) biogeographical zones located atthe left and right sides, respectively. In addition, the station numbers along each transect are included for reference.
Fig. 8. (A) Integrated CarC (0–50m depth) and the contribution ofthe most abundant coccolithophore species/genera recorded offConcepción, Chile (B–G).
E. MENSCHEL ET AL. j COCCOLITHOPHORES AND CARBONATE FLUX IN AN UPWELLING SYSTEM at U
niversidad Austral de C
hile on May 27, 2016
http://plankt.oxfordjournals.org/D
ownloaded from

ESSW to the surface, fertilizing the photic zone with highnutrient concentrations (Fig. 2D). Phytoplankton commu-nity structure is mainly regulated by nutrient concentra-tions and turbulence (Margalef, 1978). Chain-formingdiatoms are r-strategists able to make efficient use ofhighly dynamic and nutrient-rich coastal environments.
Z2-Oceanic showed a second increase in diatom abun-dance, which was one order of magnitude higher thanin Z3. In Z2-Oceanic, the NO3:Si(OH)4 ratio was >1,whereas in Z3 it was <0.5, suggesting a more efficientsilicic acid uptake in Z2-Oceanic, where Pseudo-nitzschia
spp. predominated, reaching up to 80% dominance in
0,0
0,4
0,8
Gephyrocapsa spp.E.huxleyi Coccolithus sp.
Date (day, month, year)
20.12
.05
07.01
.06
25.01
.06
13.02
.06
03.03
.06
21.03
.06
08.04
.06
27.04
.06
15.05
.06
02.06
.06
20.06
.06
09.07
.06
27.07
.06
14.08
.06
01.09
.06
20.09
.06
Coc
cosp
here
(m
–2 d–1
x 10
6 )
0,0
0,5
1,0
1,5
Coc
colit
h (m
–2 d–1
x 10
6 )
0
40
80
120
mg
CaC
O3
m–2
d–1
0
4
8 C. leptoporus Helicosphaera sp.
0
5
10
15
Coccoliths + CoccospheresPellet appendicularians
A
B
C
G
Con
trib
utio
n (%
)
05101520
Summer Autumn Winter
0
1
2
30
40
80
120
D
E
F
Fig. 9. Coccolithophore and CaCO3 flux rates at the mooring site off Concepción, Chile. (A) Vertical flux of CaCO3 exported as total coccoliths+ coccosphere (black bars) and appendicularian pellets (white bars), the two most important components observed in the sediment trap samples.The dotted and dashed lines represent the pooled contribution (in percentage) and average of these two components to the total CaCO3 flux. (B)and (C) show the coccoliths + coccosphere component (black bars in A) split according to the carbonate exported by each of the five most abun-dant species found in sediment trap samples. (D) (E) and (F) show the export flux rate of detached plates (106 plates m−2 d−1) for the same fivetaxa. The bottom panel (G) denotes the coccosphere flux rate for the most important taxa recorded in this study, where the x-axis shows the sea-sons and the deployed time of the sediment trap (December 2005 and September 2006).
JOURNAL OF PLANKTON RESEARCH j VOLUME j NUMBER j PAGES – j at U
niversidad Austral de C
hile on May 27, 2016
http://plankt.oxfordjournals.org/D
ownloaded from

the diatom standing stock. In contrast, coccolitho-phores reached their peak abundances in the moreoligotrophic zones (Z3), where NO3 and PO4 concen-trations (~4 and 1.7 μML−1) were lower and sea sur-face temperatures 2°C were higher on average than inthe CUF.The presence of large vacuoles in diatoms (~35% of
the cell volume) enables them to store nitrate andphosphate (Falkowski et al., 2004) and to proliferatein highly variable environments, such as coastalupwelling areas where nutrient fertilization (upwelling)alternates with nutrient-poor periods (relaxation).In contrast, coccolithophores (devoid of vacuoles) aremore successful in resource-depleted waters due totheir lower minimum limiting nutrient requirements(partially due to their high surface-to-volume ratio
compared to most diatoms), a difference that likelyselects between these two functional groups for amatch to habitat conditions (Tozzi et al., 2004).
Coccolithophores: spatial abundance andphysico-chemical parameters
Coccolithophore abundance was highly variable, albeitconsistent with the ranges reported in the literature forthe HCS (Beaufort et al., 2008), the equatorial and trop-ical Pacific (Balch and Kilpatrick, 1996) and otherregions (Table V). Emiliania huxleyi and G. muellerae werelargely dominant throughout our study area, constitut-ing >70% of the coccolithophore community. The neardominance of these two species in surface waters holdstrue for the rest of the world oceans (Langer et al.,
Table V: Comparisons of dominant coccolithophore species abundance within the photic zone (uppermost50 m) and sampling times recorded in other coastal upwelling and oceanic systems of the world oceans.
Location Dominant species Abundance (cells L−1) Sampling time Sources
Coastal upwelling systemsNazaré Canyon, Portugal, (39.5°N, 10°W) E. huxleyi,
Gephyrocapsa spp.6000 to 100 000 March 2010 Guerreiro et al.
(2013)Lisbon bay, Portugal (38.7°N, 9.2°W) E. huxleyi 156 000 July–May 2005 Silva et al. (2008)Eastern Indian Ocean, south west Sumatra andJava (8°S, 106°E)
G. oceanica,U. irregularis
9000 to 22 000 January–February1999
Andruleit, (2007)
South Atlantic Ocean, Cape Town to SouthSandwich Island (34°S, 18°E)
E. huxleyi ~25 000 to 200 000 22 February to 01March 1995
Eynaud et al.(1999)
Bay, Northern Benguela E.huxleyi, Syracosphaeraepigrosa
10 000 to 278 000 June 1993 Giraudeau andBailey (1995)
Northeastern Taiwan 23.8°N, 122°E (St. 34) E. huxleyi, U. irregularis,U. tenuis
19 000 16 July 1996 Yang et al. (2001)
Perú/Chile Current Area (5°S, 85°W; 20°S,75°W) E.huxleyi 100 to 240 000 February 1964 Hagino and Okada(2006)
Humboldt Current, off Concepción (36.5°S,73°W; Z1)
E. huxleyi 0 to 4466 November 2004 This study
Oceanic systemsEquatorial Pacific (along 140°W) E. huxleyi 0 to 60 000 August–
September 1992Balch andKilpatrick, 1996
Humboldt Current, off Valparaíso (33°S, 78°W) E. huxleyi,Gephyrocapsa spp.,Crenalithus spp.
~20 000 to 240 000 26 October to 11December 2004
Beaufort et al.(2008)
Humboldt Current, off Valparaíso (33°S,90; 10°S–140°W)
E. huxleyi,Gephyrocapsa spp.,Crenalithus spp.
~1–10000 26 October to 11December 2004
Beaufort et al.(2008)
Nordic Seas (55°S, 20°W–70°S, 10°E) E. huxleyi, C. pelagicus <1000 to >500 000 July–October1987–1995
Baumann et al.(2000)
St. ALOHA, Hawai (22.7°N, 158°W) E. huxleyi, U. irregularis <30 000 January 1994 toAugust 1996.
Cortés et al. (2001)
Northern South China Sea (18°N, 114°E) E. huxleyi, G. oceanica,G. ericsonii
2000 to 127 000 March 2002–July2003
Lee Chen et al.(2007)
Northeastern Taiwan 25.5°N, 125°E (St. 17) Calicasphaera blokii,G. oceanica, P. vandeli,U. irregularis, U. tenuis
14 400 19 July 1996 Yang et al. (2001)
Pacific sector, Southern Ocean (54°, 37 S; 80°,09W), St PS75/034-3
E. huxleyi 30 000 to 61 000 27 November2009–27 January2010
Saavedra-Pelliteroet al. (2014)
Humboldt Current, off Concepción (Z3) E. huxleyi, G. muellerae,C. mediterranea,Syracosphaera spp.,H. carteri
12 750 to 134 096 November 2004 This study
E. MENSCHEL ET AL. j COCCOLITHOPHORES AND CARBONATE FLUX IN AN UPWELLING SYSTEM at U
niversidad Austral de C
hile on May 27, 2016
http://plankt.oxfordjournals.org/D
ownloaded from

2009). Other taxa, such as C. mediterranea, Syracosphaeraspp., C. leptoporus and H. carteri, were recorded in lowerabundances and associated with the western sector ofthe CUF (Fig. 5A)
The coastal zone was directly influenced by activeupwelling of cold, nutrient-rich, oxygen-depleted ESSW(Alheit and Bernal, 1993). This area, where stationsclustered as Z1, showed the highest diatom densities(~90% of the geographically integrated diatom abun-dance) and lowest coccolithophore densities (0.4% of theintegrated coccolithophore abundance). This region waslargely dominated by E. huxleyi, a species shown to bemore resilient to environmental changes in salinity (18–41 g kg−1), temperature (1–31°C), turbulence, light (72to >1000 µmol m−2 s−1) and nutrients than other cocco-lithophores (Brand, 1994; Zondervan et al., 2002;Guerreiro et al., 2013). These characteristics are directlyrelated to its high genotypic plasticity (Bollmann, 1997).Its ability to reproduce sexually probably is instrumentalin maintaining this genetic diversity (Iglesias-Rodriguezet al., 2006), allowing it to adapt and succeed in stronglyvariable environments such as upwelling systems.
Nutrient concentrations in Z2-CUF were similar tothose observed in Z1. However, the coccolithophoredensity, predominantly E. huxleyi (89%), was one orderof magnitude higher. Moving seaward from Z2-CUF,diversity increased steadily (Fig. 7), most likely due tothe stabilization of the water column and reduced levelsof silicate (from 18 µM in Z1 to 14 µM in Z2-CUF); con-ditions shown to promote a decrease in diatoms and anincrease in coccolithophores (Holligan et al., 1993).However, the slight increase in temperature (0.5°C)with respect to Z1 could be linked to coastward trans-port of warm water (Hormazabal et al., 2004).
Z2-Oceanic, in turn, resulted from the similarity offour oceanic stations adjacent to the coastal Z2-CUF, inan “oceanographically modified” zone west of 77°W.These waters produced a disruption in the otherwiseclear coastal-to-ocean pattern (Fig. 5B). It is likely thatZ2-Oceanic is related to the propagation of ocean-wardgeostrophic flow parallel to Punta Lavapié that turns tothe northwest at ~36°S out to ~77°W, causing advec-tion of a coastal water parcel into oceanic longitudes(Letelier et al., 2009). In addition, these mesoscale fea-tures off Concepción have been shown to transport attimes the whole phytoplankton community (includingcoccolithophores), together with a coastal signature interms of nutrients and organic/inorganic matter,beyond 400 km offshore (Morales et al., 2010).
Coccolithophore abundances were highest in Z3,particularly in the band between 74 and 77°W, whichwere characterized by increasing temperatures andmore dissolved oxygen, a marked decline in nutrient
concentrations and low salinity. Letelier et al. (2009) andDávila et al. (2002) reported a seaward-flowing, low-salinity tongue originating from rivers during high rain-fall, matching our observations. However, it seems that,in general, salinity is not a major factor determining thedistribution and abundance of coccolithophores(Andruleit et al., 2003; Beaufort et al., 2008), rather ithas been linked to an increase in size and more calcifica-tion of plates (Paasche et al., 1996; Fielding et al., 2009).However, we found over-calcified specimens of E. huxleyitype A (robust coccoliths, ~4–6 µm in diameter) mainlyin the area around Z2-CUF and the coastal Z1 stations.Beaufort et al. (2008) also observed this morphotype inthe HCS, suggesting that coccolithophores producemore calcified coccoliths in nutrient-rich environments.Type A has been reported in the coastal waters of theBenguela Current (Henderiks et al., 2011) and theAustralian sector of the Southern Ocean (Findlay andGiraudeau, 2000; Cubillos et al., 2007). Those authorsreported that it occurred mainly north of theSubantarctic Front, defining a north–south trend ofdecreasing calcification for E. huxleyi in the SouthernOcean. This is apparently is a shift in dominance fromone ecotype to another, rather than an effect of decreas-ing carbonate ion concentrations or calcite saturationstates. This was also noted in mesocosm experiments inwhich E. huxleyi coccoliths were more calcified in watersrich in P and N (Beaufort et al., 2007). Other variablesreported in the literature that may significantly affectthe state of calcification in E. huxleyi are light levels(Balch and Kilpatrick, 1996; Zondervan, 2007), changesin carbonate chemistry (DIC, pH) of upwelling regions(Cubillos et al., 2007) and the possible effect of salinityon size, morphology and the number of coccoliths(Fielding et al., 2009). Although E. huxleyi is the moststudied coccolithophore species, substantial gaps remainin our knowledge of its ecophysiological plasticity(Henderiks et al., 2011) and the effects of environmentalvariables on the production of plates. Knowledge of thecalcification mechanisms remains incomplete (Brownleeand Taylor, 2004).Overall, Z3 showed the highest coccolithophore abun-
dances, and the most prominent peaks were recorded inthe oceanic waters on its northern side (between 35.5–36.0°S and 74–77°W). These peaks largely overlappedwith the presence of an anticyclonic eddy with sufficientkinetic energy to deepen the isotherms down to 200 m(Letelier et al., 2009). This eddy had a warm core(>15°C), low NO3 and PO4 concentrations and signifi-cant depletion of nitrate (N:P < 2), and it coincided withthe highest abundances of coccolithophores recorded of180 000 and 240 000 cells L−1 at 50m depth at Stations18 and 19, respectively. These eddies persist for about
JOURNAL OF PLANKTON RESEARCH j VOLUME j NUMBER j PAGES – j at U
niversidad Austral de C
hile on May 27, 2016
http://plankt.oxfordjournals.org/D
ownloaded from

5–10 months (Hormazabal et al., 2004, Morales et al.,2012), so nutrient depletion develops, especially of nitrate(Townsend et al., 1994; Head et al., 1998; Rees et al.,2002), suggesting that NO3 becomes (under these circum-stances) more limiting than PO4.
The biodiversity indexes in Z3 were the highestrecorded in this study (Fig. 7). There, E. huxleyi andG. muellerae diminished in importance, mainly due to theoccurrence of C. mediterranea, Syracosphaera spp., H. carteri,and C. leptoporus, which together contributed ~40% of thetotal abundance. Coronosphaera mediterranea has been asso-ciated with warm subtropical waters (Moita et al., 2010),which may explain its presence in Z3. That area had thehighest average temperatures (~15°C). Syracosphaera spp.has been reported to be a typical oceanic taxon (Boeckelet al., 2006) and an indicator of oligotrophic conditions(Young, 1994; Andruleit and Rogalla, 2002). Helicosphaera
carteri seems to become more prominent in water masseswith high-to-moderate nutrient levels and turbidity(Giraudeau, 1992; Ziveri et al., 1995), but it has also beenrelated to low-salinity conditions (Colmenero-Hidalgoet al., 2004), as in Z3. According to Saavedra-Pelliteroet al. (2010), C. leptoporus and H. carteri appear in differentoceanic environments, being dominant in sediments fromneritic areas located north and south of our study area.BIOENV analysis revealed that salinity and tempera-
ture best explain variation in total station densities of coc-colithophores in our study area (pw = 0.689; P < 0.05).However, it would not be salinity per se that drives cocco-lithophore distributions. In fact, some species of cocco-lithophores have been reported as euryhaline, able totolerate a wide range of salinities, especially estuarine taxa(Brand, 1984). Species such as E. huxleyi and Pleurochrysis
carterae are able to grow in salinities ranging from 15 to45 g kg−1 (Brand, 1984). Likewise, Haidar and Thierstein(2001) suggested that physical parameters may be respon-sible for up to 50% of the dynamics of the most abundantcoccolithophore species. Thus, a combination of severalphysical and chemical variables (i.e. nutrient concentra-tion, temperature and/or water column stability) mayhave produced the more suitable habitat for coccolitho-phore growth in our Z3 region.
Coccolithophores: suspended CarCand export to the deep sea
Concentrations of CarC varied widely in the study area.Of the three areas distinguished by the cluster analysis,Z3 represented 90% of the total CarC, and only twogenera (Calcidiscus and Helicosphaera) accounted for over50% of the total CarC, although they only contributed~3% of the total numerical abundance. This is explainedby their larger (10–30 µm) and more robust coccoliths,
totaling 30–60 times more CaCO3 per cell than E. hux-
leyi. The most abundant species (E. huxleyi and G. muellerae)made up of 70% of the coccolithophore in numbers, but,because of their small coccoliths (~5 µm in diameter),they only contributed ~27% of the total CarC. The otherthree zones (Z1, Z2-CUF, Z2-Oceanic) played minor rolesin the total CarC budget. In those regions, E. huxleyi andG. muellerae represented between 80 and 100% of the totalCarC. Beaufort et al. (2008) reported that the coccolithsof E. huxleyi, Gephyrocapsa spp. and Crenalithus spp. repre-sented more than 30% of the suspended calcite particlesdetected in the 0.1–46 µm particle size range between thePerú–Chile upwelling zone and the South Pacific Gyre.According to those authors, the distribution was stronglyrelated to ocean chemistry, in particular to alkalinity andcarbonate ion concentrations. In this study, the propor-tions of biogenic calcite concentrations of the orderIsochrysidales (E. huxleyi, G. muellerae) were high (>90%)close to the coastal regions (Z1, Z2-CUF) and low (~27%)in the oceanic area (Z3), albeit similar to proportionspreviously reported for the area (30%; Beaufort et al.,2008). However, those authors only focused on Isochrysidales
(numerically dominant), whereas orders such as Coccolithalesand Zygodiscales were less abundant in our study butmade significant contributions in terms of the suspendedcalcite budget (Fig. 8). Thus, the estimated carbonateexport from coccoliths showed that H. carteri was thedominant taxon (41.7% CarCex, 2.4% TCarex), fol-lowed by C. leptoporus (40% CarCex, 1.8% TCarex),whereas G. muellerae, Coccolithus sp. and E. huxleyi togethercontributed only 11.8 to CarCex and 0.6% to TCarex.
Emiliania huxleyi and G. muellerae dominated in the watercolumn and sediment trap samples from the study area offConcepción, which contrasts with the observations done bySaavedra-Pellitero et al. (2010). They reported F. profunda
and G. oceanica as the dominant species in surface sedimentsbetween 33 and 38°S. Nevertheless, they also recognizedthat their study might be affected by strong, persistentupwelling and selective calcite dissolution, both favoringpreservation of the most resistant species. The relativelyshallow (40–120m) aragonite lysocline of the upwelling sys-tem (Feely et al., 2008), impinging on the bottom in a verycomplex ecosystem, likely explains the discrepancy betweenthe living pelagic assemblage of coccolithophores and itspreserved counterpart in the sediment.
The vertical export of total CaCO3 (TCarex) showedhigh variability among the study stations and sediment-trap collection seasons. Possible reasons are difficult toestablish from the multiple and complex biological (e.g.primary production, micro- and meso-zooplankton com-munity composition, microbial activity) and physical(e.g. mesoscale features and water column mixing pro-cesses, particulate settling rates and climatological/
E. MENSCHEL ET AL. j COCCOLITHOPHORES AND CARBONATE FLUX IN AN UPWELLING SYSTEM at U
niversidad Austral de C
hile on May 27, 2016
http://plankt.oxfordjournals.org/D
ownloaded from

hydrological seasonality) interactions. The highestTCarex occurred in austral summer (45%) and thendecreased gradually through autumn (37%) and winter(18%). Although sediment trap and water column sam-ples shifted through time (see Methods), the coccolitho-phore composition in the water column (mainly in Z3)was very similar to that observed in deep sediment trapsamples. This suggests that the coccoliths in sedimentoriginated in the oceanic waters above with only smallpreservational modification.
Higher vertical particle flux in spring/summer hasbeen related to increased solar radiation, which raisessea surface temperatures, favoring the production ofalgae (Nanninga and Tyrrell, 1996; Triantaphyllouet al., 2004). Average TCarex flows in our study arearanged from 23 to 170 mg m−2 d−1, rates very similar tothose (25–170 mg m−2 d−1) reported by González et al.
(2004) for the oceanic area off Coquimbo and for otheroceanic regions of the world (Table VI). The sequestra-tion of CarCex was dominated mainly by coccoliths andcoccospheres, which together accounted for 70% of theCarCex and 4.8% of TCarex. The second major compo-nent corresponded to appendicularian pellets, whichtransported biogenic calcite to the deep sea, averaging27% of CarCex and up to 76% during summer. Thecontribution of appendicularian pellets to TCarex wasminor in this study (1.2%); however, the importance ofthem may be underestimated due to the presence of alarge fraction of unidentified, broken and amorphousfecal pellets, a substantial part of which could have beenproduced by appendicularians and not included in our
results. The importance of appendicularian pellets incarbonate flux and the inorganic carbon cycle has beenhighlighted in several studies of the HCS (Gonzálezet al., 2004, 2009) and in other marine systems aroundthe world (Gorsky et al., 1999; Antia et al., 2008). Thehydrodynamic shape (oval) and high compaction ofthese pellets generate high fecal pellets’ sinking rates(25–166 m d−1) (Gorsky et al., 1984), which facilitatetheir rapid export from the photic zone and preventrecycling in this area of high biological activity.The calcium carbonate exported attached to tintinnid
loricae (Codonellopsis, Dictiocysta, Tintinnopsis) was not sub-stantial in this study representing an average of 2.8% ofthe total CarCex and 0.1% of the TCarex. This was avery conservative estimate because the attached materialmay have consisted of more than one layer (Dolan et al.,2013). Thus, the carbonate flux carried on the loricae ofthese ciliates helps to elucidate the variety of compo-nents involved in the export of carbonate into the deepregions of the ocean off Concepción.
CONCLUSION
The spatial distribution coccolithophores in the upper50 m water column off Concepción, Chile showed a clearcoast-to-ocean pattern, influenced by an active coastalupwelling system, frontal zones and other physicalboundaries, creating four-well-defined biogeographiczones. The coastal zone (Z1) located at the upwellingcenter had the highest diatom and the lowest
Table VI: Comparison of vertical fluxes of total and coccolith-mediated carbonate recorded in differentupwelling and oceanic systems from the world oceans.
Study area
Sediment trapdeployment Total CaCO3
AveragecoccolithCaCO3
Coccolithcontributionto total CaCO3
Referencesdepth (m) (mg m−2d−1) (mg m−2d−1) (%)
Upwelling Coastal SystemsNorthern Pacific , 30°33′N, 118°30′W 500 83 20 24.5 Ziveri et al., (1995)Bay of Biscay, 45°N, 2.5°W 2300 30–130 6.7 12 Beaufort and Heussner (1999)Northern Benguela, 23°00′S, 12°59′E 544 144 31.3 21.7 Giraudeau et al., (2000)Oceanic Systems Influences by Upwelling AreaCanarian and Azores Current, 29°N, 15.5–18°W 750–900 – 3.2–3.5 31–33 Sprengel et al., (2002)Canarian and Azores Current, 29°N, 15.5–18°W 3000–3700 – 7.4–13.4 44–63 Sprengel et al., (2002)Humboldt Current, 30°S, 73°11′W 2300 25–170 7 12 González et al., (2004)Humboldt Current, 37° 05′S, 74 ° 50′W 1000 22.5–170 3 (0.8*) 4.8 (1.2*) This studyOceanic SystemsArabian Sea, 16°18′N, 60°30′E 1200 106.8 47.6 44.6 Ramaswamy and Gaye (2006)NE Atlantic, 34°N 21°W and 48°N 21°W 1000 30–35 10.7 29 Broerse et al., (2000)Arabian Sea, 15°34′N, 68°36′E 963 47.9 28.7 60 Ramaswamy and Gaye (2006)Bay of Bengal, 13°09′N, 89°13′E 1131 35.9 15.6 43.5 Ramaswamy and Gaye (2006)Bermuda, 32°N, 64.5°W 3200 5–23 – – Haidar et al., (2000)FramStrait, 78°53′N, 6°40′ – 11–157 – – Hebbeln (2000)Bay of Bengal, 13°09′N, 84°20′E 893 34.5 – – Ramaswamy and Gaye (2006)Indonesian Archipelago, 0°–4°N, 135°–175°E 1342–1769 30–71 3.5–16.7 9.5–23.3 Tanaka (2004)
*The average carbonate exported by appendicularian fecal pellets and their relative contribution (%).
JOURNAL OF PLANKTON RESEARCH j VOLUME j NUMBER j PAGES – j at U
niversidad Austral de C
hile on May 27, 2016
http://plankt.oxfordjournals.org/D
ownloaded from
coccolithophore abundance, the latter dominatedalmost exclusively by E. huxleyi. On the outside marginof the upwelling front (Z2-CUF), abundance as well asbiodiversity of coccolithophores started to increase,reaching its maximum (~300 × 103 cells L−1 and up17 coccolithophores species, respectively) at the moreoceanic stations (Z3).TCarex at 1000 m depth was highly variable, with
maximum and minimum fluxes in austral spring andwinter, respectively. The main components of CarCex
were coccospheres and detached coccoliths. The lessabundant species of coccolithophores but heavier ones,such as H. carteri and C. leptoporus, contributed >80% toCarCex and >4% to TCarex. Appendicularian fecal pel-lets made a minor contribution to TCarex but wereimportant contributors to CarCex (~27%) .In general, the community structure of coccolitho-
phores and the total flux of carbonate were similar to,and the CarCex lower than, other studies conducted inthe HCS and in the world oceans.
SUPPLEMENTARY DATA
Supplementary data can be found online athttp://plankt.oxfordjournals.org
ACKNOWLEDGEMENTS
We thank the captain and crew of the R/V AGOR VidalGormáz for their collaboration during sampling. We aregrateful to Carola Aparicio for help with the collection ofbiological material, Dr Cristian Duarte for invaluableassistance with the statistical analysis, Dr José Garcés forhelping us with the wind figure and Dr Hector Pavés forvaluable comments that improved an early version of thismanuscript. Mr Ricardo Silva helped us with the samplepreparation and observations during the scanning electronmicroscope work at UACH, and Dr Oscar Pizarro andCesar Hormazabal helped during the deployment andretrieval of the deep sediment trap. Special thanks aredue to Dr Lluïsa Cros (ICM, Barcelona, Spain) for herinvaluable collaboration in the methodology and identifi-cation of the coccolithophore species.
FUNDING
FONDAP-COPAS (150100007, FIP 2004-20); OceanCertain (EU-FP7 N°603773). COPAS-Sur Austral Basal(PFB-31) to E.M. (partial support); FONDAP-IDEAL(15150003) to E.M. (partial support).
REFERENCESAlheit, J. and Bernal, P. (1993) Effects of physical and biologicalchanges on the biomass yield of the Humboldt current system. InSherman, K., Alexander, L. M. and Gold, B. (eds.), Large Marine
Ecosystems: Stress, Mitigation and Sustainability. AAAS Press,Washington, DC, pp. 252–267.
Anabalón, V., Morales, C., Escribano, R. and Varas, M. A. (2007)The contribution of nano-and micro-planktonic assemblages in thesurface layer (0–30m) under different hydrographic conditions inthe upwelling area off Concepción, central Chile. Prog. Oceanogr., 75,396–414.
Andruleit, H. (2007) Status of the Java upwelling area (IndianOcean) during the oligotrophic northern hemisphere winter mon-soon season as revealed by coccolithophores. Mar. Micropaleontol.,64, 36–51.
Andruleit, H. and Rogalla, U. (2002) Coccolithophores in surface sedi-ments of the Arabian sea in relation to environmental gradients insurface waters. Mar. Geol., 186, 505–526.
Andruleit, H., Stäger, S., Rogalla, U. and Čepek, P. (2003) Living coc-colithophores in the northern Arabian Sea: ecological tolerancesand environmental control. Mar. Micropaleontol., 49, 157–181.
Antia, A., Suffrian, K., Holste, L., Müller, M., Nejstgaard, J.,Simonelli, P., Carotenuto, Y. and Putzeys, S. (2008) Dissolution ofcoccolithophorid calcite by microzooplankton and copepod grazing.Biogeosci. Disc., 5, 1–23.
Bairbakhish, A. N., Bollmann, J., Sprengel, C. and Thierstein, H. R.(1999) Disintegration of aggregates and coccospheres in sedimenttrap samples. Mar. Micropaleontol., 37, 219–223.
Balch, W. M. and Kilpatrick, K. (1996) Calcification rates in the equa-torial Pacific along 140 W. Deep Sea Res. II, 43, 971–993.
Baumann, K.-H., Andruleit, H. and Samtleben, C. (2000)Coccolithophores in the Nordic Seas: comparison of living commu-nities with surface sediment assemblages. Deep Sea Res. II, 47,1743–1772.
Baumann, K.-H., Böckel, B. and Frenz, M. (2004) Coccolith contribu-tion to south Atlantic Carbonate Sedimentation. In Thierstein, H. R.and Young, J. R. (eds.), Coccolithophores from Molecular Process to
Global Impact. Springer-Verlag, Berlin, pp. 367–402.
Beaufort, L., Couapel, M., Buchet, N. and Claustre, H. (2007) Calciteproduction by Coccolithophores in the South East Pacific Ocean:from desert to jungle. Biogeosci. Disc., 4, 3267–3299.
Beaufort, L., Couapel, M., Buchet, N., Claustre, H. and Goyet, C.(2008) Calcite production by coccolithophores in the south eastPacific Ocean. Biogeosciences, 5, 1101–1117.
Beaufort, L. and Heussner, S. (1999) Coccolithophorids on the contin-ental slope of the Bay of Biscay–production, transport and contribu-tion to mass fluxes. Deep Sea Res. II, 46, 2147–2174.
Boeckel, B., Baumann, K.-H., Henrich, R. and Kinkel, H. (2006)Coccolith distribution patterns in South Atlantic and SouthernOcean surface sediments in relation to environmental gradients.Deep Sea Res. I, 53, 1073–1099.
Bollmann, J. (1997) Morphology and biogeography of Gephyrocapsacoccoliths in Holocene sediments. Mar. Micropaleontol., 29,319–350.
Böttjer, D. and Morales, C. E. (2007) Nanoplanktonic assemblages inthe upwelling area off Concepción (∼36 S), central Chile: abun-dance, biomass, and grazing potential during the annual cycle. Prog.Oceanogr., 75, 415–434.
E. MENSCHEL ET AL. j COCCOLITHOPHORES AND CARBONATE FLUX IN AN UPWELLING SYSTEM at U
niversidad Austral de C
hile on May 27, 2016
http://plankt.oxfordjournals.org/D
ownloaded from

Bown, P. R. (ed.) (1998) Calcareous Nannofossil Biostratigraphy. BritishMicropaleontological Society Publication Series. Chapman & Hall;Kluwer Academic, London, pp. 1–315.
Brand, L. E. (1994) Physiological ecology of marine coccolithophores.In Winter, A. and Siesser, W. G. (eds.) Coccolithophores. CambridgeUniversity Press, New York, pp. 39–45.
Brand, L. E. (1984) The salinity tolerance of forty-six marine phyto-plankton isolates. Estuar. Coast. Shelf Sci., 18, 543–556.
Brown, C.W. and Yoder, J. A. (1994) Coccolithophorid blooms in theglobal ocean. J. Geo. Res., 99, 2156–2202.
Broerse, A. T., Ziveri, P., Van Hinte, J. E. and Honjo, S. (2000)Coccolithophore export production, species composition, andcoccolith-CaCO3 fluxes in the NE Atlantic (34° N21° W and 48°N21° W). Deep Sea Res. II, 47, 1877–1905.
Brower, J. E. and Zar, J. H. (eds.) (1977) Field and laboratory methods for
general ecology. W. M. C. Brown Company Publishers, Dubuque,Iowa, pp. 1–194.
Brownlee, C. and Taylor, A. (2004) Calcification in coccolithophores:a cellular perspective. In Thierstein, H. R. and Young, J. R. (eds.),Coccolithophores: from molecular processes to global impact. Springer,Germany, pp. 31–49.
Carpenter, J. H. (1965) The Chesapeake Bay Institute technique for theWinkler dissolved oxygen method. Limnol. Oceanogr., 10, 141–143.
Chen, Y.-L. L., Chen, H.-Y. and Chung, C.-W. (2007) Seasonal vari-ability of coccolithophore abundance and assemblage in the nor-thern South China Sea. Deep Sea Res. II, 54, 1617–1633.
Clarke, K. R., Somerfield, P. J. and Gorley, R. N. (2008) Testing of nullhypotheses in exploratory community analyses: similarity profiles andbiota-environment linkage. J. Exp. Mar. Biol. Ecol., 366, 56–69.
Clarke, K. R. and Warwick, R. M. (eds.) (2001) Changes in Marine
Communities: An Approach to Statistical Analysis and Interpretation. 2nd edn,PRIMER‐E Ltd, Plymouth, UK.
Colmenero-Hidalgo, E., Flores, J.-A., Sierro, F. J., Bárcena, M. A.,Löwemark, L., Schönfeld, J. and Grimalt, J. O. (2004) Ocean sur-face water response to short-term climate changes revealed by cocco-lithophores from the Gulf of Cadiz (NE Atlantic) and Alboran Sea(W Mediterranean). Palaeogeogr. Palaeoclimatol. Palaeoecol., 205, 317–336.
Cortés, M. Y., Bollmann, J. and Thierstein, H. R. (2001)Coccolithophore ecology at the HOT station ALOHA, Hawaii.Deep Sea Res. II, 48, 1957–1981.
Cros, L. and Fortuño, J. M. (2002) Atlas of northwesternMediterranean coccolithophores. Sci. Mar., 66, 1–182.
Cubillos, J., Wright, S., Nash, G., De Salas, M., Griffiths, B.,Tilbrook, B., Poisson, A. and Hallegraeff, G. (2007) Calcificationmorphotypes of the coccolithophorid Emiliania huxleyi in theSouthern Ocean: changes in 2001 to 2006 compared to historicaldata. Mar. Ecol. Prog. Ser., 348, 47–54.
Dávila, P. M., Figueroa, D. and Müller, E. (2002) Freshwater inputinto the coastal ocean and its relation with the salinity distributionoff austral Chile (35–55 S). Cont. Shelf Res., 22, 521–534.
Deuser, W. and Ross, E. (1989) Seasonally abundant planktonic for-aminifera of the Sargasso Sea; succession, deep-water fluxes, isotopiccompositions, and paleoceanographic implications. J. Foram. Res.,19, 268–293.
Dolan, J. R., Montagnes, D. J. S., Agatha, S. Coats, D. W. andStoecker, D. K. (eds.) (2013) The Biology and Ecology of Tintinnid
Ciliates: Models for Marine Plankton. Wiley-Blackwell, Chichester, UK,pp. 1–243.
Eynaud, F., Giraudeau, J., Pichon, J. J. and Pudcey, C. J. (1999) Sea-surface distribution of coccolithophores, diatoms, silicoflagellatesand dinoflagellates in the South Atlantic Ocean during the late aus-tral summer 1995. Deep-Sea Res. I, 46, 451–482.
Fabry, V. (1989) Aragonite production by pteropod mollusks in thesubantarctic Pacific. Deep-Sea Res., 36, 1735–1751.
Falkowski, P. G., Schofield, O., Katz, M. E., Van de Schootbrugge, B.and Knoll, A. H. (2004) Why is the land green and the ocean red.In Thierstein, H. R. and Young, J. R. (eds.), Coccolithophores fromMolecular Process to Global Impact. Springer-Verlag, Berlin, pp. 1–565.
Feely, R. A., Sabine, C. L., Hernández-Ayon, J. M., Ianson, D. andHales, B. (2008) Evidence for upwelling of corrosive “acidified”water onto the continental shelf. Science, 320, 1490–1492.
Fielding, S. R., Herrle, J. O., Bollmann, J., Worden, R. H. andMontagnes, D. J. (2009) Assessing the applicability of Emiliania hux-
leyi coccolith morphology as a sea‐surface salinity proxy. Limnol.
Oceanogr., 54, 1475–1480.
Findlay, C. and Giraudeau, J. (2000) Extant calcareous nannoplanktonin the Australian Sector of the Southern Ocean (austral summers1994 and 1995). Mar. Micropaleontol., 40, 417–439.
Fossing, H., Gallardo, V., Jorgensen, B., Huttel, M., Nielsen, L.,Schulz, D. E. Canfield, H., Gundersen, J. et al. (1995) Concentrationand transport of nitrate by the mat-forming sulphur bacteriumThioploca. Nature, 374, 20.
Giraudeau, J. (1992) Distribution of recent nannofossils beneath theBenguela system: southwest African continental margin. Mar. Geol.,108, 219–237.
Giraudeau, J. and Bailey, G. W. (1995) Spatial dynamics of cocco-lithophore communities during an upwelling event in the SouthernBenguela system. Cont. Shelf Res., 15, 1825–1852.
Giraudeau, J., Bailey, G. W. and Pujol, C. (2000) A high-resolutiontime-series analyses of particle fluxes in the Northern Benguelacoastal upwelling system: carbonate record of changes in biogenicproduction and particle transfer processes. Deep-Sea Res. II, 47,1999–2028.
González, H. E., Daneri, G., Iriarte, J. L., Yannicelli, B., Menschel,E., Barría, C., Pantoja, S. and Lizárraga, L. (2009) Carbon fluxeswithin the epipelagic zone of the Humboldt current system offChile: the significance of euphausiids and diatoms as key functionalgroups for the biological pump. Prog. Oceanogr., 83, 217–227.
González, H. E., Hebbeln, D., Iriarte, J. L. and Marchant, M. (2004)Downward fluxes of faecal material and microplankton at 2300mdepth in the oceanic area off Coquimbo (30° S), Chile, during1993–1995. Deep Sea Res. II, 51, 2457–2474.
González, H. E., Menschel, E., Aparicio, C. and Barría, C. (2007)Spatial and temporal variability of microplankton and detritus, andtheir export to the shelf sediments in the upwelling area offConcepción, Chile (∼36 S), during 2002–2005. Prog. Oceanogr., 75,435–451.
Gorsky, G., Chrétiennot-Dinet, M., Blanchot, J. and Palazzoli, I.(1999) Picoplankton and nanoplankton aggregation by appendicu-larians: Fecal pellet contents of Megalocercus huxleyi in the equatorialPacific. J. Geophys. Res., 104, 3381–3390.
Gorsky, G., Fisher, N. S. and Fowler, S. W. (1984) Biogenic debrisfrom the pelagic tunicate, Oikopleura dioica, and its role in the verticaltransport of a transuranium element. Estuar. Coast. Shelf Sci., 18,13–23.
Gravalosa, J. M., Flores, J.-A., Sierro, F. J. and Gersonde, R. (2008)Sea surface distribution of coccolithophores in the eastern Pacific
JOURNAL OF PLANKTON RESEARCH j VOLUME j NUMBER j PAGES – j at U
niversidad Austral de C
hile on May 27, 2016
http://plankt.oxfordjournals.org/D
ownloaded from
sector of the Southern Ocean (Bellingshausen and Amundsen Seas)during the late Austral summer of 2001. Mar. Micropaleontol., 69,16–25.
Guerreiro, C., Oliveira, A., De Stigter, H., Cachão, M., Sá, C.,Borges, C., Cros, L., Santos, A. et al. (2013) Late winter coccolitho-phore bloom off central Portugal in response to river discharge andupwelling. Cont. Shelf Res., 59, 65–83.
Hagino, K. and Okada, H. (2006) Intra- and infra-specific morpho-logical variation inselected coccolithophore species in the Equatorialand subequatorial Pacific Ocean. Mar. Micropaleontol., 58, 184–206.
Hagino, K., Okada, H. and Matsuoka, H. (2000) Spatial dynamics ofcoccolithophore assemblages in the Equatorial Western-CentralPacific Ocean. Mar. Micropaleontol., 39, 53–72.
Haidar, A. T. and Thierstein, H. R. (2001) Coccolithophore dynamicsoff Bermuda (N. Atlantic). Deep Sea Res. II, 48, 1925–1956.
Haidar, A. T., Thierstein, H. R., Deuser, W. G. (2000) Calcareousphytoplankton standing stocks, fluxes and accumulation in Holocenesediments off Bermuda (N. Atlantic). Deep-Sea Res. I, 47, 1907–1938.
Head, R. N., Crawford, D. W., Egge, J. K., Harris, R. P., Kristiansen,S., Lesley, D. J., Marañón, E., Pond, D. et al. (1998) The hydrog-raphy and biology of a bloom of the coccolithophorid Emiliania hux-
leyi in the northern North Sea. J. Sea Res., 39, 255–266.
Hebbeln, D. (2000) Flux of ice-rafted detritus from sea ice in the FramStrait. Deep Sea Res. II, 47, 1773–1790.
Hebbeln, D., Marchant, M. and Wefer, G. (2000) Seasonal variationsof the particle flux in the Peru-Chile current at 30 S under “normal”and El Niño conditions. Deep Sea Res. II, 47, 2101–2128.
Henderiks, J., Winter, A., Elbraechter, M., Feistel, R., Van Der Plas,A., Nausch, G. and Barlow, R. (2011) Environmental controls onEmiliania huxleyi morphotypes in the Benguela coastal upwelling sys-tem (SE Atlantic). Mar. Ecol. Prog. Ser., 448, 51–66.
Hernández, K., Yannicelli, B., Montecinos, A., Ramos, M., González,H. E. and Daneri, G. (2012) Temporal variability of incidental solarradiation and modulating factors in a coastal upwelling area (36 S).Prog. Oceanogr., 92, 18–32.
Holligan, P. M., Fernández, E., Aiken, J., Balch, W. M., Boyd, P.,Burkill, P. H., Finch, M., Groom, S. B. et al. (1993) A biogeochem-ical study of the coccolithophore, Emiliania huxleyi, in the NorthAtlantic. Global Biogeochem. Cy., 7, 879–900.
Honjo, S. (1977) Biogenic carbonate particles in the ocean; do theydissolve in the water column? In Anderson, N. R. and Malahoff, A.(eds.), The Fate of Fossil Fuel CO2 in the Oceans. Plenum Press, NewYork and London, pp. 269–294.
Hormazabal, S., Shaffer, G. and Leth, O. (2004) Coastal transitionzone off Chile. J. Geophys. Res., 109, 1–13.
Iglesias-Rodriguez, M. D., Schofield, O. M., Batley, J., Medlin, L. K.and Hayes, P. K. (2006) Intraspecific genetic diversity in the marinecoccolithophore Emiliania huxleyi (Prymnesiophyceae): the use ofmicrosatellite analysis in marine phytoplankton population studies.J. Phycol., 42, 526–536.
Iriarte, J. L. and González, H. E. (2004) Phytoplankton size structure dur-ing and after the 1997/98 El Niño in a coastal upwelling area of thenorthern Humboldt current system. Mar. Ecol. Prog. Ser., 269, 83–90.
Jordan, R. W. and Chamberlain, A. H. L. (1997) Biodiversity amonghaptophyte algae. Biodivers. Conserv., 6, 131–152.
Langer, G., Nehrke, G., Probert, I., Ly, J. and Ziveri, P. (2009) Strain-specific responses of Emiliania huxleyi to changing seawater carbonatechemistry. Biogeosciences, 6, 2637–2646.
Lee, C., Hedges, J. I., Wakeham, S. G. and Zhu, N. (1992)Effectiveness of various treatments in retarding microbial activity insediment trap material and their effects on the collection of swim-mers. Limnol. Oceanogr., 37, 117–130.
Lee Chen, Y. L., Chen, H. Y. and Chung, C. W. (2007) Seasonal vari-ability of coccolithophore abundance and assemblage in the nor-thern South China Sea. Deep-Sea Res. II, 54, 1617–1633.
Letelier, J., Pizarro, O. and Nuñez, S. (2009) Seasonal variability ofcoastal upwelling and the upwelling front off central Chile. J.
Geophys. Res., 114, 1–16.
Malin, G. and Steinke, M. (2004) Dimethyl sulphide production: whatis the contribution of the coccolithophores? In Thierstein, H. R. andYoung, J. R. (eds.), Coccolithophores from molecular process to global impact.Springer-Verlag, Berlin, pp. 1–565.
Margalef, R. (1978) Life-forms of phytoplankton as survival alterna-tives in an unstable environment. Oceanol. Acta, 1, 493–509.
Mathiesen, Á. (2012) El estado mundial de la pesca y la acuicultura.Departamento de Pesca y Acuicultura de la Organización de lasNaciones Unidas para la Alimentación y la Agricultura, Roma,Italia. ISBN, 1–231.
Mitchell-Innes, B. and Winter, A. (1987) Coccolithophores: amajor phytoplankton component in mature upwelled waters offthe Cape Peninsula, South Africa in March, 1983. Mar. Biol., 95,25–30.
Moita, M., Silva, A., Palma, S. and Vilarinho, M. (2010) The cocco-lithophore summer–autumn assemblage in the upwelling waters ofPortugal: patterns of mesoscale distribution (1985–2005). Estuar.
Coast. Shelf Sci., 87, 411–419.
Montero, P., Daneri, G., Cuevas, L. A., González, H. E., Jacob, B.,Lizárraga, L. and Menschel, E. (2007) Productivity cycles in the coastalupwelling area off Concepción: the importance of diatoms and bacter-ioplankton in the organic carbon flux. Prog. Oceanogr., 75, 518–530.
Moore, T. S., Dowell, M. D. and Franz, B. A. (2012) Detection ofcoccolithophore blooms in ocean color satellite imagery: a general-ized approach for use with multiple sensors. Remote Sens. Environ.,117, 249–263.
Morales, C. E., Hormazabal, S., Correa-Ramirez, M., Pizarro, O.,Silva, N., Fernandez, C., Anabalón, V., Torreblanca, M. L. (2012)Mesoscale variability and nutrient–phytoplankton distributions offcentral-southern Chile during the upwelling season: the influence ofmesoscale eddies. Prog. Oceanogr., 104, 17–29.
Morales, C. E., Torreblanca, M. L., Hormazabal, S., Correa-Ramírez, M., Nuñez, S. and Hidalgo, P. (2010) Mesoscale structureof copepod assemblages in the coastal transition zone and oceanicwaters off central-southern Chile. Prog. Oceanogr., 84, 158–173.
Nanninga, H. and Tyrrell, T. (1996) Importance of light for the for-mation of algal blooms by Emiliania huxleyi. Mar. Ecol. Prog. Ser., 136,195–203.
O’Brien, C. J., Peloquin, J. A., Vogt, M., Heinle, M., Gruber, N.,Ajani, P., Andruleit, H., Arístegui, J. et al. (2013) Global marineplankton functional type biomass distributions: coccolithophores.Earth Sys. Sci. Data, 5, 259–276.
Paasche, E., Brubak, S., Skattebøl, S., Young, J. and Green, J. (1996)Growth and calcification in the coccolithophorid Emiliania huxleyi
(Haptophyceae) at low salinities. Phycologia, 35, 394–403.
Ramaswamy, V. and Gaye, B. (2006) Regional variations in thefluxes of foraminifera carbonate, coccolithophorid carbonate andbiogenic opal in the northern Indian Ocean. Deep-Sea Res. I, 53,271–293.
E. MENSCHEL ET AL. j COCCOLITHOPHORES AND CARBONATE FLUX IN AN UPWELLING SYSTEM at U
niversidad Austral de C
hile on May 27, 2016
http://plankt.oxfordjournals.org/D
ownloaded from

Rees, A. P., Woodward, E. M. S., Robinson, C., Cummings, D. G.,Tarran, G. A. and Joint, I. (2002) Size-fractionated nitrogen uptakeand carbon fixation during a developing coccolithophore bloom inthe North Sea during June 1999. Deep Sea Res. II, 49, 2905–2927.
Rhodes, L. L., Peake, B. M., Mackenzie, A. L. and Marwick, S. (1995)Coccolithophores Gephyrocapsa oceanica and Emiliania huxleyi
(Prymnesiophyceae = Haptophyceae) in New Zealand’s coastalwaters: characteristics of blooms and growth in laboratory culture.N. Z. J. Mar. Freshwat. Res., 29, 345–357.
Rivera, P. (1973) Diatomeas de la Bahía de Concepción, Chile. II. Bol.Soc. Biol. Concepcion, 46, 169–175.
Saavedra-Pellitero, M., Baumann, K. H., Flores, J. A. and Gersonde,R. (2014) Biogeographic distribution of living coccolithophores in thePacific sector of the Southern Ocean. Mar. Micropaleontol., 109, 1–20.
Saavedra-Pellitero, M., Baumann, K.-H., Hernández-Almeida, I.,Flores, J. and Sierro, F. (2013) Modern sea surface productivity andtemperature estimations off Chile as detected by coccolith accumu-lation rates. Palaeogeogr. Palaeoclimatol. Palaeoecol., 392, 534–545.
Saavedra-Pellitero, M., Flores, J.-A., Baumann, K.-H. and Sierro, F.-J.(2010) Coccolith distribution patterns in surface sediments ofEquatorial and Southeastern Pacific Ocean. Geobios, 43, 131–149.
Saldías, G. S., Sobarzo, M., Largier, J., Moffat, C. and Letelier, R.(2012) Seasonal variability of turbid river plumes off central Chilebased on high-resolution MODIS imagery. Remote Sens. Environ.,123, 220–233.
Sánchez, G., Pantoja, S., Lange, C., González, H. and Daneri, G.(2008) Seasonal changes in particulate biogenic and lithogenic silicain the upwelling system off Concepción (∼36° S), Chile, and theirrelationship to fluctuations in marine productivity and continentalinput. Cont. Shelf Res., 28, 2594–2600.
Sernapesca (2014) Actividades de Fiscalización Efectuadas en Materiade Pesca y Acuicultura en el año 2013. Ministerio de EconomíaFomento y Turismo. Valparaíso, Chile, 1-46.
Silva, N., Rojas, N. and Fedele, A. (2009) Water masses in theHumboldt current system: properties, distribution, and the nitratedeficit as a chemical water mass tracer for Equatorial SubsurfaceWater off Chile. Deep Sea Res. II, 56, 1004–1020.
Silva, A., Palma, S. and Moita, M. (2008) Coccolithophores in theupwelling waters of Portugal: Four years of weekly distribution inLisbon bay. Cont. Shelf Res., 28, 2601–2613.
Sprengel, C., Baumann, K.-H., Henderiks, J., Henrich, R. and Neuer, S.(2002) Modern coccolithophore and carbonate sedimentation alonga productivity gradient in the Canary Islands region: seasonal exportproduction and surface accumulation rates. Deep Sea Res. II, 49,3577–3598.
Strickland, J. and Parsons, T. (1972) A practical handbook of seawateranalysis. Fish. Res. Board Can., 176, 1–310.
Strub, P. T., Mesías, J. M., Montecino, V., Rutllant, J. and Salinas, S.(1998) Coastal ocean circulation off western south America. InRobinson, A. R. and Brink, K. H. (eds.), The Global Coastal Ocean.Harvard University Press, Massachusetts and London, Vol. 11. pp.273–313.
Tanaka, Y. (2004) Coccolith Carbonate Fluxes in the NorthwestPacific Ocean. In Shiyomi, M. et al (eds.), Global Environmental Changein the Ocean and on Land. TERRAPUB, Tokyo, pp. 133–146.
Tomas, C. R. (ed.) (1997) Identifying marine phytoplankton. AcademicPress, San Diego, pp. 1–858.
Townsend, D. W., Keller, M. D., Holligan, P. M., Ackleson, S. G.and Balch, W. M. (1994) Blooms of the coccolithophore Emiliania
huxleyi with respect to hydrography in the Gulf of Maine. Cont. ShelfRes., 14, 979–1000.
Tozzi, S., Schofield, O. and Falkowski, P. (2004) Historical climatechange and ocean turbulence as selective agents for two key phyto-plankton functional groups. Mar. Ecol. Prog. Ser., 274, 123–132.
Triantaphyllou, M. V., Ziveri, P. and Tselepides, A. (2004)Coccolithophore export production and response to seasonal surfacewater variability in the oligotrophic Cretan Sea (NEMediterranean). Micropaleontology, 50, 127–144.
Tyrrell, T. and Young, J. R. (2009) Coccolithophores. In Steele, J. H.,Turekian, K. K., and Thorpe, S. A. (eds.), Encyclopedia of Ocean
Sciences. Academic Press, San Diego, US, pp. 3568–3576.
Utermöhl, H. (1958) Zur vervollkommnung der quantitativenphytoplankton-methodik. Mitt. int. Ver. theor. angew. Limnol., 9, 1–38.
Westbroek, P., Brown, C. W., Van Bleijswijk, J., Brownlee, C.,Brummer, G. J., Conte, M., Egge, J., Fernández, E. et al. (1993) Amodel system approach to biological climate forcing. The exampleof Emiliania huxleyi. Glob. Planet. Change., 8, 27–46.
Winter, A., Rost, B., Hilbrecht, H. and Elbrächter, M. (2002) Verticaland horizontal distribution of coccolithophores in the CaribbeanSea. Geo-Mar. Lett., 22, 150–161.
Winter, A. and Siesser, W. G. (eds.) (1994) Coccolithophores. CambridgeUniversity Press, New York, pp. 242.
Wu, J. (1982) Wind‐stress coefficients over sea surface from breeze tohurricane. J. Geophys. Res., 87, 9704–9706.
Yang, T.-N., Wei, K.-Y. and Gong, G.-C. (2001) Distribution of coc-colithophorids and coccoliths in surface ocean off northeasternTaiwan. Bot. Bull. Acad. Sinica, 42, 287–302.
Young, J. (1994) Function of coccoliths. In Winter, A. and Siesser, W. G.(eds.), Coccolithophores. Cambridge University Press, New York. pp.63–82.
Young, J., Geisen, M. and Cros Miguel, M. (2003) A guide to extantcoccolithophore taxonomy. J. Plankton Res., 1, 1–125.
Young, J. R. and Ziveri, P. (2000) Calculation of coccolith volume andit use in calibration of carbonate flux estimates. Deep Sea Res. II, 47,1679–1700.
Ziveri, P., Broerse, A. T., Van Hinte, J. E., Westbroek, P. and Honjo,S. (2000) The fate of coccoliths at 48 N 21 W, northeasternAtlantic. Deep Sea Res. II, 47, 1853–1875.
Ziveri, P., Thunell, R. C. and Rio, D. (1995) Export production of cocco-lithophores in an upwelling region: results from San Pedro Basin,Southern California Borderlands. Mar. Micropaleontol., 24, 335–358.
Zondervan, I. (2007) The effects of light, macronutrients, tracemetals and CO2 on the production of calcium carbonate andorganic carbon in coccolithophores-a review. Deep Sea Res. II, 54,521–537.
Zondervan, I., Rost, B. and Riebesell, U. (2002) Effect of CO2 concen-tration on the PIC/POC ratio in the coccolithophore Emiliania hux-
leyi grown under light-limiting conditions and different daylengths.J. Exp. Mar. Biol. Ecol., 272, 55–70.
JOURNAL OF PLANKTON RESEARCH j VOLUME j NUMBER j PAGES – j at U
niversidad Austral de C
hile on May 27, 2016
http://plankt.oxfordjournals.org/D
ownloaded from