Journal of Neuroscience Methods - Harvard...
11
Journal of Neuroscience Methods 253 (2015) 233–243 Contents lists available at ScienceDirect Journal of Neuroscience Methods jo ur nal ho me p age: www.elsevier.com/locate/jneumeth Computational Neuroscience Diagnostic tools for evaluating the impact of Focal Axonal Swellings arising in neurodegenerative diseases and/or traumatic brain injury Pedro D. Maia a,∗ , Matthew A. Hemphill b , Brendan Zehnder a , Chenfei Zhang a , Kevin K. Parker b , J. Nathan Kutz a a Department of Applied Mathematics, University of Washington, Seattle, WA 98195-3925, United States b Disease Biophysics Group, Wyss Institute for Biologically Inspired Engineering, Harvard University, Cambridge, MA 02138, United States h i g h l i g h t s • Focal Axonal Swellings (FAS) are pathological features of several brain disorders. • The shape of the FAS play crucial role in spike train propagation impairments. • Our MATLAB toolbox highlights potential trouble spots along axon images. • Promising starting point for novel diagnostic techniques. a r t i c l e i n f o Article history: Received 24 March 2015 Received in revised form 29 June 2015 Accepted 30 June 2015 Available online 16 July 2015 Keywords: Focal Axonal Swelling Traumatic brain injury Concussions Parkinson Alzheimer Multiple Sclerosis Spike train propagation a b s t r a c t Background: Focal Axonal Swellings arise in several leading neurodegenerative diseases of the central nervous system and are hallmark features of concussions and traumatic brain injuries. Recent theories mapped how the shape of each swelling affects the propagation of spike trains and consequently the information encoded in them. Spikes can be selectively deleted, have their speed affected, or blocked depending upon the severity of the swelling. New method: Our computational toolbox extracts meaningful geometrical parameters from sequential images of injured axon segments. The algorithm provides a principled approach for dealing with imaging distortions caused by experimental artifacts in order to extract the cross-section of an axon by detecting local symmetries, turning points and turning regions. Results: Our characterization of the Focal Axonal Swelling allows for an assessment of its impact on spike propagation, leading to a color coding of the axon that highlights problematic regions for information propagation. Comparison with existing methods: Many theoretical works reported distortions in spike propagation related to axonal enlargements. Such estimates, however, were not incorporated to a toolbox that could classify axonal swellings directly from experimental images. Conclusions: Our MATLAB toolbox thus highlights potential trouble spots of axonal morphology, and similar to car traffic maps, identify blocked or impaired routes for information flow. This computational framework is a promising starting point for diagnosing and assessing the impact of axonal swellings implicated in concussions, Alzheimer’s and Parkinson’s disease, Multiple Sclerosis and other neurological pathologies. © 2015 Elsevier B.V. All rights reserved. ∗ Corresponding author. Tel.: +1 206 543 5493. E-mail addresses: [email protected] (P.D. Maia), [email protected] (M.A. Hemphill), [email protected] (B. Zehnder), [email protected] (K.K. Parker), [email protected] (J.N. Kutz). 1. Introduction The existence of discrete swellings along the axon, termed Focal Axonal Swellings (FAS), is widely documented in multi- ple pathologies including Alzheimer’s (Tsai et al., 2004; Krstic and Knuesel, 2012), Parkinson’s (Galvin et al., 1999), Creutzfeldt- Jakob’s (Liberski and Budka, 1999), HIV dementia (Adle-Biassette http://dx.doi.org/10.1016/j.jneumeth.2015.06.022 0165-0270/© 2015 Elsevier B.V. All rights reserved.
Transcript of Journal of Neuroscience Methods - Harvard...

C
DSt
PKa
b
h
••••
a
ARRAA
KFTCPAMS
m(
h0
Journal of Neuroscience Methods 253 (2015) 233–243
Contents lists available at ScienceDirect
Journal of Neuroscience Methods
jo ur nal ho me p age: www.elsev ier .com/ locate / jneumeth
omputational Neuroscience
iagnostic tools for evaluating the impact of Focal Axonalwellings arising in neurodegenerative diseases and/orraumatic brain injury
edro D. Maiaa,∗, Matthew A. Hemphill b, Brendan Zehndera, Chenfei Zhanga,evin K. Parkerb, J. Nathan Kutza
Department of Applied Mathematics, University of Washington, Seattle, WA 98195-3925, United StatesDisease Biophysics Group, Wyss Institute for Biologically Inspired Engineering, Harvard University, Cambridge, MA 02138, United States
i g h l i g h t s
Focal Axonal Swellings (FAS) are pathological features of several brain disorders.The shape of the FAS play crucial role in spike train propagation impairments.Our MATLAB toolbox highlights potential trouble spots along axon images.Promising starting point for novel diagnostic techniques.
r t i c l e i n f o
rticle history:eceived 24 March 2015eceived in revised form 29 June 2015ccepted 30 June 2015vailable online 16 July 2015
eywords:ocal Axonal Swellingraumatic brain injuryoncussionsarkinsonlzheimerultiple Sclerosis
pike train propagation
a b s t r a c t
Background: Focal Axonal Swellings arise in several leading neurodegenerative diseases of the centralnervous system and are hallmark features of concussions and traumatic brain injuries. Recent theoriesmapped how the shape of each swelling affects the propagation of spike trains and consequently theinformation encoded in them. Spikes can be selectively deleted, have their speed affected, or blockeddepending upon the severity of the swelling.New method: Our computational toolbox extracts meaningful geometrical parameters from sequentialimages of injured axon segments. The algorithm provides a principled approach for dealing with imagingdistortions caused by experimental artifacts in order to extract the cross-section of an axon by detectinglocal symmetries, turning points and turning regions.Results: Our characterization of the Focal Axonal Swelling allows for an assessment of its impact on spikepropagation, leading to a color coding of the axon that highlights problematic regions for informationpropagation.Comparison with existing methods: Many theoretical works reported distortions in spike propagationrelated to axonal enlargements. Such estimates, however, were not incorporated to a toolbox that couldclassify axonal swellings directly from experimental images.
Conclusions: Our MATLAB toolbox thus highlights potential trouble spots of axonal morphology, andsimilar to car traffic maps, identify blocked or impaired routes for information flow. This computationalframework is a promising starting point for diagnosing and assessing the impact of axonal swellingsimplicated in concussions, Alzheimer’s and Parkinson’s disease, Multiple Sclerosis and other neurologicalpathologies.© 2015 Elsevier B.V. All rights reserved.
∗ Corresponding author. Tel.: +1 206 543 5493.E-mail addresses: [email protected] (P.D. Maia),
[email protected] (M.A. Hemphill), [email protected]. Zehnder), [email protected] (K.K. Parker), [email protected] (J.N. Kutz).
ttp://dx.doi.org/10.1016/j.jneumeth.2015.06.022165-0270/© 2015 Elsevier B.V. All rights reserved.
1. Introduction
The existence of discrete swellings along the axon, termed
Focal Axonal Swellings (FAS), is widely documented in multi-ple pathologies including Alzheimer’s (Tsai et al., 2004; Krsticand Knuesel, 2012), Parkinson’s (Galvin et al., 1999), Creutzfeldt-Jakob’s (Liberski and Budka, 1999), HIV dementia (Adle-Biassette
234 P.D. Maia et al. / Journal of Neuroscience Methods 253 (2015) 233–243
Fig. 1. Focal Axonal Swellings (FAS) arise in several neurodegenerative diseases, concussions and traumatic brain injuries. Panel A: Transmission electron microscopy imageof axons 3 h post-stretch injury. Modified from Tang-Schomer et al. (2012). Panel B: Image 2 h after dynamic stretch injury of two human neuron populations. Modified fromSmith et al. (1999). Panel C: Image 1 h after stretch injury to guinea pig optic nerve. Modified from Maxwell et al. (1997). The in-vitro stretch injury experiments from PanelsA al swea rstic aM
eety(icFddHnnfK
eMrd(bcMmfb(
efitioK
–C mimic the effects of traumatic brain injuries and concussions. Panel D: Axonmyloidal precursor protein accumulates in axonal compartments. Modified from Kodified from Trapp et al. (1998) and Ferguson et al. (1997).
t al., 1999) and Multiple Sclerosis (Ferguson et al., 1997; Trappt al., 1998). They are also a hallmark feature of concussions andraumatic brain injury (TBI) – the leading cause of death amongoungsters worldwide and a lightning rod issue in contact sportsFainaru-Wada and Fainaru, 2013). Further, TBI is the signaturenjury of the wars in Iraq and Afghanistan, affecting a large per-entage of returning veterans (Jorge et al., 2012; Xiong et al., 2013).ig. 1 depicts a number of FAS resulting from TBI and a variety ofifferent neurodegenerative diseases where they are often used asiagnostic markers (Millecamps and Julien, 2013; Coleman, 2005).owever, the impact that focal swellings have on both neuronal andeural network function is unknown. Therefore, there is a pressingeed to understand how axon morphology relates to its ability to
unction as a conduit for action potential propagation (Maia andutz, 2014a,b; Kolaric et al., 2013).
Many factors can ultimately influence cell morphology, and sev-ral have been reported to influence FAS (Johnson et al., 2013;orrison et al., 2011). TBI studies have demonstrated that FAS can
esult in up to a 30-fold increase in axon diameter, potentiallyue to impaired axonal transport at sites of mechanical traumaTang-Schomer et al., 2012, 2010). Cellular membrane blebbing haseen documented as a precursor to cell death occurring as the cellytoskeleton degrades (Smith et al., 1999; Maxwell et al., 1997).any studies report cognitive, behavioral, perceptual and sensory-otor impairments coinciding with the presence of FAS, yet no
ramework exists to explain the link between these macro-scaleehavioral symptoms and the underlying micro-scale pathologyMagdesian et al., 2012; Hemphill et al., 2011).
In this work we quantify the impact of FAS on informationncoding at the individual neuron level, creating novel metricsor evaluating cognitive impairments. Recent computational stud-es show how geometrical properties of FAS can alter their ability
o faithfully transmit spike train encodings by selectively delet-ng spikes, affecting their speed, reflecting spikes at the swellingr even completely blocking spike trains altogether (Maia andutz, 2014b,a) (see Section 2.1 for details). We develop a seriesllings are implicated in patients with Alzheimer’ s disease where stress-inducednd Knuesel (2012). Panels E and F: Images of FAS pathologies in Multiple Sclerosis.
of algorithms that extract the required geometrical parametersfrom axonal images and color-code FAS according to how severelythey are expected to jeopardize the transmitted information.The effects of injuries in the neuronal network are visualizedmuch like live traffic maps that indicate blocked and/or congestedroads.
To demonstrate the method, we applied our MATLAB toolboxto (i) 11 axon segments of uninjured hippocampal rat neuronswith rich geometrical structures (see Fig. 2A and Shepherd andHarris, 1998) and (ii) some of our own in vitro injured axonsfrom magnetic twisting cytommetry experiments (Hemphill et al.,2011, 2015). Fig. 2 depicts in detail some of the axons that areused for quantifying the effects of FAS. The figure also showshow the methodology presented can be used as an evaluationtool for quantifying the statistical distribution of swellings, thusproviding a neuronal traffic map of signal propagation (or trans-mitted loss) for individual axons as a function of time. Specifically,areas of compromised information transmission are color codedfrom yellow to red to black depending upon the level of injury.It also shows that information propagation changes as a functionof time as swellings grow. Fig. 2B represents the key diagnostictool achieved in this work. We expect this simple-to-use tool-box to be of broad interest to the neuroscience, neurological andbiomedical engineering communities due to the critical role thatFocal Axonal Swellings play in modulating the transmission ofinformation in traumatic brain injuries and/or neurodegenerativediseases.
The paper is outlined as follows. In Section 2, we reviewthe role of axonal geometry in spike-train propagation, from theperspective of formulating a theoretical model to address their spa-tiotemporal dynamics. Section 3 follows this theoretical framingby considering how geometrical parametrizations of the axons are
accomplished in practice. In particular, methods to extract geo-metrical parameters from real data are of vital importance forevaluating loss of information and eventual cognitive deficits. Sec-tion 4 combines the methods of the preceding sections to simulate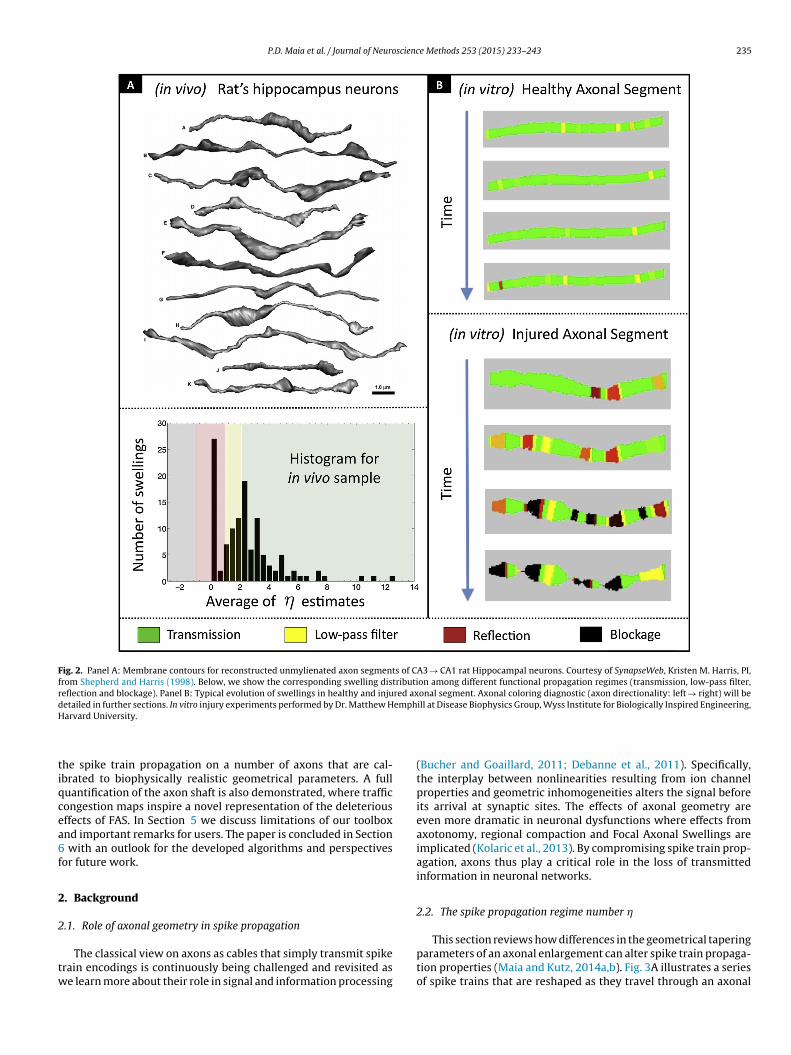
P.D. Maia et al. / Journal of Neuroscience Methods 253 (2015) 233–243 235
Fig. 2. Panel A: Membrane contours for reconstructed unmylienated axon segments of CA3 → CA1 rat Hippocampal neurons. Courtesy of SynapseWeb, Kristen M. Harris, PI,from Shepherd and Harris (1998). Below, we show the corresponding swelling distribution among different functional propagation regimes (transmission, low-pass filter,reflection and blockage). Panel B: Typical evolution of swellings in healthy and injured axonal segment. Axonal coloring diagnostic (axon directionality: left → right) will bedetailed in further sections. In vitro injury experiments performed by Dr. Matthew Hemphill at Disease Biophysics Group, Wyss Institute for Biologically Inspired Engineering,H
tiqcea6f
2
2
tw
arvard University.
he spike train propagation on a number of axons that are cal-brated to biophysically realistic geometrical parameters. A fulluantification of the axon shaft is also demonstrated, where trafficongestion maps inspire a novel representation of the deleteriousffects of FAS. In Section 5 we discuss limitations of our toolboxnd important remarks for users. The paper is concluded in Section
with an outlook for the developed algorithms and perspectivesor future work.
. Background
.1. Role of axonal geometry in spike propagation
The classical view on axons as cables that simply transmit spikerain encodings is continuously being challenged and revisited ase learn more about their role in signal and information processing
(Bucher and Goaillard, 2011; Debanne et al., 2011). Specifically,the interplay between nonlinearities resulting from ion channelproperties and geometric inhomogeneities alters the signal beforeits arrival at synaptic sites. The effects of axonal geometry areeven more dramatic in neuronal dysfunctions where effects fromaxotonomy, regional compaction and Focal Axonal Swellings areimplicated (Kolaric et al., 2013). By compromising spike train prop-agation, axons thus play a critical role in the loss of transmittedinformation in neuronal networks.
2.2. The spike propagation regime number �
This section reviews how differences in the geometrical taperingparameters of an axonal enlargement can alter spike train propaga-tion properties (Maia and Kutz, 2014a,b). Fig. 3A illustrates a seriesof spike trains that are reshaped as they travel through an axonal

236 P.D. Maia et al. / Journal of Neuroscience Methods 253 (2015) 233–243
Fig. 3. Axonal geometry defines spike propagation regime. Panel A: Spike trains can be reshaped as they travel along an axonal enlargement. Individual spikes can have theirspeed changed or even deleted (red). The geometrical tapering parameters [ıB , ıT , ıA] play a key role. Panel B: Explores the parameter space and maps parameter values totheir corresponding regime. Panel C: Transmission regime with speed change. Panel D: Filtering regime, where the second spike is deleted and only the first one transmits.Panel E: Reflection regime, where the pulse splits into two, one propagating forward and the other backwards. The backwards propagating pulse will delete the next pulsei or intet
M
sd
tssmb
ovItewdM
n the spike train sequence. Panel F: Blockage regime, where no spikes transmit. (Fhe web version of this article.)
odified from Maia and Kutz (2014b) and Maia and Kutz (2014a).
welling. Spikes can have their speed changed, reflect or even beeleted (red) depending on the three critical parameters:
ıB = diameter before
ıT = diameter of transition
ıA = diameter after.
By exploring the geometrical parameter space associated withhese parameters (Fig. 3B), it is possible to assess individualwellings and their impact on the propagation of an individualpike. Three possibilities exists (Maia and Kutz, 2014a,b): (i) trans-ission, but potentially with speed changes, (ii) reflection, and (iii)
lockage (deletion).Individual spikes, however, are generically part of a larger cohort
f spike trains. Thus from a broader viewpoint, the effects on indi-idual spikes can be translated to an evaluation of spike trains.ndeed, we can map any given axonal enlargement to its func-ional response on spike train encodings. The following possibilities
xist in order of increasing damage: transmission of the spike trainith speed changes (Fig. 3C), low-pass filtering of high firing ratesue to pile-up collisions and deletions of selected spikes (Fig. 3D)aia and Kutz (2014a), spike reflections that also lead to a low-passrpretation of the references to color in this figure legend, the reader is referred to
filtering on both high and low firing rates (Fig. 3E), and spike trainblockage (Fig. 3F). The relation between the axonal enlargementparameters and the propagation regimes is well captured by thesimple function � (Maia and Kutz, 2014b):
�(ıB, ıT , ıA) = A + BıB + CıT − ıA
=
⎧⎪⎪⎨⎪⎪⎩
� 1 for Transmission
≈ 1 for Filtering
≈ 0 for Reflection
� −1 for Blockage,
(1)
where A = −1.842, B = 2.284 and C = 1.415. This equation predictstrouble regions in axon geometries and will be used throughoutthe rest of the work. We remark that the � estimate needs to becalibrated, as detailed in later sections, to specific physiologicalsettings in order to be of quantitative predictive value. It should benoted that many experimental works corroborate this analysis bydemonstrating that abrupt or gradual changes in the axonal diam-
eter can delay (Manor et al., 1991; Segev and Schneidman, 1999),block (Goldstein and Rall, 1974; Zhou and Bell, 1994; Altembergeret al., 2001; Kolaric et al., 2013) or reflect a single action potential(Ermentrout, 2010; Rinzel, 1990; Altemberger et al., 2001). Such
P.D. Maia et al. / Journal of Neuroscience Methods 253 (2015) 233–243 237
Fig. 4. Extracting axonal cross-section. Panel A: Axonal contours are approximated by patched trapezoids. A non-symmetric trapezoid can be decomposed into a turningr g poih referea
bt
3
meacTiciw
3
f
1
2
3
egion (zoomed) and a symmetric trapezoid (red). One of the vertices is the turninandle nontrivial enlargements such as those in Panel C. (For interpretation of the
rticle.)
iophysical evidence in combination with theoretical studies formhe foundations of the present work.
. Materials and methods
To evaluate the critical parameter � across an axonal seg-ent, the geometrical features of a given axonal swelling must be
xtracted from a time sequence of axonal images. As a first step, wepply techniques from statistical shape analysis to fix distortionsaused by experimental contrast issues in the image acquisition.his technique may be used in combination with more typicalmage-processing tools (enhance contrast, sharpen edges, adjustolors, crop image, etc.) and must be tailored to the specific set ofmages being used. In any case, after accounting for the distortions,
e then extract the axonal cross-section.
.1. Extracting axonal cross-section
We now outline our algorithm to extract axonal cross-sectionsrom the captured images (see Fig. 4):
. Pre-process each image to prune individual axon segments andreduce imaging noise. Convert the image to a grayscale datamatrix Mij whose entries vary between zero (black) and one(white). Enhance contrast by applying a threshold �, i.e., set
Mij ={
0 if Mij < �,
1 if Mij > �.
. Locate upper and lower axonal contour points by verifying
neighboring entries in M where there is a transition from blackto white and vice-versa.. Approximate the axon segment with patched trapezoids, eachcomposed of two vertices in the upper axonal contour and two
nt. Panel B shows other turning point configurations. The algorithm of Section 3.1nces to color in this figure legend, the reader is referred to the web version of this
from the lower axonal contour. The problem is now reduced toextracting the cross-section of each trapezoid.• If the trapezoid is symmetric the discrete cross-section values
are simply the segments connecting the upper contour verticesto the lower contour vertices.
• If the trapezoid is non-symmetric, it can be decomposed intoa turning region patched to a symmetric trapezoid. One of thevertices is the turning point. Our cross-section linearly inter-polates the turning region until the start of the symmetrictrapezoid component. See Fig. 4A for details.
In Fig. 4B we display three prototypical configurations of turningpoints and turning regions. Thus the method can extract the geo-metrical features associated with non-trivial axonal sections suchas those of Fig. 4C. We remark that there is a simple criteria fordetermining which vertex is the turning point. As illustrated inFig. 5A, there are two left angles [�u, �l] associated with a non-symmetric trapezoid. The turning point is always opposite to thelarger angle. By approximating an axon with a set of turning regionspatched to symmetric trapezoids, we can systematically extract itscross-section. The algorithm can be iteratively applied in order torefine the grid as necessary. Fig. 5B applies the algorithm to a typicalaxon segment and the results are illustrated for this process.
3.2. Image correction via Procrustes superimposition
Time lapse fluorescence imaging of axons in vitro providesthe opportunity to visualize changes in axonal morphology. Usingthis technique, changes in axonal shape have been observed inresponse to the application of mechanical force (Magdesian et al.,2012; Hemphill et al., 2011). In order to accurately measure rel-
ative changes in axonal morphology, it is necessary to accountfor potential image distortions that may arise due to changes inlighting, cell marker fluorescence levels, or microscope drift. Thesedistortions can lead to incorrect measurements of the geometrical
238 P.D. Maia et al. / Journal of Neuroscienc
Fig. 5. Criteria to find the turning point. Panel A depicts the left angles [�u , �l]associated to a non-symmetric trapezoid with vertices {u1, u2, l1, l2}. The turningpoint is always the vertex opposed to the larger angle. Panel B shows a typical resultof the axonal cross-section extraction algorithm of Section 3.1.
Fig. 6. Shape comparison after Procrustes superimposition. Panel A: Pictures taken withzoomed segment (green) appears larger than the left zoomed segment (blue) even if noalgorithm in statistical shape analysis that can be used to align arbitrary shapes via scaling, ssuperimposition to the highlighted segments, we obtain the optimal factors to correct the cStatistics and Machine Learning Toolbox for details. (For interpretation of the references t
e Methods 253 (2015) 233–243
parameters of the axon and consequently to a misleading FAS diag-nosis (see Fig. 6A). Procrustes analysis can be utilized in order toproperly compare the shape of two or more objects in a sequenceby optimally translating, rotating, and scaling the objects, prior orafter measuring its morphological parameters. Fig. 6B illustratesthis methodology pictorially for a few arbitrary shapes. The sameprinciples can also be applied to axon segments.
In statistical shape analysis, a shape S is defined as a collection ofdata points where their cartesian coordinates are stored in a matrix.In the context of an axon, it refers to all the points comprising theaxon segment and/or its contour. To optimally superimpose shapeSA to shape SB we minimize what is called the Procrustes distancebetween these objects:
find scaling factor b > 0, a rotation matrix R,and a shift vector c
to minimize ||SB − b · SA · R + c||2,(2)
where the goodness-of-fit criterion is the sum of squared errors.This step may be used to improve a set of images before radiusextraction or used to correct the extracted radii afterwards. Fig. 6Cexemplifies a contrast issue successfully resolved using the least-square optimization procedure procrustes.m. from the MATLABStatistics and Machine Learning Toolbox.
3.3. Characterizing spike propagation
By using the extracted cross sections of the axonal geometry,such as the one in the bottom panel of Fig. 5, the FAS can be
a 5 min interval display contrast problems from experimental artifacts. The right significant biological change occurred. Panel B: Procrustes superimposition is anhifting, rotation and/or a combination of such effects. Panel C: By applying Procrustesontrast issues. See Section 3.2 and the procedure procrustes.m. from the MATLAB
o color in this figure legend, the reader is referred to the web version of this article.)

P.D. Maia et al. / Journal of Neuroscience Methods 253 (2015) 233–243 239
Fig. 7. � estimates from axonal cross-sections (axon directionality: left → right). Panel A illustrates the sliding window method with two window sizes and their corresponding� sectioP e sam(
cafa1ipw
pcFp
estimates. Panel B illustrates the minima/maxima method with the axonal cross-anel C illustrates the 10–90% rule regarding total diameter change and Panel D: thtop), swelling locations (middle) and the corresponding � estimates (bottom).
haracterized along the axon segment. The characterization of thexon segment is done by evaluating the parameter �(ıB, ıT, ıA) as aunction of distance down the axon. However, the effects of � weressociated with the highly idealized geometric structure of Section. Real axons have much more challenging geometries then the
dealized case, thus requiring further innovations around how torocess their structure. The following algorithm is a principleday to deal with the complications of more realistic structures.
Sliding windows. The idea behind this method is to slide
arameter-extracting windows of various sizes along the axonalross-section plots. This technique is reminiscent of a windowedourier transform where time-frequency localization can be com-uted with a spectrogram. Here, the sliding window is used insteadn (top), swelling locations (middle) and the corresponding � estimates (bottom).e rule regarding total area change. Panels C and D show the axonal cross-section
to capture FAS events and the geometrical associated with them.See Fig. 7A for an example. As the window slides, it follows somerules to extract [ıB, ıT, ıA] from the portions of the axonal diameterd(x) contained in it. Specifically:
1. Set the length L of the parameter-extracting window and letdmax = d(xmax) be the maximal diameter value contained in [x,x + L].
2. If xmax is the first point in the window, set
ıB = dmax, ıT = L, and, ıA = d(x + L),

240 P.D. Maia et al. / Journal of Neuroscience Methods 253 (2015) 233–243
Fig. 8. Four axon segments modified from SynapseWeb, Kristen M. Harris, PI, from Shepherd and Harris (1998). Each axon segment is color-coded spatially according to thepropagation regime number � (axon directionality: left → right). Different criteria lead to different � estimates, and there are multiple ways to integrate them: best cases ts arer AS (cow
cacami
loia
ı
Ciwsaflat
ataoett
m(cta
cenario (BCS), average estimates (AES) and worst case scenario (WCS). These plooutes for signal flow. This framework could lead to important improvements in Fhich they are implicated.
otherwise, set
ıB = d(x), ıT = xmax − x, and, ıA = dmax.
As we slide the parameter-extracting window, � is continuouslyalculated along the axon segment. Estimates of � vary consider-bly with the window lengths (see Fig. 7A); larger windows canontain multiple FAS whereas smaller windows may not capturen entire swelling due to the limited window size. The methoday also handle swollen and non-swollen regions of the axon
ndistinguishably.Minima and maxima. To refine the estimates above, we recalcu-
ate � for each FAS. They are located by properly pairing the extremaf the diameter function, with each swelling starting at a local min-mum xmin and ending at the next local maximum xmax. Then, wessign for each located swelling:
B = d(xmin), ıT = xmax − xmin, and, ıA = d(xmax).
onstant values of � for each swelling provide clearer diagnosticnterpretations (see Fig. 7B). This method works well for swellings
ith linear diameter growth but might fail for those with sigmoidhapes. If the detected swellings include large flat sections of thexonal diameter, ıT can grow disproportionately to ıA and ıB. Sinceat regions are not expected to interfere significantly with the prop-gating signal (Maia and Kutz, 2014b), it helps to trim them off fromhe detected swellings.
The 10–90% rule. To revise the swelling’s endpoints, we borrown idea from electronic signal processing (Marcuse, 1974): we sethe left and right limits where the total diameter increase – or totalrea increase – reaches 10% and 90% respectively, hence the namef the rule. The � estimates are now calculated from the revisedndpoints (see Fig. 7C and D). The two variants of the rule agree inhe majority of cases and return values of � typically smaller thanhe other methods.
Combining estimates. These algorithms produce a set of � esti-ates which we combine in different ways: (1) best-case scenario,
2) worst-case scenario and (3) average estimates. In the best/worsease scenario we overwrite sliding window estimates with thoseaken from the extrema and/or 10–90% rules. In the third case, weverage all estimates along the axonal axis. These various estimates
analogous to car traffic maps (bottom left) that can identify blocked or impairedgnitive deficit) diagnostics and to our understanding of the several pathologies in
for � are pursued in order to provide a more robust measure of theeffects associated with FAS.
4. Results
Our combined algorithms color-code swellings along axonalsegments as displayed in Fig. 8; we show four axonal segmentsfrom the set of SynapseWeb, Kristen M. Harris, PI, from Shepherdand Harris (1998). The plots are analogous to traffic maps thatdepict congested areas of traffic by color coding. Specifically thistraffic map can identify – for spike train encodings and signal flow –blocked or impaired routes. One should simply keep track of wherethe color changes from green to yellow (filtering of spikes), to red(spike reflection), or to black (spike blockage), in order to identifyregions where transmitted information is lost.
We used three different criteria to combine the multiple �estimates: best case scenario (BCS), average estimates (AES) andworst case scenario (WCS). They can differ significantly in theassessment of the propagation regimes; However, having multi-ple ways to combine � estimates allow more flexibility to calibrateour geometrical measurements to the specific physiological sett-ings of the analyzed neuron. In Fig. 8, for example, we normalizedthe geometrical parameters such that the smallest cross-sectionvalue of our sample to matches the smallest radius of the sim-ulations in Maia and Kutz (2014b). This matching step is notuniversal (since the �-parameters are given in non-dimensionalunits) and may vary depending on the properties of the axonsinvolved. Hence, when we display a critical enlargement, it is rela-tive only to neurons of the same organism and type. The rationaleis that the user will calibrate the toolbox to his/her own dataset,trying to:
1. Study the natural changes in the geometry of healthy axons andthe statistics of their geometrical parameters.
2. Enforce � � 1, i.e., spike propagation in transmission regime for
these axons.3. Find � < 1 for large and/or abrupt axonal swellings for injuredaxons. This is a good indication that trouble in spike propagationmight occur in that swelling.

scienc
oiaiac
5
cc
5
narstpcrtefsrf
6
io(bWstmpwttriS
aaeeatA11iri
P.D. Maia et al. / Journal of Neuro
The theoretical predictions of blockage, reflection, or filteringf spikes may not match since there are many other factors thatnfluence neuronal electrophysiology (see Section 5). The maindvantage of the method is the ability to compare swellings of var-ous shapes relative to each other. We believe this framework is
promising starting point for diagnosing axonal swellings impli-ated in several neuropathologies.
. Discussion
In this section we make important remarks for users and dis-uss limitations of the underlying theoretical framework and of theomputational toolbox.
.1. Calibrating estimates to specific datasets
The calibration process demonstrated above is critical in diag-osing neuronal injury. Specifically, geometrical parameters forxons can vary significantly between species (e.g., human versusodent versus the giant squid axon). Additionally, within a givenpecies neurons can be substantially different depending uponheir functionality and/or region in which they are active (e.g., hip-ocampal versus cortical neurons). Finally, the composition of theytoskeleton determines many of the elastic properties of a neu-on, making some neurons potentially more prone to FAS injuryhan others. Thus in the calibration process, it is imperative tovaluate neurons drawn independently from the same class and/orunctional areas. Interestingly, the variety of neurons present in aingle species suggests a comparative study aimed at evaluating theobustness of different neuron types to injury. This will be exploredurther in future work.
. Limitations of theoretical estimates
The �-regime framework was pointed out to have several lim-tations. In fact, Maia and Kutz (2014b) wrote explicitly in theirriginal paper: “The biophysics of our AP model is over-simplified...), but it can be improved by adding synapses, non-uniform distri-utions of ion channels and a more complete set of ionic currents.e assumed, for example, that the varicosities were made of the
ame material as the axoplasm. It is likely that a constant resis-ivity value along the entire axon might not hold. Additionally,
ost axonal varicosities contained mitochondria (that regulateresynaptic Ca2+) or other possibly electrically active vesicles thatere not taken into account by our model. Better quantification of
heir electrophysiological properties and others, such as distribu-ions of ion channels, pumps, buffers and other molecules, will beequired for ideal biophysical modeling.” Still, anomalous changesn geometry are an important proxy to harmful Focal Axonalwellings.
The estimation method presented is also limited to local prop-gation properties of Action Potential (AP), i.e., anomalous effectsre constrained to the vicinity of each FAS. However, some of theseffects might affect signal transmission along the entire neuron. Forxample, when there is AP reflection due to FAS the entire proximalxonal segment would no longer allow normal transmission dueo collision of orthodromic and antidromic APs. In fact, reflectedPs have been observed in a variety of neuronal systems (Baccus,998; Baccus et al., 2000; Debanne et al., 2011; Goldstein and Rall,
974; Parnas, 1979; Ramon et al., 1975). This makes diagnosingnjured axons even harder, since the source/cause of spatiotempo-al anomalies might be relatively far from where they are observedn the axon.
e Methods 253 (2015) 233–243 241
6.1. Limitations of the computational toolbox
It is hard to anticipate the properties of multiple types of axonalimages produced by different experimental setups regarding col-ors, scales, resolution, etc. Our toolbox is in its infancy andconsequently can only handle a few formats in an automated way.In extracting the axonal contour, the cut-off frequency of the lowpass filter may need adjustments depending on the image resolu-tion. Too much smoothing would affect the � value since the abruptchange of the diameter is critical for the axonal conduction. Also, ifnoisy pixels exist outside the axon, it may overestimate the axonaldiameters. Finally, the precision and limits of the computationaltoolbox may vary. There will be a chance that normal varicosi-ties may be interpreted as pathological swellings and vice versa,since the � criterion is purely geometrical. The toolbox will workbetter when swellings arising from traumatic axonal injury are sig-nificantly different than natural varicosities. Results are likely toimprove if the user tracks the geometry of the same axon beforeand after injury to discount for natural varicosities.
Despite all limitations described above, we would argue thatchanges in morphology do give important clues of trouble spots forspike propagations. The � estimates are – with all their flaws – thebest currently available theoretical relations between axonal geom-etry and spike propagation (Maia and Kutz, 2014b,a). The carefulextraction of geometrical parameters from complex morphologiesis not straightforward and required specialized algorithms in someharder cases. Finally, we expect to develop better methodologies,protocols and standards to improve these issues in future works,taking into account our future user’s feedback and requests.
7. Conclusion
Focal Axonal Swellings (FAS) are ubiquitous to some of themost prominent neuro-degenerative diseases of the central ner-vous system such as Alzheimer’s and Parkinson’s diseases, MultipleSclerosis and others (Millecamps and Julien, 2013; Coleman, 2005;Tsai et al., 2004; Krstic and Knuesel, 2012; Galvin et al., 1999;Liberski and Budka, 1999; Adle-Biassette et al., 1999; Fergusonet al., 1997; Trapp et al., 1998). FAS are also hallmark features of con-cussions and traumatic brain injuries (Fainaru-Wada and Fainaru,2013; Jorge et al., 2012; Xiong et al., 2013).
This work reinforces recent findings that the shape of the FAS areessential for assessing the post-injury capabilities of axons (Maiaand Kutz, 2014a,b; Kolaric et al., 2013; Altemberger et al., 2001). TBIstudies demonstrate that FAS can induce up to a 30-fold increasein axon diameter (Tang-Schomer et al., 2012, 2010). Here we com-bined geometrical tapering parameters with theoretical estimatesto provide valuable insight on critical regions for spike propagation;Large swellings with a smooth cross-sectional increase might notsignificantly alter electrophysiological signaling whereas smallerFAS with abrupt diameter changes are especially prone to blockageor loss of transmitted information.
It is important to recognize the role of FAS geometry for thebroader research community especially when there are no well-established protocols to measure geometrical properties of FAS(Magdesian et al., 2012; Hemphill et al., 2011; Smith et al., 1999;Maxwell et al., 1997). In fact, it can be challenging to character-ize FAS geometry in a principled, general, and adaptive way. Thus,we developed novel algorithms and/or tailored existing ones toaddress the need to better classify, quantify, and diagnose FAS.We used procrustes superimposition to fix image artifacts and
extracted axonal cross-section with patched trapezoids alternatedwith turning regions. From these cross-section results, we useddifferent rules (sliding windows, maxima and minima, 10–90%rule) to estimate the tapering parameters [ıB, ıT, ıA] (see Fig. 3A)
2 scienc
np
ersibi
rpMnpdt(Mmecrtici
A
vb
12
3
4
5
sptodrr
raaiw
wmcmwc
42 P.D. Maia et al. / Journal of Neuro
ecessary to calculate the � estimates and the corresponding spikeropagation regime (see Eq. (1)).
Some of the limitations of our work include the fact that the �stimates were derived for unmylienated FitzHugh-Nagumo neu-on models (Maia and Kutz, 2014a,b). This model might not beuited for all physiological settings and may require specific cal-brations and/or other adjustments. Regardless, if new � estimatesecome available for different neuronal settings, they can be easily
ncorporated into the MATLAB toolbox developed for this work.Overall, one of the challenging aspects of research in neu-
odegenerative diseases and TBI is understanding how neuronalathologies developed at a cellular level (Johnson et al., 2013;orrison et al., 2011) compromise the functionality of an entire
etwork of neurons. Many studies reported cognitive, behavioral,erceptual and sensory-motor impairments resulting from suchisorders, yet no framework could link these macro scale symptomso the FAS pathologies observed at the cellular level, or micro scaleMagdesian et al., 2012; Hemphill et al., 2011; Smith et al., 1999;
axwell et al., 1997). Our toolbox provides – in analogy to car trafficaps – a way to identify blocked or impaired routes for spike train
ncodings and signal flow. By keeping track of where axonal color-ode changes from green to yellow (filtering of spikes), to red (spikeeflection), or to black (spike blockage), an evaluation of poten-ial cognitive impairment can be made. We believe this frameworks a promising starting point for diagnosing axonal swellings andonsequently the neurodegeneratve disorders in which they aremplicated.
ppendix A. MATLAB Toolbox
Our toolbox is compatible with MATLAB’s R2014b and R2012bersions, and require functions from the Curve Fitting Toolbox. Theasic outline of the code is to
. Select an axon image with imread command.
. Extract the axonal membrane contours with core axonradius.m.
. Create a structure to store � estimates and other important geo-metrical parameters with core axon structure.m.
. Plot and display these estimates with core axon structureplots.m.
. Color-code the axon with a customized colormap using thecore painter.m function.
Axon images must depict a single horizontally displayed axonaltructure (in white) tightly cropped against a black background,referentially in JPEG format. The axon directionality is assumedo be from left to right. For examples see the pre-processed setf membrane contours {KH01.jpg, KH02.jpg, . . ., KH11.jpg} thatepicts reconstructed unmylienated axon segments of CA3 → CA1at Hippocampal neuron – courtesy of SynapseWeb, Kristen M. Har-is, PI, from Shepherd and Harris (1998).
Run demo1.m to see the original KH08.jpg axonal image, the cor-esponding cross-section along it’s straightened axis (like in Fig. 5B)nd several � estimates (like in Fig. 7). It is straightforward to selectnother axon from the set by changing the name in the imread linen the core painter.m file. We suggest users to modify demo1.m
hen trying to use their own datasets.Run demo2.m to color-code all 11 axons from the dataset
ith all three different criteria to combine the multiple � esti-ates: best case scenario (BCS), average estimates (AES) and worst
ase scenario (WCS). The core painter.m function might notatch the increases in radius exactly and distortions are higherhen the axon is bended, twisted or asymmetric. Thus, the color-
oded axons should be regarded as a proxy for the more precise
e Methods 253 (2015) 233–243
core axon structure plots.m. See the companion pdf file fordetails.
References
Adle-Biassette H, Chretien F, Wingertsmann L, Hery C, Ereau T, Scaravilli F, Tardieu M,Gray F. Neuronal apoptosis does not correlate with dementia in HIV infectionbut is related to microglial activation and axonal damage. Neuropathol ApplNeurobiol 1999];25:123–33.
Altemberger R, Lindsay K, Ogden J, Rosenberg J. The interaction between membranekinetics and membrane geometry in the transmission of action potentials innon-uniform excitable fibres: a finite element approach. J Neurosci Methods2001];112:101–17.
Baccus S. Synaptic facilitation by reflected action potentials: enhancement of trans-mission when nerve impulses reverse direction at axon branch points. Proc NatlAcad Sci 1998];95(14):8345–50.
Baccus S, Burrell B, Sahley C, Muller K. Action potential reflection and failure at axonbranch points cause stepwise changes in EPSPs in a neuron essential for learning.J Neurophysiol 2000];83(3):1693–700.
Bucher D, Goaillard JM. Beyond faithful conduction: short term dynamics, neuro-modulation, and log-term regulation of spike propagation in the axon. ProgNeurobiol 2011];94:307–46.
Coleman M. Axon degeneration mechanisms: commonality amid diversity. Nat RevNeurosci 2005];6(11):889–98.
Debanne D, Campanac E, Bialowas A, Carlier E, Alcaraz G. Axon physiology. PhysiolRev 2011];91:555–602.
Ermentrout G. Mathematical foundations of neuroscience. Springer; 2010].Fainaru-Wada M, Fainaru S. League of denial: the NFL, concussions, and the battle
for truth. Crown Archetype 2013].Ferguson B, Matyszak MK, Esiri MM, Perry VH. Axonal damage in acute multiple
sclerosis lesions. Brain 1997];120:393–9.Galvin JE, Uryu K, Lee VM, Trojanowski JQ. Axon pathology in Parkinson’s disease
and lewy body dementia hippocampus contains ˛-, ˇ-, and � -synuclein. ProcNatl Acad Sci 1999];96:13450–5.
Goldstein S, Rall W. Changes of action potential shape and velocity for changing coreconductor geometry. Biophys J 1974];14:731–57.
Hemphill M, Dabiri B, Gabriele S, Kerscher L, Franck C, Goss J, Alford P, ParkerK. A possible role for integrin signaling in diffuse axonal injury. PLoS ONE2011];6(7):e22899.
Hemphill M, Dauth S, Yu CJ, Dabiri B, Parker K. Traumatic brain injury and theneuronal microenvironment: a potential role for neuropathological mechan-otransduction. Neuron 2015];86(6):1177–92.
Johnson VE, Stewart W, Smith DH. Axonal pathology in traumatic brain injury. ExpNeurol 2013];246:35–43.
Jorge RE, Acion L, White T, Tordesillas-Gutierrez D, Pierson R, Crespo-Facorro B,Magnotta V. White matter abnormalities in veterans with mild traumatic braininjury. Am J Psychiatry 2012];169(12):1284–91.
Kolaric KV, Thomson G, Edgar JM, Brown AM. Focal axonal swellings and associatedultrastructural changes attenuate conduction velocity in central nervous systemaxons: a computer modeling study. Physiol Rep 2013];1(3):e00059.
Krstic D, Knuesel I. Deciphering the mechanism underlying late-onset Alzheimerdisease. Nat Rev Neurosci 2012];9(1):25–34.
Liberski PP, Budka H. Neuroaxonal pathology in Creutzfeldt-Jakob disease. Acta Neu-ropathol 1999];97:329–34.
Magdesian MH, Sanchez FS, Lopez M, Thostrup P, Durisic N, Belkaid W, Liazoghli D,Grütter P, Colman R. Atomic force microscopy reveals important differences inaxonal resistance to injury. Biophys J 2012];103(3):405–14.
Maia PD, Kutz JN. Compromised axonal functionality after neurodegeneration, con-cussion and/or traumatic brain injury. J Comput Neurosci 2014a];27:317–32.
Maia PD, Kutz JN. Identifying critical regions for spike propagation in axon segments.J Comput Neurosci 2014b];36(2):141–55.
Manor Y, Koch C, Segev I. Effect of geometrical irregularities on propagation delayin axonal trees. Biophys J 1991];60:1424–37.
Marcuse D. Theory of dielectric optical waveguides. Academic Press; 1974].Maxwell WL, Povlishock JT, Graham DL. A mechanistic analysis of nondisruptive
axonal injury: a review. J Neurotrauma 1997];17(7):419–40.Millecamps S, Julien J. Axonal transport deficits and neurodegenerative diseases. Nat
Rev Neurosci 2013];14(161):161–76.Morrison B, Elkin BS, Dolle JP, Yarmush ML. In vitro models of traumatic brain injury.
Ann Rev Biomed Eng 2011];13(1):91–126.Parnas I. Propagation in nonuniform neurites: form and function in axons. The Neu-
rosciences. Cambridge: MIT Press; 1979]. p. 499–512.Ramon F, Joyner R, Moore J. Propagation of action potentials in inhomogeneous axon
regions. Fed Proc 1975];34:1357–63.Rinzel J. Mechanisms for nonuniform propagation along excitable cables. Ann N Y
Acad Sci 1990];591.Segev I, Schneidman E. Axons as computing devices: basic insights gained from
models. J Physiol 1999];93:263–70.Shepherd G, Harris K. Three-dimensional structure and composition of ca3 to ca1
axons in rat hippocampal slices: implications for presynaptic connectivity andcompartmentalization. J Neurosci 1998];18(20):8300–10.
Smith D, Wolf J, Lusardi T, Lee V, Meaney D. High tolerance and delayedelastic response of cultured axons to dynamic stretch injury. J Neurosci1999];19(11):4263–9.

scienc
T
T
T
2004];7:1181–3.Xiong Y, Mahmood A, Chopp M. Animal models of traumatic brain injury. Nat Rev
P.D. Maia et al. / Journal of Neuro
ang-Schomer MD, Johnson VE, Baas PW, Stewart W, Smith DH. Partial inter-ruption of axonal transport due to microtubule breakage accounts for theformation of periodic varicosities after traumatic axonal injury. Exp Neurol2012];233:364–72.
ang-Schomer MD, Patel A, Bass PW, Smith DH. Mechanical breaking of microtubulesin axons during dynamic stretch injury underlies delayed elasticity, microtubuledisassembly, and axon degeneration. FASEB J 2010];24(5):1401–10.
rapp B, Peterson J, Ransohoff R, Rudick R, Mrk SBL. Axonal transection in the lesionsof multiple sclerosis. N Engl J Med 1998];338:278–85.
e Methods 253 (2015) 233–243 243
Tsai J, Grutzendler J, Duff K, Gan WB. Fibrillar amyloid deposition leads to localsynaptic abnormalities and breakage of neuronal branches. Nat Neurosci
Neurosci 2013];14(22):128–42.Zhou Y, Bell J. Study of propagation along nonuniform excitable fibers. Math Biosci
1994];119(2):169–203.