
Journal of Molecular Structuredrgrdillip.weebly.com/uploads/9/5/5/5/9555734/j_mol...K. Munirathnam...
7
Investigations on surface chemical analysis using X-ray photoelectron spectroscopy and optical properties of Dy 3þ -doped LiNa 3 P 2 O 7 phosphor K. Munirathnam a , G.R. Dillip b, ** , Shivanand Chaurasia c , S.W. Joo b, *** , B. Deva Prasad Raju d, * , N. John Sushma e a Department of Physics, Sri Venkateswara University, Tirupati 517 502, India b School of Mechanical Engineering, Yeungnam University, Gyeongsan 712 749, South Korea c High Pressure & Synchrotron Radiation Physics Division, Bhabha Atomic Research Centre, Mumbai 400 085, India d Department of Future Studies, Sri Venkateswara University, Tirupati 517 502, India e Department of Biotechnology, Sri Padmavathi Women's University, Tirupati 517 502, India article info Article history: Received 13 January 2016 Received in revised form 4 April 2016 Accepted 4 April 2016 Available online 6 April 2016 Keywords: Pyrophosphate Solid-state reaction X-ray photoelectron spectroscopy White light abstract Near white-light emitting LiNa 3 P 2 O 7 :Dy 3þ phosphors were prepared by a conventional solid-state re- action method. The orthorhombic crystal structure of the phosphors was confirmed using X-ray diffraction (XRD), and the valence states of the surface elements were determined from the binding energies of Li 1s, O 1s, Na 1s, P 2p, and Dy 3d by X-ray photoelectron spectroscopy (XPS). Attenuated total reflectance (ATR) - Fourier transform infrared (FT-IR) spectroscopy was employed to identify the pyro- phosphate groups in the phosphors. Diffuse reflectance spectra (DRS) show the absorption bands of the Dy 3þ ions in the host material. Intense blue (481 nm) and yellow (575 nm) emissions were obtained at an excitation wavelength of 351 nm and are attributed to the 4 F 9/2 / 6 H 15/2 and 4 F 9/2 / 6 H 13/2 transitions of Dy 3þ ions, respectively. The combination of these two intense bands generates light emission in the near- white region of the chromaticity diagram. © 2016 Elsevier B.V. All rights reserved. 1. Introduction Over the past few years, there has been increasing demand for luminescent materials for a wide range of applications, including plasma display panels (PDPs), Hg-free lamps, liquid crystal display (LCD) backlights, and quickly commercializing solid-state lighting (SSL) sources [1,2]. SSL devices have several advantages for lighting like significant power savings, longer lifetime, higher luminous efficiency, and environmental friendliness compared to conven- tional incandescent or fluorescent lamps [3]. Phosphor-converted light-emitting diodes (pc-LEDs) have received great attention due to their stable color, good color re- producibility, and higher color rendering indexes compared to RGB (red, green, and blue) LEDs. SSL devices based on pc-LEDs are commercializing quickly, but they suffer from various disadvan- tages like a poor color-rendering index (CRI) and low stability of the color temperature (CCT) [4e6]. To overcome these weaknesses, researchers have made numerous efforts to develop single-phase phosphors for white light generation. Various approaches are used to obtain white light emission in a single-phase host. The four following approaches are mainly considered for single-host white- emitting phosphors [3,7]: (i) introducing a suitable rare-earth (RE) ion (Eu 3þ , Dy 3þ , etc.) into the appropriate single-phase host matrix [8,9]; (ii) combining different RE ions (Tm 3þ /Dy 3þ , Eu 2þ /Tb 3þ / Mn 2þ , etc.) with various emissions (red, green, blue, or yellow) [10,11]; (iii) selective co-doping of ion pairs (Ce 3þ / Mn 2þ , Eu 2þ / Mn 2þ , etc.) via an energy transfer mechanism [12,13]; and (iv) inducing appropriate defects in the luminescent materials (defect-related emissions) [14]. A suitable host matrix and dopant ion is important for obtaining a single-phase white-lighting phosphor. Phosphate-based phos- phors are an important family of luminescent materials because of their excellent properties, such as a large band gap, high absorption * Corresponding author. ** Corresponding author. *** Corresponding author. E-mail addresses: [email protected] (G.R. Dillip), [email protected] (S.W. Joo), [email protected] (B. Deva Prasad Raju). Contents lists available at ScienceDirect Journal of Molecular Structure journal homepage: http://www.elsevier.com/locate/molstruc http://dx.doi.org/10.1016/j.molstruc.2016.04.004 0022-2860/© 2016 Elsevier B.V. All rights reserved. Journal of Molecular Structure 1118 (2016) 117e123
Transcript of Journal of Molecular Structuredrgrdillip.weebly.com/uploads/9/5/5/5/9555734/j_mol...K. Munirathnam...

lable at ScienceDirect
Journal of Molecular Structure 1118 (2016) 117e123
Contents lists avai
Journal of Molecular Structure
journal homepage: ht tp: / /www.elsevier .com/locate/molstruc
Investigations on surface chemical analysis using X-ray photoelectronspectroscopy and optical properties of Dy3þ-doped LiNa3P2O7phosphor
K. Munirathnam a, G.R. Dillip b, **, Shivanand Chaurasia c, S.W. Joo b, ***,B. Deva Prasad Raju d, *, N. John Sushma e
a Department of Physics, Sri Venkateswara University, Tirupati 517 502, Indiab School of Mechanical Engineering, Yeungnam University, Gyeongsan 712 749, South Koreac High Pressure & Synchrotron Radiation Physics Division, Bhabha Atomic Research Centre, Mumbai 400 085, Indiad Department of Future Studies, Sri Venkateswara University, Tirupati 517 502, Indiae Department of Biotechnology, Sri Padmavathi Women's University, Tirupati 517 502, India
a r t i c l e i n f o
Article history:Received 13 January 2016Received in revised form4 April 2016Accepted 4 April 2016Available online 6 April 2016
Keywords:PyrophosphateSolid-state reactionX-ray photoelectron spectroscopyWhite light
* Corresponding author.** Corresponding author.*** Corresponding author.
E-mail addresses: [email protected] (G.R. [email protected] (B. Deva Prasad Raju).
http://dx.doi.org/10.1016/j.molstruc.2016.04.0040022-2860/© 2016 Elsevier B.V. All rights reserved.
a b s t r a c t
Near white-light emitting LiNa3P2O7:Dy3þ phosphors were prepared by a conventional solid-state re-
action method. The orthorhombic crystal structure of the phosphors was confirmed using X-raydiffraction (XRD), and the valence states of the surface elements were determined from the bindingenergies of Li 1s, O 1s, Na 1s, P 2p, and Dy 3d by X-ray photoelectron spectroscopy (XPS). Attenuated totalreflectance (ATR) - Fourier transform infrared (FT-IR) spectroscopy was employed to identify the pyro-phosphate groups in the phosphors. Diffuse reflectance spectra (DRS) show the absorption bands of theDy3þ ions in the host material. Intense blue (481 nm) and yellow (575 nm) emissions were obtained at anexcitation wavelength of 351 nm and are attributed to the 4F9/2 /
6H15/2 and4F9/2 /
6H13/2 transitions ofDy3þ ions, respectively. The combination of these two intense bands generates light emission in the near-white region of the chromaticity diagram.
© 2016 Elsevier B.V. All rights reserved.
1. Introduction
Over the past few years, there has been increasing demand forluminescent materials for a wide range of applications, includingplasma display panels (PDPs), Hg-free lamps, liquid crystal display(LCD) backlights, and quickly commercializing solid-state lighting(SSL) sources [1,2]. SSL devices have several advantages for lightinglike significant power savings, longer lifetime, higher luminousefficiency, and environmental friendliness compared to conven-tional incandescent or fluorescent lamps [3].
Phosphor-converted light-emitting diodes (pc-LEDs) havereceived great attention due to their stable color, good color re-producibility, and higher color rendering indexes compared to RGB
), [email protected] (S.W. Joo),
(red, green, and blue) LEDs. SSL devices based on pc-LEDs arecommercializing quickly, but they suffer from various disadvan-tages like a poor color-rendering index (CRI) and low stability of thecolor temperature (CCT) [4e6]. To overcome these weaknesses,researchers have made numerous efforts to develop single-phasephosphors for white light generation. Various approaches areused to obtain white light emission in a single-phase host. The fourfollowing approaches are mainly considered for single-host white-emitting phosphors [3,7]: (i) introducing a suitable rare-earth (RE)ion (Eu3þ, Dy3þ, etc.) into the appropriate single-phase host matrix[8,9]; (ii) combining different RE ions (Tm3þ/Dy3þ, Eu2þ/Tb3þ/Mn2þ, etc.) with various emissions (red, green, blue, or yellow)[10,11]; (iii) selective co-doping of ion pairs (Ce3þ / Mn2þ,Eu2þ / Mn2þ, etc.) via an energy transfer mechanism [12,13]; and(iv) inducing appropriate defects in the luminescent materials(defect-related emissions) [14].
A suitable host matrix and dopant ion is important for obtaininga single-phase white-lighting phosphor. Phosphate-based phos-phors are an important family of luminescent materials because oftheir excellent properties, such as a large band gap, high absorption

Fig. 1. XRD patterns of LiNa3P2O7:Dy3þ phosphor (Dy3þ ¼ 5e11 mol%).
K. Munirathnam et al. / Journal of Molecular Structure 1118 (2016) 117e123118
of PO3�4 in the UV region (300e400 nm), cheaper raw materials,
simple synthesis conditions, high thermal and chemical stability,and exceptional optical damage threshold [9,15]. Phosphate-basedphosphors are a good host matrix for RE ion transitions. Theinteraction between the RE ions is weak in these matrices becausethe RE ions are separated from each other by the phosphate groups[16]. Therefore, one can expect good optical properties from thesematerials.
Among the various lanthanide ions, trivalent dysprosium ions(Dy3þ) have attracted significant attention since dysprosium-dopedphosphors can be used in fluorescent lamps as a tricolor compo-nent and single-phase full-color phosphor in pc-LEDs [17]. Under n-UV excitation, there are generally three consistent bands in thevisible region, including blue (470e500 nm), yellow (570e600 nm),and feeble red (670 nm) emissions, which are achieved when Dy3þ
ions are incorporated in wide-band-gap host materials. Thesebands are associated with the hypersensitive electric dipole (ED)4F9/2/ 6H15/2, 13/2 transition and optical 4F9/2/ 6H11/2 transition inDy3þ ions [18,19].
One strategy to achieve white light emission is adjusting theratio of yellow to blue emission intensity, which reflects the coor-dination surroundings of the Dy3þ ion. Doping Dy3þ into anappropriate host is another strategy to obtain potential candidatesfor industrial applications [20]. In the present work, a simple andinexpensive phosphate host matrix and a suitable single RE dopant(Dy3þ) ion were investigated for their suitability in single-phaseemission in the white light region. To the best of our knowledge,the optical properties of LiNa3-xP2O7: xDy3þ phosphor has not beenreported previously. The surface chemical composition of the ele-ments in the phosphors was studied in detail by X-ray photoelec-tron spectroscopy.
2. Experimental
2.1. Synthesis
Polycrystalline powders of LiNa3-xDyxP2O7 (x ¼ 0, 0.05, 0.07,0.09, and 0.11) were prepared by a solid-state reaction method. Thematerials were synthesized using the same experimental condi-tions as those in a recently published study [21]. In brief, analyticalreagent-grade high-purity (99.99%) starting materials of Li2CO3,Na2CO3, NH4H2PO4, and Dy2O3 were purchased (SigmaeAldrich,USA) and usedwithout further purification. To obtain homogeneity,stoichiometric amounts of reactive mixtures were finely ground inan agate mortar for 1 h. Each of the mixtures was placed in aseparate silica crucible and gradually heated in a muffle furnacefrom room temperature (RT) to 400 �C for 4 h. This process elimi-nates the residual water, CO2, and NH3 from the mixtures. Thesamples were re-ground after cooling down to RTand then sinteredat 540 �C for 12 h with several intermediate grindings. Finally, thesamples were furnace cooled, ground again, and used forcharacterization.
2.2. Characterization
X-ray diffraction (XRD) patterns were collected using an X-raydiffractometer (PANalytical X'Pert PRO, USA) in a 2q range of 10 to70� with Cu Ka radiation at a wavelength of l ¼ 1.5405 Å. Attenu-ated total reflectance (ATR) - Fourier transform infrared (FTIR)spectra were recorded in the wavenumber range of 4000 to400 cm�1 on a PerkineElmer (Bruker) IR spectrometer.
X-ray photoelectron spectroscopy (XPS) analysis was performedon an X-ray photoelectron spectrometer (K-alpha, Thermo Scien-tific, USA) using Al Ka X-ray radiation (1486.6 eV). All experimentswere performed at analyzing chamber pressure of 1.8 � 10�8 mbar
using pass energies of 160 and 30 eV and step sizes of 1 eV and0.1 eV for the low and high-resolution spectra, respectively. Prior tomeasurements, the XPS instrument work function was calibratedwith the standard Au 4f7/2 metallic binding energy (83.9 eV) andthe spectrometer dispersion is adjusted tometallic Cu 2p3/2 bindingenergy (932.6 eV). The data were recorded and processed using thecommercial software Avantage (Version 5.932, Thermo Scientific,USA). The charge shift corrections of the binding energies wereadjusted relative to the carbon (C 1s¼ 284.8 eV) fromhydrocarbonsadsorbed on the surface of sample. Each core level spectrum wasfirst fitted with a Shirley-type background and then deconvolutedinto various components using GL30 (a mixture of Gaussian (70%)and Lorentzian (30%)) in Avantage. In the process of deconvolutionof a signal, the full-width at half-maximum (FWHM) of eachelemental spectrum was kept at similar value for differentcontributions.
The morphology of the sample was analyzed using a field-emission scanning electron microscope (FE-SEM) (S-4200, Hita-chi, Japan). UVeVis diffuse reflectance spectra (DRS) were recordedon a UVeViseNIR spectrophotometer (Jobin Varian Cary 5000,USA). The reflectance was measured in the range of 800 to 200 nmusing polytetrafluoroethylene (PTFE) as a standard. Photo-luminescence (PL) emission and excitation (PLE) spectra wererecorded using a fluorescence spectrophotometer (Jobin VyonFluorologe3, USA) with a xenon lamp as an excitation source. Allthe measurements were recorded at RT.
3. Results and discussion
3.1. X-ray diffraction analysis
The phase purity of the prepared pyrophosphateLiNa3P2O7:Dy3þ phosphors were characterized by powder XRDanalysis. The XRD patterns of the Dy-doped LiNa3P2O7 samples areshown in Fig. 1. The dominant reflections of all the samples werewell indexed with the host structure (LiNa3P2O7) recently reportedby Shi et al. [22] as well as the Inorganic Crystal Structure Data(ICSD: 424375). There were no other impurities in the patterns,indicating purity of the synthesized powders.
A closer look at the figure indicates that the predominant XRDpeak positions are shifted toward a higher 2q angle with increasingdopant concentration. In general, distortion of the XRD peaks fromtheir mean position could be influenced by many factors, such as

K. Munirathnam et al. / Journal of Molecular Structure 1118 (2016) 117e123 119
the annealing temperature [23], the addition of impurities [24], andthe synthesis method [25]. In the present case, the samples wereprepared by solid-state reaction method in air by adding impuritiesto the host lattice in the same experimental conditions. Therefore,the temperature and synthesis method were discarded as influ-ential factors. The peak shifting could be due to the addition of Dy3þ
ions to the host structure. The added impurity ions would substi-tute at the host cation sites.
The ionic radii of Liþ, Naþ, P5þ, and Dy3þ are 0.059 nm (coor-dination number (CN) ¼ 4), 0.118 nm (CN ¼ 8), 0.017 nm (CN ¼ 4),and 0.103 nm (CN¼ 8), respectively [26e28]. Because of the similarionic radii of the host cations, the Dy3þ ions occupy the Naþ ionsites in the host structure. These results in the slight XRD peakshifting of the samples to a higher two-theta angle as a function ofthe dopant concentration because of the difference in ionic radii.
3.2. FTIR spectral studies
FTIR spectra of LiNa3P2O7:Dy3þ phosphors (Dy3þ ¼ 5e7 mol%)are shown in Fig. 2. For all samples, the spectra have similar profileswithout any other phases, suggesting that the variation of Dyconcentration did not have much effect on the structure of the host.The two peaks at 747 and 911 cm�1 are due to the symmetric andasymmetric vibrational stretching modes of PeOeP bridges [29].The small peak at 1633 cm�1 corresponds to the stretching vibra-tion of PO3�
4 groups, which revealed that the phosphors have themolecular structure of pyrophosphates. The absorption peaksshowed good agreement with those reported for the LiNa3P2O7host compound [22,29]. Peaks are negligible or non-existent in therange of 3655e3535 cm�1, which indicates the absence of watermolecules (eOH) in the samples [19]. The identified band assign-ments confirmed the presence of diphosphate groups in theLiNa3P2O7:Dy3þ phosphors.
3.3. XPS studies
X-ray photoelectron spectroscopy was employed to ascertainthe chemical composition, electronic state, and binding energies ofthe prepared phosphor. A survey scan of 5 mol% Dy3þ-dopedLiNa3P2O7 phosphor was recorded in the range of 1350 to 0 eV, asshown in Fig. 3 (a). The peaks at around 55, 531, 1071, 133, and1296 eV correspond to the Li 1s, O 1s, Na 1s, P 2p, and Dy 3d levels,respectively. No other impurity peaks were identified in the
Fig. 2. FTIR spectra of LiNa3P2O7:Dy3þ phosphor (Dy3þ ¼ 5e11 mol%).
spectrum, which supports the XRD and FTIR analyses.To study the bonding information in detail, high-resolution
spectra of Li 1s, O 1s, Na 1s, P 2p, and Dy 3d were measured, asshown in Fig. 3 (b)e(f), respectively. All the core-level spectra werefurther deconvoluted into various sub-components using a GL30program. As shown in Fig. 3 (b), the signal to noise (S/N) ratio of theLi 1s is very low. This results from the low X-ray scattering factorand limited sensitivity of the XPS technique for detecting light el-ements like lithium. The Li 1s spectrumwas fitted to a single broadpeak, suggesting that the only one type of bonding is possible in thepresent compound. The peak centered at about 55.0 eV corre-sponds to the oxygen-coordinated lithium atom (LieO) inLiNa3P2O7:Dy3þ phosphor, which also suggests that the Li atoms arein the normal oxidation state (Liþ). This is consistent with thebinding energy of Li in LiOH and Li2CO3 compounds [30e32].
The O 1s spectrum was deconvoluted into five peaks that areattributed to the various bonding of oxygen in the LiNa3P2O7:Dy3þ
phosphor. The different contributions are decomposed by keepingsame FWHM for lower binding energies (O1 to O4 peaks) anddifferent value for the latter higher binding energy contribution (O5(535.4 eV)), which is presented in Table 1. This is because of sodiumAuger overlap with the O 1s. The O1s peaks at O1, O2 and O3 arearising from oxygen atoms existing in various structural bonds ofphosphor: PeOeP, PeOeLi and PeOeNa. According to Pauling, theelectronegativity of Phosphorous, Lithium and Sodium are 2.19,0.98 and 0.93, respectively. Therefore, the O1 (530.8 eV) is assignedto PeOeP pyrophosphates (or double bond P]O), while the othertwo O2 (531.5 eV) and O3 (532.5 eV) are attributed to the PeOeLiand PeOeNa (or partially from DyeO) structural bonds, respec-tively. The O4 peak at 533.4 eV is due to the OH� and oxygen in H2O,which are adsorbed on the sample surface during the preparationof sample for analysis in non-vacuum condition [31,33e38].
The P 2p core level spectrum is composed of two symmetricalpeaks of phosphorus doublets (P 2p3/2 and 2p1/2) at P1 (133.5 eV)and P2 (134.6 eV). The binding energy difference between the P2p3/2 and 2p1/2 core levels was 1.1 eV with a ratio of ~0.5, which iscomparable with the literature value (1 eV) [37]. As reported in thecrystal structure of LiNa3P2O7 [22], the various bonds are possiblewith oxygen in the phosphor: PeOeP and PeOeLi (or Na). Thisleads to difference in binding energies of P 2p peak. Therefore, thehigher binding energy peak corresponds to phosphorus in the py-rophosphate groups, PeOeP (or double bond P]O), while latterbinding energy peak is owing to the phosphorous in the bondPeOeLi (or Na) (according to Pauling electronegativity of the ele-ments) [33,37,38]. The similar bonds are also observed in the O 1sspectrum (Table 1).
The Dy 3d spectrum was fitted to a single peak near 1296.6 eV,which is assigned to the DyeO bond of Dy 3d5/2 [35]. The intensityof the spectrum (Fig. 3 (f)) is lower because of the lower dopantconcentration in the phosphor. The fitted elemental percentage ofthe LiNa3P2O7:Dy3þ phosphor (Dy3þ ¼ 5 mol%) is presented inTable 1.
3.4. Morphological studies
To investigate the surface morphology of the synthesizedphosphor, SEM micrographs were recorded by field emissionscanning electron microscope (FE-SEM). A typical SEM image ofLiNa3P2O7:Dy3þ phosphor (Dy3þ ¼ 9 mol%) is represented in Fig. 4.The phosphor has irregular morphology due to the calcination ofthe samples at high temperature and intermediate grinding be-tween the calcinations. The particles are formed by several rock-like structures with non-uniform sizes and shapes. A closer lookindicates that the grains vary in size from a few microns to severaltens of microns.

Fig. 3. High (a) and low resolution scans of Li 1s (b), O 1s (c), Na 1s (d), P 2p (e), and Dy 3d (f) of the LiNa3P2O7:Dy3þ phosphor (Dy3þ ¼ 5 mol%).
Table 1Peak binding energy, FWHM, area and atomic percentage from the curve fitting of core-level spectra of elements, Li 1s, O 1s, Na 1s, P 2p, and Dy 3d for LiNa3P2O7:Dy3þ
(Dy3þ ¼ 5 mol%) phosphor. The uncertainty in the peak position and FWHM are ±0.1 eV.
Region Peak Peak binding energy (eV) FWHM (eV) Area Relative at% Elemental at% Assignment
Li 1s Li1 55.0 1.96 286.8 7.84 7.84 LieOO 1s O1 530.8 1.15 23556.4 18.59 58.74 PeOeP
O2 531.5 1.15 16533.9 13.05 PeOeLiO3 532.5 1.15 14897.7 11.77 PeOeNa/DyeOO4 533.4 1.15 5650.2 4.46 Chemisorbed OH-
O5 535.4 3.48 13722.1 10.87 Na KLL Auger lineNa 1s Na1 1071.7 2.27 44517.4 17.44 17.44 NaeOP 2p P1 133.5 1.72 8189.9 15.93 15.93 PeOeP
P2 134.6 1.72 4183.2 PeOeLi (or Na)Dy 3d Dy1 1296.6 3.50 598.4 0.05 0.05 DyeO
Fig. 4. Low-magnification (a) and high-magnification (b) SEM images of LiNa3P2O7:Dy3þ phosphor (Dy3þ ¼ 9 mol%).
K. Munirathnam et al. / Journal of Molecular Structure 1118 (2016) 117e123120

Fig. 6. Excitation spectra of LiNa3P2O7:Dy3þ phosphor (Dy3þ ¼ 5e11 mol%).
K. Munirathnam et al. / Journal of Molecular Structure 1118 (2016) 117e123 121
3.5. Diffuse reflection spectra (DRS)
Diffuse reflection spectra were recorded to investigate absorp-tion properties of the samples, as shown in Fig. 5. There is a broadabsorption band in the range of 250e320 nm due to the chargetransition (CT) band in the host [22]. The other absorption bands at326 nm (6H15/2 / 4L19/2), 352 nm (6H15/2 / 4I11/2), 366 nm (6H15/
2 /6P7/2), and 388 nm (6H15/2 /
4I13/2) are due to fef transitions ofDy3þ ions in the phosphor [19,39]. With the increase of Dy con-centration, all the absorption peaks related to fef transitions ofDy3þ ions also increased. The peak at about 352 nm is the pre-dominant peak, suggesting suitability of the phosphors for n-UVexcitation applications. The prepared samples have very good ab-sorption in the range of 250e320 nm due to the presence of PO3�
4groups, which supports the FT-IR analysis.
3.6. Photoluminescence properties
The excitation spectra of LiNa3P2O7:Dy3þ phosphors are shownin Fig. 6. In the range of 300e500 nm, the excitation spectra consistof a series of characteristic bands that are attributed to the transi-tions of 6H15/2 / 4L19/2 (328 nm), 6H15/2 / 6P7/2 (351 nm), 6H15/
2 / 6P5/2 (367 nm), 6H15/2 / 4I13/2 (388 nm), 6H15/2 / 4F7/2(395 nm), 6H15/2 / 4G11/2 (427 nm), 6H15/2 / 4I15/2 (453 nm), and6H15/2 /
4F9/2 (471 nm), respectively [9,40]. The band at 351 nm isthe predominant peak and was used for further emission spectrameasurements. The excitation peaks were consistent with thebands from DRS analysis. The excitation spectra reveal that Dy3þ
ions could be excited effectively by n-UV sources with awavelengthof 351 nm, offering new potential for white-light phosphors.
The photoluminescence emission spectra were measured underexcitation at 351 nm, as shown in Fig. 7. There were two strongcharacteristic peaks centered at 485 nm (blue) and 575 nm (yel-low). These bands correspond to the MD 4F9/2 / 6H15/2 transitionand the ED 4F9/2 / 6H13/2 transition, respectively [17,18]. Thetransitions of ions in the dopant (Dy3þ) in excitation and emissionstates are clearly presented in the energy level diagram shown inFig. 8.
To optimize the critical dopant concentration, the Dy3þ iondopant concentration in the host was varied (as described in theexperimental section). With increased dopant concentration in thehost, the emission spectra appear to have similar profiles with the
Fig. 5. DRS of LiNa3P2O7:Dy3þ phosphor (Dy3þ ¼ 5e11 mol%). Inset shows themagnified view of DRS of LiNa3P2O7:Dy3þ phosphor (Dy3þ ¼ 5 mol%) between 300 and500 nm.
Fig. 7. Emission spectra of LiNa3P2O7:Dy3þ phosphor (Dy3þ ¼ 5e11 mol%).
same peak positions of peaks but with variations in their relativeintensity. The intensity of the emission peaks increased with thedopant concentration from 5 to 9 mol%, beyond which the intensitydecreased due to the concentration quenching effect. In manyinorganic materials, the luminescence intensity remarkably de-creases because of non-radiative transition between the similardopant Dy3þ ions before being emitted to the ground level andreduction in the average distance between Dy3þ, which leads to thequenching effect [41]. The emission spectra show that the blueemission peak at 485 nm due to the magnetic transition (4F9/2 / 6H15/2) dominates over the yellow emission peak at 575 nmdue to electric transition (4F9/2 / 6H13/2). This illustrates that Dy3þ
ions occupied the high-symmetry sites with inversion centers inthe host matrix [42].
Further information can be revealed by calculating the asym-metric ratio, which is the ratio of the luminescence intensities dueto ED transition and MD transition. The relative intensity ratio ofthe yellow (575 nm) to blue (481 nm) emission can be used toanalyze the structural distortion around Dy3þ ions: (R) ¼ Ie (4F9/
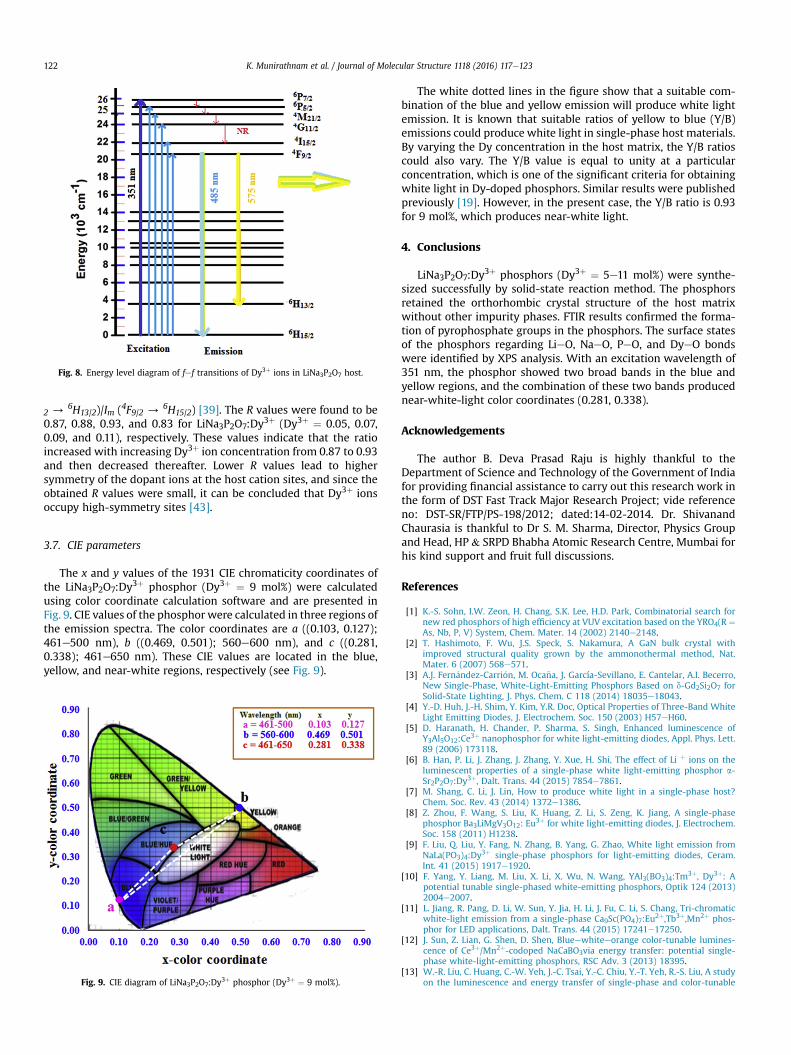
Fig. 8. Energy level diagram of fef transitions of Dy3þ ions in LiNa3P2O7 host.
K. Munirathnam et al. / Journal of Molecular Structure 1118 (2016) 117e123122
2 /6H13/2)/Im (4F9/2 / 6H15/2) [39]. The R values were found to be
0.87, 0.88, 0.93, and 0.83 for LiNa3P2O7:Dy3þ (Dy3þ ¼ 0.05, 0.07,0.09, and 0.11), respectively. These values indicate that the ratioincreased with increasing Dy3þ ion concentration from 0.87 to 0.93and then decreased thereafter. Lower R values lead to highersymmetry of the dopant ions at the host cation sites, and since theobtained R values were small, it can be concluded that Dy3þ ionsoccupy high-symmetry sites [43].
3.7. CIE parameters
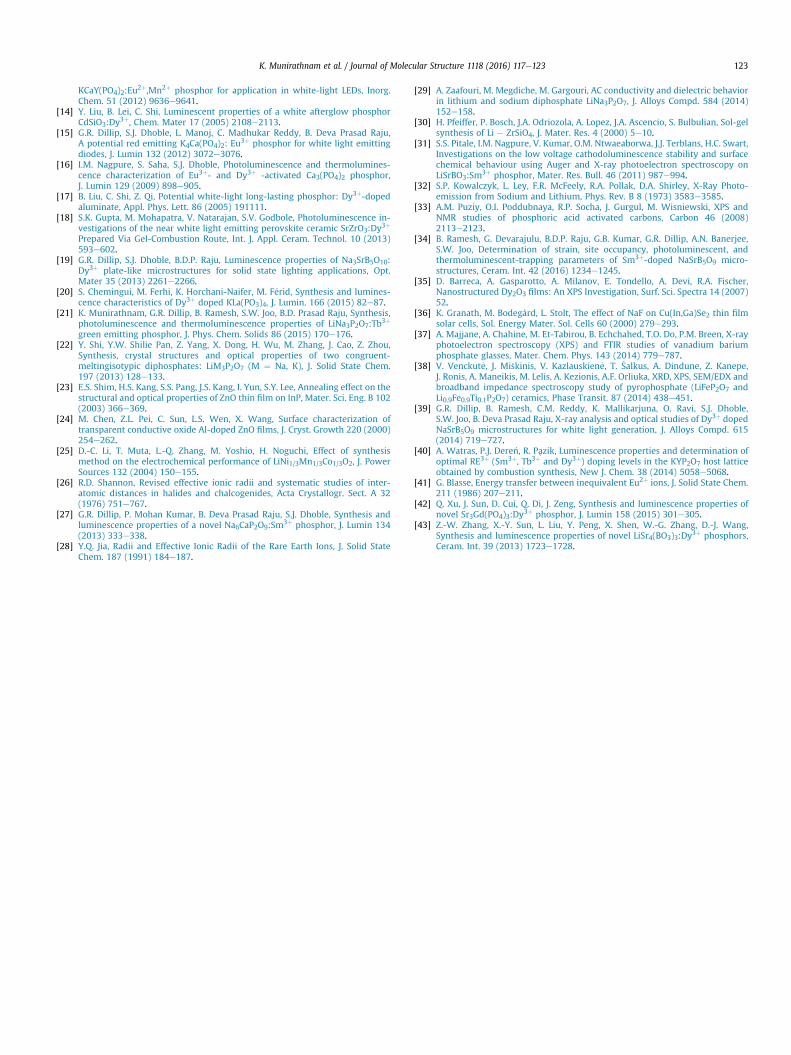
The x and y values of the 1931 CIE chromaticity coordinates ofthe LiNa3P2O7:Dy3þ phosphor (Dy3þ ¼ 9 mol%) were calculatedusing color coordinate calculation software and are presented inFig. 9. CIE values of the phosphorwere calculated in three regions ofthe emission spectra. The color coordinates are a ((0.103, 0.127);461e500 nm), b ((0.469, 0.501); 560e600 nm), and c ((0.281,0.338); 461e650 nm). These CIE values are located in the blue,yellow, and near-white regions, respectively (see Fig. 9).
Fig. 9. CIE diagram of LiNa3P2O7:Dy3þ phosphor (Dy3þ ¼ 9 mol%).
The white dotted lines in the figure show that a suitable com-bination of the blue and yellow emission will produce white lightemission. It is known that suitable ratios of yellow to blue (Y/B)emissions could produce white light in single-phase host materials.By varying the Dy concentration in the host matrix, the Y/B ratioscould also vary. The Y/B value is equal to unity at a particularconcentration, which is one of the significant criteria for obtainingwhite light in Dy-doped phosphors. Similar results were publishedpreviously [19]. However, in the present case, the Y/B ratio is 0.93for 9 mol%, which produces near-white light.
4. Conclusions
LiNa3P2O7:Dy3þ phosphors (Dy3þ ¼ 5e11 mol%) were synthe-sized successfully by solid-state reaction method. The phosphorsretained the orthorhombic crystal structure of the host matrixwithout other impurity phases. FTIR results confirmed the forma-tion of pyrophosphate groups in the phosphors. The surface statesof the phosphors regarding LieO, NaeO, PeO, and DyeO bondswere identified by XPS analysis. With an excitation wavelength of351 nm, the phosphor showed two broad bands in the blue andyellow regions, and the combination of these two bands producednear-white-light color coordinates (0.281, 0.338).
Acknowledgements
The author B. Deva Prasad Raju is highly thankful to theDepartment of Science and Technology of the Government of Indiafor providing financial assistance to carry out this research work inthe form of DST Fast Track Major Research Project; vide referenceno: DST-SR/FTP/PS-198/2012; dated:14-02-2014. Dr. ShivanandChaurasia is thankful to Dr S. M. Sharma, Director, Physics Groupand Head, HP & SRPD Bhabha Atomic Research Centre, Mumbai forhis kind support and fruit full discussions.
References
[1] K.-S. Sohn, I.W. Zeon, H. Chang, S.K. Lee, H.D. Park, Combinatorial search fornew red phosphors of high efficiency at VUV excitation based on the YRO4(R ¼As, Nb, P, V) System, Chem. Mater. 14 (2002) 2140e2148.
[2] T. Hashimoto, F. Wu, J.S. Speck, S. Nakamura, A GaN bulk crystal withimproved structural quality grown by the ammonothermal method, Nat.Mater. 6 (2007) 568e571.
[3] A.J. Fern�andez-Carri�on, M. Oca~na, J. García-Sevillano, E. Cantelar, A.I. Becerro,New Single-Phase, White-Light-Emitting Phosphors Based on d-Gd2Si2O7 forSolid-State Lighting, J. Phys. Chem. C 118 (2014) 18035e18043.
[4] Y.-D. Huh, J.-H. Shim, Y. Kim, Y.R. Doc, Optical Properties of Three-Band WhiteLight Emitting Diodes, J. Electrochem. Soc. 150 (2003) H57eH60.
[5] D. Haranath, H. Chander, P. Sharma, S. Singh, Enhanced luminescence ofY3Al5O12:Ce3þ nanophosphor for white light-emitting diodes, Appl. Phys. Lett.89 (2006) 173118.
[6] B. Han, P. Li, J. Zhang, J. Zhang, Y. Xue, H. Shi, The effect of Li þ ions on theluminescent properties of a single-phase white light-emitting phosphor a-Sr2P2O7:Dy3þ, Dalt. Trans. 44 (2015) 7854e7861.
[7] M. Shang, C. Li, J. Lin, How to produce white light in a single-phase host?Chem. Soc. Rev. 43 (2014) 1372e1386.
[8] Z. Zhou, F. Wang, S. Liu, K. Huang, Z. Li, S. Zeng, K. Jiang, A single-phasephosphor Ba3LiMgV3O12: Eu3þ for white light-emitting diodes, J. Electrochem.Soc. 158 (2011) H1238.
[9] F. Liu, Q. Liu, Y. Fang, N. Zhang, B. Yang, G. Zhao, White light emission fromNaLa(PO3)4:Dy3þ single-phase phosphors for light-emitting diodes, Ceram.Int. 41 (2015) 1917e1920.
[10] F. Yang, Y. Liang, M. Liu, X. Li, X. Wu, N. Wang, YAl3(BO3)4:Tm3þ, Dy3þ: Apotential tunable single-phased white-emitting phosphors, Optik 124 (2013)2004e2007.
[11] L. Jiang, R. Pang, D. Li, W. Sun, Y. Jia, H. Li, J. Fu, C. Li, S. Chang, Tri-chromaticwhite-light emission from a single-phase Ca9Sc(PO4)7:Eu2þ,Tb3þ,Mn2þ phos-phor for LED applications, Dalt. Trans. 44 (2015) 17241e17250.
[12] J. Sun, Z. Lian, G. Shen, D. Shen, Blueewhiteeorange color-tunable lumines-cence of Ce3þ/Mn2þ-codoped NaCaBO3via energy transfer: potential single-phase white-light-emitting phosphors, RSC Adv. 3 (2013) 18395.
[13] W.-R. Liu, C. Huang, C.-W. Yeh, J.-C. Tsai, Y.-C. Chiu, Y.-T. Yeh, R.-S. Liu, A studyon the luminescence and energy transfer of single-phase and color-tunable
K. Munirathnam et al. / Journal of Molecular Structure 1118 (2016) 117e123 123
KCaY(PO4)2:Eu2þ,Mn2þ phosphor for application in white-light LEDs, Inorg.Chem. 51 (2012) 9636e9641.
[14] Y. Liu, B. Lei, C. Shi, Luminescent properties of a white afterglow phosphorCdSiO3:Dy3þ, Chem. Mater 17 (2005) 2108e2113.
[15] G.R. Dillip, S.J. Dhoble, L. Manoj, C. Madhukar Reddy, B. Deva Prasad Raju,A potential red emitting K4Ca(PO4)2: Eu3þ phosphor for white light emittingdiodes, J. Lumin 132 (2012) 3072e3076.
[16] I.M. Nagpure, S. Saha, S.J. Dhoble, Photoluminescence and thermolumines-cence characterization of Eu3þ- and Dy3þ -activated Ca3(PO4)2 phosphor,J. Lumin 129 (2009) 898e905.
[17] B. Liu, C. Shi, Z. Qi, Potential white-light long-lasting phosphor: Dy3þ-dopedaluminate, Appl. Phys. Lett. 86 (2005) 191111.
[18] S.K. Gupta, M. Mohapatra, V. Natarajan, S.V. Godbole, Photoluminescence in-vestigations of the near white light emitting perovskite ceramic SrZrO3:Dy3þ
Prepared Via Gel-Combustion Route, Int. J. Appl. Ceram. Technol. 10 (2013)593e602.
[19] G.R. Dillip, S.J. Dhoble, B.D.P. Raju, Luminescence properties of Na3SrB5O10:Dy3þ plate-like microstructures for solid state lighting applications, Opt.Mater 35 (2013) 2261e2266.
[20] S. Chemingui, M. Ferhi, K. Horchani-Naifer, M. F�erid, Synthesis and lumines-cence characteristics of Dy3þ doped KLa(PO3)4, J. Lumin. 166 (2015) 82e87.
[21] K. Munirathnam, G.R. Dillip, B. Ramesh, S.W. Joo, B.D. Prasad Raju, Synthesis,photoluminescence and thermoluminescence properties of LiNa3P2O7:Tb3þ
green emitting phosphor, J. Phys. Chem. Solids 86 (2015) 170e176.[22] Y. Shi, Y.W. Shilie Pan, Z. Yang, X. Dong, H. Wu, M. Zhang, J. Cao, Z. Zhou,
Synthesis, crystal structures and optical properties of two congruent-meltingisotypic diphosphates: LiM3P2O7 (M ¼ Na, K), J. Solid State Chem.197 (2013) 128e133.
[23] E.S. Shim, H.S. Kang, S.S. Pang, J.S. Kang, I. Yun, S.Y. Lee, Annealing effect on thestructural and optical properties of ZnO thin film on InP, Mater. Sci. Eng. B 102(2003) 366e369.
[24] M. Chen, Z.L. Pei, C. Sun, L.S. Wen, X. Wang, Surface characterization oftransparent conductive oxide Al-doped ZnO films, J. Cryst. Growth 220 (2000)254e262.
[25] D.-C. Li, T. Muta, L.-Q. Zhang, M. Yoshio, H. Noguchi, Effect of synthesismethod on the electrochemical performance of LiNi1/3Mn1/3Co1/3O2, J. PowerSources 132 (2004) 150e155.
[26] R.D. Shannon, Revised effective ionic radii and systematic studies of inter-atomic distances in halides and chalcogenides, Acta Crystallogr. Sect. A 32(1976) 751e767.
[27] G.R. Dillip, P. Mohan Kumar, B. Deva Prasad Raju, S.J. Dhoble, Synthesis andluminescence properties of a novel Na6CaP2O9:Sm3þ phosphor, J. Lumin 134(2013) 333e338.
[28] Y.Q. Jia, Radii and Effective Ionic Radii of the Rare Earth Ions, J. Solid StateChem. 187 (1991) 184e187.
[29] A. Zaafouri, M. Megdiche, M. Gargouri, AC conductivity and dielectric behaviorin lithium and sodium diphosphate LiNa3P2O7, J. Alloys Compd. 584 (2014)152e158.
[30] H. Pfeiffer, P. Bosch, J.A. Odriozola, A. Lopez, J.A. Ascencio, S. Bulbulian, Sol-gelsynthesis of Li e ZrSiO4, J. Mater. Res. 4 (2000) 5e10.
[31] S.S. Pitale, I.M. Nagpure, V. Kumar, O.M. Ntwaeaborwa, J.J. Terblans, H.C. Swart,Investigations on the low voltage cathodoluminescence stability and surfacechemical behaviour using Auger and X-ray photoelectron spectroscopy onLiSrBO3:Sm3þ phosphor, Mater. Res. Bull. 46 (2011) 987e994.
[32] S.P. Kowalczyk, L. Ley, F.R. McFeely, R.A. Pollak, D.A. Shirley, X-Ray Photo-emission from Sodium and Lithium, Phys. Rev. B 8 (1973) 3583e3585.
[33] A.M. Puziy, O.I. Poddubnaya, R.P. Socha, J. Gurgul, M. Wisniewski, XPS andNMR studies of phosphoric acid activated carbons, Carbon 46 (2008)2113e2123.
[34] B. Ramesh, G. Devarajulu, B.D.P. Raju, G.B. Kumar, G.R. Dillip, A.N. Banerjee,S.W. Joo, Determination of strain, site occupancy, photoluminescent, andthermoluminescent-trapping parameters of Sm3þ-doped NaSrB5O9 micro-structures, Ceram. Int. 42 (2016) 1234e1245.
[35] D. Barreca, A. Gasparotto, A. Milanov, E. Tondello, A. Devi, R.A. Fischer,Nanostructured Dy2O3 films: An XPS Investigation, Surf. Sci. Spectra 14 (2007)52.
[36] K. Granath, M. Bodegård, L. Stolt, The effect of NaF on Cu(In,Ga)Se2 thin filmsolar cells, Sol. Energy Mater. Sol. Cells 60 (2000) 279e293.
[37] A. Majjane, A. Chahine, M. Et-Tabirou, B. Echchahed, T.O. Do, P.M. Breen, X-rayphotoelectron spectroscopy (XPS) and FTIR studies of vanadium bariumphosphate glasses, Mater. Chem. Phys. 143 (2014) 779e787.
[38] V. Venckut _e, J. Mi�skinis, V. Kazlauskien _e, T. �Salkus, A. Dindune, Z. Kanepe,J. Ronis, A. Maneikis, M. Lelis, A. Kezionis, A.F. Orliuka, XRD, XPS, SEM/EDX andbroadband impedance spectroscopy study of pyrophosphate (LiFeP2O7 andLi0.9Fe0.9Ti0.1P2O7) ceramics, Phase Transit. 87 (2014) 438e451.
[39] G.R. Dillip, B. Ramesh, C.M. Reddy, K. Mallikarjuna, O. Ravi, S.J. Dhoble,S.W. Joo, B. Deva Prasad Raju, X-ray analysis and optical studies of Dy3þ dopedNaSrB5O9 microstructures for white light generation, J. Alloys Compd. 615(2014) 719e727.
[40] A. Watras, P.J. Dere�n, R. Pazik, Luminescence properties and determination ofoptimal RE3þ (Sm3þ, Tb3þ and Dy3þ) doping levels in the KYP2O7 host latticeobtained by combustion synthesis, New J. Chem. 38 (2014) 5058e5068.
[41] G. Blasse, Energy transfer between inequivalent Eu2þ ions, J. Solid State Chem.211 (1986) 207e211.
[42] Q. Xu, J. Sun, D. Cui, Q. Di, J. Zeng, Synthesis and luminescence properties ofnovel Sr3Gd(PO4)3:Dy3þ phosphor, J. Lumin 158 (2015) 301e305.
[43] Z.-W. Zhang, X.-Y. Sun, L. Liu, Y. Peng, X. Shen, W.-G. Zhang, D.-J. Wang,Synthesis and luminescence properties of novel LiSr4(BO3)3:Dy3þ phosphors,Ceram. Int. 39 (2013) 1723e1728.