Journal of Materials Chemistry Aweb.mit.edu/dincalab/papers/paper36.pdf · influence of the...
12
On the electrochemical deposition of metal– organic frameworks†‡ Nicol ` o Campagnol, ab Tom R. C. Van Assche, c Minyuan Li, b Linda Stappers, a Mircea Dinc ˘ a, b Joeri F. M. Denayer, c Koen Binnemans, d Dirk E. De Vos e and Jan Fransaer * a The electrochemical deposition of Metal–Organic Frameworks (MOFs) is an interesting technique to synthesise adherent, microporous layers on top of conductive substrates. The technique can be subdivided in two approaches: anodic and cathodic deposition. While the mechanism of the cathodic approach has already been well investigated, at least for MOF-5, up to now not much is known about the anodic approach. In this paper, a four-step mechanism is proposed to better understand the anodic deposition, and the same MOF used for the investigation, HKUST-1, is also deposited cathodically to compare the two approaches. This study focuses on how nucleation starts and proceeds, on the influence of the potential applied, the stresses in the growing layers, and the origin of defects like delamination and MOF detachment. The study is followed by critical considerations on the methods and on the technique, together with suggestions and guidelines to synthesise new MOF layers. Introduction Functionalisation of surfaces is an important topic in materials science. The functionalisation oen involves the addition of a second material, a coating, which can be synthesised and applied in many ways, depending on its nature and character- istics (melting temperature, solubility, conductivity.) and those of the substrate. The application (or formation) of porous coatings is appealing for many reasons: particles or molecules can be pre-loaded in the pores changing the optical (dyes), catalytic (catalytic particles/molecules), tribologic (lubricants) properties of the surface, or, alternatively, the coating itself can act as a host for molecules present in the environment, behaving like a membrane or a lter. Metal–Organic Frameworks (MOFs) are a novel class of materials with very high porosity. These compounds are based on metal (or metal–oxygen) centres, connected by organic linkers to form light and hollow 1D, 2D or 3D structures. 1,2 The choice of many possible metals and a virtually innite number of linkers, make them extremely tuneable and adjustable for different applications. 3 MOF structures are obtained by self- assembly of the organic linkers with the metal ions, typically supplied in a solvent as a weak organic acid and a metal salt, respectively. MOF can be shaped as layers with a vast array of methods, from direct drop casting of MOF crystals dispersed in a solvent to the more laborious layer by layer deposition. 4 These mesoporous layers have been tested for several applications, 5 for example luminescent MOFs showed promising results in molecule detections, 6 while MOFs with specic pore dimen- sions can be used for gas separation and storage, 7,8 and a good combination of active sites and pore dimensions may be very interesting for the eld of catalysis. 4 The electrochemical method used in industry to produce MOFs is based on the delivery of the metal ions electrochemi- cally by anodic dissolution, avoiding the use of salts and reducing the synthesis time. 9 Ameloot et al. reported that this technique can be used to electrodeposit MOF coatings anodi- cally if the formed coordination polymers assemble on the anodic surface. 10,11 As said above, the synthesis of MOF lms is very important for a wide range of applications, 12 and in particular anodically synthesised MOF layers have been successfully tested for humidity, 3 explosives, 13 oxygen and glucose sensing, 14 and gas separation. 15,16 As shown in recent publications, these layers are compact and well adherent, 17 and if synthesised under certain conditions, they can be more than one crystal layer thick. 15 Moreover, they are expected to have the same properties of the crystals formed in solution, but a Department of Materials Engineering (MTM), KU Leuven, Kasteelpark Arenberg 44, B-3001 Leuven, Belgium. E-mail: [email protected] b Department of Chemistry, Massachusetts Institute of Technology, 77 Massachusetts Ave, Cambridge, MA 02139, USA c Department of Chemical Engineering, Vrije Universiteit Brussel, Pleinlaan 2, B-1050 Brussels, Belgium d Centre for Surface Chemistry and Catalysis (COK), KU Leuven, Kasteelpark Arenberg 23, B-3001 Leuven, Belgium e Department of Chemistry, KU Leuven, Celestijnenlaan 200F, B-3001 Leuven, Belgium † Part of this work was published as N. Campagnol et al., ECS Transaction, 2014, 61, 25–40. ‡ Electronic supplementary information (ESI) available: RRDE experiment, layers stress evolution, adsorption of m-xylene and triisopropylbenzene, additional SEM pictures, CVs relative to the cathodic deposition. See DOI: 10.1039/c5ta10782b Cite this: J. Mater. Chem. A, 2016, 4, 3914 Received 31st December 2015 Accepted 9th February 2016 DOI: 10.1039/c5ta10782b www.rsc.org/MaterialsA 3914 | J. Mater. Chem. A, 2016, 4, 3914–3925 This journal is © The Royal Society of Chemistry 2016 Journal of Materials Chemistry A PAPER Published on 11 February 2016. Downloaded on 13/11/2016 17:34:52. View Article Online View Journal | View Issue
Transcript of Journal of Materials Chemistry Aweb.mit.edu/dincalab/papers/paper36.pdf · influence of the...

Journal ofMaterials Chemistry A
PAPER
Publ
ishe
d on
11
Febr
uary
201
6. D
ownl
oade
d on
13/
11/2
016
17:3
4:52
.
View Article OnlineView Journal | View Issue
On the electroch
aDepartment of Materials Engineering (MTM
B-3001 Leuven, Belgium. E-mail: jan.fransaebDepartment of Chemistry, Massachusetts I
Ave, Cambridge, MA 02139, USAcDepartment of Chemical Engineering, Vrije
Brussels, BelgiumdCentre for Surface Chemistry and Catalysis
23, B-3001 Leuven, BelgiumeDepartment of Chemistry, KU Leuven, Celes
† Part of this work was published as N. C61, 25–40.
‡ Electronic supplementary information (stress evolution, adsorption of m-xylene anpictures, CVs relative to the cathodic depo
Cite this: J. Mater. Chem. A, 2016, 4,3914
Received 31st December 2015Accepted 9th February 2016
DOI: 10.1039/c5ta10782b
www.rsc.org/MaterialsA
3914 | J. Mater. Chem. A, 2016, 4, 3914
emical deposition of metal–organic frameworks†‡
Nicolo Campagnol,ab Tom R. C. Van Assche,c Minyuan Li,b Linda Stappers,a
Mircea Dinca,b Joeri F. M. Denayer,c Koen Binnemans,d Dirk E. De Vose
and Jan Fransaer*a
The electrochemical deposition of Metal–Organic Frameworks (MOFs) is an interesting technique to
synthesise adherent, microporous layers on top of conductive substrates. The technique can be
subdivided in two approaches: anodic and cathodic deposition. While the mechanism of the cathodic
approach has already been well investigated, at least for MOF-5, up to now not much is known about
the anodic approach. In this paper, a four-step mechanism is proposed to better understand the anodic
deposition, and the same MOF used for the investigation, HKUST-1, is also deposited cathodically to
compare the two approaches. This study focuses on how nucleation starts and proceeds, on the
influence of the potential applied, the stresses in the growing layers, and the origin of defects like
delamination and MOF detachment. The study is followed by critical considerations on the methods and
on the technique, together with suggestions and guidelines to synthesise new MOF layers.
Introduction
Functionalisation of surfaces is an important topic in materialsscience. The functionalisation oen involves the addition ofa second material, a coating, which can be synthesised andapplied in many ways, depending on its nature and character-istics (melting temperature, solubility, conductivity.) andthose of the substrate. The application (or formation) of porouscoatings is appealing for many reasons: particles or moleculescan be pre-loaded in the pores changing the optical (dyes),catalytic (catalytic particles/molecules), tribologic (lubricants)properties of the surface, or, alternatively, the coating itself canact as a host for molecules present in the environment,behaving like a membrane or a lter.
Metal–Organic Frameworks (MOFs) are a novel class ofmaterials with very high porosity. These compounds are basedon metal (or metal–oxygen) centres, connected by organic
), KU Leuven, Kasteelpark Arenberg 44,
nstitute of Technology, 77 Massachusetts
Universiteit Brussel, Pleinlaan 2, B-1050
(COK), KU Leuven, Kasteelpark Arenberg
tijnenlaan 200F, B-3001 Leuven, Belgium
ampagnol et al., ECS Transaction, 2014,
ESI) available: RRDE experiment, layersd triisopropylbenzene, additional SEMsition. See DOI: 10.1039/c5ta10782b
–3925
linkers to form light and hollow 1D, 2D or 3D structures.1,2 Thechoice of many possible metals and a virtually innite numberof linkers, make them extremely tuneable and adjustable fordifferent applications.3 MOF structures are obtained by self-assembly of the organic linkers with the metal ions, typicallysupplied in a solvent as a weak organic acid and a metal salt,respectively. MOF can be shaped as layers with a vast array ofmethods, from direct drop casting of MOF crystals dispersed ina solvent to the more laborious layer by layer deposition.4 Thesemesoporous layers have been tested for several applications,5
for example luminescent MOFs showed promising results inmolecule detections,6 while MOFs with specic pore dimen-sions can be used for gas separation and storage,7,8 and a goodcombination of active sites and pore dimensions may be veryinteresting for the eld of catalysis.4
The electrochemical method used in industry to produceMOFs is based on the delivery of the metal ions electrochemi-cally by anodic dissolution, avoiding the use of salts andreducing the synthesis time.9 Ameloot et al. reported that thistechnique can be used to electrodeposit MOF coatings anodi-cally if the formed coordination polymers assemble on theanodic surface.10,11 As said above, the synthesis of MOF lms isvery important for a wide range of applications,12 and inparticular anodically synthesised MOF layers have beensuccessfully tested for humidity,3 explosives,13 oxygen andglucose sensing,14 and gas separation.15,16 As shown in recentpublications, these layers are compact and well adherent,17 andif synthesised under certain conditions, they can be more thanone crystal layer thick.15 Moreover, they are expected to have thesame properties of the crystals formed in solution, but
This journal is © The Royal Society of Chemistry 2016

Paper Journal of Materials Chemistry A
Publ
ishe
d on
11
Febr
uary
201
6. D
ownl
oade
d on
13/
11/2
016
17:3
4:52
. View Article Online
exceptions have been reported.18 Still, several questions aboutthe deposition mechanism remain unresolved; for examplesome researchers claim the possibility to electrochemicallysynthesise well known MOFs like MIL-53(Al) in the form ofpowders, but the impossibility to make layers.19 Moreover, inorder to grow thick MOF layers anodically it is important toknow whether the MOF growth takes place below or on top ofthe already formed coating. This has implications for theadhesion of the layers, because if the layers grow at the MOF–solution interface, the adhesion between the MOF layer and thesubstrate will eventually be lost as the MOF layer gets undercutby the dissolution of the substrate. Another possible occurrenceis that a different phase without linker, like an oxide orhydroxide, might form at the MOF–substrate interface, equallyundermining the layer adhesion. In fact, delamination defectsdue to delamination of the MOF layers synthesised with theelectrochemical technique have already been reported, but theorigin of this phenomenon has not been explained yet.16
Aer the anodic synthesis was reported, another electro-chemical approach was developed: the cathodic approach.20
This approach makes use of a solution containing all thestarting components needed for the synthesis (metal ions andlinker) and is based on the production of a “pro-base” at thecathode, for example nitrite ions from the nitrates alreadypresent in solution, which can react with the linker, deproto-nating it. The abundance of metal ions attracted by the negativepotential and of the deprotonated ligand triggers the self-assembly and precipitation of MOF crystals which might alsopass via an oxide-hydroxide intermediate.21 The mechanism ofthe cathodic synthesis has been recently extensively analysed, atleast for MOF-5, an iconic MOF based on zinc(II) ions and ter-ephthalic acid.21 Moreover, Liu et al. electrodeposited lms ofrare earth based MOFs with the cathodic approach, yieldingpromising detectors and tuneable luminescent layers.22,23 Inboth cases the metal used is very unnoble, which allows, at leastin theory, to electrodeposit pure MOF phases. In contrast, noinvestigations are available for noble metals with which the co-deposition with the MOF in the layer is expected to beunavoidable, but not necessarily a negative outcome. Themechanism of adhesion to the substrate of cathodically syn-thesised layers has been hardly explored: the only available databeing a scratch test using UIO-66 layers.24 But, since it was notthe main focus of the paper, the synthesis parameters to obtainthose layers have not been optimised, and the reason of thecrystal adhesion to the substrate, or lack of it, has anyway notbeen explained yet.
In this paper we show that the anodic electrochemicalnucleation and growth of MOF layers happens in four phases.Information about these four phases was obtained usingdifferent experimental techniques, e.g. Electrochemical QuartzCrystal Microbalance (EQCM), a homemade laser curvaturesetup, Rotating Ring Disk Electrode (RRDE), X-Ray Diffraction(XRD), and Scanning Electron Microscopy (SEM) equipped withEnergy Dispersion Spectroscopy (EDS). Most of the informationwas obtained with the electrochemically grown archetypicalMOF HKUST-1 (Cu-BTC, based on copper and trimesic acid orH3BTC), but for some specic experiments were used
This journal is © The Royal Society of Chemistry 2016
derivatives of copper(II) isonicotinate (Cu-INA) with chlorine oruorine atoms in position 2 of the linker ring. Moreover, wecompare the two methods, anodic and cathodic, in order todescribe the differences and the strong and weak points of thetwo. To do this we synthesised the same MOF (HKUST-1)cathodically in different conditions, unveiling new aspects ofthis technique. Lastly, we propose some guidelines and generalsuggestions which might be useful for other researchers whowant to electrochemically deposit MOFs.
ExperimentalSynthesis of HKUST-1
To study the inuence of the solvent and the variation in crys-tals dimensions, HKUST-1 was synthesised electrochemicallyon thin copper meshes (99.98% copper, 8 mm thick withwindows of ca. 50 mm2, Precision Eforming, U.S.A.). Methanol(MeOH, Sigma-Aldrich, 99.8%), ethanol (EtOH, VWR, 99.9%),and dimethyl-sulphoxide (DMSO, Sigma-Aldrich, 99.9%) wereused as solvents, typically with water as co-solvent. The linkerfor these synthesis mixtures was 1,3,5-benzenetricarboxylic acid(trimesic acid, H3BTC, Sigma-Aldrich, 95%) in a concentrationof 16 g L�1 (76 mM). Other synthesis details are reported ina recent paper.25
To study the four phases of the electrodeposition, the sameMOF was synthesised using copper-coated silicon wafers orplatinum-coated quartz crystals (Testbourne, area 1.37 cm2) asworking electrodes. For the Electrochemical Quartz CrystalMicrobalance (EQCM) experiments, the platinum-coated facesof the vibrating crystals were rst electroplated with copper. Theelectrochemical experiments were controlled by a galvanostat/potentiostat (EG&G, model 273 or Solartron SI 1287) and anEQCM apparatus (RQCM, Incon). A 2 cm thick mask wasplaced in front of the working electrode to prevent edgeeffects.26 A home-made Ag/AgCl (3 M KCl) served as reference,and platinum foils (with different dimensions depending on theexperiment but always larger than the surface of the workingelectrode) were used as counter electrodes. Except where statedotherwise, the solution consists of ethanol/water (67 : 33 vol%)with 10 g L�1 (48 mM) of H3BTC.15
Experiments regarding the diffusion coefficient of copperions in the solution were run with a platinum rotating ring-diskelectrode (RRDE, Pine Research Instrumentation, E7R8 Series).The disk diameter is 4.57 mm, and the inside and outsidediameters of the ring are 4.93 mm and 5.38 mm, respectively. Ascounter and reference electrodes were used a platinum meshand a home-made Ag/AgCl reference electrode. An Autolab 302Nwas used to control the electrochemical experiments. Thediffusion coefficient used for the study of the anodic synthesiswas calculated from RRDE data using the following formula:
Ts ¼ K� v
D
�1=3
u�1 (1)
where Ts is the transient time, u (rpm) is the rotation speed, K isa constant depending on the geometry of the rotating ring-diskelectrode (3.3 rpm s for the RRDE used), and n is the kinematicviscosity of the solutions, which is 1.97 10�6 m2 s�1 for 67 vol%
J. Mater. Chem. A, 2016, 4, 3914–3925 | 3915

Journal of Materials Chemistry A Paper
Publ
ishe
d on
11
Febr
uary
201
6. D
ownl
oade
d on
13/
11/2
016
17:3
4:52
. View Article Online
ethanol in water.27 The RRDE was plated with copper and usedto measure the transient time at different rotation speeds ina solution based on ethanol/water (67 : 33 vol%) containing 10 gL�1 (48 mM) H3BTC. For each rotation speed, aer a dwell timeat open circuit potential, the disk was kept at +0.4 V vs. ref. andthe ring at �0.4 V vs. ref.
In situ stress measurements during MOF lms growth wereperformed using a home-built laser curvature setup.28 The setupconsists of a red laser (R-30995, Newport) which is focused ona glass cantilever (D 263 Schott, 60� 3� 0.108 mm) coated with250 nm of gold on one side. When stressed lms are depositedon the gold-plated face, the cantilever bends and the laser beamis deected. Laser beam deection is measured using a duo-lateral Position Sensitive Device (PSD, DLS-20 by UTD SensorsInc). The relation between the laser deection and the force perunit width F/w is given by Stoney's formula:
F
w¼ Et2naird
12ð1� nÞLnethanolD (2)
where E, n and t are Young's modulus, Poisson ratio andthickness of the cantilever. The length of the unclamped part ofthe cantilever is L, n is the refractive index of ethanol or air, D isthe distance between the cantilever and the PSD, and d is thedeection of the laser beam at the PSD.
To determine stresses in MOF lms, rst a 2 mm layer ofcopper was electrodeposited on the cantilever's gold-coated facecausing tensile stress to arise.29 As a blank, thin lm stress wasmeasured during dissolution of copper in an ethanol/water(67 : 33 vol%) electrolyte without H3BTC but with 10 g L�1
methyltributylammonium methyl sulphate (32 mM, MTBS,Sigma-Aldrich, 95%) to enhance the conductivity. The sameexperiment was repeated with the same electrolyte with 10 g L�1
of H3BTC (48 mM) and 10 g L�1 of MTBS (32 mM).The experiments on the cathodic deposition were run in
a three electrode set-up with a CH potentiostat (CH instru-ments, 600D). The electrolyte used is derived from the rst workon cathodic MOF deposition and consists of: 10 g L�1 H3BTC(48 mM, 95% Sigma-Aldrich), 24 g L�1 Cu(NO3)2$xH2O(100 mM, Sigma-Aldrich), and 11 g L�1 NaBF4 (100 mM, Sigma-Aldrich) used as supporting electrolyte, dissolved in DMF/water(75 : 25 vol%). Fluorinated Tin Oxide (FTO) glass plates wereused as working electrodes, platinum grids as counter, anda home-made Ag/Ag(Cryptand)+ electrode was used as refer-ence.30 Aer synthesis the samples were gently dipped inacetone to wash away the synthesis liquor causing the loss ofpart of the crystals, but if dried without washing, these looselyattached crystals result in a non-adherent powdery layer.
Synthesis of Cu-INA, Cu-INA(Cl) and Cu-INA(F)
A different MOF, Cu-INA, was used to compare the results ob-tained with HKUST-1 regarding the growth of anodicallydeposited layers. The electrolytes used for the synthesis are thefollowing: 5.8 mmol of ligand (714 mg of isonicotinic acid(HINA), or 818 mg of HINA(F) or 914 mg of HINA(Cl)), 1 g(32 mM) of MTBS in 100 mL of ethanol/water (50 : 50 vol%).2-Chloropyridine-4-carboxylic acid (INA(Cl) 98%) and
3916 | J. Mater. Chem. A, 2016, 4, 3914–3925
2-uoropyridine-4-carboxylic acid (INA(F) 98%) were purchasedfrom Matrix Scientic, while the pyridine-4-carboxylic acid(HINA, 99%) used is produced by Sigma-Aldrich. The deposi-tions were run in a small (5 mL) two electrode set-up withdifferent applied potentials vs. the counter electrode (a plat-inum coil), for different durations, and always at 60 �C. Cu-INAwas deposited at 3 V for 3 min, Cu-INA(Cl) for 4 min at 2 V, andCu-INA(F) at 3 V for 4min. The substrates used are copper plateswith a surface of circa 1 to 2 cm2. The electrolyte mix is notsoluble at room temperature and has therefore to be stirred at60 �C for several minutes before a clear solution is obtained.Very important for the synthesis is to avoid dipping the copperplates in solution before the desired temperature is reached,since the contact of the copper surfaces with the electrolytewould start the reaction, leading to undesired phases.
Characterisation
Scanning electron microscopy (SEM) and energy dispersivespectroscopy (EDS) were done with a JEOL 6400, a FEI XL30, ora FEI-Nova NanoSEM 450. As MOFs are not conductive, thesamples were sputtered before SEM observation with Pt/Pd inorder to increase the conductivity and improve the imaging.
FIB cross sections were taken with a Focus Ion Beamequipped FIB-NanoSEM FEI Nova 600 Nanolab, and no Pt/Pdcoating was used for this technique. X-ray diffraction patternswere recorded with a Seifert 3003 T and with a Bruker D8Discover.
Results and discussionThe mechanism of anodic MOF deposition
The electrodeposition mechanism we propose is shown in Fig. 1with a sketch and SEM pictures. It can be divided in four pha-ses: nucleation, growth of islands, intergrowth and detachment.At the beginning, copper(II) ions are released in solution wherethe linker is present; when the critical concentration of reagentsis reached, nuclei form in solution and on the surface (Phase I:initial nucleation); these nuclei grow to micrometric-sizedcrystals on the surface next to and on top of each other (Phase II:growth of islands); new crystals keep on nucleating (progressivenucleation) and grow forming an intergrown layer (Phase III:intergrowth). Lastly, parts of the MOF layer lose contact with thesubstrate and are released into the solution, aided by theinternal stress in the MOF layer and the undercut of the crystals(Phase IV: detachment).
The phases are described in the following sections:Phase 1: initial nucleation. During the initial phase, the
metal substrate starts dissolving anodically in the solutioncontaining the linker, and the rst crystals nucleate on theelectrode surface. The nucleation tends to start from defects ofthe substrate, but if a very at surface (e.g. a copper-coatedsilicon wafer) is used, isolated nearly monodisperse crystals canbe observed aer nucleation (Fig. 1a).
To better understand the initial phase of the process, theelectrode variation in mass was studied during nucleation withan Electrochemical Quartz Micro Balance (EQCM, Fig. 2). Using
This journal is © The Royal Society of Chemistry 2016

Fig. 1 Proposedmechanism of MOF anodic electrodeposition and SEM pictures, taken at a 75� angle with the normal, of the four phases: (I) initialnucleation (a), (II) growth of islands (b), (III) intergrowth (c) (III) and detachment (d). Copper-coated wafer substrate, 2 V vs. counter electrode,after 10 s, 10 min, 60 min and 125 min.
Fig. 2 (a) EQCM plot with the measured mass variation, the calculatedloss in mass assuming 100% efficiency of Cu dissolution, and the netdeposition of MOF (experiment run at 0.5 mA cm�2). (b) EQCM plots ofHKUST-1 deposition at different current densities (the inset shows thepotential during deposition).
Paper Journal of Materials Chemistry A
Publ
ishe
d on
11
Febr
uary
201
6. D
ownl
oade
d on
13/
11/2
016
17:3
4:52
. View Article Online
galvanic depositions it is observed that nucleation of HKUST-1happens only aer a certain lag time during which the mass ofthe electrode decreases (Fig. 2a) in accordance with Faraday'slaw (assuming 100% current efficiency). This effect can beexplained by the fact that a critical metal ion (and ligand)
This journal is © The Royal Society of Chemistry 2016
concentration (Cc) needs to be reached on the electrode surfaceto start the nucleation of the MOF phase. When the criticalconcentration is reached, the EQCM signal bends upward,corresponding to a net increase in the mass of the vibratingquartz crystal. A similar effect was reported earlier for phos-phate conversion layers,31 and the event can be isolated bysubtracting the variation of mass due to the dissolution ofcopper (calculated using Faraday's law and assuming 100%current efficiency for the dissolution of copper), from the vari-ation of mass measured at the electrode (Fig. 2a).
Fig. 2b shows EQCM plots taken during electrochemicaldepositions done at different current densities. It is evident thatmore time and more metal ions are needed to nucleate MOFcrystals if lower current densities are used. At the lowest currentdensities, the nucleation threshold is never reached and theonly thing happening in the timeframe of the experiment is thedissolution of the copper substrate in solution, and thereforethe formation of MOF crystals as free crystals in solution andnot as a coating. In the long term and at low currents, the acidityof the solution plays an increasing role and the dissolution ofthe substrate. Eventually a MOF coating may form on the elec-trode if enough copper is available, similarly to a “corrosiondeposition”15 or a “galvanic displacement”.32
It is possible to estimate the concentration of copper ions onthe electrode surface using a one-dimensional diffusion equa-tion (Fick's second law):
vc
vt¼ D
v2c
vx2(3)
where c is the copper concentration, t the time, D the diffusionconstant, and x the distance from the electrode. This assumesthat free convection does not set-in during the time of theexperiment or that the anode is facing upwards so that thedensity gradient is stable. If we take the initial concentration ofcopper ions in solution to be zero everywhere (c¼ 0, x$ 0, t < 0),and assume that the ux of copper ions at the surface is relatedto the applied current density via Faraday's law:
�Dvc
vx
����x¼0
¼ J
nF(4)
J. Mater. Chem. A, 2016, 4, 3914–3925 | 3917
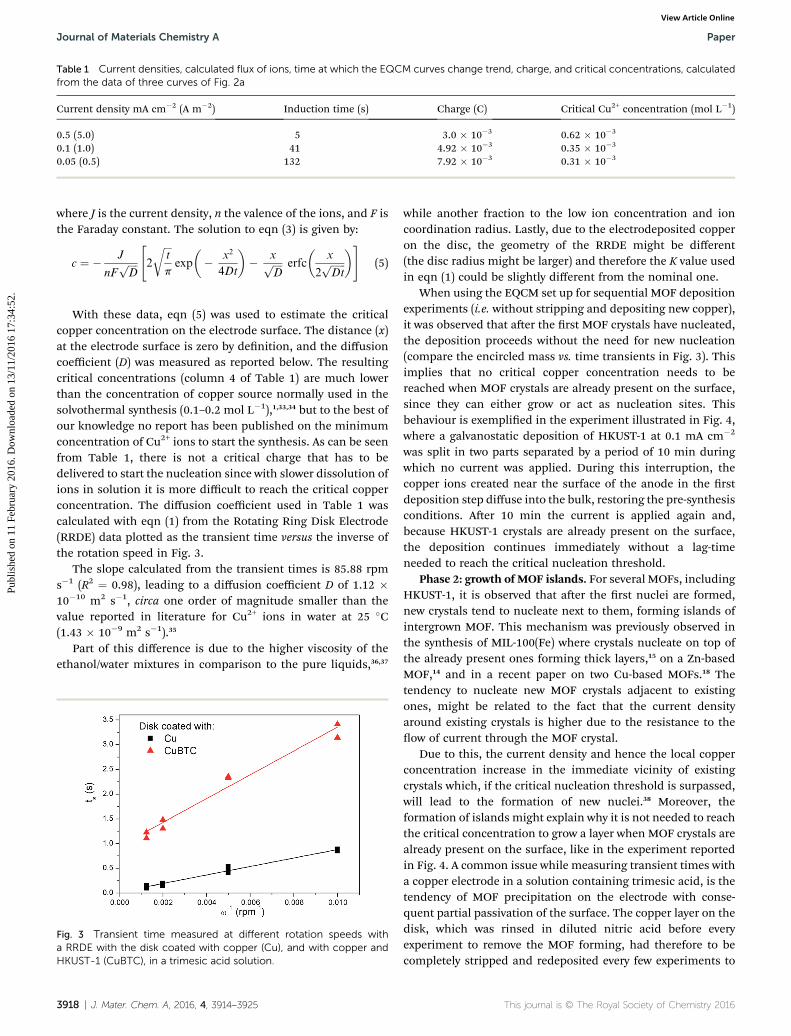
Table 1 Current densities, calculated flux of ions, time at which the EQCM curves change trend, charge, and critical concentrations, calculatedfrom the data of three curves of Fig. 2a
Current density mA cm�2 (A m�2) Induction time (s) Charge (C) Critical Cu2+ concentration (mol L�1)
0.5 (5.0) 5 3.0 � 10�3 0.62 � 10�3
0.1 (1.0) 41 4.92 � 10�3 0.35 � 10�3
0.05 (0.5) 132 7.92 � 10�3 0.31 � 10�3
Journal of Materials Chemistry A Paper
Publ
ishe
d on
11
Febr
uary
201
6. D
ownl
oade
d on
13/
11/2
016
17:3
4:52
. View Article Online
where J is the current density, n the valence of the ions, and F isthe Faraday constant. The solution to eqn (3) is given by:
c ¼ � J
nFffiffiffiffiD
p"2
ffiffiffit
p
rexp
�� x2
4Dt
�� xffiffiffiffi
Dp erfc
�x
2ffiffiffiffiffiffiDt
p�#
(5)
With these data, eqn (5) was used to estimate the criticalcopper concentration on the electrode surface. The distance (x)at the electrode surface is zero by denition, and the diffusioncoefficient (D) was measured as reported below. The resultingcritical concentrations (column 4 of Table 1) are much lowerthan the concentration of copper source normally used in thesolvothermal synthesis (0.1–0.2 mol L�1),1,33,34 but to the best ofour knowledge no report has been published on the minimumconcentration of Cu2+ ions to start the synthesis. As can be seenfrom Table 1, there is not a critical charge that has to bedelivered to start the nucleation since with slower dissolution ofions in solution it is more difficult to reach the critical copperconcentration. The diffusion coefficient used in Table 1 wascalculated with eqn (1) from the Rotating Ring Disk Electrode(RRDE) data plotted as the transient time versus the inverse ofthe rotation speed in Fig. 3.
The slope calculated from the transient times is 85.88 rpms�1 (R2 ¼ 0.98), leading to a diffusion coefficient D of 1.12 �10�10 m2 s�1, circa one order of magnitude smaller than thevalue reported in literature for Cu2+ ions in water at 25 �C(1.43 � 10�9 m2 s�1).35
Part of this difference is due to the higher viscosity of theethanol/water mixtures in comparison to the pure liquids,36,37
Fig. 3 Transient time measured at different rotation speeds witha RRDE with the disk coated with copper (Cu), and with copper andHKUST-1 (CuBTC), in a trimesic acid solution.
3918 | J. Mater. Chem. A, 2016, 4, 3914–3925
while another fraction to the low ion concentration and ioncoordination radius. Lastly, due to the electrodeposited copperon the disc, the geometry of the RRDE might be different(the disc radius might be larger) and therefore the K value usedin eqn (1) could be slightly different from the nominal one.
When using the EQCM set up for sequential MOF depositionexperiments (i.e. without stripping and depositing new copper),it was observed that aer the rst MOF crystals have nucleated,the deposition proceeds without the need for new nucleation(compare the encircled mass vs. time transients in Fig. 3). Thisimplies that no critical copper concentration needs to bereached when MOF crystals are already present on the surface,since they can either grow or act as nucleation sites. Thisbehaviour is exemplied in the experiment illustrated in Fig. 4,where a galvanostatic deposition of HKUST-1 at 0.1 mA cm�2
was split in two parts separated by a period of 10 min duringwhich no current was applied. During this interruption, thecopper ions created near the surface of the anode in the rstdeposition step diffuse into the bulk, restoring the pre-synthesisconditions. Aer 10 min the current is applied again and,because HKUST-1 crystals are already present on the surface,the deposition continues immediately without a lag-timeneeded to reach the critical nucleation threshold.
Phase 2: growth of MOF islands. For several MOFs, includingHKUST-1, it is observed that aer the rst nuclei are formed,new crystals tend to nucleate next to them, forming islands ofintergrown MOF. This mechanism was previously observed inthe synthesis of MIL-100(Fe) where crystals nucleate on top ofthe already present ones forming thick layers,15 on a Zn-basedMOF,14 and in a recent paper on two Cu-based MOFs.18 Thetendency to nucleate new MOF crystals adjacent to existingones, might be related to the fact that the current densityaround existing crystals is higher due to the resistance to theow of current through the MOF crystal.
Due to this, the current density and hence the local copperconcentration increase in the immediate vicinity of existingcrystals which, if the critical nucleation threshold is surpassed,will lead to the formation of new nuclei.38 Moreover, theformation of islands might explain why it is not needed to reachthe critical concentration to grow a layer when MOF crystals arealready present on the surface, like in the experiment reportedin Fig. 4. A common issue while measuring transient times witha copper electrode in a solution containing trimesic acid, is thetendency of MOF precipitation on the electrode with conse-quent partial passivation of the surface. The copper layer on thedisk, which was rinsed in diluted nitric acid before everyexperiment to remove the MOF forming, had therefore to becompletely stripped and redeposited every few experiments to
This journal is © The Royal Society of Chemistry 2016

Fig. 4 EQCM plot and potential of the electrode vs. Ag/AgCl duringtwo 4 min galvanostatic depositions at 0.1 mA cm�2 separated bya period of 10 min during which no current was applied. The circlesshow the initial induction time (I) needed for the first deposition andthe absence of this event when MOF crystals are already present in onthe surface (II).
Paper Journal of Materials Chemistry A
Publ
ishe
d on
11
Febr
uary
201
6. D
ownl
oade
d on
13/
11/2
016
17:3
4:52
. View Article Online
avoid a dri to longer transient times due to surface passiv-ation. To show more explicitly this occurrence, a MOF layer wasdeliberately grown on the disk surface (5 min 1.5 V vs. ref.) andthe same tests to measure the transient time were conducted.The resulting transient times (Ts) are plotted in Fig. 3, and it isevident how not only the Ts are longer, but also the tting linedoes not intercept the origin of the graph. Therefore, the MOFlayer contributes remarkably to the diffusion of copper ions,slowing them down and acting as an “apparent viscosity”.
As already reported for the solvothermal synthesis of HKUST-1,39 the nucleation during electrochemical synthesis of thisMOF is progressive and extends well into the crystal growthphase. Therefore, while in the rst seconds the crystals havealmost all the same size, aer the rst minutes of synthesis big(grown) crystals and small just nucleated ones are present in thesolvothermal bath. This behaviour was also observed in theelectrochemical synthesis, as shown in Fig. 5: the size distri-bution of the crystals broadens with time, and the average sizeincreases.
Fig. 5 Size distribution as a function of time for HKUST-1 crystalsgrown potentiostatically at 2.7 V vs. the counter electrode on a coppermesh in an ethanol/water (75 : 25 wt%) solution at 50 �C. The diameterof the crystals were measured by SEM.
This journal is © The Royal Society of Chemistry 2016
Phase 3: intergrowth. A very important phase of the deposi-tion process is the third, the intergrowth. The crystals keep onnucleating on the electrode surface and in the meantime thosealready nucleated grow to dimensions of several microns,eventually forming a compact layer. Electrochemically syn-thesised MOF coatings are self-closing since the crystals tend tocover all the metal surface still exposed rather than grow, forexample, in a dendritic mode. Layer growth becomes favouredover the non-MOF covered parts of the electrode because theconcentration of Cu2+ ions becomes higher in those areas,making the conditions favourable for new nucleation andgrowth of existing adjacent crystals. The copper ions concen-tration becomes higher over the uncovered parts of the elec-trode because the MOF layer shields the underlying copperyielding (1) a higher ohmic drop (hohmic) due to the resistance ofthe MOF layer, and (2), an increase in the concentration over-voltage (hconc) since, due to the presence of the MOF, copperions diffuse slower. The applied potential (E) on the copperelectrode can be written as:
E ¼ E0 + hactivation + hohmic + hconc (6)
where E0 is the standard redox potential of copper, and hactivation
is the activation overvoltage that drives the copper dissolution.The potential applied is the same on the whole electrodesurface, but from eqn (6) it can be deduced that over theuncovered areas, the activation overvoltage is higher, leading toa larger dissolution of copper ions and therefore favourableconditions for MOF nucleation and/or growth.
Stresses arise in most electrodeposition processes,40 anda home-made laser curvature device was built and used tomeasure the stresses occurring at the surface during MOF-electrodeposition. The cantilever used as working electrode forthe experiments has a conductive face which was coated withcopper, and a non-conductive one which is used to reect a laserbeam. Applying Stoney's formula (eqn (2)) it is possible tocalculate the stress in the lm. In the ESI‡ is reported a graphshowing the stress evolution in the copper lm upon depositionof HKUST-1. A compressive stress arises from the rst instantswhen the potential is applied. The compressive stress ispartially due to the dissolution of the copper lm whichcontains tensile stress28,29 and to the deposition of HKUST-1crystals. A compressive stress is in good agreement with theappearance of most MOF layers and HKUST-1 ones in partic-ular: the layers appear to be constituted by continuous lms ofintergrown crystals with good adhesion to each other, and whilebuckling of the layers can be observed, cracks have not beenreported for this MOF.17
As described already, MOF coatings can be synthesisedelectrochemically as one compact thin layer of intergrowncrystals.10 But if the conditions are favorable15 or the synthesis isrun for longer times,16 the obtained layers are more than onecrystal thick. As schematized in Fig. 6, once the substrate is fullycovered, further growth of the MOF layer can happen either atthe MOF–substrate interface, or at the MOF–solution interface.
Taking HKUST-1 as an example, a rst approach to under-stand where the MOF layer grows once the substrate is fully
J. Mater. Chem. A, 2016, 4, 3914–3925 | 3919

Fig. 6 Scheme of the two possible mechanisms of MOF growth: fromthe bottom, at the MOF–substrate interface (top), or from the top ofthe MOF–solution interface (bottom).
Fig. 7 SEM pictures of a Cu-INA(Cl) sample synthesised for 4 min andthen left in INA(F) solution for 1 h without applying any voltage, anda Cu-INA(F) sample synthesised for 4min in INA(F) and 4min in INA(Cl).
Journal of Materials Chemistry A Paper
Publ
ishe
d on
11
Febr
uary
201
6. D
ownl
oade
d on
13/
11/2
016
17:3
4:52
. View Article Online
covered is to look at the dimensions of the MOF micropores incomparison to the dimensions of the metal ions and linkers.The distorted octahedron characteristic of solvated copper(II)ions generated at the anode can pass through the MOF struc-ture, since the hydrated copper(II) ions have a diameter of 0.456nm,41 while the pores of HKUST-1 have a size of 0.9 � 0.9 nm.42
Indeed, the motion of small ions through MOF structures hasalready been shown in MOF-based batteries43 and super-capacitors44 electrodes, and the diffusion coefficient wascalculated in the previous section. Another proof of the motionof metal ions through the MOF layers is the edge effect oenobserved in their synthesis: when nomask is used in front of theanode, MOF crystals grow only at the edges of the electrode,leaving bare copper in the centre, see ESI.‡ In fact, if the layerswere perfectly insulating and solvated ions could not go throughthem, the growth, from amacroscopic point of view, would startfrom the edges of the anode (where the current density ishighest) and continue toward the centre, eventually coveringthe whole surface. Also, BTC3� molecules are expected to be toolarge to go inside the pores since the minimum calculateddiameter of the planar molecule is 2.1 nm, twice the dimensionsof HKUST-1 pores. In the recent conference transaction onwhich this work is based,45 we reported the adsorption of m-xylene and 1,3,5-tris(propan-2-yl)benzene in HKUST-1, demon-strating that molecules as big as trimesic acid cannot gothrough the pores of the MOF. In the same work this results wassupported by experiments based on the sequential synthesis ofHKUST-1 layers in solvents leading to crystals of differentdimensions. If the rst solvent used was water/methanol andthe second DMSO/methanol, the small crystals typical of thesecond solvents could be found on top of big crystals syn-thesised in the rst step, see ESI.‡ Other insights on theeffect of different solvents have been reported recently by VanAssche et al.46
These tests give strong indications that MOF layers growthoccurs at the MOF–electrolyte interface but are not conclusive.
3920 | J. Mater. Chem. A, 2016, 4, 3914–3925
It was therefore decided to run a set of experiments usingmodied linkers to have elemental markers in the MOFstructure.
As modied versions of trimesic acid are not availablecommercially, this investigation had to be conducted withcopper isonicotinate (Cu-INA), a MOF based on isonicotinicacid which can be purchased with uorine and chlorine assubstituent. These two halogen atoms are small enough to notsterically alter the framework and can be detected by EDS. Thedetails of the deposition of pure Cu-INA(X) (with X¼ Cl or F) arereported in the ESI.‡ To study the formation of multilayercoatings, the rst formed layer must be stable in the solutionused. Post-synthetic linker exchange has been reported by manyauthors with several MOFs,47,48 and is even more likely in theexperiments reported here as the linkers used are very similarand the second layer is grown in synthesis conditions similar tothose of the rst one. We observed that with Cu-INA(X) layers,the linker substitution occurs even if no current is applied, andthe morphology of the layers changes towards shapes moresimilar to those expected for the alternative linker, see Fig. 7. Infact, Cu-INA(F) and Cu-INA(Cl) can be easily discriminatedunder the microscope, as the crystals of the rst are shapedliked cubes, and those of the second one as plates. Fig. 7 showsthe surface morphology of two Cu-INA(X) layers synthesised andthen exposed to a solution of the other halogenated iso-nicotinate, with and without current imposed. In both cases,the top layer undergoes major changes upon exposure to thenew linker. When the layer is just le in solution, the crystalsonly change their shape, while when current is applied the newphase grows from the existing one. This is very evident in Fig. 7,where the plate shaped crystals typical of Cu-INA(Cl) growperpendicularly on top of the Cu-INA(F) cubes.
The deposition of a coating made by a sequence of two layersof Cu-INA(X) was achieved by growing a thick and compact rstlayer, followed by the deposition of the second, exposing theMOF layer for as little time as possible to the solution with thenew linker. The cross-sections of the samples were analysed byNanoSEM and EDS (Fig. 8). Already from the analysis of thecrystals and their positions, it might be said that the growth ofnew crystals happens on top of the existing one, but theelemental mapping shows unequivocally that this is whatactually happens. A clear division in concentration of thehalogen elements is observed: chlorine is found at the bottomwhen Cu-INA(Cl) is synthesised rst, and at the top when
This journal is © The Royal Society of Chemistry 2016

Fig. 8 (top) NanoSEM picture (cross-section) without (a) and with (b)elemental contrast of a Cu-INA(F) layer synthesised on a plate withalready Cu-INA(Cl) on it. (bottom) NanoSEM picture (cross-section)without (c) and with (d) elemental contrast of a Cu-INA(Cl) layer syn-thesised on a plate with already Cu-INA(F) on it. The green signal is dueto chlorine and the red to fluorine.
Fig. 9 SEM pictures of layers (synthesised at 2 V vs. Ag after 1 (a), 10 (b),and 60 (c) min on copper-coated silicon wafers) dipped in dilutedH2SO4 solution to remove the MOF crystals. The images show theevolution of the copper substrate underneath. On the bottom thesame sample synthesised for 60 s is viewed from the top (c) and withpart of the coating not dissolved by the acid, at 75� angle with thenormal (d).
Paper Journal of Materials Chemistry A
Publ
ishe
d on
11
Febr
uary
201
6. D
ownl
oade
d on
13/
11/2
016
17:3
4:52
. View Article Online
Cu-INA(Cl) is synthesised last, and the analogous behaviour isobserved for uorine. Therefore, it can be stated that the rstlayer synthesised is found on the bottom of the lm and thesecond on the top and hence MOF layers grow at the MOF–electrolyte interface by the diffusion of copper through the MOFlayer.
Phase 4: detachment. During the last phase, crystals detachfrom the surface and expose empty spots of bare metal. Thisphase of the deposition has to be avoided if a high qualitydeposition is targeted. The reason behind the detachment is themechanism of the MOF growth elucidated above. As demon-strated when using the uorine and chlorine substituted nico-tinic acid, the copper ions migrate through the MOF layer toreact at the MOF–solution interface. This implies that thecopper substrate below the MOF layer dissolves due to theelectrochemical formation of copper ions creating voids belowtheMOF layer. These voids eventually lead to the buckling of theMOF layer (due to the compressive stresses shown previously)and detachment of single crystals or, more oen, of largecoating areas.
Moreover, it is observed that during the anodic electro-chemical MOF synthesis, the copper substrate does not dissolveuniformly, but dissolves preferentially at certain locations.These preferential sites do not correspond to the space betweenMOF crystals, but most probably to the grain boundaries of thesubstrate (Fig. 9d).
Cathodic deposition of HKUST-1
As described in the introduction, the cathodic depositionmechanism has already been studied and described in detailsfor MOF-5.20,21 The stages in which the process evolves aresimilar to the initial ones shown above for the anodic synthesis:
This journal is © The Royal Society of Chemistry 2016
nucleation of dispersed nuclei, formation of islands of crystals,and intergrowth. An interesting difference with the anodicapproach is that, at least for MOF-5, if two layers are synthesisedsequentially, the second one is not found at the top of the rst,but at the bottom, therefore the whole problem of detachmentdue to undercut does not apply for this approach.49
In order to explore the mechanism of cathodic deposition inthe case of a different MOF and increase the knowledge on theelectrochemical technique, HKUST-1 was synthesised cathodi-cally starting from a DMF/water solution containing copper(II)nitrate, trimesic acid, and sodium tetrauoroborate asconductive electrolyte. The appearance of the lms that can beobtained cathodically depends strongly on the potentialapplied. As can be observed from the XRD patterns of thesamples, shown in Fig. 10, applying slightly cathodic potentialsthe substrates get covered only by copper (reaction 1), whilestarting from �1 V vs. Ag/Ag(Crypt)+ also HKUST-1 can bedetected.
Cu2+ + 2e� % Cu0 (7)
NO3� + 4e� + 2H+ % NO2
� + H2O (8)
NO2� + 3H2O % NO3
� + 2OH� + 2H2 (9)
OH� + H3BTC % H2BTC� + H2O (10)
H2BTC� + Cu2+ % HKUST-1[Cu3BTC2] (11)
The cathodic electrodeposition is due to a shi in the pH inthe proximity of the electrode surface which has so far beenattributed to the reduction of nitrates acting as pro-bases,reaction 2, 3, followed by 4.20,22 Due to the fact that nitrates in
J. Mater. Chem. A, 2016, 4, 3914–3925 | 3921

Fig. 10 XRD of samples synthesised cathodically at different potentialsvs. Ag/Ag(Crypt)+ applying a total of 1C of charge. HKUST-1 simulatedpattern is shown in red, - are due to the FTO substrate and B is thecharacteristic peak of copper metal.
Fig. 11 (a) SEM images of the lower layer (small crystals + copper) and(b) of the transition step between the two regions (small crystal +copper and big crystals) in a sample synthesised for 3 min at �1.2 V vs.ref.
Fig. 12 SEM-FIB cross-section of a sample showing the two layers ontop of each other: small crystals + copper and big crystals.
Journal of Materials Chemistry A Paper
Publ
ishe
d on
11
Febr
uary
201
6. D
ownl
oade
d on
13/
11/2
016
17:3
4:52
. View Article Online
this environment get reduced at�1.6 V vs. ref.,20 it can be statedthat for this MOF the reduction step does not (necessarily) passvia a pro-base like in the case of MOF-5, but it is the hydrogenevolving at the electrode which directly moves the equilibriumand triggers the deprotonation of the ligand, reaction (12) fol-lowed by (10) and (11).
2H2O + 2e� % 2OH� + H2 (12)
To be sure of this, CVs were run in a trimesic acid solutionfree of copper ions, see ESI.‡ The onset of hydrogen formation,and consequent H3BTC deprotonation, is observable at �1.0 Vvs. ref., which is exactly the potential where the deposition ofHKUST-1 is observed, see XRD in Fig. 10. At the same time, ifcopper ions are present in the solution, copper deposits at anypotential more negative than the open circuit.
Already with MOF-5 it was observed that it is difficult tosynthesise a layer free of co-deposited zinc metal, and the use ofcopper which is much nobler than zinc makes the co-depositioneven more likely. In the case of HKUST-1 electrodeposition,moving towards more cathodic potentials, the amount ofcopper decreases in comparison to the MOF phase in thesamples. At potentials more negative than �2 V vs. Ag/Ag(Crypt)+ the synthesised layers appear rough and uneven,probably due to the diffusion limitation of the reagents and sidereactions. At very cathodic potentials one could expect thereduction of the coordination centres of the MOF to coppermetal, as already reported by Loera-Serna et al.50 or duringelectrophoretic deposition,51 but, under the conditions tested,this reduction could not be observed or at least did not repre-sent a major contribution to the composition of the layers or theshape and size of the crystals.
In all the samples synthesised it can be observed that thedeposits are divided in two layers, a thin and adherent one, anda thick one, see ESI‡ and Fig. 11a. Using the SEM it wasobserved that the thick layer oen sits on top of the thin one,
3922 | J. Mater. Chem. A, 2016, 4, 3914–3925
and consists of relatively big and well interlocked octahedralcrystals, while the thin one is composed of agglomerates andsmaller crystals, see Fig. 11, 12 and ESI.‡ From the crystalsshape and layer composition (both phase and elemental, seeESI‡) it can be speculated that the top part is made out ofHKUST-1 crystals, while the lower one by a co-deposited coatingmade out of copper and MOF. As seen before, MOF crystalsshield the electrode surface from the supply of ligand, while justhamper the diffusion of metal ions. This might be a reason why,if the conditions are favourable for MOF formation in theproximity of the cathode, crystals nucleate and intergrownforming a layer of big crystals, while at the same time, closer tothe surface, the concentration of ligand is lower and thereforesmaller crystals and copper metal are the occurring phases.Choosing two potentials, e.g. �1.2 V and�1.6 V, it is possible topartially tune the amount of each layer. Coatings synthesised atmore cathodic potentials consist mostly of the big crystals layer,do not have a good adhesion to the FTO plates and can be easilywashed away aer synthesis before they dry. On the otherhand, layers synthesised at �1.2 V have a higher amount of theco-deposited copper + small MOF crystal and overall betteradhesion to the substrate: in fact only the crystals on the top ofthe coating detach upon washing.
This journal is © The Royal Society of Chemistry 2016

Paper Journal of Materials Chemistry A
Publ
ishe
d on
11
Febr
uary
201
6. D
ownl
oade
d on
13/
11/2
016
17:3
4:52
. View Article Online
The evolution of the layers during electrodeposition wasmonitored by synthesising samples at different times. Applying�1.2 V vs. ref. it can be observed that copper metal deposits rst(see XRD in ESI‡), creating a substrate where MOF crystalsnucleate and grow. As can be seen from the SEM pictures re-ported in ESI,‡ copper can always be seen from a top view at anytime, which implies that it continues to deposit even when theMOF is nucleating and growing. Therefore a two phases co-deposit is observed. On the other hand, applying �1.6 V, therst phase to deposit is HKUST-1, and only aer a relatively longdeposition time the signal of copper becomes visible in theXRD. This is probably due to the fact that more protons thancopper ions get reduced at this potential signicantly increasingthe deprotonation of trimesic acid and consequent depositionof HKUST-1. As already observed by Li et al. with MOF-5,20 theelectrodeposition of HKUST-1 in the early stages followsa similar pattern as the one observed for the anodic synthesis:nucleation of small nuclei, islands growth, and intergrowth, seeESI.‡ No detachment phase can be observed due to the absenceof problems related to crystals undercut.
Considerations about the techniques
The choice of the substrate is regarded as the most evidentdifference between the anodic and cathodic depositionmethods: allegedly, the anodic synthesis is limited by substratescontaining the metal centres needed for the MOF SecondaryBuilding Unit (SBU), while the cathodic synthesis is not boundto the choice of the substrate, as long as it is conductive.
While at rst glance this statement might be correct, thedevelopments of both approaches showed a more complexpattern. On one hand, many metals can be deposited onconductive surfaces and then used as substrates to grow MOFanodically,15 and it was demonstrated also that starting fromelectrodeposited hydroxides or not too stable oxides, it ispossible to obtain anodically layers of MOFs containing rareearths on any conductive surface.13 On the other hand, it wasrecently discovered that the actual mechanism of cathodicdeposition of MOF-5 is not triggered only by the change of thepH which deprotonates the ligand, but passes via the synthesisof an hydroxide which is then converted into MOF,21 and, if theparameters are optimised, all the hydroxide is transformed intoa MOF layer at the end of the synthesis.21 Therefore, the choiceof the substrate should not be seen as a limitation for any of thetwo methods.
Crucial parameters to keep in consideration for the electro-chemical method are the nature of the metal used and the pH ofthe solution. The pH is normally directly connected with theligand used, since the pKa of the active sites of the liganddetermines the pH required to have deprotonation. With theanodic approach, particularly in solutions containing water andoxygen, a high pH leads to the preferential production of oxidesor hydroxides instead of free ions. The situation becomes worsefor metals prone to passivation like nickel or aluminium,19
while it is not an issue with more noble metals like copper52 orwhich do not passivate in the used conditions, like iron.15 Onthe other hand, also using the cathodic approach it is difficult to
This journal is © The Royal Society of Chemistry 2016
avoid the deposition of hydroxides or oxides (one of the reasonswhy all the syntheses reported so far are run in DMF), or puremetal,20 except when using elements which are too anodic to beelectrodeposited within the potential window of the electrolyte(like rare earths, Al or Mg) and the synthesis environment is alsokept relatively acidic.20,22
The previous sections reported the case of a MOF which canbe electrodeposited both anodically and cathodically. In bothcases the crystallinity of the samples is very good, but the(microscopic) appearance of the layers is very different.Although this might be specic for HKUST-1, from the cross-sections, anodically synthesised layers are more compact thanthose synthesised cathodically, but the bottom part of the latterare well mixed with co-deposited copper metal, which might bean advantage for adherence and for applications requiring fastheat transfer. Anodically synthesised samples can show micro-scopic defects due to undercut while, due to the differentsynthetic mechanism, cathodically deposited samples do notshow these types of defects, but might have macroscopic ones(aking) if the potential applied is too cathodic and not enoughcopper is co-deposited in the layer.
In order to deposit a new MOF layer electrochemically, allthese concepts should be kept in mind before choosing if andwhich approach to use. For example, one of the reasons whycarboxylates remain so popular for both anodic and cathodicsyntheses is that their low pKa helps keeping the electrolyteacidic, which prevents the deposition of unwanted secondaryphases. The metals used in the syntheses so far reported inliterature are also indicative of the best approach to take: noblemetals (copper), but not too noble since dissolution in neces-sary, and non-passivating ones (iron) are very practical foranodic deposition, while anodic ones (zinc and the rare earths)are more suitable for cathodic deposition. If both approacheswork, like in the case of HKUST-1, the choice can be made byfocusing on the application or on the practicability of themethod. It is beyond the scope of this paper to discuss this issuebut, for example, it might be speculated that for applicationsrequiring good heat transfer and large amount of crystals, theco-deposited MOF-copper layers obtained cathodically areexpected to be better than layers synthesised anodically. On theother hand, if a high amount of well adherent MOF per unit areais required, anodic layers, which are normally denser, seems tobe more promising.
Regarding the possible scale-up of the electrochemicaltechnique, it must be pointed out that the anodic synthesisrequires either a metal, or an intermediate step to form thesubstrate, while the cathodic one makes use of metal ions,which are on average easier to acquire and cheaper. But thecathodic synthesis makes use of relatively expensive stabilisingsolvents as DMF to avoid rapid MOF formation in solution,while the anodic synthesis can make use of cheaper ones likealcohols. In the same time, the electrolytic bath of the anodicsynthesis can be used for long times, and can easily stand weekswithout degrading, while the cathodic one, having both metalions and ligand in it, is prone to degradation yielding MOFcrystals in solution. An experiment showed that the electrolytebath for cathodic deposition can be used a few days aer it is
J. Mater. Chem. A, 2016, 4, 3914–3925 | 3923

Journal of Materials Chemistry A Paper
Publ
ishe
d on
11
Febr
uary
201
6. D
ownl
oade
d on
13/
11/2
016
17:3
4:52
. View Article Online
prepared, while the electrolyte bath for anodic deposition is stilluseable aer months.
Conclusions
In this paper we studied and compared the anodic and thecathodic electrochemical deposition mechanisms of Metal–Organic Frameworks (MOFs).
A mechanism has been proposed to explain the anodic MOFelectrodeposition process. The mechanism consist of fourphases: (I) initial nucleation, (II) growth of MOF islands, (III)intergrowth, and (IV) crystal detachment. When an electricpotential is applied, a lag time is needed before the electrode-position of MOF on a bare surface starts. The duration of thislag time depends on the applied current and arises from thetime that is needed to reach the critical ion concentrationthreshold for nucleating the new MOF phase. The nucleation isprogressive and the dimensions of the crystals depend on thesynthesis time and choice of the solvent. The growth of MOFlayers happens at the MOF–solution interface, meaning thatcopper ions are dissolved at the metal–MOF interface, migratethrough the MOF layer and react with the linker from thesolution. This leads to the creation of voids at the substrate–MOF interface that eventually lead to the buckling of the brittleMOF layers and detachment due to the undercutting of theMOFlayer.
The cathodic approach was applied to the same MOF used tostudy the anodic method, HKUST-1. For this MOF, no pro-baseis needed to start the synthesis, which therefore can start atpotentials less cathodic in comparison to MOF-5. The lms andthe type of deposit are found to vary with the applied potential,and the nucleation and growth follow a similar pattern to theanodic one, although the phase which nucleates rst, metal orMOF, is potential dependent. The adhesion of the layers to thesubstrate is due to the intergrowth of the metallic copper phasewith the MOF, and the potential applied inuences the ratiobetween metallic copper and MOF in the layers.
In general, when choosing to use the electrochemicalmethod to synthesise layers, one should rst focus on thenature of the metal to be used for the SBU (is it noble or not,does it passivate or make hydroxides) and then on the choice ofthe ligand, which normally is connected to the solution pH.When these parameters are clear, the choice of anodic orcathodic approach becomes easier and sometimes, like in thecase of HKUST-1, the layers can be obtained with both twotechniques, and the resulting layers are not so different incrystallinity, but vary remarkably in the morphology, which mayor may not be important for their application.
Acknowledgements
The authors would like to acknowledge T. Van der Donck(Hercules 3 ZW09-09 project) for some of the NanoSEM picturesand Professor B. W. Sheldon (Brown University) for the inter-esting discussion on the stress evolution part. The authorsthank IWT for the support in the SBO project MOFShape. NC, LSand JF thank Dr G. Stafford (NIST) for his contribution in the
3924 | J. Mater. Chem. A, 2016, 4, 3914–3925
construction of the electrochemical laser curvature set-up. NCis very grateful to the FWO short staying abroad scheme(V441415N) and to the Royal Society of Chemistry, MaterialsChemistry Division, for their trust and support to the visitperiod at the Massachusetts Institute of Technology. M.D. wassupported by the U.S. Department of Energy, Office of Science,Office of Basic Energy Sciences (U.S. DOE-BES, Award No. DE-SC0006937).
Notes and references
1 S. S. Y. Chui, S. M.-F. Lo, J. P. H. Charmant, A. G. Orpen andI. D. Williams, Science, 1999, 283, 1148–1150.
2 N. Stock and S. Biswas, Chem. Rev., 2011, 112, 933–969.3 H. Furukawa, K. E. Cordova, M. O'Keeffe and O. M. Yaghi,Science, 2013, 341, 1230444.
4 A. Betard and R. A. Fischer, Chem. Rev., 2012, 112, 1055–1083.
5 O. Shekhah, J. Liu, R. A. Fischer and C. Woll, Chem. Soc. Rev.,2011, 40, 1081–1106.
6 M. D. Allendorf, C. A. Bauer, R. K. Bhakta and R. J. T. Houk,Chem. Soc. Rev., 2009, 38, 1330–1352.
7 S. Qiu, M. Xue and G. Zhu, Chem. Soc. Rev., 2014, 43, 6116–6140.
8 N. Rangnekar, N. Mittal, B. Elyassi, J. Caro and M. Tsapatsis,Chem. Soc. Rev., 2015, 44, 7128–7154.
9 U. Mueller, US Pat., 2007/0227898 A1, 2007.10 R. Ameloot, L. Stappers, J. Fransaer, L. Alaerts, B. F. Sels and
D. E. De Vos, Chem. Mater., 2009, 21, 2580–2582.11 H. Al-Kutubi, J. Gascon, E. J. Sudholter and L. Rassaei,
ChemElectroChem, 2015, 2, 462–474.12 A. Betard and R. A. Fischer, Chem. Rev., 2012, 112, 1055–
1083.13 N. Campagnol, E. R. Souza, D. E. De Vos, K. Binnemans and
J. Fransaer, Chem. Commun., 2014, 50, 12545–12547.14 K.-Y. Cheng, J.-C. Wang, C.-Y. Lin, W.-R. Lin, Y.-A. Chen,
F.-J. Tsai, Y.-C. Chuang, G.-Y. Lin, C.-W. Ni, Y.-T. Zeng andM.-L. Ho, Dalton Trans., 2014, 43, 6536–6547.
15 N. Campagnol, T. Van Assche, T. Boudewijns, J. Denayer,K. Binnemans, D. De Vos and J. Fransaer, J. Mater. Chem.A, 2013, 1, 5827–5830.
16 T. R. C. Van Assche and J. F. M. Denayer, Chem. Eng. Sci.,2013, 95, 65–72.
17 B. Van de Voorde, R. Ameloot, I. Stassen, M. Everaert, D. DeVos and J.-C. Tan, J. Mater. Chem. C, 2013, 1, 7716–7724.
18 S. Sachdeva, A. Pustovarenko, E. J. Sudholter, F. Kapteijn,L. C. de Smet and J. Gascon, CrystEngComm, 2016.
19 A. Martinez Joaristi, J. Juan-Alcaniz, P. Serra-Crespo,F. Kapteijn and J. Gascon, Cryst. Growth Des., 2012, 12,3489–3498.
20 M. Li and M. Dinca, J. Am. Chem. Soc., 2011, 133, 12926–12929.
21 M. Li and M. Dinca, Chem. Mater., 2015, 27, 3203–3206.22 H. Liu, H. Wang, T. Chu, M. Yu and Y. Yang, J. Mater. Chem.
C, 2014, 2, 8683–8690.23 H. Liu, T. Chu, Z. Rao, S. Wang, Y. Yang and W. T. Wong,
Adv. Opt. Mater., 2015, 3(11), 1545–1550.
This journal is © The Royal Society of Chemistry 2016
Paper Journal of Materials Chemistry A
Publ
ishe
d on
11
Febr
uary
201
6. D
ownl
oade
d on
13/
11/2
016
17:3
4:52
. View Article Online
24 I. Stassen, M. J. Styles, T. R. Van Assche, N. Campagnol,J. Fransaer, J. F. Denayer, J.-C. Tan, P. Falcaro, D. E. DeVos and R. P. Ameloot, Chem. Mater., 2015, 27, 1801–1807.
25 T. R. C. Van Assche, G. Desmet, R. Ameloot, D. E. De Vos,H. Terryn and J. F. M. Denayer, Microporous MesoporousMater., 2012, 158, 209–213.
26 J. Newman, J. Electrochem. Soc., 1966, 113, 501–502.27 B. Gonzalez, N. Calvar, E. Gomez and A. Domınguez, J. Chem.
Thermodyn., 2007, 39, 1578–1588.28 O. E. Kongstein, U. Bertocci and G. R. Stafford,
J. Electrochem. Soc., 2005, 152, C116–C123.29 S. Ahmed, T. T. Ahmed, M. O'Grady, S. Nakahara and
D. N. Buckley, J. Appl. Phys., 2008, 103, 103–115.30 A. Lewandowski, M. Osinska, A. Swiderska-Mocek and
M. Galinski, Electroanalysis, 2008, 20, 1903–1908.31 K. M. Ogle, C. Gabrielli, M. Keddam and M. Perrot,
J. Electrochem. Soc., 1994, 141, 2655–2658.32 R. Ameloot, L. Pandey, M. Van der Auweraer, L. Alaerts,
B. F. Sels and D. E. De Vos, Chem. Commun., 2010, 46,3735–3737.
33 E. Biemmi, S. Christian, N. Stock and T. Bein, MicroporousMesoporous Mater., 2009, 117, 111–117.
34 M. Hartmann, S. Kunz, D. Himsl and O. Tangermann,Langmuir, 2008, 24, 8634–8642.
35 W. M. Haynes, CRC Handbook of Chemistry and Physics, 2005.36 I. S. Khattab, F. Bandarkar, M. A. A. Fakhree and A. Jouyban,
Korean J. Chem. Eng., 2012, 29, 812–817.37 B. Gonzalez, N. Calvar, E. Gomez and A. Domınguez, J. Chem.
Thermodyn., 2007, 39, 1578–1588.38 J. Fransaer and J. R. Roos, J. Heat Transfer, 1992, 114, 317–
325.
This journal is © The Royal Society of Chemistry 2016
39 F. Millange, R. El Osta, M. E. Medina and R. I. Walton,CrystEngComm, 2011, 13, 103–108.
40 F. Czerwinski, J. Electrochem. Soc., 1996, 143, 3327–3332.41 I. Persson, Pure Appl. Chem., 2010, 82, 1901–1917.42 C. Prestipino, L. Regli, J. G. Vitillo, F. Bonino, A. Damin,
C. Lamberti, A. Zecchina, P. L. Solari, K. O. Kongshaug andS. Bordiga, Chem. Mater., 2006, 18, 1337–1346.
43 R. Demir-Cakan, M. Morcrette, F. Nouar, C. Davoisne,T. Devic, D. Gonbeau, R. Dominko, C. Serre, G. Ferey andJ. M. Tarascon, J. Am. Chem. Soc., 2011, 133, 16154–16160.
44 N. Campagnol, R. Romero-Vara, W. Deleu, L. Stappers,K. Binnemans, D. E. De Vos and J. Fransaer,ChemElectroChem, 2014, 1, 1182–1188.
45 N. Campagnol, T. Van Assche, L. Stappers, J. F. M. Denayer,K. Binnemans, D. E. De Vos and J. Fransaer, ECS Trans.,2014, 61, 25–40.
46 T. R. Van Assche, N. Campagnol, T. Muselle, H. Terryn,J. Fransaer and J. F. Denayer, Microporous MesoporousMater., 2016, 224, 302–310.
47 O. Karagiaridi, W. Bury, J. E. Mondloch, J. T. Hupp andO. K. Farha, Angew. Chem., Int. Ed., 2014, 53, 4530–4540.
48 J. G. Nguyen and S. M. Cohen, J. Am. Chem. Soc., 2010, 132,4560–4561.
49 M. Li and M. Dinca, Chem. Sci., 2014, 5, 107–111.50 S. Loera-Serna, M. A. Oliver-Tolentino, M. Lopez-Nunez,
A. Santana-Cruz, A. Guzman-Vargas, R. Cabrera-Sierra,H. I. Beltran and J. Flores, J. Alloys Compd., 2012, 540, 113–120.
51 H. Zhu, H. Liu, I. Zhitomirsky and S. Zhu, Mater. Lett., 2015,142, 19–22.
52 R. Ameloot, L. Stappers, J. Fransaer, L. Alaerts, B. F. Sels andD. E. De Vos, Chem. Mater., 2009, 21, 2580–2582.
J. Mater. Chem. A, 2016, 4, 3914–3925 | 3925