
Journal of Marketing Vistas€¦ · Marketing, Promotion Management, New Product Management,...
80
ISSN 2249-9067 Volume 7, No 2, July-December 2017 Journal of Marketing Vistas Social Media at the Top of Mind Rajeshwari Panigrahi and Vemula Rajesh Social Media Marketing: The New Revolution In Business Engagement Gursimranjit Singh, Maninder Singh and Priyanka Singh The Market for Organic Foods: The Case of Hyderabad City (TS) M. P. Siva Kumar The Volkswagen Way, Profits over Sustainability A. Sridhar Raj Luxury Fashion Goods and Sustainable Consumption Behaviour V. Shilpa and C. Madhavaiah Indexed in: • UGC List of Journals • Ebsco Database • ProQuest
Transcript of Journal of Marketing Vistas€¦ · Marketing, Promotion Management, New Product Management,...

ISSN 2249-9067
Volume 7, No 2, July-December 2017
Journal of Marketing Vistas
Social Media at the Top of Mind Rajeshwari Panigrahi and Vemula Rajesh
Social Media Marketing: The New Revolution In Business Engagement Gursimranjit Singh, Maninder Singh and Priyanka Singh
The Market for Organic Foods: The Case of Hyderabad City (TS) M. P. Siva Kumar
The Volkswagen Way, Profits over Sustainability A. Sridhar Raj
Luxury Fashion Goods and Sustainable Consumption Behaviour V. Shilpa and C. Madhavaiah
Indexed in:• UGCListofJournals
• EbscoDatabase
• ProQuest

Aims and ScopeJournal of Marketing Vistasprovidesaplatformtomarketingprofessionalsfromacademiaand industry to exchange information on emergingmarketing practices and theory acrossindustry around the globe.
ArticlesintheJournalfurnishinformationontrendsinareasincluding,butnotlimitedto,StrategicMarketing, Promotion Management, New Product Management, Pricing Decisions, Product-Line Management, Competitive Strategy, Buyer Behaviour, Marketing Research, MarketInformation System, International Marketing, Services Marketing, Segmentation Targetingand Positioning, Sales Force Management, Retail Management, Customer Relationships Management and e-Marketing.
• Nopartofthispublicationmaybereproducedorcopiedinanyformbyanymeanswithoutpriorwrittenpermission.
• TheviewsexpressedinthispublicationarepurelypersonaljudgmentsoftheauthorsanddonotreflecttheviewsoftheInstituteofPublicEnterprise.
• Theviewsexpressedbyoutsidecontributorsrepresenttheirpersonalviewsandnotnecessarilytheviewsofthe organizations they represent.
• Alleffortsaremadetoensurethatthepublishedinformationiscorrect.TheInstituteofPublicEnterpriseisnotresponsibleforanyerrorscausedduetooversightorotherwise.
• Copyright@2017,InstituteofPublicEnterprise.AllRightsReserved.
Published by: Satyam N Kandula on behalfofInstituteofPublicEnterpriseOwned by:InstituteofPublicEnterprisePrinted by:SatyamNKandulaonbehalfofInstituteofPublicEnterprisePrinted at:WideReachAdvertisingPvtLtd,21,SuryaEnclave,Trimulgherry,Hyderabad-500015Place of Publication:InstituteofPublicEnterprise,OUCampus,Hyderabad-500007
We thank Indian Council of Social Science Research (ICSSR) for financial assistance for publication of the Journal.

Journal of Marketing Vistas
Editorial Board
EditorR.K. Mishra, Professor&Director,InstituteofPublicEnterprise,Hyderabad
ManagingEditorM. Meher Karuna, AsstProfessor,InstituteofPublicEnterprise,Hyderabad
Darshana Dave, Professor,GHPatelPGInstituteofBusinessManagementSardarPatelUniversity,GujaratSR Subba Rao, MarketingConsultant,HyderabadManish Sidhpuria, Professor,DepartmentofBusiness&IndustrialManagement,VeerNarmadSouthGujaratUniversity,Surat,GujaratRajnikant P Patel, Professor,GHPatelPGInstituteofBusinessManagement,SardarPatelUniversity,GujaratT Mathew, St.FrancisInstituteofManagementandResearch,MumbaiJayashree Dubey, AsstProfessor,IndianInstituteofForestManagement,Bhopal
Editorial Advisory BoardAbhinandan K Jain, AdjunctProfessor,IndianInstituteofManagement,AhmedabadHC Chaudhary, Professor,FacultyofManagementStudies,BanarasHinduUniversity,UPM Alimullah Miyan, Vice-Chancellor&Founder,InternationalUniversityofBusiness,AgricultureandTechnology,Dhaka,BangladeshRajagopal, ProfessorofMarketing,EGADEBusinessSchool,MonterreyInstituteofTechnologyandHigherEducation,MexicoJohn Davis, LeeKongChianSchoolofBusiness,SingaporeManagementUniversityMahmood A Khan, Professor,DepartmentofHospitality&TourismManagement, PamplinCollegeofBusiness,VirginiaTech,NationalCapitalRegion,VA,USA
EditorialSupportA.V. Bala Krishna, InstituteofPublicEnterprise,Hyderabad

Journal of Marketing Vistas invites original contribution in the form of state-of-the-artconceptual / empirical papers and case studies on the application ofmarketing acrossindustry globally.
Thefollowingguidelinesaretobeadheredtowhilesubmittingthemanuscript.
Apapershouldcontain3000-5000words.Thedesiredorderofcontentis:Title,Author(s)/Affiliations,Abstract(200words),MainText,Appendices,Acknowledgements,References.
Themanuscriptshouldbetypedononesideofgoodqualitywhitebondpaperinone-and-a-halfspacing,12fontsize,justifiedandTimesNewRoman.Acronymsshouldbespeltoutinthefirstoccurrence.
Mathematicalterms,symbolsandotherfeaturesthatcannotbetypedshouldbeinsertedneatlyintothetextbyhandinblackink.Tablesandillustrationscompletewithtitles,labelsand artwork should be placed in the text at the appropriate locations.
Tables/Figuresshouldbenumbered1,2,3,etc.,andshouldbereferredto in thetext.Equationsshouldbenumberedsequentiallyinparenthesesbytherightmargin.Theorems,propositions,corollaries,etc.,shouldbenumberedinonesequence,e.g.,(1)Proposition,(2)Corollary,(3)Theorem,etc.
Headingsshouldbeinthreelevelsonly:• Majorheadingsareflushleft,capitalized,andinboldtype;Textfollowsfromnext
line.• Subheadingsareintitlecase&bold,flushleft.Textfollowsfromnextline.• Tertiaryheadingsareintitlecase,anditalicized,Textfollowsonsameline.• Donotnumbertheheadings.
Numbers under ten are spelt out (nine-point scale, five to 10 hours, but 5%).Numbersfollowedby%arealwaysnumerals (5%,20%).Spell outnumbers thatbegin sentences(Twentystudentsattendedtheprogram).
Allmanuscriptsshouldhavebeenproofreadbeforesubmission.Correspondenceandproofforcorrectionwillbesenttothefirstnameauthor,unlessotherwiseindicated.Theauthor(s)willreceivepageproofforchecking,butitishopedtocorrectonlytypesettingerrors.Proofshould be returned within a week.
Theauthor(s)shouldalsosendan‘electronicversion’of thepaperonCD/e-mailusingstandard software (preferably MS-Word) to [email protected] and / or [email protected]
Theauthor(s)shouldsendadeclarationstatingthatthepaperhasneitherbeenpublishednorunderconsiderationforpublicationelsewhere.
All correspondence may be addressed to:
TheEditorJournal of Marketing VistasInstituteofPublicEnterpriseOUCampus,Hyderabad-500007Email:[email protected],[email protected]
Guidelines for Authors

ISSN 2249-9067
Volume 7, No 2, July-December 2017
Journal of Marketing Vistas
Contents
Social Media at theTopofMind 1Rajeshwari Panigrahi and Vemula Rajesh
SocialMediaMarketing:TheNewRevolutionInBusinessEngagement 29 Gursimranjit Singh, Maninder Singh and Priyanka Singh
TheMarketforOrganicFoods:TheCaseofHyderabadCity(TS) 41M. P. Siva Kumar
TheVolkswagenWay,ProfitsoverSustainability 50A. Sridhar Raj
LuxuryFashionGoodsandSustainableConsumptionBehaviour 60V. Shilpa and C. Madhavaiah
Volume 7, No 2, July-December 2017ii
Editorial
Communication is no more face-to-face,print, broadcast etc. All these are considered as conventional modes of communicationwith theadventof socialmediamessaging.The present generation is busy online, canbe reached only through social media that is made much more easier with the freenetworking facilities offered, accompaniedby the growth of smart phones. The articleon, “TheSocialMediaonTopof theMind”,attempts to prove that social media is the meanstomeetthechallengeofkeepingthebrandnameonthetopofthemindduringallthe steps of consumer behavior. Future ofany communication for business would beonsocialmedia.Thesecondarticle,“SocialMedia Marketing: the New Revolution in Business Engagement”, emphasizes theimportanceofthenewandgrowingchannelofcommunication.Importanceofstrategizingto leverage on social media is discussed in this article.
Food trends are changing drastically, new businesses are emerging in the areas oforganicclusterslikeorganicfarming,organicrestaurants etc. the new generation is becomingmorehealthconsciousandcarefulin choosing right belly fillers. A case studyonthemarketfororganicfoodsispresentedin this issue. A detailed study on who, why, what,whenandhowaretakenup.Inspiteoftheambiguityovertheorganicfarming,mostofthemiddleclass,middleaged,householdsare fascinating towards organic products.Observations mentioned in the case areusefulfordesigningmarketingstrategies.
Thecountryisbecomingalandofscandalsfornot only the indigenous companies, attracting the foreign companies also. Volkswagen,a German car manufacturer, admitted thatthey lost the trust and confidence of theconsumers, without which no company can survive in the market. It is easy to position something to gain advantage, but it will be a ghost challenge when it comes to repositioning. Now, Volkswagen is in the traumaofrepositioning.
VUCAisbecomingthenormofthemarketinwhich fashionable and luxury products arelaunched to meet the requirements of theever changing internet customers. How amarketer can expect a sustainable behavior? Is a million dollar question, gettingmultipleanswers with ambiguity. “Luxury Fashiongoods with Sustainable Consumption Behavior”istryingtobringclarityonexpectingsustainable behavior when consumers are chasingafterfashionableproducts.
We encourage research based articles related to the various marketing areas in this Journal. However, articles based ondescriptive research, expert views and case studiesarealsofindingplace,andsomeofsuch papers are much more impressive than the empirical research.
Dr. M. Meher KarunaManaging Editor
1
JournalofMarketingVistasISSN 2249-9067 Volume 7, No 2, July-December 2017 pp. 1-28JMV
Social Media at the Top of MindRajeshwari Panigrahi1 Vemula Rajesh2
Abstract Social media is gaining momentum with the advent and reach of internet through different instruments. In the mid-2000s the computer savvy population was only having access to internet and thus social media. The situation tremendously changed because of the advent of technology and smart phones which are available at a price as low as Rs 5000. This growing market is increasingly using internet and also social media, as per the latest data available this smart phones market overwhelmingly growing by 90% with these low budget phones flooding into the market .The providers have stated that their quarterly profits have increased by approximately 6% due to increase in data usage (Smart Phones drive Bharti Airtel Profit Mint Feb 5, 2015 Vol 9). In this scenario it is quite evident that there is a upsurge in the use of internet and also indicates the increase in use of social media. This trend gives a scope to the marketer to think positively about using social media as a marketing tool especially communicating tool. This research is an attempt to identify the influence of social media on purchase decision through primary data from the respondents and understand the effectiveness of social media and its feasibility as a marketing and communication tool.
KeywordsConsumer Behavior, Social Media and Purchase Decision, Role of Social Media in Purchase Decision
1 AssociateProfessor,GITAMInstituteofManagement,GITAMUniversityandcanbereachedat:[email protected]
2 AssistantProfessor,GVP,Visakhapatnamandcanbereachedat:[email protected]
IntroductionResearch ProblemSocial Media is increasingly being used by the modernmarketersasamarketing tool.The
marketerexpectsbetterresultsforthemoneyspent and better control on the expenditure whichmakesthismediamoreeffectivethanthe traditional audio visual medium viz., Television.Thegrowthintheuserbaseand

Volume 7, No 2, July-December 20172
quality time spent by the user on attractsMarketer to use this an alternative medium to reach the consumer who are largely urban, EducatedandinternetsavvyPopulation.Thisstudy focuses on analyzing the perceptionof consumers about effectiveness of thismedium as a marketing tool.An immense transformation of Medialandscapeyearmarksthisdecade.(Mangoldand Faulds, 2009).The number of internetusers in India is likely to reach 402 million byDecemberwhichisa49%Jumpoverthelastyear.Thisincreaseofinternetuserswillmake India home to the largest online user baseafterChina. Indiahas the third largestinternet user base in the world after chinaandtheUSAandbyDecemberthisnumberisexpectedtoovertakeUSA.(IAMAI, IMRBReportpublishedinMint).Availabilityofnewand better technology has changed the way people use this media. Internet has moved beyond themode of communication and isnowcurrentlybeingused formarketingandselling.
The communication system has movedfrom Telephones to Cellular phones andthe latest being communication using data which is now used for messaging andcalling. These systems have changed themeaningofcommunicatedandSocialmediain the process has moved away from justsocializing to medium of communicationwith the advent of technology in the formof smart phones Tablets and Aps. SocialMedia which comprises of social networkormicro blogs are found to be increasinglyreplacing traditional media in reaching out to the consumer and marketers see a huge opportunityinusingthismediaeffectivelyformarketing communication.
Social media has positioned itself as animportant medium to communicate with friends and acquaintances. (Halliday andVrusias, 2011, Harrigan, 2011). Reach of
socialMedia isclearlyevident from the factthat, millions of fans have declared theirlove for Coca cola on Facebook in 2014A mutant spider dog is termed to be most popularvideo,thousandsofconsumerscametogether and created new ideas through the platform given byMy Star Bucks idea.ComLevisexperiencedand increase in itsbrandrecall by Instagram advertisements.
Social media is increasingly used as a source ofinformationandthereisarisingtrendsofconsumer to become fans of brands andproducts on social media which led to an assumption that social media is accelerating its role with the development of technologyand overtaking traditional techniques ofmarketing and communication.
Thereisasignificantincreaseinad-spentonsocialMedia,whichstoodatUS$89millionaccounting for 13.7% of online advertising.During the year 2009-2013 social media advertising in the country increased at a CAGR of 85% which expected to continuein the subsequent year i.e., 2014 withbrands expected to spend US$ 132millionrepresentinganelevationof48.9%.Socintel’sforecast for the period 2014-2018 presentsthe social media ad spend to grow at CAGR 35.4% and reach US$444 million in 2018accountingfor21.7%oftheonlineadvertisingspend.DominancyofRelationshipMarketingis clearly evident from the leap rise in theuse of social media in marketing paradigm(DimitriadisandPapista,2010).
Conceptualizing the importance these relationships have gained momentum over the period of time (Veloutsou, 2007).Social Media is an important component for Marketing and brand building exerciseas firms are increasingly using it for itsrapid penetration into the society. its use (Gallaugher andRansbotham, 2010Kaplanand Haenlein (2010) on the other hand

Journal of Marketing Vistas
3
portray a very contradictory picture stating thatonly small firms feel comfortable in thenew environment of using social media forbrand building and there was also an initial evidenceofsocialmediabeingusedlargelybyB2Ccompaniesandalsowordofmouthprogressing contributing to brand building and creating awareness and also contributing to increase in sales revenue and return on investment
(Kumar andMirchandani, 2012,GodesandMayzlin, 2009) Which means that the useofsocialmediaislargelyconfinedtoitsusetoB2Ccompaniesandsmallfirmsmakingitunsuitable forB2B companies?The reasonforsuchfindings isanoutcomeof its reachdirectly to the end consumer.
Generating effective interactions betweenbrand and consumer with consumer engagement and its relationship with increased sales and profits, customersatisfaction and overall competitivenessas noted by some of the researchers ofmarketing (Neff, Voyles 2007, Kumar et. al., 2010,Sedley,2008)Researchers in thepasthaveprovedtheimportanceofretainingsustainingandnurturingcustomers(Doornet. al.,2010)thus,socialmediaviz.,Facebook,Twitter, LinkedIn and other such platformshavebecomeintegralelementsofcompaniesand brands seeking to develop and nurture the relationships with consumers furtherconfirming the importance of interactionmentionedinsuchstudies(Neff,Voyles2007andChallagala2009).
Consumers get a platform to disseminatepersonal evaluation of products throughinternet and social networks online. (Chenet. al., 2011). Face book alone has overone billion registered users with more than 60 percent of them using it every day. Anaverage user on Face book is connected to about 80 communities and is estimated to
haveabout130friends(www.facebook.com).InmarketingofservicesWOMhasbeengivenimportance due its complex nature, higher perceived risk and heterogeneity compared to products which are tangible. (Sweeneyet. al., 2012, Bansal and Voyer 2000).To understand the strategies that actuallyinfluence popularity of word of mouth oronline interaction among consumers is given little attention which further broadens thehorizonofWOMmarketingwithinelectronicenvironments (Godes and Mayzlin, 2009,Libaiet. al.,2010Lindgreenet. al.,2013).
Objectives of the Study• Understanding the Importance of Social
Media on consumer purchase decision.• Examining the Impact of Demographic
variables on the usage of internet andsocial media.
• Understandingthescopeofpossibleuseofsocialmediaformarketingpurposes.
MethodologyThisstudyisananalyticalresearchdependson the primary data collected by using a pre-tested structured questionnaire. Deliberatesamplingtechniqueisusedandrespondentswho are internet and technology savvy are being sampled. The population is vastand scattered thus; data is collected from300 respondents who meet the criteria ofsampling. Care is taken to ensure that the sample is representative despite a non-probability sampling technique being usedthrough responses from a demographycomprisingofpeoplefromdifferentprofessionagegenderandamixtureofotherelementsto eliminate sampling error.
Excel is used for simplifying the data andstatistical calculations. Basic Likert scaleanalysis isbeingused for summarizingandunderstanding the response given and Chi-Squareisusedforhypothesestesting.

Volume 7, No 2, July-December 20174
Process of summarizing the data with Likert scale and Ranks• RespondentsareaskedtogiveRank1for
thefirstpreferenceand the lastpossiblerankfortheleastPreference.Theseranksare given corresponding weights. Rank oneistheoptiongivenformostpreferredresponseoptionthusit’sgiventhehighestweight and higher rank is given to the leastpreferredoptionsoit thatwouldbegiven the least weight. Rank 1 is given the highest weight and rank 7 is given the least weight.
• TheseweightsarethanmultipliedbytheNoofresponses(RXW)
• These RXW scores are than added tosummarizeandareadded(∑RXW)
• The highest total (∑ RXW) is mostpreferredoption
• Likertscalevalueinpercent=(∑RXW)/TotalFrequencyXHighestPossiblescaleValue(4)X100
• Than highest response and the orderthere in is considered for understandingthe respondents over all response to a particular dimension
• RanksaregiventoLikertscalePercentage
Independent Variable
UseofSocialMedia
Dependent Variable
Purchase Decision
Moderating Variable
Age and Gender
Mediating Variable / Intervening Variable
Internet access and internet knowledge
Source: Authors review of the literature outcome
Theoretical Framework
Theoretical framework presents a pictureof the variables used in the study. Theindependent variable in the study is social media and the Use of social Media whichlargely depends on the access to internet and theinternetusingabilityoftheperson.
Review of the literatureIn the study “Are social media replacing traditional media in terms of brand equity creation?” Published in the Journal ofManagement Research Review (2012)Authors Bruhn. M et. al., Found that
communication both traditional and modern which included social media has impact on brandequity.
A mixed-method approach to examining brand-consumer interactions driven by social media study by Andrew Rohm and VelitchkaDKaltchevapublishedinJournalofResearch in interactive (2013) suggest thatbrand-consumer interactions driven by social media canbe characterizedby fiveprimarymotivations or themes: entertainment, brand engagement (specifically identification with

Journal of Marketing Vistas
5
or connection to the brand), timeliness ofinformation and service responses, productinformation,and incentivesandpromotions.Theauthorsalsoidentifyrelationshipsamongthese themes related to respondents’ age,gender, and social media use
In a research study Spreading the word through likes on Facebook Evaluating the message strategy effectiveness of Fortune 500 companies Kunal Swani and George Milne published in Journal of Researchin Interactive Marketing (2013) found thatmost of the face book B2B account postsare effective if they include brand namesand avoid hardsell and explicitly commercial statements. Results in their study also suggest that emotional and sentimental posts onFBareeffectivesocialmediastrategyandservice marketers.
Customer satisfaction in Web 2.0 and information technology development by Gajendra Sharma and Li Baoku publishedin Information Technology & People(2013)foundthat IT development isa inseparablepart ofweb 2which enables to understandcustomer satisfaction and their perceptionon line technology. Customer satisfactionand IT development has positive influenceon consumer’s service enjoyment andexperience.
Places going viral: Twitter usage patterns in destination marketing and place branding is acomparativestudyof five twitteraccountsbelonging to five destination marketingprojects. This research by EfeSevinpublished in Journal of Place managementand development (2013) found thatdestination marketing projects tend to use twitter predominantly to share events viz., festivalsconcertsandfairsconfiningtotheirjurisdictionswiththeirfollowers.
Author Krista Ann Voss in a study the value of social media: are universities successfully
engaging their audience? (JournalofAppliedResearch in Higher Education 2013) MadeanattempttofindhowAmericanuniversitiesare engaging their Audience via social media platformsfoundthatengagementwaslackingwhenthepresenceofsocialmediawashigh.
Social network activity and contributing to an online review site by Ronald E.Goldsmithpublished inJournalofResearchin Interactive Marketing (2013) made anattempt to test the relationship between prior social media activity and the review posting patterns reported that demographics has very little relationship with the review posting patterns in the new websites and prior active social media use.
In a research study Social media’s slippery slope: challenges opportunities and future research directions Published in “Journal ofResearch in Interactive Marketing (2013)”DonE.Schultzfoundthatmajorityofsocialmediamarketing initiatives take the formofcommunicating sales promotions to already engaged consumers.
A study “adoption of social media Marketing in South African banks by Sarah TsitsiChikandiwapublishedinEuropeanBusinessReview (2013) examined the level of socialmediainSouthAfricaandfoundSocialmediaat very infant level in SouthAfrican Banksandalsoexploredthatoutofalltheavailablesocial media options Facebook and twitter arethemaintoolsusedbybankforreactivecustomer service and advertising.
OptimalwaysforcompaniestouseFacebookas a marketing channel most users who have an opinion on the issue accept marketing on Facebook, but only in the right amount. There are basically two groups: those whothink that companies have no place on Facebook and those who want companies to be active on Facebook.The latter groupemphasizes the importance of meaningful

Volume 7, No 2, July-December 20176
posts without unsolicited sales messages, andwouldprefertosearchforthecompaniesthemselves rather than being bombarded by companymessages. By far, status updatesand pictures/images were found to be themostimportantfunctionstorespondents
A study “Optimal ways for companies to use Facebook as a marketing channel” by,LinneaHanssonandAntonWrangmo,Published inthe Journal of Information, CommunicationandEthicsinSociety(2013)presentedtheirfindingsontheoptimalwayFacebookcanbeused as a marketing channel. The authorsstated that Facebook should be only used in right amount which means neither too low not toohighforanyimpactontheconsumersanditshouldhaveonlymeaningfulpostswithoutunsolicited sales messages.
“Brand Strategies in Social Media” Published in “Marketing Intelligence and Planning”(2014) a paper by Georgios Tsimonis &SergiosDimitriadisfoundthatsocialmediaisbeing popularly used by the firms to createcompetitions and giving prizes, announcing new products and services, interaction with the customers and handling service issues.
JeffMcCartyet. al., in their paper “Managing brand presence through social media: the case of UK football clubs” published in Internet Research (2014) found that socialmedia strategies has potential to create interaction and engagement, Community growth & belonging resulting in enhancedtraffic flow to social networking websitesand commercial gain. The authors sharedtwo concerns in developing social media strategies the first one being the control ofbrand presence and image in social media the second being appropriate strategies to deliver short term revenue and those building long term brand loyalty.
Thestudiesreviewedlargelyfocusonsocialmedia as a communication strategy and usageofthembyorganizations.Thestudiesby and large focused on the role of socialmedia in marketing communication and branding strategies.
The current study explores a lot more byanalyzing theImpactofsocialmediaonthepurchase decision process and the post purchaseimpact.Thispaperisanattempttoexplore thevariousbehavioraldimensionofconsumerVis-a-Vistheuseofsocialmedia.
Majority of the literature dates back to2012 which shows this media is a recent developmentand it’sobviousthat there isalot more to do in this area.
Data AnalysisThe data is collected for 300 respondentsare internet users and 293 (98%) of themas shown in Table-1 opined that they useinternetfrequently.
Table-1: Number of Respondents Who use Internet
Response Options
Total number of respondents Percentage
Yes 293 98No 7 02GrandTotal 300 100
Knowledge of using Internetwas kept as acriterion for sampling assuming those whouse internet are likely to use and are mostly foundactiveonsocialmedia.Forfurtherdataanalysis response from 293 respondentswho are internet literate is only considered. Thus,fornextpartofthestudytheresponsesfrom 293 respondents are only taken intoconsideration and the non-internet users are dropped.

Journal of Marketing Vistas
7
Table-2: Duration of Average Daily Use of Internet
Classification Duration of Internet Percentage
Lessthan1hr 72 24.61 to 2 hrs 83 28.42 to 3 hrs 48 16.383 to 4 hrs 25 8.53More than 4 hrs 65 22.18Grand total 293 100
Table-2showsAverageDailyuseofinternetin Hours and shows that 83(28%) of therespondentsopinedthattheyuseinternetforanAverage of 1 to 2 hrs in a day followedby72(24.6%)saidtheyuseinternetforlessthan 1 hour a day.Sixty five (22.18%) saidtheyuseforanaverageofmorethan4hrs.48(16.38%) respondents opined that theyuseinternetfor2to3yearsandtheleast25(8.53%).
Table-3: Technique to use Internet
Response Options Responses PercentagesMobile Phones 051 17.5ComputerorLaptop 047 16Both 195 66.5Total 293 100
Internet plays a very important role as a medium of communication The frequencyand access to internet depends on the technique of its use and about 66%respondents stated that they access internet using both laptop and mobile phone. Thetechniqueofaccessing internet is importantforthestudybecausesmartphoneisaveryeasytoaccessdeviceforusingsocialmediaand also the advertisements therein. Thus,it isevident fromtheresponsegivenby therespondents that smart phones increase the usability of social media. Majority of thesesocial media websites have Apps making
useofthesewebsitesmoreconvenientthusenhancingthefrequencyofuse.
Table-4: Cross Tabulation of the Technique to Access Internet and Frequency of Accessing Internet
Scale Value
Both Desktop/Laptop
and Mobile
Computer/Laptop Mobile
Very Frequently 76(38.97) 15(31.91) 10(19.23)
Frequently 85(43.59) 20(42.55) 11(21.15)Occasionally 17(8.7) 04(8.51) 7(13.46)Sometimes 17(8.7) 08(17.02) 21(40.38)Never - - 03(5.77)Total 195(100) 47(100) 52(100)
Note-Figures in the brackets indicate percentage.
Table-4presentsthedatapertainingtomodeof accessing internet. The largest numberof users i.e. 66.55% opined that they haveaccess to internet through both Cellular Phones and laptop / Desktop followed by52(17.75%) access internet through Mobilephones and 47(16%) access using onlylaptop.
Data in the table shows that out of 195(66.55%)of the respondentshavingaccessthrough multiple devices on a frequencyscaling 38.97%use internet very frequently and 43.59% use frequently which shows that access to multiple devices enhances the availabilityofinternetandalsouseofinternet.MobilePhoneisfoundtobethemostpopulardevice when it comes to those respondents whohaveoneaccesstoonlyonedevice.52Respondentsof293opinedtobeaccessinginternetthroughmobileandcloselyfollowedby47(16.04%)respondentsopinedthattheyaccess through laptop / Desktop.

Volume 7, No 2, July-December 20178
Table-5: Cross Tabulation of the Availability of Access to the Instrument
Vis-a-Vis Frequency of Access to Social Media
Response Options
Both Computer /Laptop and
Mobile
Computer /Laptop Mobile
Very Frequently 49(25) 04 08
Frequently 91(47) 23 13Occasionally 29 08 06Sometimes 25 10 20Never 1 2 4Total 195 47 51
Table 4 and 5 Shows that the respondentshaving access to more than one device are the largestusersofinternetaswellasthesocialnetworkingwebsites.195respondentsoutofatotalof293respondedtobehavingaccessto social media through smart phone as well
aslaptop/Computer49(25%)onafrequencyscale said they use social media very frequentlyand91(47%)saidtheyusesocialmedia frequently together72%are frequentusers of socialmedia.This Information canbe summarized as multiple devices providing easeofaccesstointernetincreasestheuseofsocialnetworkingwebsites.
Table-6 presents the respondents preferredsourceofinformation.Internetisanimportantsource of information in this era andsocialmedia is just one of themediums ofinformation.Theothersareblogs.Websitesnewspapers or other print media, emails friends peers etc. respondents opined thattheypreferGoogletosearchfortherequiredinformation. Thus, Google is found to bethe most preferred media with 1187 totalweightedscore followedbynewspaperwith1126 weighted average score which is a close follower ofGoogle.Third in the orderarecompanywebsitesand the fourthbeing
Table-6: Source of Information the Respondents Look Before Making a Purchase Decision
Source of (Ranks) information respondents look for while making a purchase decision
1 2 3 4 5 6 7 Total
Corresponding Weights 7 6 5 4 3 2 11 Companies Website 77 27 18 37 40 12 11 222
R*W 539 162 90 148 120 24 11 1094-III2 Newspapers 64 44 36 31 22 19 06 222
R*W 448 264 180 124 66 38 6 1126-II3 Send a Mail to the company 02 08 17 22 39 69 39 196
R*W 14 48 85 88 117 138 39 529-VI4 BlogsandForums 09 18 14 12 16 40 93 202
R*W 63 108 70 48 48 80 93 510-VII5 SearchforInformationongoogle 83 27 48 22 23 16 15 234
R*W 581 162 240 88 69 32 15 1187-I6 Social Networking websites 14 43 31 50 30 28 09 205
R*W 98 258 155 200 90 56 9 866-V7 Friends and Peers 38 59 46 26 25 07 18 219
R*W 266 354 230 104 75 14 18 1061-IV

Journal of Marketing Vistas
9
friendsandpeerssocialnetworking websites holdsixthpositioninorderofpreference.Datain table 6 clearly shows that social media is not considered as an important source ofinformation by the respondents in fact it’squitesurprisingtoknowthatnewspapersareamore preferred source of information. It’salsoproved from thedata that respondentsdo not like to write emails to the company to get information about the product and alsodonotconsidertheinformationonblogsandforums.DependingonthesearchEnginesforinformation is a great change which showsthepenetrationoftechnologyintothemindsofconsumersinthisera.
Table-7 presents the overall response onthe factors that influence a respondent’spurchase decision and it was found thatthequalityofadvertisement influences theirpurchasedecisionwiththehighesti.e.,(879)weighted response followed by the brandnameand the familiarityof theproduct848weightedscore.Thethirdoptiongivenisthecuriosity about the product which gets the third highest weighted score 770.
Respondents opinion is a clear indication of the importance of communication on
purchasedecision.Thefirstone(InterestingAdvertisement) and the second one (Familiarity of the Brand and product) bothare the outcomes of communication. Thisoutcome shows that an effective marketingcommunicationisveryimportanttoinfluencethepurchasedecisionoftheconsumer.
Impact of Social Media an Initial Diagnostic ApproachThis paper presents two dimensions ofstudy one is the initial diagnostic approach intended to determine the impact of socialmedia on the consumers and the advanced analysis intending to measure the extent to such impact.
Table-8: Number of Respondents Who Pay Attention on Ads in Social
Networking Page
Response Options
Total Number of Respondents Percentage
No 90 30.71Yes 203 68.28GrandTotal 293 100
Table-7: Motivational Factors for Purchase Decision Factors Influencing Purchase DecisionRanks 1 2 3 4 5 Total
Corresponding Weights 5 4 3 2 11 Advertisement was interesting 83 53 42 47 32 257
ResponseXWeight 415 212 126 94 32 879-I2 Curious about product 51 50 57 55 34 247
ResponseXWeight 255 200 171 110 34 770-III3 Wanted to imitate actors in the advertisement 23 47 46 45 88 249
ResponseXWeight 115 188 138 90 88 619-V4 Familiar product / brand 72 52 54 44 30 252
ResponseXWeight 360 208 162 88 30 848-II
5 Already Planned to purchase that product but not decided on brand 54 44 45 51 57 251
ResponseXWeight 270 176 135 102 57 740-IV

Volume 7, No 2, July-December 201710
The initial analysis of data (Table-8) ondichotomyscaleshowsthatabout203(68%)of the respondents opined in affirmationthat they pay attention to the ads on social networking page and only 30% of therespondents negated to the above statement. It is evident from the response that theadvertisement on the social networking page does not go unnoticed.
Table-9: Respondent’s Opinion on their Intention to Purchase the Products
Advertised on Social Media
Response Options
Total Number of
RespondentsPercentage
No 103 35.13Yes 190 64.85GrandTotal 293 100
Respondents responded in affirmationintending to buy the products advertised on socialmediadatapresentedinTable9showsthat 64.85% and only 35% respondentsdenied tomakeapurchaseof theproductsadvertised on social media.
ResponseprovidedinTable-10isopinionofthe respondents about sharing the brands on social media to friends and peers. Theresponses provide a very clear indication thatrespondentswouldprefersuggestingthebrands they see on social media websites to theirfriendsandpeerswithanoverwhelming77% responding in affirmation and only69(23%)respondedagainstthisstatement.
Table-10: Suggest Brands which Appear on Websites to their Friends and Peers
Response Options
Total Number of
RespondentsPercentage
No 69 23Yes 224 77GrandTotal 293 100
Dataintables8,9and10isthesummaryoftheresponsesindicatingtheimpactofsocialmedia. Respondents opined that not only pay attention to the ads on the social networking but also intend to buy the product which are advertised on social media and also would recommend them to their friendsandpeerswhichspeakofaclearcutpositiveimpactofsocial media on purchase decision.
Thus, the organizations intending to usesocial media for marketing communicationshould be careful about using it to targetthe right segment and right product as only 60%oftherespondentsopinedthattheypayattention to ads on social media.
Table-11: Respondent’s Opinion on the Effectiveness of Advertisement
on Social Media
Response Options
Total Number of
RespondentsPercentage
Effective 114 38.9Highlyeffective 31 10.47Lesseffective 44 22.80Notatalleffective 14 4.778Not sure 90 30.72GrandTotal 293 100
An opinion on effectiveness of theadvertisement on social media (Table-11)Showsthatatotalofabout49%respondentsresponded in affirmation about effectives ofadvertisement through social Media. 38.9%of the respondents stating it to be effectiveand 10.47% stating highly effective and30%statedthattheyarenotsureabouttheeffectiveness of advertisements on socialmedia. This indicates that respondents arebyandlargepositiveabouttheeffectivenessof advertisements of socialmediawith only49% of the respondents stating the adsand information on the social media to beineffectivewithvarieddegrees.

Journal of Marketing Vistas
11
Thedatapresentedintables8,9,10and11canbeconsolidatedasanoverallfavorableresponse from the respondents aboutthe Product information shared on socialmedia. Respondents in clear majority have stated that they not only pay attention to theproduct informationonsocialmediabutalso would consider such information whilethey purchase such products and also findthe advertisements on social media very effective.Respondentsalsostatedthat theywould share this information with friendsandpeerswhich isaclear indicationof theconfidencerespondentshaveontheproductinformationsharedonsocialmedia.
Table-12: Products Purchased Based on Ads in Social Media
Category of Product Purchase
Number Respondents Percentage
Apparels and footwear 57 28.36
Consumer durables 27 13.43
Electronicsand electricals 91 45.27
FMCG 15 7.46Kids requirement 13 6.40
GrandTotal 203 100
Data presented in (Table-12) provides fivecategories of products intending to identifythe kinds of products that usually drawattentiononsocialmediaanditwasfoundthat45.27%respondentsboughtelectronicsandelectricalgoodsgettinginfluencedbyadsonsocialmediafollowedby28.36statedtohaveboughtApparels.Averysmallgroupofbuyerspurchase Consumers Durables, FMCG and Kidsrequirement.Thedatacanbesummedup as Electronics, Electrical and Apparelsare thecategoryof theproductswhichtend
to have attracted customer’s attention onsocialmedia. Kid’s requirement FMCG andConsumer Durables are the products which could not attract much attention with only 7.46% respondents for FMCG 6.40% and13.43%respondentstohaveopinedinfavorof buying Kids requirement and ConsumerDurables respectively.
Itisquiteevidentfromthedatathatshoppinggoodsarepreferredtobepurchasedbytheconsumers considering information sharedand ads on social media. The respondentsdenied purchasing consumers durables probably because of the usual mindset ofconsumers not to take risks when the amount spendismoreandverifythequalityphysicallyandmakepurchase.Their responses givenby the respondents portray that only the information on “Shopping goods” sharedor advertised on social media are being considered.
From the respondents opinion presented in table 6, 7, 8 & 9 it’s evident that they payattentiontoadsonsocialmediaandalsofindthoseinteresting.Theyalsoopinedthattheydo consider the information shared throughthese sites when it comes to purchase decision and share them with their friendsand peers.This opinion of the respondentsshowsapositivesignofsocialmediatakingoverthetraditionalmediainfuture.
Data Analysis Intending to Study the Impact of Social Media on Purchase DecisionThe initial data analysis clearly shows thatthe respondents are quite regular on socialnetworking and they are also watchful ofthe products and information on productsshared on those websites. Respondents also gave a positive response towards sharing the informationsharedonsocialnetworkingsiteswiththeirfriendsandpeers.Thesecond

Volume 7, No 2, July-December 201712
dimensionofthestudyistoidentifytheextentof such impact and as the study focuseson the role of social media on consumerpurchase decision. The purpose for whichinternet is used is important to understand themode of web advertisement that wouldlargely grab customer’s attention. The datapresentedinTable-13showsthepurposeofinternet useandLikert scale valueanalysisis used to summarize the data and draw necessaryinferences.
Thepurposeforwhichinternetisusedplaysan important role in understanding the impact ofsocialmedia.Table-13showsthepreferreduse on internet and the options given to the respondents are Email, Social networking,Gaming, Music, Shopping, News and Entertainment.
The Likert scale analysis done with theresponse shows that the response goes
in favor of internet being used for SocialNetworkingwithatotalweightof1671isthehighestresponseinfavorofSocialnetworkingsites, Followed by Email being the secondwithatotalweightof1521andwith1056totalweight music stands third in the order. It’squite evident from the response presentedin Table-13 that out of all the purposes ofusing internet social networking is the most preferreduse.Socialnetworkingsitesbeingvery popular among the respondents and an importantreasonforusinginternetincreasesits scope in reaching out to a large number of users through various information andmessages. The information on these siteswould definitely reach the customers andtheimpactofthesesiteswouldenhancetheusabilityofsuchsitesformarketingpurposes.
The data presented in Table-14 shows thepurpose of using social networking sites asopined by the respondents. Largest with
Table-13: Respondent’s Opinion on Purpose of Using Internet
Ranks 1 2 3 4 5 6 7 TotalCorresponding weight 7 6 5 4 3 2 1
ResponseOptionsEmail(R) 119 57 24 29 24 12 14R*W 833 342 120 116 72 24 14 1521-IISocialNetworkingSites(R) 108 79 28 36 24 38 09R*W 756 474 140 144 72 76 9 1671-IGaming(R) 09 28 39 31 41 39 66R*W 63 168 195 124 123 78 66 817Music(R) 21 36 58 50 42 34 09R*W 147 216 290 200 126 68 9 1056-IIIShopping(R) 10 24 40 51 60 44 19R*W 70 144 200 204 180 88 19 905News(R) 20 38 42 46 44 49 54R*W 140 228 210 184 132 98 54 1046Entertainment(R) 7 9 19 21 25 54 110R*W 49 54 95 84 75 108 110 575

Journal of Marketing Vistas
13
a weighted score of (1332) Respondentsopined that they just check updates on these sites followed by respondent’s preferenceof for using these social networking sitesfor chattingwith 1162weights score.Somesocialnetworkingsiteslike“linkedin”arealsoused for searching and employment andslowly becoming popular thus the obvious that the third position goes to using these websitesofsearching jobopportunitieswiththe thirdhighestwith (958)weighted score.Use of Social networking sites for ProductFeedback Gaming and Music is given the lastpreference in theorder.Thus, itcanbesummarized that checking updates fromfriends Chatting and Job Search is therespondent’sorderofpreference.
The data presented inTable 13& 14 bringtotheforaytwoimportantfactorsoneistheuse of internet for Social media purposeswhich is given the highest weight-age by the respondents and the other one is the use social media largely used for sharing
informationintheformofupdateswhichgotthehighestweightagefromtherespondents.This information provides an insight to themarketers about the right approach to use the socialmediaformarketingpurpose.
Table-15 portrays bird’s eye view of therespondent’sopinionaboutuseofinternetandsocialMediaandconsideringtheinformationtherein, for making purchase decision. Thedata clearly shows that the largest i.e. about 41 percent of the respondents use internetfrequently determining the growing demandfor internet. India is a country which had alargescopeforuseofthistechnologywiththeever growing demand.
In the year 2009 there were 60 million internet users and in 2015 it has increased to 260millionand the forecast for2018shows theuserbasemightgoupto580million(Source:BCGAnalysis)whichisalmosta45%growthinaspanofthreeyears.
Awhopping46%of therespondentsstating
Table-14: Purpose of Use of Social Networking
Ranks 1 2 3 4 5 6 TotalR*W
Corresponding Weights 6 5 4 3 2 1
Chat 94 72 45 18 09 13R*W 564 360 135 72 18 13 1162-IIUpdates 119 86 25 18 15 04R*W 714 430 100 54 30 4 1332-IJobOpportunities 72 27 31 52 37 37R*W 432 135 124 156 74 37 958_IIIProductFeedBack 15 17 41 57 68 48R*W 90 85 164 171 136 48 694Gaming 10 19 33 61 62 56R*W 60 95 132 183 124 56 650Music 11 22 47 58 57 48R*W 66 110 188 174 114 48 700

Volume 7, No 2, July-December 201714
that they largely use internet for socializingoutofwhichonly27%respondentsopinethattheyfrequentlypayattention to theadsandonly 34% respondents frequently considertheinformationonsocialnetworkingsitesforpurchase decision.
DatainTable-15showsaminorcontradictionofthedatapresentedinthetable1to5.Theearlier presented data shows that respondents use internet largely for socializing and payattention to advertisement as well and considerthemforpurchasedecision.
Data in Table-15 shows the frequency ofusing the information on social networkingsites and considering them while making purchase decision. The data shows that43 % of the respondents use SNS (socialnetworking sites)very frequently and about2% use it frequently. 20% respondentsopinedthattheyveryfrequentlypayattentionto advertisements and 7.5 opined that theyfrequentlypayattentiontoadswhichintotalisonly27%.
It’sevidentfromthedatawithclearmajorityofrespondentsstatinginfavorofusinginternetfor socializing and there is a significantincrease in the use and impact of socialnetworking sites on consumer purchase decision. Respondents also stated that they use internet for socializing and also payattention to ads there in on the contrary the respondents also stated that frequency ofpaying attention is negligible with only 2%statingthattheypayattentionveryfrequently.
The internetandsocialnetworkingwebsitescannot be considered as the best option for reaching out because even today thereis a large population (70%) in India do nothave access to technology and are not conversant with social media. Users ofthis media opined that the frequency ofconsidering the informationonsocialmediais quite insignificant as only 28% say thatthey consider this information frequently inpurchase decision.
The data in Table-15 clearly depicts thatout of those respondents who tend to use
Table-15: Response Options on the Frequency of Using Internet and Social Media and Consideration of the Information there in for Purchase Decision
Response Statements
Very Frequently Frequently Occasionally Sometimes Never Total
Frequencyofusinginternet
116(39.59)
02(0.68)
28(9.5)
147(50) 0 293
(100)FrequencyofuseofSocialnetworkingwebsites
127(43.34)
07 (2.38)
43(14.68)
55(18.77)
61(20.8)
293(100)
FrequencyofPaying attention forads
61 (20.8)
22 (7.51)
62 (21.16) 49
(25.39)99
(33.78)
293(100)
Frequencyofconsidering the informationonsocial media websites
82(27.99)
22 (7.5)
78(26.62)
80(27.30)
31(10.58)
293(100)
(Figures in the Parentheses indicate Scores * Frequency)

Journal of Marketing Vistas
15
internet and social media relatively smaller group pays attention to the advertisements there in, and those who pay attention to such advertisements stated that the frequency isless.The respondents also stated that theyconsider such information while makingpurchasedecisionbutthefrequencyofsuchconsideration is less.
Thus, it can be concluded that though therespondents pay attention and consider the information on social networking sites thefrequencyforsuchconsiderationisverylesswhichisveryinterestingwhenseenfromthemarketers’perspective.
Thispartofthestudyisintendedtodelveintotheimpactofageandgenderon• Useofinternet• UseofsocialmediaSites• Pay attention to the advertisements on
the social media websites.• Consider the information on the social
media sites in the form of sharing andadvertisements in the purchase decision.
Steps to Analyse the Data• Numerical scale values are given as per
the table below
• Frequency is multiplied by scale value(FrequencyXScaleValue)
• TotalScalePoints=4XTotalfrequency• ScaleValue percentage isDerived by =
frequency X Scale Value / Total ScalePointsX100
Scale PointsNumerical
Values for the Points
VeryFrequently 4Frequently 3Occasionally 2Sometimes 1Never 0
Table-16 showsAgewise classification andTable-17showsGenderwiseclassificationofthefrequencyofinternetusers.35.76%oftherespondents belong to the age group Lessthantwenty33.10%belongtotheagegroup20to40and20.14%respondentsbelongtothe age group above 40.
Data presented in table 16 presents the cross tabulateddataofageandfrequencyofuseofinternetandintendstoidentifytheagegroupwhich is themost frequentuserof internet.It’squiteevidentfromdatathattheagegroup
Table-16: Scale Value Analysis of Age Vis-A-Vis Frequency of Using Internet
Response Options Scale Value
Less Than 20 (f)
F x Scale Values 20 to 40 F x Scale
Values Greater Than 40
F x Scale Values
VeryFrequently 4 58(42) 232 26(26.80) 104 17(28.80) 68Frequently 3 62(45.25) 186 33(34.02) 99 21(35.59) 63Occasionally 2 6(4.38) 12 12(12.37) 24 10(16.95) 20Sometimes 1 11(8) 11 26(26.80) 26 11(18.64) 11Never 0 0 0 0 0 0 0TotalΣ(FrequencyXScale) 441 253 162
Scale value Percentage 80.47%-I 65-III 68%-II
Figures in the bracket indicate percentage
Volume 7, No 2, July-December 201716
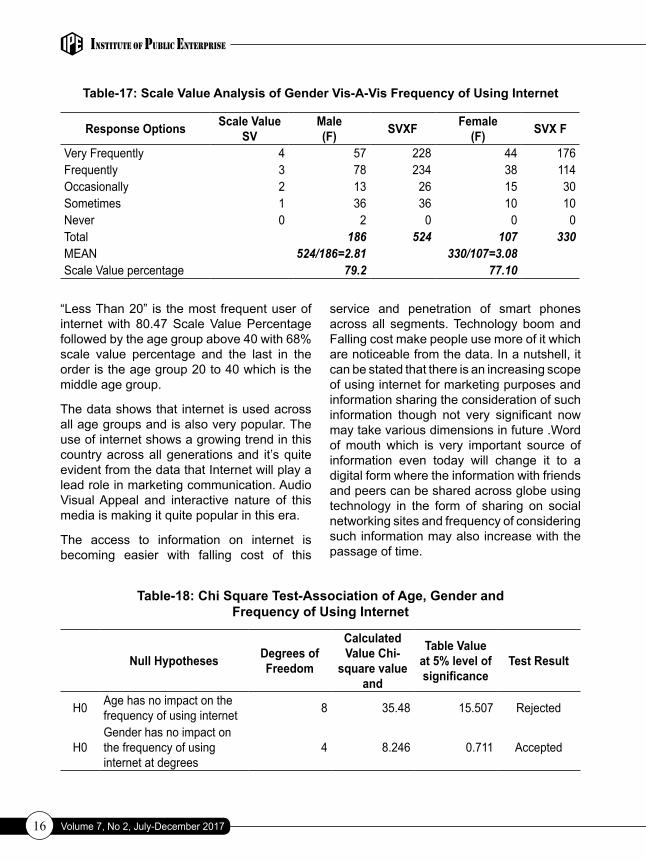
“LessThan20” is themost frequentuserofinternetwith 80.47ScaleValuePercentagefollowedbytheagegroupabove40with68%scale value percentage and the last in the order is the age group 20 to 40 which is the middle age group.
Thedatashowsthat internet isusedacrossallagegroupsandisalsoverypopular.Theuseofinternetshowsagrowingtrendinthiscountryacrossallgenerationsand it’squiteevidentfromthedatathatInternetwillplayalead role in marketing communication. Audio VisualAppeal and interactive nature of thismediaismakingitquitepopularinthisera.
The access to information on internet isbecoming easier with falling cost of this
service and penetration of smart phonesacross all segments.Technology boomandFallingcostmakepeopleusemoreofitwhicharenoticeablefromthedata.Inanutshell,itcan be stated that there is an increasing scope ofusinginternetformarketingpurposesandinformationsharingtheconsiderationofsuchinformation though not very significant nowmaytakevariousdimensionsinfuture.Wordofmouthwhich is very important source ofinformation even today will change it to adigitalformwheretheinformationwithfriendsand peers can be shared across globe using technology in the form of sharing on socialnetworkingsitesandfrequencyofconsideringsuchinformationmayalsoincreasewiththepassageoftime.
Table-17: Scale Value Analysis of Gender Vis-A-Vis Frequency of Using Internet
Response Options Scale Value SV
Male (F) SVXF Female
(F) SVX F
VeryFrequently 4 57 228 44 176Frequently 3 78 234 38 114Occasionally 2 13 26 15 30Sometimes 1 36 36 10 10Never 0 2 0 0 0Total 186 524 107 330MEAN 524/186=2.81 330/107=3.08Scale Value percentage 79.2 77.10
Table-18: Chi Square Test-Association of Age, Gender and Frequency of Using Internet
Null Hypotheses Degrees of Freedom
Calculated Value Chi-
square value and
Table Value at 5% level of significance
Test Result
H0 Age has no impact on the frequencyofusinginternet 8 35.48 15.507 Rejected
H0Gender has no impact on thefrequencyofusinginternet at degrees
4 8.246 0.711 Accepted

Journal of Marketing Vistas
17
Outof293respondents186(63%)aremaleand 107(37%) are female (Table-17). Thiscomposition shows that due care is taken to ensurerepresentationfromboththegender.Themean value of the responses given bymaleis2.81andfemaleis3.08whichshowsfemale use internet more frequently thanmalewhichmeansfemalespendmoretimeusing internet than male. Thus, there is achanceoffemalegettingmoreinfluencedbymarketingeffortsoninternetthanmale.
The impact of age and gender on thefrequency of using internet is being testedusing Chi-Square and is presented inTable-18.
The purpose of hypotheses test is tounderstand demographic impact on internet usage behavior of the respondents. At 5%level of significance the calculated valueof chi-square is greater than (.05) thusthe hypotheses “Age has no impact on the frequency of using internet is rejected and the alternate hypotheses that age has impact on thefrequencyofusinginternetisaccepted.
Theresultsofthechi-squareportraypositiveimpactofageontheinternetusagebehavioroftherespondents.Thedatacollectedclearlyshows the dominance ofmiddle and youngage group the younger age group i.e. less than40arethelargestusersofinternet.Thefrequencyofusagealsoisquitehighamongsttheseagegroups.Internetisoftenusedasacommunicatingand information sharing toolamongst the younger generation.
Gender isnot found tohaveany impactonfrequency on internet as the hypotheses“Gender has no impact on the frequency of using internet” is accepted. This clearlyshowsthatbothmaleandfemaleareequallytechnologysavvyanduseinternetfrequently.
Thecrosstabulationofagewiseclassificationand frequency of using social networkingsites is presented in (Table-19). It’sevidentfrom the scale value analysis that the agegroup “Less than 20” with (70.43%) scalevalueare themost frequentusersofSocialnetworking sites followed by the age group20 to 40 (61.08%) and the least is the age
Table-19: Scale Value Analysis of Age Vis-A-Vis Frequency of Using Social Networking Websites
Scale Values
(SV)
Less Than 20(F) FXSV 20 to 40
(F) FXSV Above 40(F) FXSV
VeryFrequently 4 35 140 17 68 9 36Frequently 3 67 201 38 114 22 66Occasionally 2 20 40 15 30 8 16Sometimes 1 14 14 25 25 16 16Never 0 1 0 2 0 4 0Total 137 396 97 237 59 134Mean Value 2.89 2.44 2.27TotalscaleValue 137x4=548 97x4=388 59x4=236
Scale Value Percentage
396/548X100
=72.26%-I
237/388x100
=61.08%-II
134/236x100
=56.77%-III

Volume 7, No 2, July-December 201718
group“Above40”(56.77%).Thisdatashowsa significant difference in the frequency ofusageofsocialnetworkingsitesamongstthetwoagegroups.Thegenerationbelow fortystatedisthelargestuserofsocialnetworkingsites.
Themeanvalueofthethreeagegroupsalsoshows that the age group less than 20 is the most frequentuserofsocialnetworkingsitefollowedbythegroup20to40andtheleastis theagegroupabove40.Thedataabovegives a clear indication that the age “less than20”istherightsegmenttotargetthroughmarketing communication on social media. Thisageisthelargestuseroninternetaswellassocialfollowedbythegroup“between20to40”.
Hypotheses Testing To examine the impact of age on socialnetworking sites chi square test is used totesttheNullHypothesesandtheresultsarepresentedinTable-20.
Thecalculatedvalue(21.250)isgreaterthantablevalue(15.507)Thus,thenullhypothesesis rejected and the alternative hypotheses “age has Impact on the frequency of useof social media” is accepted. The resultsshow of hypotheses testing show that Agean independent variable has an impact on Frequency of using internet which is adependent variable.
Thus, marketers who intend to targetgeneration Y can use this medium to use as
a communicating tool with this generation. Generation X (The age group above 40Years)arenotobvioususersofsocialmediabecause this technology development took place comparatively later but the response alsoportraysthatgenerationXisalsopickingupandoveraperiodoftimetheirfrequencyofusagewouldalsoincrease.
Butit’sverysurprisingtofindthatthemiddleaged that is the group between 20 and 40 are not very active on social active sites. For themarketersitsquitenegativebecausetheage group 20 to 40 is expected to use lots of technology and have purchasing powerwhich is required when it comes to takepurchase decisions on the other hand the age group which is very active are youngsters i.e., less than 20 years which may be the teenagersjustoutfromcollegemaybedoingtheir higher education and may not have the financial independency. A generation whichdoesnot have financial independencyevenif they are active on social media will notprovide business opportunity to the marketers intending to use socialmedia formarketingpurpose.
Data inTable-21 shows that almost all agegroups have slowly started using social mediabutthefrequencyofusagevarieswithage.TheyoungerGeneration i.e.,below20yearsagegroup is themost frequentusersofsocialmediaandtheotheragegroupsarecomparativelythelessfrequentusers.
Table-21showsthegenderwiseclassification
Table-20: Chi Square Test - Association of Age and Frequency of use on SNS
Null Hypotheses Degrees of Freedom
Calculated Value Chi-square value
and df-8
Critical Value at 5% level of significance
Test Result
H0-AgehasnoimpactonFrequencyofuseofSocialnetworkingwebsites 8 21.250 15.507 Rejected

Journal of Marketing Vistas
19
vis-a-vis frequency of using social media.Data presented in the table shows that both maleand femalearealmost equal users ofsocial networking sites with male portraying 63.57%ofscalevaluepercentageandfemale64.39%.
Thedata shows that bothmaleand femaleuse social media frequently with varieddegreesanddonot differmuch in termsoffrequency of usage. Bothmale and femalearefoundnetsavvyaswellandsocialmediasavvy.
Themeanvalueswith2.54meanscalevalueand Female 2.7 mean scale Value shows that usage of social media is more frequent bywomenbutthedifferencebetweenmaleandfemaleusagenottoohigh.
Toexaminetheimpactofgenderonfrequencyof usage on social networking sites Chi-Square test is used to test the hypotheses“Gender has no impact on Frequency of use of Social networking websites” Results showthatcalculatedvalue3.35is lessthantable value 9.488 thus the null hypothesesis accepted. Which means the Independent variable (Gender) has no impact on thedependentvariable(thefrequencyofuseofsocialmedia).
The scale value percentage in Table-23shows that advertisement on social media is able to gather about 55% attention fromrespondents who are under 20 group ofage. The scale value percentage of payingattention to the advertisements on social
Table-21: Cross Tabulation of Gender and Frequency of Using Social Media
Response OptionsScale
Values(SV)
Male(F) FX SV Female FX SV
VeryFrequently 4 37 148 24 96
Frequently 3 78 234 49 147Occasionally 2 26 52 17 34Sometimes 1 39 39 16 16Never 0 6 0 1 0Total 186 473 107 290TotalScaleValue 186x4=744 107x4=428Mean Scale Value 2.54 2.7
Scale Value Percentage 473/744x100=63.57%
290/428x100=67.75%
Table-22: Chi-Square Association of Gender and Frequency of Use of Internet
Null Hypotheses Degrees of Freedom
Calculated Value Chi-square value
Critical Value at 5% level of significance
Test Result
H0-GenderhasnoimpactonFrequencyofuseofSocialnetworking websites
4 3.35 9.488 Accepted

Volume 7, No 2, July-December 201720
mediashowsthatthereisstillalotofscopeforimprovementacrossallagegroupswhenit comes to paying attention on social media. Themeanscalevalueacrossallagegroupsislessthan2.5whichshowsthattheattentionpaid to ads is certainly less.
The users of social media do not seem topay adequate attention for the marketerto be successful in using it for marketingcommunication and generating results. Marketing communication in social media across all age groups seem to attract less attentionasitisclearlyevidentfromthedata.In a nutshell, the data portrays that though thefrequencyofusageofinternetandSocial
Media has improved the attention paid to ads still remains low across all age groups.
Results of the Chi-Square test presentedin Table-24 clearly shows that the nullhypotheses is Accepted indicating that Age has no impact on paying attention to ads on socialmedia.Thedata in theTable 23and24 shows that the advertisements on social Media fail toattractattentionacrossallagegroups.
The marketers who intend to use socialmedia for the marketing communicationpurposes need to find better methods ofusing social media and attracting the users
Table-24: Chi Square test – Association of Age and Respondents Attention to Advertisements in Social media
Null Hypotheses Degrees of Freedom
Calculated Value Chi-
square value and df-4
Critical Value at 5% level of significance
Test Result
H0-AgehasnoimpactonFrequencyofPayingattentiontosocial media ads
8 14.12 15.50 Accepted
Table-23: Cross Tabulation of Age and Frequency of Paying Attention to Advertisements on Social Media
Scale Values
(SV)
Less Than 20(F) FXSV 20 to 40
(F) FXSV Above 40(F) FXSV
VeryFrequently 4 15 60 7 28 2 8Frequently 3 28 84 23 69 10 30Occasionally 2 42 84 12 24 8 16Sometimes 1 16 16 20 20 13 13Never 0 10 00 7 00 5 00Total 111 244 69 141 38 67TotalscaleValue 111x4=444 69x4=276 37x4=152Mean Scale Value 2.19 2.04 1.76Scale Value Percentage
244/444x100=54.95
141/276x10051.08
67/152x100=44.07

Journal of Marketing Vistas
21
of socialmedia towards theadvertisementsas the advertisements on social media do not seemtoattracttheattentionofusers.
The data in Table-25 shows that male andfemale pay almost equal attention to thesocial media male being slightly high with 52.5% attention and female giving 50.64%.The marketers need to make the socialmediaadvertisementmoreeffective todrawtheattentionoftheavidusersofthemedia.
Meanof thescalevaluealsoamongstmaleand female respondents is very close i.e.,2.10 for male and 2.02 in case of femalerespondentswhichshowsthatthefrequencyofpayingattentiontoadvertisementsisquiteless.
Thisgroupwhichoccasionallypaysattentionmaybe slowly converted from occasionalviewers to frequent viewers provided theads on social media is properly targeted and made meaningful. Marketers can use thedemographic information available from theprofile of the user and thus, target only theright group and make ads more interesting andneedfulfilling.
Table-26 presents the results of thehypotheses test and the hypotheses Gender has no impact on frequency of payingattention to social media is Accepted. ThisIndicates that gender has no impact on the frequency of paying attention to purchasemedia.Bothmaleandfemaledopayattentiontoadvertisementsofsocialmedia.
This paper systematically intends to bringto the foray themost important dimensionsof marketing communication through socialmediaandmostimportantlythereachofthismediaandtheconsiderationoftheinformationshared or presented here for purchasedecision.Thedataanalyzedso farportraysthat the reach of social media is slowlygaining momentum along with the increase in thepenetrationof internetand fallingpricesofinternetandthedevicesonwhichinternetcanbeused.ThedatapresentedinTable-27shows the scale value percentage and mean scale values of the respondents.The scalevalue percentage amongst the age group between20and40is61.6%whichishighestamongst all age groups followed by agegroup“Lessthan20”.Thismeansthatthough
Table-25: Gender wise Classification of Frequency of Paying Attention in Social Media Advertisement
Response options Scale Value(SV) Male(F) FXSV Female(F) FX SV
VeryFrequently 4 17 68 7 28Frequently 3 41 123 20 60Occasionally 2 35 70 27 54Sometimes 1 33 33 16 16Never 0 14 00 8 00Total 140 294 78 158Total scale 140x4=560 158x4=312Mean scale value 2.1 2.02
Scale Value Percentage 294/560x100=52.5%
158/312x100=50.64%

Volume 7, No 2, July-December 201722
the age group between 20 and 40 is not so frequent in terms of using Internet, Socialmedia, and attention to the advertisements thereinbut the informationon them isquitesignificantly considered when it comes topurchasedecisionfollowedbytheagegroup“Lesthan20”whichistheyoungergenerationwhoarefoundtobefrequentlyusinginternet,Social media and also pay some attention to ads but when it to comes the considering that informationforpurchasedecisionitisholdinga second position.
For a marketer it is good that the age group 20
to 40 is more positive towards the considering the information available on social mediabecause this is age group is most involved in decisionmakingforthefamily.
Table-27shows thatagegroupBetween20to 40 is the group which is at the forefrontin considering the information available onsocialmediafollowedbythegroupbelow20yearsofageandthe least is theagegroupabove40years.Thisinformationmayconsistoftheinformationintheformofadvertisementor in the formofproduct informationsharedbyfriendsandpeers.
Table-27: Age Wise Classification of Respondent’s Consideration of the Information Available on Social Media of their Purchase Decision
Response Options
Scale Value (SV)
Less than 20 (F) SVxF 20 to 40
(F) SVxFGreater than 40
(F)SVxF
VeryFrequently 4 20 80 7 28 4 16Frequently 3 44 132 27 81 11 33Occasionally 2 46 92 20 40 12 24Sometimes 1 20 20 35 35 25 25Never 0 7 0 8 56 7 00Total 137 324 97 240 59 98Total Scale 548 388 236Mean Scale Value 2.36 2.47 1.66
Scale Value Percentage
324/548x100=59.12-II
240/388x10061.6-1
98/236x100=41.5_III
Table-26: Association of Gender on Paying Attention to Advertisement on Social Media
Null Hypotheses Degrees of Freedom
Calculated Value Chi-
square value and df-4
Critical Value at 5% level of significance
Test Result
H0Gender has no impact on FrequencyofPayingattentionto social media ads
4 2.503 9.488 Accepted
Journal of Marketing Vistas
23
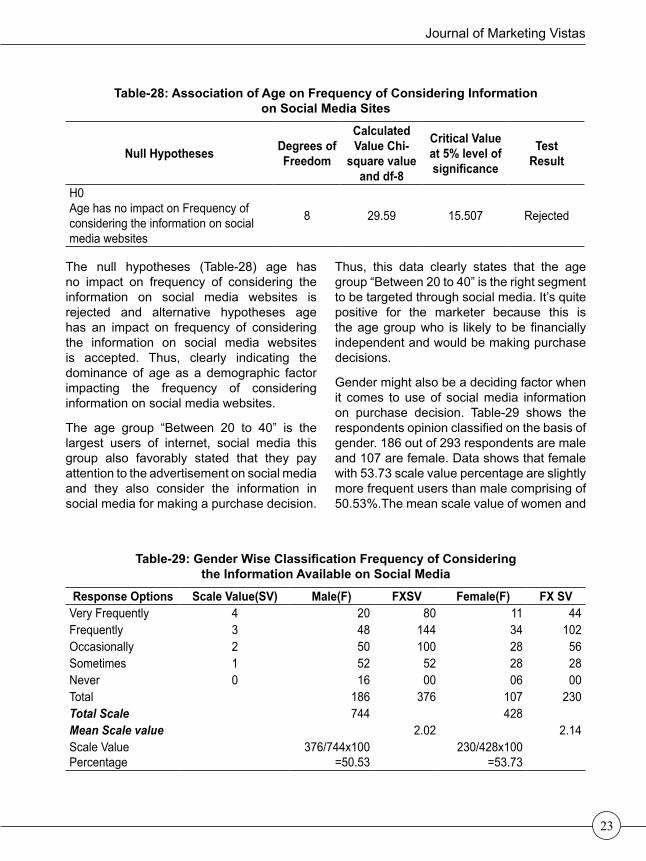
The null hypotheses (Table-28) age hasno impact on frequency of considering theinformation on social media websites isrejected and alternative hypotheses age has an impact on frequency of consideringthe information on social media websitesis accepted. Thus, clearly indicating thedominance of age as a demographic factorimpacting the frequency of consideringinformationonsocialmediawebsites.
The age group “Between 20 to 40” is thelargest users of internet, social media thisgroup also favorably stated that they payattention to the advertisement on social media and they also consider the information insocialmediaformakingapurchasedecision.
Thus, this data clearly states that the agegroup“Between20to40”istherightsegmenttobetargetedthroughsocialmedia.It’squitepositive for the marketer because this istheagegroupwho is likely tobefinanciallyindependent and would be making purchase decisions.
Gendermightalsobeadecidingfactorwhenit comes to useof socialmedia informationon purchase decision. Table-29 shows therespondentsopinionclassifiedonthebasisofgender.186outof293respondentsaremaleand107arefemale.Datashowsthatfemalewith53.73scalevaluepercentageareslightlymorefrequentusersthanmalecomprisingof50.53%.Themeanscalevalueofwomenand
Table-29: Gender Wise Classification Frequency of Considering the Information Available on Social Media
Response Options Scale Value(SV) Male(F) FXSV Female(F) FX SVVeryFrequently 4 20 80 11 44Frequently 3 48 144 34 102Occasionally 2 50 100 28 56Sometimes 1 52 52 28 28Never 0 16 00 06 00Total 186 376 107 230Total Scale 744 428Mean Scale value 2.02 2.14Scale Value Percentage
376/744x100=50.53
230/428x100=53.73
Table-28: Association of Age on Frequency of Considering Information on Social Media Sites
Null Hypotheses Degrees of Freedom
Calculated Value Chi-
square value and df-8
Critical Value at 5% level of significance
Test Result
H0AgehasnoimpactonFrequencyofconsideringtheinformationonsocialmedia websites
8 29.59 15.507 Rejected

Volume 7, No 2, July-December 201724
male is 2.02 and 2.14 which is very low and thereisnosignificantdifferenceinthemeanvalue.
Subsequentexaminationofgenderimpactonthefrequencyofconsideringtheinformationon socialmedia is done throughchi-squaretestpresentedinTable-30.
Hypotheses “Gender has no impact onFrequencyofconsideringtheinformationonsocialmediawebsites” is testedandas thecalculated value of chi-square is less thanthecritical valueat5% level of significancethe hypotheses is accepted. The results ofthe hypotheses test shows that gender has no impact on frequency of considering theinformation on social media website. Bothmaleandfemaletendtopayattentiontosuchinformation.
The data analysis and hypotheses testing clearly shows that
Age has impact on• Frequency of using internet.• Frequency of use of Social networking
websites• Frequency of considering information on
social media websites.Gender has No impact on• Frequency of use of Social networking
websites
• Frequency of paying attention to social media advertisements.
• Frequency of considering the information on social media websites
Data analysis to understand the post purchase Behavior and response The purchase behavior of the respondentsgoes tracing the satisfaction levels ofthe buyers after the purchase is madewhich is satisfaction with the purchase ordissatisfactionwiththepurchase.ThedatainTable-31shows the respondentsopiniononthesatisfaction levelsafter theyhavemadethe purchase resorting to the informationeither shared or advertised on social media. It’sevident fromthedata thatabout72%oftherespondentsstatedthattheyaresatisfiedwith the purchase decision they have made owingtotheinformationonthesocialmedia.
Satisfactionlevelwiththeinformationsharesisaverypositiveindicationforthemarketersto use it formarketing communication.Thisa unique dimension of this medium whichshowsthesatisfaction levelof thepurchasedecision taken.The respondents (61%) opined that theywould sometimes buy the product design
Table-30: Association of Gender on Frequency of Considering the Information on Social Media Websites
Null Hypotheses Degrees of Freedom
Calculated Value Chi-
square value and df-8
Critical Value at 5% level of significance
Test Result
H0Gender has no impact on Frequencyofconsideringtheinformationonsocialmediawebsites
4 1.781 9.488 Accepted

Journal of Marketing Vistas
25
showninthewebsitefollowedbyabout18%who would purchase most of the time andonly a negligible 12.63% stated that theynever buy the product design which appears onthesocialwebsitepresentedinTable-32.
The lastdimensionof the responseonpostpurchase behavior (Table-33) talks aboutreiterating the product purchased based on the purchase decision the highest 43.49%respondents said they sometimes share their shopping experience followed by 28.76%stating they will always share such shopping experienceonlyameager8%saidtheywouldnever share. Respondents on the whole gave a positive indication towards sharing their
shopping experience with their friends andpeers.
Findings • Google is stated to be an important source
of information as per the respondent’sopinion followed by newspaper andcompany website and social networking do not seem to catch much attention.
• Internet is largely found to be used forsocializing by the respondents followedby email.
• Respondents stated that most of themcheckupdatesinsocialmediafollowedbychatting. Which means chatting is slowly
Table-31: Level of Satisfaction Regarding Purchase of ProductResponse Options Number of respondents Percentage
Satisfied 180 61.43Verysatisfied 30 10.24Neutral 78 20.62Unsatisfied 05 1.7Total 293 100
Table-32: Buy Same Product Design which Appears on Social WebsiteResponse Options Number of respondents Percentage
Always 25 8.53Mostofthetime 52 17.75Sometimes 179 61.09Never 37 12.63GrandTotal 293 100
Table-33: Share Shopping Experience to Friends and PeersResponse Options Number of respondents Percentage
Always 84 28.76Sometimes 127 43.49Occasionally 56 19.17Never 25 8.56GrandTotal 292 100

Volume 7, No 2, July-December 201726
gaining momentum amongst social media users.
• Advertisements should be made interesting to attract attention. The respondents stated that if theadvertisement is interesting it motivates a person to purchase followed by thefamiliarityofthebrandname.
• Electronics and electrical are themost frequently purchased productsconsidering the communication on social media.
• The initial diagnostic approach of socialmedia shows that information sharedbyfriends and marketing communicationthrough social media is considered while making a purchase decision.
• Thoughtherespondentsstatedthattheydo consider information on socialmediawhile they make purchase decision the frequencyofsuchconsiderationisless.
• Gender has no impact on Frequency ofusinginternet,FrequencyofuseofSocialnetworking websites and Frequency ofconsidering information on social mediawebsites.
• Agehas impact onFrequencyof useofSocial networking websites, Frequencyof paying attention to 9. Social mediaadvertisements,Frequencyofconsideringtheinformationonsocialmediawebsites.
• Theagegroup20-40showsapositivesignofusingsocialmediaandconsideringtheinformation thereon thus marketers cantarget this age group using social media.
• Thequalityofadvertisementsneedtobeimprovedforbetterimpact.
ConclusionThis study examines scope of usinginternetandsocialmedia formarketingandcommunication and it was found that thereis a future in internet with increase in its
demand.Socialmediaandinternetarefoundtheme most popular amongst youngsters and thereisconfidenceontheinformationsharedthere. Social appears to be replacing word ofmouthinthefuture.Thesharingonsocialnetworks like face book are considered asreliable and dependable in making a purchase decision because it’s not considered as anadvertisement it’smore likea friendsharingan information which creating an impactof word of mouth. Thus, creating customersatisfactionisconsideredimportantbecausethissatisfactionwill leadtosuchinformationsharing on social media which will help the firm in developing a positive brand imageAdvertisements do not seem to have much influenceandadvertisershave tomake theadvertisement interesting. It’s evident fromthe study that those advertisement which are interesting so have an impact on the purchase decision. Marketers have to understand that Postusagecustomersatisfactionwouldresultin sharing of the satisfaction through thesocial media and ultimately would improve the brand Image.
ReferencesAndreas M. et. al., (2009). Users of the world,
unite! The challenges and opportunities of Social Media, Kelley School of Business, Indiana University.
Andrew Rohm & Velitchka D. Kaltcheva (2013). A mixed-method approach to examining brand-consumer interactions driven by social media study, Journal of Research in Interactive Marketing, 7(4), pp: 295-311.
Bruhn.M et. al., (2012). Are social media replacing traditional media in terms of |brand equity creation?, Management Research Review, 35(9), pp:770-790.
Challagalla.G et. al., (2009). Proactive postsales service: when and why does it

Journal of Marketing Vistas
27
pay off?, Journal of Marketing, 73(2), pp: 70-87.
Dimitriadis, S. & Papista, E. (2010). Integrating relationship quality and consumer-brand identificationinbuildingbrandrelationships:proposition of a conceptual model, The Marketing Review, 10(4), pp:385-401.
Don E. Schultz (2013). Social media’s slippery slope: challenges opportunities and future research directions, Journal of Research in Interactive Marketing, 7(2), pp: 86-99.
Doorn.J.V et. al., (n.d.). Customer engagement behavior: theoretical foundations and research directions, Journal of Service Research, 13(3), pp: 253-266.
Facebook (2011). Like button: best practices, [Available at: https://developers.facebook.com/attachment/LikeButtonBestPractices_v1.pdf] [Accessed May 1, 2013]
Facebook (2013). Success stories, [Available at: www.facebook.com/FacebookStudio/app_397409610271055] [Accessed September 30, 2013]
Gajendra Sharma & Li Baoku (2013). Customer satisfaction in Web 2.0 and information technology development, Information Technology & People, 26(4), pp: 347-367.
Gallaugher & Ransbotham (2010). Social Media and Customer Dialog Management at Starbucks, MIS Quarterly Executive, 9(4).
Georgios Tsimonis & Sergios Dimitriadis (2014). Brand strategies in social media, Marketing Intelligence & Planning, 32(3), pp:328-344.
Godes, D. & Mayzlin, D. (2009). Firm-created word-of-mouth communication: evidence from a field test, Marketing Science, 28(4), pp: 721-739.
Halliday, S & Vrusias, B (2011). The spread and spread of word of web: towards understanding how marketers can interact with social networks, Marketing Fields Forever, Proceedings of the Academy of Marketing Conference, Liverpool.
Harrigan, P (2011). Modelling CRM in the social media age, Marketing Fields Forever, proceedings of the Academy of Marketing Conference 2011, Liverpool.
h t tp : / /www.brandwatch .com/2014/01/why-2014-is-the-year-of-social-media-advertising/
http://www.researchandmarkets.com/research/fxkxpd/databook_q2_2014
Jeff Mc Carty et. al., (2014). Managing brand presence through social media: the case of UK football clubs, Internet Research, 24 (2), pp:181-204.
Krista Ann Voss (2013). The value of social media: are universities successfully engaging their audience?, Journal of Applied Research in Higher Education, 5(2).
Kumar, V. & Mirchandani, R. (2012). Winning with data: social media-increasing, the ROI of social media marketing, MIT Sloan Management Review, 54(1), pp: 55-61.
Kumar. V et. al., (2010). Undervalued or overvalued customers: capturing total customer engagement value, Journal of Service Research, 13(3), pp: 297-310.
Kunal Swani & George Milne (2013). Spreading the word through likes on Facebook Evaluating the message strategy effectiveness of Fortune 500 companies, Journal of Research in Interactive Marketing, 7(4), pp: 269-294.

Volume 7, No 2, July-December 201728
Lindgreen. A. et. al., (2013). Word-of-mouth and viral marketing referrals: what do we know? and what should we know?, European Journal of Marketing, 47(7), pp: 1-12.
Mangold W.G. & Faulds D.J. (2009). Social media: the new hybrid element of the promotion mix, Business Horizons, 52(4), pp: 357-65.
Mint, November 8, 2015.
Neff, J (2007). OMD proves the power of engagement, Advertising Age, Vol. 78.
Optimal ways for companies to use Facebook as a marketing channel, Linnea Hansson and Anton Wrangmo, Journal of Information, Communication and Ethics in Society, 11(2), pp: 112-126.
Ronald E. Goldsmith (2013). Social network activity and contributing to an online, Review site, Journal of Research in Interactive Marketing, 7(2), pp: 100-118.
Sarah Tsitsi Chikandiwa (2013). The adoption of social media Marketing in South African banks, European Business Review, 25(4), pp: 365-381.
Sedley, R. (2008). Six theses on digital customer engagement in a troubled economy, [Available at: www.richard-sedley.iuplog.com/default.asp?item¼298747]
Sweeney, J.C et. al., (2012). Word of mouth: measuring the power of individual messages, European Journal of Marketing, 46(1/2), pp: 237-257.
Sweeney, J.C. et. al., (2012). Word of mouth: measuring the power of individual messages, European Journal of Marketing, 46(1/2), pp:237-257.
Trusov, M et. al., (2009). Effects of word-of-mouthversustraditionalmarketing,findingsfrom an internet social networking site, Journal of Marketing, 73(9), pp: 90-102.
Veloutsou, C. (2007). Identifying the dimensions of the product-brand and consumer relationship, Journal of Marketing Management, 23(1/2), pp:7-26.
Voyles, B. (2007). Beyond Loyalty: Meeting the Challenge of Customer Engagement, Economist Intelligence Unit, [Available at: adobe.com/engagement/pdfs/partI.pdf]

29
1 Research Scholar, IKG Punjab Technical University Kapurthala, Punjab and can be reached at:[email protected]
2 AssociateProfessor,DepartmentofManagementStudies,AmritsarCollegeofEngineeringandTechnologyandcanbereachedat:[email protected]
3 ResearchScholar,IKGPunjabTechnicalUniversity,Kapurthalaandcanbereachedat:[email protected]
Social Media Marketing: The New Revolution in Business Engagement
Gursimranjit Singh1 Maninder Singh2 Priyanka Singh3
JournalofMarketingVistasISSN 2249-9067 Volume 7, No 2, July-December 2017 pp. 29-40JMV
Abstract Theadventofinternethasrevolutionizedthebusinessenvironmentwithasignificantimpact on the retail strategies as well. Social media is one such revolution and has gained attention of marketers throughout the globe. Social media has become awidelyusedtoolformarketingsinceitprovidesaneffectiveplatformtotheretailfirmstointeractwiththeircustomers.Thoughbrandingwiththehelpofsocialmediaisinitsinfancystagebutconsumersareconnectingwiththebrandsthroughsocialnetworkingsites which are gaining interest of themarketers and the academicians that howvarioustoolsavailableonsocialmediawouldsupportthesuccessfuldevelopmentofabrand.Socialmediagivesorganizationsaplatformwheretheycancommunicatewithcustomers.Itexemplifiesthe“brand”andhelpscompaniestospreadthemessageineasyandconversationalway.Manyofthetopcompanieshaveusedsocialmediafor achieving their business aspirations. This paper provides an overview of theexistingliteratureonthesocialmediamarketingandpropoundsthesignificanceofthismarketingtool- inpresentretail.Weproposeaconceptualframeworkinwhichwediscussthelinkagesofsocialmediawithothermarketingmetrics.Weexplicitlytakeadynamicview,inwhichwearguethatsocialmediamarketinghasasignificantrelationshipwithbehavioraloutcomesofthecustomersaswellasstrategicbrandingbythefirms.Socialmediamarketingisalsoapproachedfromastrategicperspectiveby focusingon the issues suchas relevanceand limitationsof socialmediaasamarketing tool. There are advantages, disadvantages and challenges that areassociated with any social media strategy so organizations should be very particular

Volume 7, No 2, July-December 201730
beforetheychosenstrategyrelatedtoit.Thesestrategiesshouldverycarefullylookupon by the organizations in order to monitor the activities associated with their brand. Aswith thehelpofsocialmedia individualcancommunicatewith largenumberofpeople so organizations should be very particular about the message communicated onlineandaproperonlinestrategyandtacticsshouldbeframed.
KeywordsSocial Media, Marketing, Strategic Branding, Organizations, Relevance, Limitation, Consumer Metrics
IntroductionIn thepresentdigitaleraof communication,the evolution of new forms of media hasmoved it miles ahead of only being as aplatform for communication. Marketersuse various innovative strategies like use of social networking sites to promote theirrespectivebrands(Kaplan&Haenlein2012).Richter &Koch, have defined social mediaas are online applications, platforms andmedia which aim to facilitate interactions,collaborations and the sharing of content(Richter & Koch, 2007). Moreover socialmedia is an environment which includes social networking sites where a community ofpeopleexchange their ideasand interestover the internet through emails, chats, messaging, video chat, blogging, etc.
As business environment has changed over the years due to revolution and platformprovided by internet to reach a wider audience, companies throughout the world are using social media both to interact with the consumer and even to influence theirconversations (Amichai-Hamburger 2009).Withthehelpofsocialmediacompaniesarebuilding their brandequity by creatingbrandawareness and also understanding and promotingstakeholder’sparticipation tobuildup healthy relationship (Bruhnet. al., 2012),
resulting in brand loyalty (Palmatier et. al., 2007).
Social Media is gaining more and more attention for businesses as it exhibit amarketing opportunity that exceeds the traditional communication and companies candirectlyinteractwithcustomers(Rooney2011).This iswhyalmostall thecompaniesoftheworldareusingsocial media marketing initiatives. Companies are swiftly adoptingsocial media marketing through blog, facebook, twitter, instagram, whatsapp etc(Maryan 2015) (vinerean 2013). Kietznann(2011) posits that social media networkingbuils confidence and enhance reliabilityamong customers by providing transparency by sharing and discussing the informationbetween the company. As an interactive platform, social media enables business toengage existing customers (Chantinok 2015)and attract new customers (Karimi 2015),generate more sales (Marshall 2012) (Gilfoil2012), build brand awareness (Shojau 2013)(Tsimanis 2014), enhance brand loyalty (PalMatier et. al.,2007)andbrandimage(Barreda2014) (Bruhn 2012). With the increasingdigitalization there has been a great change in the way the consumers engage with the brands.Moreover ithas forcedcompanies tofindnewwaystodistinguishthemselvesfrom

Journal of Marketing Vistas
31
their competitors. Increasingly companies are putting more emphasis on branding to stay competitive.Thishasledtotheemergenceofbrandmanagementasoneofthemostcriticalsuccess factors for companies than everbefore.Thus,marketingandbrandmanagersmay assume that brand communication will increase through user generated social media communication (Smith et. al., 2012).Therevolution brought by technology is giving new shape and dimension to branding strategies. Though branding with the help of socialmedia is in its infancy stage but consumersare connecting with the brands through social networking sites which are gaining interest of the marketers and the academicians thathow various tools available on social media wouldsupport thesuccessfuldevelopmentofa brand.
Theoretical BackgroundMohan and Senthilmurugan (2015) studiedroleofsocialmediaforconsumer’sdecisionmakinginselectionofhospitalservicesamong180respondentslivinginIndia.Theresponseswerecollectedfromtherespondentsthroughemails.Theresultsofthestudyrevealedthatabout66.29%ofrespondentsusedFacebookfollowed by 21.91% respondents who usedYoutube,5.62%usedTwitter,Google+wasused by 4.49% of respondents, and onlyabout 1.69% of users used Orkut as theirpodium into social media. Moreover , when investigatingaboutsocialmedia informationconvincing them to visit hospitals about 61.24%ofrespondentsstatedneitheragreenordisagree,18.54%ofrespondentsstateddisagree, 14.61% of respondents statedagree,3.37%ofrespondentsstatedstronglyagree,andonly2.25%ofrespondentsstatedstrongly disagree.
Vukasovic (2013 )examined theusefulnessof social media in brand development. The
study found that among sample size of 200respondents in Slovenia, more than 58% ofmen and 42% of woman browse internet formore than 3 hours a day. Further, results suggested that 67% of younger populationbetweentheagegroupof18and35yearsusesinternet more as compared to older people.
Leerapong, Mardjo (2013) examined theimpactofsocialnetworkingsites,particularly,Facebook, while making online purchase decision.Thecustomersrankedintheorderof importance relative advantage, faith,perceived risk, affinity as the factors thatinfluence them topurchaseproduct throughFacebook.
FarooqFaraz,JanZohaib(2012)Examinedthe impact of social networking on themarketing strategies among users and organisations through product reviews. A sample of 100 respondents was takencomprising of users representing studentsandprofessionalsworkinginanindustry.Theyfound thatmostof the respondents supportmarketingonFacebook,andmorethan70%respondents agreed that the friends havemuch impact in buying decisions. Moreover 51% people recommended companies touse tagged based marketing on Facebook and large population has suggested that it is profitable for organizations. The study fromthe organization point of view included thesurveyoforganizationsrepresentativeswhichwere20innumber.Theresultsrevealedthat75% of the organizations use Facebookto show their presence but only 20% ofthem are seriously using social networking site Facebook for marketing purpose. Thefinding further suggests that around 35%organizations take feedback from theircustomersandmajorityoforganizationsarethinkingofprovidingsomegaintocustomerstogetfeedback.

Volume 7, No 2, July-December 201732
Sharma and Rehman (2012) find thataffirmative or pessimist information about aproduct or a brand available on the social media has a significant overall influenceon consumers purchase behaviour. Thecustomers spread positive word of mouththrough social media.
Pietro,EleonoraPantano(2012)researchedas to what extend social networks, as Facebook, has impact on consumer’spurchasing decision. They find thatenjoymentisakeymotiveofsocialnetworksusage as a tool for aiding the purchasingdecision.Theyalsosuggestthatconsumer’susefulness, perception of judgement andsuggestions about products on Facebook are among customers recreation activities forsocialnetworkingsites.Facebookisusedfor information searching on products andbrands, and perceived ease of use of theprovided tools influence consumers attitudeinpurchasingdecision.Theyalsosuggestaspontaneous positive link between attitude of customers towards social media andbehavioural intention.
(Curtis, 2011)highlighted thatFacebookhasmore than 500million users worldwide; 175millionpeopleuseTwitter;90millionusersuseLinkedIn;andMySpacehas57millionusers.
Sri Jothi, Neelamalar and Prasad (2011) intheirstudyinvestigatedtheusageofinternetamong 100 respondents. According to the study itwas found that12%of respondentsuseinternetonceaweek,19%respondentsbrowse internet 2 to 3 days a week, about 30%respondentsbrowse internet for1or2hours a day and themajority 39%of usersare browsing internet more than 3 hours a day. In their study regarding advertisements that respondents come across on social networking sites, they found that 32% of
respondents have given attention towards web banner ads in Face book, Twitter andOrkut; whereas for the pop up ads andflash ads in various websites only 8% ofrespondents cut across pop and 31% ofusers found video ads in YouTube and inother sites. Interestingly, only 8% of therespondents said that they have never paid attention to the advertisements displayed in social networking sites, while browsing internet for other interactions. The datashowedthat36%oftherespondentsshowedinterest to listen to the advertisements ofvariousbrands,35%oftherespondentssaidthat they listen to the brand communication soastogathermoreinformationtheylinktothebrandsitesand21%oftheuserbrowseaccording to theappearanceofpromotionalmessages, because the brand promotion could be in the different form of displayads, interactive feedback forms or games.They conclude that the pattern of brandcommunication influences the accessibilityand communication of advertisementinformation.
Burson-Marsteller, (2010) studied aboutthe 100 largest companies on the Fortune 500 listandconcludedthatdatashowsthatabout86%ofcompaniesareusingoneofthesocialnetworkingsitesand28%ofthemuseall four platforms. The study also revealedthatTwitter,isthehotpickamongthesocialmediasitesamongbusinessfirmsasabout65%ofthesecompaniesuseit.
Mangold&Faulds, (2009)alsoposit thatSocialmediahasinfluencedconsumerbehaviourfrominformationacquisitiontoafterbuyingbehavioursuch as resentment statements or conduct.
Thegrowthintheinternetinrecentyearshasmade new systems available to business: one suchgoodexampleissocialmedia(Luet. al.,

Journal of Marketing Vistas
33
2010).Thewideavailabilityoftheinternethasprovidedpeoplewithaplatformtousesocialmediaresultinginashiftfromemailtosocialnetworking sites, and to interact without the need for physical meetings (Gruzd et. al., 2011).
Need for StudyAlthough the concept of social mediamarketing is gaining wider popularity and it is also a well-researched topic but it has only been studied through theoretical or analytical dimensions. The literatureavailable reveals that the earlier studies have neverdescribedthebenefitsconsumersgainfrom this marketing tactic and how socialmedia has become an important marketing tool. In analysing and considering the rich plethoraofmulti-disciplinaryliterature,ithasbecome clear that studies are concentrating on depicting what social media marketing is as well as examining how companies are using social media for interacting withcustomers and promoting their brand and products. Despite the basic advances made by researchers and renowned academicians, development in this area of study hasbeen limited. Research needs to expand this horizon of social media marketing byproviding a deeper understanding of howconsumers are benefited from socialmediaand how socialmedia is proving as one ofthe best marketing tool for the marketers.More formalized studies are also neededto progress beyond theorized or forecastconclusioninordertogainknowledgeofreallifeutilization.
Conceptual FrameworkFigure-1 explains the key constructs that have been examined in the past research andtheirrelationshipshavebeensignificantlydocumented by the researchers.
Relevance of Social Media in MarketingSocial networking sites such as Facebook, Twitter,Likedin(SNSs)areaneffectivewebtechnologyforsocialinteractionsandsharinginformation (Lu & Hsiao 2010). SNSs hasbeen on spot light in e-commerce in the current environment (Fue et. al., 2009) ,where consumers are getting an opportunity to interact with each other by making social connections and participate in cyberspace (Mueller et. al., 2011). In the current timesconsumers have access to various sources of information and experiences, whichhave been expedited by other customer’sinstructions and feedbacks (Senecal &Nantel 2004). This is an important point asparticipation of customer through socialmediaisakeyfactorinmarketing(Do-Hyunget. al., 2007).The interaction of consumersthrough social media promotes trust in e-commerce. While accessing SNSs, the social communities of consumers help theirpeers to gain or lose trust in a provider.
Social media is also helping consumer socialisationwhichistheoutcomeofthesocialinteractions among consumers, and indirectly bypromotingproductassociation (Wanget. al.,2012).Theperceivedtrustofconsumersissignificantlyinfluencedbythesocialmedia(Pan & Chiou 2011). The interactions onthese platforms results in social supportand social support generated through social media therefore influences trust (Weisberget. al., 2011).Moreover trust in a vendor isincreased by positive comments, feedbackand higher ratings (Ba & Pavlou 2002).Feedbacks are perceived to be fruitful, andaffect attitude further resulting intention tobuy in consumers through the impact created about a product or service (Purnawirawanet. al., 2012). Hill, Provost, and Volinsky’s

Volume 7, No 2, July-December 201734
(2006) research establishes that a firm canbenefit from social networks to predict thelikelihoodofpurchaseintention.Thiscanbedonebytakingintoaccountafirm’schoiceofnetwork(i.e.Facebook,Instagram,Pinterestetc.) and by examining that network’s data.Assessing a network’s data substantiallyimproves a company’s marketing effortsbecause it provides the company with vital information on the network’s users, whichhelps determine the best social media tactics for that particular site (Hill, Provost,and Volinsky’s 2006). Based on this study,itcan furtherbeargued thatknowingwhichsocialmediasitesacompany’stargetmarket
utilizesisanotherkeyfactoringuaranteeingthatonlinemarketingwillbesuccessful.
Social media is playing a very dominant role in marketingasitisaneffectivecommunicationtool that makes the companies interact with customers and communicate about their product to those who are unaware of theirproduct. It is a tool that creates positioning behind their brand and creates a long lasting relationshipsresultinginbrandloyalty(Bruhnet. al.,2013).
Social Media Marketing Industry Report 2016 reveals that a majority of the marketers isusing social media to promote their brand with
Social Media
StrategicBranding
BrandAwareness
BrandLoyalty Attitude
BrandEquity
Interactioneffectthroughsocialmediamarketing
Purchase Intention
Actual Usage
Perceived EaseofUse
Perceived Usefulness
Consumer Metrics
Figure 1: Conceptual Framework

Journal of Marketing Vistas
35
FacebookandYouTubeholdingthetopspots.Italso furtherhighlighted thatabout63%ofmarketersaimonincreasingtheiruseofthesesocial networks.Among the different socialnetworking sites Facebook is widely used by the marketers.About 55% of marketerschoose Facebook, followed by LinkedIn at18%for their marketing activities. Moreover86% of marketers regularly use Facebookads as compared to only 18% Twitter ads.The report also mentioned that tactics andengagement are top area marketers want to master majority of marketers accumulatingtoabout90%wanttoknowthesocialtacticswithwhich they canbecomemoreeffectiveand also explore the best ways to employ theiraudiencewithsocialmedia(MichaelA.Stelzner2016).
Social media gives organizations a platform where they can communicate withcustomers. It exemplifies the “brand” andhelps companies to spread the message in easy and conversational way. Many of thetop companies have used social media forachievingtheirbusinessaspirations.Someofthe companies that have become involved in social media are:
Royal Dutch Airlines: Royal Dutch Airlines widelyusessocialmediaforinteractingwithcustomerswiththehelpofsocialnetworkingsite Twitter. It tweets regarding delayedplane on the tarmac and is committed to answering them all. Moreover the company also communicate regarding the estimated responsetimewiththehelpofsocialmedia,whichisupdatedeveryfiveminutes.
Dove:Doveusessocialmediainabeautifulway, as the company uses Twitter to helpwomen realize their hidden beauty by creating products that deliver real care.
Pampers: Pampers the diaper company use social media not to market its product but it
uses it tocreateagroupofpeoplesoon-to-be parents who can come together to share advice,feelingsandmemories.
Ford Motor Company: Ford is also using socialmediaasoneoftheirmarketingefforts.In their blog post, theymention headline ofthepostandalsothecommentsfromreadersandputitonthefrontpageoftheirwebsite.
Starbucks: Starbucks gives customers the option to manage and restore their coffeecards on social media. The company alsomakesitconvenienttofindnearbylocationsand look up international Starbucks spots.
Social media is gaining popularity throughout the globe it has increasingly becoming an ingrained aspect of every sphere of lifewhether we talk of political campaigns,defencestrategies,brandmanagementandeven intra company communication social media is all pervasive. Social media creates an identity of the brand in association withthe products or services that they offerand customers associate themselves with their peers that may be serving the same target market. Brand communication ispositively associated with brand equityas long as the communication leads to a favourableconsumerreactiontotheproductin question, compared to the equivalentnon-branded product (Yoo et. al., 2000). Insum, brand-based communication realizes the transmission of brand knowledge intermsofBrandawarenessandbrandimageregardless of the communication sender.Social and traditional media communications therefore both play an important part inimprovingthebrandequitybyincreasingtheprobability that a brand will be incorporated in theconsumer’sconsiderationset,simplifyingtheconsumer’sbrandchoiceandturningthatchoiceintoahabit(Yooet. al.,2000).

Volume 7, No 2, July-December 201736
Social virtual communities positively influence brand loyalty (Casaló, Flavián,& Guinalíu, 2010); Kardaras, Karakostas,& Papathanassiou, 2003). A plethora ofresearch has found linkage between brandequityandconsumerbehavioural outcomessuchaspurchase intention,wordofmouth,trust, loyalty, commitment. Marketing communication’s primary goal is to getconsumers to forman intention topurchasethe marketed product. Purchase intention refers to the mental stage in the decisionmaking process where the consumer has developed an actual willingness to act toward anobjectorbrand(Wellset. al.,2011;Doddset. al., 1991). Hence, the effectivenessof social media activities of firms will bemeasured against this goal. SM should therefore positively influence consumerspurchase intention (Keller, 2008; Kapferer,2008).
The acclaim of social media acrossconsumers and companies has opened new doors for scholars. Researchers havebeenquiet indealingwithhowsocialmediais becoming most important marketing tool howcustomerscanbebenefitedfromsocialmedia.
Limitation of Social Media Marketing Social media marketing not only creates opportunities,butalsonegativelyaffectsthebrandoftheorganization.Asthereisashiftinpowerfromtheproducertotheconsumer,consumers are now free to raise out theirconcerns either negatively or positively and at thesametimemakingitvisibletomillionsofpotential customers. Social media marketing allows customers to express themselves and withoutanyconsequencesmaking itoneofthefactorsthatmakesocialmediamarketingunpredictablebecauseanorganizationcan’t
stoppeople fromexpressing their thoughts.There are some limitation needs to beconsidered on social media marketing, which are:
Wrong Brand Strategy: The bad brandingstrategyonsocialmediacanbedownfallforan organization and put a company at a huge viral social disadvantage.
Time Investment: Social media marketing is a two way interaction which seeks commitment. Thefocusofmarketingthroughsocialmediais to establish a long term relationship that can be beneficial for the organization.There should be someone responsible tomonitoreachnetwork,respondtoqueriesofcustomers.Ifanorganizationcan’tcommitatleast5-6hrsaweekonsocialmediaitwillbelosing their potential customers.
Risk of adverse comments: When organizationsopenitsdoorsforopencriticismthere are chances of negative commentsabout a product or service. The negativeelectronicwordofmouthcanadverselyaffecttheimageandperformanceofthebrand.
No real short term return on investment: It is very difficult to calculate the returnon investment of social media marketingmoreover social media marketing is a long term strategy. It could take anywhere fromfewmonthstoayearbeforeanorganizationseestheadvantagesofcustomerloyaltyandincreased sales.
Privacy and security issues: With increase intheusageofthesocialmediaandnetworkson the Internet. Social networking sites like Facebook, YouTube, LinkedIn, Twitter,Instagram, Google+ etc have changed theway the Internet is being used. Howevergaining popularity and rapid increase in use of social media there is still lack of

Journal of Marketing Vistas
37
understandingofprivacyandsecurityissueson online social media. Security and privacy issues of online social media need to betakenintoconsiderationbecauseofconcernslike spam, phishing, fraud nodes onOnlineSocial Media.
Concluding RemarksAs social media marketing is a contemporary conceptsoresearchinthisfield isstill in itsearly stage but its relevance has drawn the attentionofpractitionersandresearchersallover the globe. Now a day’s Social mediais widely used by organizations and it has becomethemostfavoritetoolforadvertising.There are advantages, disadvantages andchallenges that are associated with any social media strategy so organizations shouldbeveryparticularbeforetheychosenstrategyrelatedtoit.Thesestrategiesshouldverycarefullylookuponbytheorganizationsin order to monitor the activities associated with their brand.As with the help of socialmedia individual can communicate with large number of people so organizationsshould be very particular about the message communicated online and a proper online strategyandtacticsshouldbeframed.
This study has attempted to identifyrelevance and limitation of social mediamarketingfororganizationsbyexploringtheextant literatureonsocialmedia.Thisstudyis helpful for understanding of socialmediaingeneral,whichishelpfulforacademicians,social media companies etc. Organizationsbefore entering the field of social mediamarketing should have complete research on social media practices. An organization has to adept basic principles and strategy of using social media as an effective toolin order to beat its competitor. Main aim an organization has to keep in mind is to involve customers so as to build company reputation,
to have positive interaction with customers regarding their goods and services and to satisfycustomer’sneedandwants.
ReferencesA. Barreda (2014). Creating Brand Equity
When Using Travel-related Online Social Network Web Sites, J. Vacat. Mark., 20(4), pp: 365-379.
Amichai-Hamburger, Y. (2008). Internet empowerment, Computers in Human Behavior, 24(5), pp: 1773-1775.
Ba, S. & Pavlou, P.A. (2002). Evidence of the effect of trust building technology in electronic markets: price premiums and buyer behavior, MIS Quarterly, 26(3), pp: 243-268.
Berthon, P.R., Pitt, L. & Campbell, C. (2008). Ad lib: when customers create the ad, CA Management Review, 50(4), pp: 6-31.
Bruhn, M., Schnebelen, S. & Schafer, D. (2013). Antecedents and consequences of the quality of e-customer-to-customer interactions in B2B brand communities, Industrial Marketing Management, 43(1).
Bruhn, M., Schoenmueller, V. & Schafer, D.B. (2012). Are social media replacing traditional media in terms of brand equity creation?, Management Research Review, 35(9), pp: 770-790.
Casaló, L.V., Flavián, C. & Guinalíu, M. (2010). Relationship quality, community promotion and brand loyalty in virtual communities: Evidence from free software communities, International Journal of Information Management, 30(4), pp:357-367.
Curtis A.[2011]. The brief history of social media. [Available at: http://www.uncp.edu/home/acurtis/NewMedia/SocialMedia/SocialMediaHistory.html].

Volume 7, No 2, July-December 201738
D.M. Gilfoil & C. Jobs. [2012]. Return on Investment For Social Media: A Proposed Framework For Understanding, Implementing, And Measuring The Return, Journal of Business Economics and Research. 10 (11), pp: 637-650.
Dodds, W.B., Monroe, K.B. & Grewal, D. (1991). Effects of price, brand, and store information on buyers’ product evaluations, Journal of Marketing Research, 28(3), pp: 307-319.
Do-Hyung, E, Jumin, L. & Ingoo, H. (2007). The effect of on-line consumer reviews on consumer purchasing intention: the moderating role of involvement, International Journal of Electronic Commerce, 11(4), pp: 125-148.
Faraz, F. & Zohaib, J. (2012). The Impact of Social Networking to Influence Marketingthrough Product Reviews, International Journal of Information and Communication Technology Research, 2(8).
Fue, Z., Li, H. & 8c Wenyu, D. (2009). Social factors in user perceptions and responses to advertising in online social networking communities, Journal of Interactive Advertising, 10(1), pp: 1-13.
Tsimonis, G. & Dimitriadis, S. (2014). Brand strategies in social media, Marketing Intelligence & Planning, 32(3), pp:328-344.
Marshall, G.W., Moncrief, W.C., Rudd, J.M. & Lee, N. (2012). Revolution in sales: The impact of social media and related technology on the selling environment, Journal of Personal Selling & Sales Management, 32(3), pp:349-363.
Gruzd, A., Wellman, B.Sc Takhteyev, Y. (2011) Imagining Twitter as an imagined community. American Behavioral Scientist, 55, 10, pp. 1294-1318.
Hill, S., Provost, F. & Volinsky, C. (2006). Network-based marketing: Identifying likely adopters via consumer networks, Statistical Science, pp:256-276.
http://www.burson-marsteller.com/bm-blog/burson-marsteller-fortune-global-100-social-media-study/
K. Chanthinok, P. Ussahawanitchakit & P. Jhundra-indra (2015). Social Media Marketing Strategy and Marketing Performance: Evidence from E-commerce Firms in Thailand, AU-GSB E-Journal, 8(1), pp: 1-19.
Kapferer, J.-N. (2008). The New Strategic Brand Management, London: Kogan Page
Kaplan, A.M. & Haenlein, M. (2012). The britney spears universe: social media and viral marketing at its best, Business Horizons, 55 (1), pp: 27-31.
Kardaras, D., Karakostas, B. & Papathanassiou, E. (2003). The potential of virtual communities in the insurance industry in the UK and Greece, International Journal of Information Management, 23(1), pp:41-53.
Keller, K.L. (2008). Strategic Brand Management: Building, Measuring, and Managing Brand Equity, Upper Saddle River: NJ Pearson Education.
Leerapong, A. & Mardjo, A. (2013). Applying Diffusion of Innovation in Online Purchase Intention through Social Network: A Focus Group Study of Facebook in Thailand, Information Management and Business Review, 5(3), pp:144-154
Lu,H.P.&Hsiao,K.-L.(2010).Theinfluenceof extro/introversion on the intention to pay for social networking sites, Information & Management, 47(3), pp: 150-157.

Journal of Marketing Vistas
39
Lu, Y, Zhao, L. & Sc Wang, B. (2010). From virtual community members to c2c e- commerce buyers: trust in virtual communities and its effect on consumers’ purchase intention, Electronic Commerce Research & Applications, 9(4), pp: 346-360.
M. Bruhn, V. Schoenmueller & D. B. Schäfer(2012). Are Social Media Replacing Traditional Media in terms of Brand Equity Creation?, Manag. Res. Rev., 35(9), pp: 770–790.
Mangold, W.G. & Faulds, D.J. (2009). Social media: The new hybrid element of the promotion mix, Business Horizons, 52, pp:357-365.
Maryam, N. Maarop, & R. Ibrahim (2015). Factors Influencing Customers Engagementin Social Media for Co-creation In The Fashion Industry Of Saudi Arabia,” in International Conference on Information Technology & Society, June, pp. 53-63.
Michael A. Stelzner (2016), Social Media Marketing Industry Report, “How Marketers are Using social media to grow their businesses”, Social Media Examiner, May 2016.
N. Mohan, P. Senthilmurugan. “An Empirical Study on Role of Social Media Marketing for Consumers Decision Making in Selecting Hospital Services”. Journal of Advances in Business Management; Volume 1, Issue 2 June 2015; Page: 49-59.
Sri Jothi, M. Neelamalar and R. Shakthi Prasad “Analysis of social networking sites: A study on effective communication strategy in developing brand communication” Journal of Media and Communication Studies Vol. 3(7), pp. 234-242, July 2011
Palmatier, R.W., Scheer, L.K. and Stennkamp, J.B.E.M. (2007), “Customer loyalty to whom? Managing the benefits and risksof salesperson-owned loyalty”, Journal of Marketing Research, Vol. 44 No. 2, pp. 185-199.
Pan, L.-Y. & Chiou, J.-S. (2011) How much can you trust online information? Cues for perceived trustworthiness of consumer-generated online information, Journal of Interactive Marketing, 25, 2, pp. 67-74.
Pietro, L.D., & Pantano, E. (2012). An empirical investigation of social network influenceon consumer purchasing decision: The case of Facebook. Journal of Direct, Data and Digital Marketing Practice, 14(1), 18-29.
Purnawirawan, N., De Pelsmacker, P. & Dens, N. (2012) Balance and sequence in online reviews: how perceived usefulness affects attitudes and intentions, Journal of Interactive Marketing, 26, 4, pp. 244-255.
Richter A, Koch M. Social software – status quo und Zukunft. Technischer Bericht, Nr. 2007–01, Fakultät für Informatik. Universität der Bundeswehr München; 2007.
Rooney, J. (2011). Loyalty innovation, now an “organic” campaign. Advertising Age, 82(13),16.
S. Karimi and H. S. Naghibi, “Social Media Marketing (SMM) Strategies for Small to Medium Enterprises (SMEs),” Int. J. Information, Bus. Manag., vol. 7, No. 4, pp. 86-98, 2015.
S. Shojaee and A. bin Azman, “An Evaluation of Factors Affecting Brand Awareness in the Context of Social Media in Malaysia,” Asian Soc. Sci., vol. 9, no. 17, pp. 72-78, 2013.
S. Vinerean, I. Cetina, L. Dumitrescu, and M. Tichindelean, “The Effects of Social Media

Volume 7, No 2, July-December 201740
Marketing on Online Consumer Behavior,” Int. J. Bus. Manag., vol. 8, no. 14, pp. 66–79, 2013.
Senecal,S.&Nantel, J. (2004)The influenceof online product recommendations on consumers’ online choices. Journal of Retailing, 80, 2, pp. 159-169.
Sharma, S., & Asad Rehman. (2012, July). Assessing the Impact of Web 2.0 on Consumer Purchase Decisions: Indian Perspective. International Journal of Marketing and Technology, 2(7), 125-139.
Smith, A.N., Fischer, E. and Yongjian, C. (2012), “How does brand-related user-generated content differ across YouTube, Facebook, and Twitter?” Journal of Interactive Marketing, Vol. 26 No. 2, pp. 102-113.
Vukasovic Tina “Brand Developing Relationship Through Social Media” International School for Social and Business Studies, Slovenia Active citizenship by management, knowledge management
and innovation knowledge and learning, International conference, Zadar, Croatia, June 2013
Wang, X., Yu, C. 8c Wei, Y. (2012) Social media peer communication and impacts on purchase intentions: a consumer socialization framework, Journal of Interactive Marketing, 26, 4, pp. 198-208.
Weisberg, J., Te’eni, D. 8c Arman, L. (2011) Past purchase and intention to purchase in e-commerce: the mediation of social presence and trust. Internet Research, 21, 1, pp. 82-96.
Wells, J.D., Valacich, J.S. and Hess, T.J. (2011), “What signal are you sending? How website quality influences perceptions of productquality and purchase intentions”, MIS Quarterly, Vol. 35 No. 2, pp. 373-396.
Yoo, B., Donthu, N. and Lee, S. (2000), “An examination of selected marketing mix elements and brand equity”, Journal of the Academy of Marketing Science, Vol. 28 No. 2, pp. 195-211.

41
The Market for Organic Foods: The Case of Hyderabad City (TS)M. P. Siva Kumar*
Abstract The market for organic products (OPs) in general and organic foods in particular is fast expanding in the country. The article looks at who buy OPs, and what, where and why they buy them. Our sample survey in the Hyderabad city throws up the fact that the decision to buy OPs is conditioned by the knowledge over the advantages of the products, by the compulsion to buy them and by the ability to buy them. Thus, we notice from the survey that it is mainly the males, the medium-sized families, the educated, the married and the high-income groups who buy the products. It is further found that the OPs that account for a larger share of the household budget are slow to gain popularity among the consumers. In addition, there is evidence that there is a vast market potential for the OPs and that advertising and authenticity of products matter in influencing their sales.
KeywordsOrganic Products, Consumer Purchasing Behaviour, Organic Food, Consumer Willingness
JournalofMarketingVistasISSN 2249-9067 Volume 7, No 2, July-December 2017 pp. 41-49JMV
* Asst.Professor,AmityGlobalBusinessSchool(AGBS)[email protected].
IntroductionAchievingenvironmentalsustainabilityoftheglobal foodsystemhasbeen identifiedasagrand challenge of the century. There is agrowing body of research emerging acrossvarious disciplines dedicated to findingthe most effective ways to reform the food
system. Seufert, Ramankutty and Foley(2012) view that one the most promisingalternativesformeetingthischallengeistheproduction of food using organic methods.The term organic is rooted in bio, from theGreekbios,meaning life or awayof living.Thetermorganicfoods isfirstcoined inthe

Volume 7, No 2, July-December 201742
1940sand refers to the food raised,grown,stored and processed without the use ofsynthetically produced chemicals, fertilisers,herbicides, pesticides, fungicides, growthhormones, and generic modification. Bakeret. al.,(2002)note,thatorganicfoodscontainonlyone-thirdofpesticidesthatconventionalfoods do.Their production is environmentalfriendly. Organic foods provide numerousvitamins, minerals and anti-oxidants (SoilAssociation, 2013). They promote healthin myriad ways and are nutritious (OpinionResearch, 1990; Shafie and Rennie, 2012;Harper and Makatouni (2002). However,Soler et. al., (2002) note that growingconsumerinterestinorganicallygrownfoodshas opened new market opportunities forproducers and in recent years consumer demand is also increasing.
The Market for Organic FoodsThemarketfororganicfoodsisstillatanascentstageof development.Themarket shareofthe foods ismerely1%of the totaldemandforchemicallyproducedproducts(WillerandKilcher,2010).Thedemandfororganicfoodsis constrained because consumers are still not quite aware of the advantages that gowiththefoods(Yinet. al.,2010),thefoodsarerelativelycostly(owingtohighlogisticalcostsand low volumeof operation), the labelling/certification of the foods is not foolproof forthe consumers to trust that they are truly producedorganically(VonAlvesleben,1997;Janssen and Hamm, 2012; Blackwell et. al., 2007; Ergonul, 2013). Most consumersthinkofonlyvegetablesandfruitswhentheywish to buy organic products and there is little knowledge that there are many other organic products. Notwithstanding these constraints, the demand for the OPs andparticularly organic foods is growing rapidlyin recent years. A survey undertaken by the Associated Chambers of Commerce andIndustry in India shows that there has been
a major shift in favour of the consumptionof organic products, particularly fruits andvegetables,inthemetrocitiesandabout62%ofmetropolitansarebuyingtheproducts.
Who Buy Organic Foods and Why?Social, economic and demographic characteristics and the health consciousness ofpeopleimpactonthepurchaseoforganicfoods.Thus,womentendtobecorebuyersof organic foods although health consciousmenarealsofoundtobeinterestedinthem(Davies et. al., 1995, Byrne et. al., 1994).Next, household income is found to haveasignificant positive correlation with organicfood purchases (Armagan and Ozdogan,2005). Thompson and Kidwell (1998) andCranfieldandMagnusson(2003)havesownthat wealthier households are more likely to spend on organic foods. In a study byHarper and Makatouni (2002) it was foundthat one of the most important reasons forpurchasing organic products is the perceived healthbenefitsoforganicfoodproductswhencompared to conventional food products.However, Caporale and Monteleone (2004)note that consumers ‘like’ of organic food,compared with conventional, increases with the presence of marketing communicationsproviding information on the label aboutthenutritional informationandalsooriginofproduction on products. The work of Loboet. al., (2013)hasshown that rising incomelevel, lifestyle, and the growth of healthconsciousness have a tendency to drive demand for organic products in general.Padel and Foster (2005) show that regularconsumers of organic foods are educated,affluent and belong to higher social class.Roitner-Schobesberger et. al., (2008)suggest that willingness to pay for organicfoods increases with age and income.Gracia and deMagistris (2008) show thatsex, income, age, education and household

Journal of Marketing Vistas
43
sizeallinfluencethedecisiontobuyorganicfoods.Richardson,JainandDick(1996)andNielsen(2006)concludethatthepresenceofchildren in the household impact positively onthepurchaseoforganicfoods.DimitriandDettmann (2012) study show that marriedconsumersarefoundtobeinfavoroforganicproducts.
Objectives and Methodology There is a paucity of research on thecharacteristicsofthebuyersoforganicfoodsin the country. The present study analysesthese characteristics, based on the data collected from a random sample of 537households purchasing consumer goods in Hyderabad city of the Telangana State. Ofthese,382households(or71%)werenotedto have bought at least one organic product (notmerelyorganicfood)inDecember2016.ThedatawerecollectedfromdifferentpartsofthecityandthereforethestudymaybesaidtoberepresentativeofthecityofHyderabad.Theresultsreachedheremayalsorepresenttheconditionsinsimilarlysituatedcitiesofthecountry.Thespecificobjectivesof thestudyare to know:1. The socio-economic status of those
buyingorganicproducts(OPs)2. TheplacewheretheconsumersbuyOPs3. ThereasonsforthepurchaseofOPs4. ThefrequencyofpurchaseofOPs5. TheOPsthatareboughtbytheconsumers
and6. ThewillingnesstopurchaseselectOPsif
available
Results and DiscussionsInfluence of Demographic, Social and Economic Factors on the Decision to Buy OPsTheneedfor,awarenessoverandaffordabilityoforganicproductsareall influencedbythe
demographic, social and economic status of the households. In what follows, wewill examine this status of the respondenthouseholds buying OPs. At the outset, weenquired whether it is males or femaleswhobuyOPsinthemain.It ispossiblethatmalesdominateinthisrespectforeveninthemetropolitan setting of India it is themaleswho exercise main control over household finances. Table-1 supports this contention.About two-thirds of those buying OPs aremales. If one-third of the purchases aremadebyfemalesitcouldbebecauseofthemetropolitan character of the city, becausesome of the females are earningmembersof the households and because femalesaremoreconsciousof thebenefits thatareassociatedwithOPs.
Table-1: Respondents Buying OPs Classified by Sex
Sex Number Reporting PercentageMale 248 64.92
Female 134 35.08
Total 382 100.00(Source:Questionnaire)
Family size could also influence the buyingbehaviour of households. It is possiblethatOPs are boughtmainly by the familiesthat are small in size because to meet the requirements of a big family proportionatelylarge amount needs to be spent on these costlier products and many such households cannotaffordtodoso.Ourdata,presentedinTable2,doesnotquiteconformtothisview.ItisseenthatthefamilysizeofthosebuyingOPs first increases and then decreases.Members of small families are likely to beyoung and therefore are not quite troubledby health problems to feel the need to buyhealth-promotingOPseventhoughtheycanafford them. As family size increases, theagestructureof the family changeswith the

Volume 7, No 2, July-December 201744
elderly in the family increasing inproportion.ThiscompoundstheneedtobeconsciousofhealthandthenecessitytobuyOPs.However,buyingOPstomeettheneedsofalltheelderlyin the family is a costly proportion formanyhouseholds. This may explain why only asmallproportionofbigfamiliesbuyOPs.
Table-2: Respondents Buying OPs Classified by Family Size
No. of Members in Family
Number Reporting Percentage
Two 52 13.62
Three 76 19.89
Four 143 37.43
Five 86 22.52
Six and above 25 6.54
Total 382 100.00(Source:Questionnaire)
We also looked at the age group of therespondentsbuyingOPsandthedetailsarepresentedinTable3.Asnoted,thedecisionto buy OPs is likely to be conditioned bythe knowledge over the advantages of theproducts, by the compulsion to buy them and bytheabilitytobuythem.Onallthreecountsthose in the age-group 15-25 years scorelow. Thismay explain why those belongingto this group form a low proportion amongthe respondents buying OPs. Those in theage-groups 25-35 years and 35-45 yearsscore high in respect of the three counts.Moreover, our data show that respondents of these age-groups, as expected, figureprominentlyamongthebuyersofOPs.Itmaybeonthegroundthattheycannotafford,therespondents of theage-groups45-55 yearsandabove55yearsareseenconstitutingasmall proportion of the respondents buyingOPsinoursample.
Table-3: Respondents Buying OPs Classified by Age-Group
Age-group in Years
Number Reporting Percentage
15-25 63 16.4925-35 142 37.1735-45 103 26.9645-55 59 15.45Above55 15 3.92Total 382 100.00(Source:Questionnaire)
Education increasesawarenessoverhealthissues.Somuchso, theproportionof thosebuying OPs should increase with increasein education status. As may be seen fromTable-4, our data largely support thisproposition.Whileaverysmallproportionofour respondents buyingOPs, figure amongthose with education ‘below 10th class’,a large proportion of them are found witheducation ‘graduation’ and ‘post-graduationandabove’.
Table-4: Respondents Buying OPs Classified by Education Status
Education Status Number Reporting
Per-centage
10th class and below 12 3.14Intermediate 35 9.16Graduation 174 45.54Post-graduation and above 161 42.14Total 382 100.00(Source:Questionnaire)
Individualswillfeelasenseofindependenceonce they are married. They are alsoexpected to behave more responsibly aftermarriage. So, one expects married persons to be buying OPs in large numbers. Onefindsabasisforthisexpectationinoursurveydata presented in Table-5, with 68.32% ofthe sample respondents belonging to the ‘married’status.

Journal of Marketing Vistas
45
Table-5: Respondents Buying OPs Classified by Marital Status
Marital status Number Reporting Percentage
Married 261 68.32Unmarried 121 31.67Total 382 100.00(Source:Questionnaire)
Householdincomeisbyfarthemostimportantfactor influencing the decision to buy OPs.It is highly probable that larger and larger proportionofthosebuyingOPswillbefoundas the household income increases. Oursurvey data is found consistent with thisobservation. From Table-6, it may be seenthattheproportionofrespondentsbuyingOPsincreases systematically with every increase inthesize-classoftheirhouseholdincome.
Table-6: Respondents Buying OPs Classified by Household Income Class
Income Class Number Reporting Percentage
Lessthan2lakhs 19 4.982-4 42 10.992-6 61 15.976-8 75 19.638-10 89 23.3010 lakhs and above 96 25.13Total 382 100.00(Source:Questionnaire)
WhataretheOPsthatappealtoconsumers?Our surveydatapresented inTable-7 showthat fruits and vegetables score over otheritems.Organicallyproducedfruitsareboughtbyalltherespondentsinquestion.Vegetablesof this category also figure in the basket ofnearlyall theconsumer-respondents.Thesefruits and vegetables do not account formuchofthebudgetoftherespondents,andthis may explain their popularity. Groceries, grains, flours etc produced organically arealso finding their way to the respondents’households, albeit a little slowly. Non-food
OPssuchastoiletries,somehouseholdOPsof daily use are beginning to figure in therespondents’budgets.
Table-7: Respondents Buying OPs Classified by OPs Bought
Organic Product Number Reporting Percentage
Fruits 382 100.00Vegetables 350 91.62Pulses, staples 201 52.61Grains,flours 189 49.47Toiletries 196 51.30Householditems,fabrics
131 34.29
Others 114 29.84(Source:Questionnaire) Note: A respondent can buy more than one product
Where do the respondents usually buy OPs? We may note from Table-8 that thepopular market outlets are special counters in supermarkets and rytu bazaars and designated organic stores. People are beginning tobuy theseproducts ‘on line’aswell.
Table-8: Respondents Buying OPs Classified by their Place of Purchase
Place of Purchase of
OP
Number Reporting Percentage
Super market 221 57.85RytuBazar 155 40.57Localretailer 124 32.46Online 55 14.39Organicstore 193 50.52(Source:Questionnaire)Note:Arespondentcanbuyfrommorethanoneplace
Whatarethevarioussourcesof informationofOPconsumers?ItmaybenotedfromTable9 that the respondents are motivated to buy theOPstheyboughtbythe‘displayofOPs’in different market outlets, by what ‘friendsandfamilymembers’speakofthem,andby

Volume 7, No 2, July-December 201746
theadvertisementsin‘healthmagazines’and‘newspapers’inthatorder.
Table-9: Respondents Buying OPs Classified by their Source of Information on OPs
Source of information
Number Reporting Percentage
News papers 140 36.64Healthmagazines 153 40.05Friendsandfamily 243 63.61DisplayofOPs 293 76.70(Source:Questionnaire) Note:Arespondentcangetinformationfrommorethan one source
Respondents to the survey opined that they areoptingtobuyOPseventhoughitmeanspaying a premium price for them becausetheybelievethattheproductsofferedforsaleare truly produced organically. Relevant data arepresentedinTable-10.
Table-10: Respondents Buying OPs Classified by the Reason Why they
Developed Trust in OPsTrust Developed
Because ofNumber
Reporting PercentageScientificevidenceon the pack 253 66.23Celebrity endorsement 52 13.61Advertisements 42 10.99Government stamping 162 42.40Others 70 18.32(Source:Questionnaire)Note:Arespondentcandeveloptrustbecauseofmore than one reason
It may be seen from the table that theydevelop their trust in the products from‘scientificevidenceonthepack’,‘governmentstamping / certification’, ‘advertisements inpopularmedia’etc.
WhypurchaseOPs?Table-11belowshowsvarious reasons for purchasing OPs.Respondents opined that they are opting tobuyOPseven though itmeanspayinga
premiumpriceforthem,forreasonsofhealth.Note fromTable-11 thatOPsare reportedlybought by a large majority of respondentsbecause there are ‘diabetes in the family’.‘Pooroverallhealth’inthefamilyalsoseemsto influence the buying decisions of therespondents. Quite a large proportion ofrespondents buy the products because they are‘healthconscious’.‘Presenceofchildreninthefamily’alsoseemstoshapethebuyingdecisionsofthepeople.
Table-11: Respondents Buying OPs Classified by the Reason Why they
Purchased OPsReason Number
ReportingPer-
centageDiabetesinthefamily 195 51.04Infants 35 9.16Children 127 33.24Poor overall health 118 30.89Pregnant women in the family
34 8.90
Healthconscious 129 33.76Others 27 7.06(Source:Questionnaire)Note: A respondent can give more than one reason
OPsarethusboughtbothtopreventandcureailments.DetailspresentedinTable-12.Ourdata shows that the respondents purchasing the OPs on a monthly basis account for37.43% of all respondents. However, thereare also those who buy the products once a year(28.02%).
Table-12: Respondents Buying OPs Classified by Frequency of Purchase of OPsFrequency of
purchaseNumber
reporting PercentageOnceaweek 70 18.32Onceamonth 143 37.43Onceayear 62 16.23No set pattern 107 28.02Total 382 100.00(Source:Questionnaire)
How much do the respondents spend onorganicfoods?

Journal of Marketing Vistas
47
Table-13: Respondents Buying Organic Foods Classified by Share of Amount Spent on the Foods in Total Amount
Spent on Food Items in GeneralShare of
amount spent on organic
foods in total amount spent on food items
Number reporting Percentage
Lessthan10% 83 21.7210%-20% 114 29.8420%-30% 104 27.2230%-40% 24 6.2840%andabove 57 14.92Total 382 100.00
(Source: Questionnaire)
Table-13 shows that about half therespondents devote less than 20% of their
totalexpenditureonallfooditemsonorganicfoods. There are those who devote 40%or more of their total food budget to foodsproduced organically. These data, togetherwith the observation made earlier, that about 71%of all consumersbuyoneor theotherorganic food, is a testimony to the marketpotentialthatexistsfororganicfoods.
Although, the demand for organic productsis increasing, the popularity of OPs is notwidespreadandmostoftheconsumersthinkofonlyfruitsandvegetables.However,thereare many other organic products and the rangeincludespastas,sauces,frozenjuices,frozen meals, soups, cookies, betweenmeals, stimulants, meat products, poultry, dairy, wine, pulses, nuts, seeds, cereals, oils,
Table-14: Respondents Willingness to Buy OPs OPs-Food Items Mean SD Skewness OPs-Food Items Mean SD Skewness
Fruits&Vegetables 3.79 1.79 0.629 Milk/Dairy products 3.84 1.93 0.310Chocolates&icecreams 3.60 1.67 0.801 Biscuits 3.98 1.73 0.202Juices 3.74 1.64 0.629 Bread 4.17 -0.03 1.723Beverages 4.27 1.84 -0.216 HealthBars 3.93 1.62 0.296Noodles 4.34 1.93 -0.160 BetweenMeals 4.48 1.94 -0.342Stimulants 4.07 1.81 0.004 Dryfruits 3.62 1.71 0.532Millets&Milletproducts 3.73 1.81 0.329 Cereals and Muesli 4.08 1.89 0.006Dals,Pulses&Legumes 3.72 1.61 0.448 BasicGrains&Flours 3.90 1.68 0.284EdibleOils 3.67 1.65 0.517 Sauces&Condiments 3.93 1.69 0.225Ghee 4.01 1.75 0.157 Jams,Jellys&Spreads 3.86 1.79 0.082Pickles and Chutney Powders
4.18 1.78 -0.141 Honey 4.18 2.06 0.140
Babyfood&HealthySupplements
3.21 1.74 0.899 Others 4.25 2.19 -0.162
Non-Food OPsHairCare 3.40 1.66 0.870 Detergents&Cleaners 4.02 1.79 0.143Skin Care 3.35 1.61 0.893 Incense sticks 3.65 1.79 0.349Soaps 3.84 1.74 0.301 Room Fresheners 4.03 1.92 -0.168HandBags&Accessories
4.08 2.21 -0.060 Seasonal Items 3.50 1.68 0.439
Aromatherapy 4.48 2.06 -0.495 Clothing/ Fabric 3.69 1.88 0.405EarthenCookware 3.95 2.20 -0.086 (Source:Questionnaire)

Volume 7, No 2, July-December 201748
chocolates, ice cream, beers, dairy produce etc in organic food category and non-foodssuch as aromatherapy, cook ware, shampoos, seasonal items, skin care, soaps, detergents, conditioners, cosmetics etc. What are the OPspreferrediftheyareavailable?Toknowtheseinsights,wehaveenquiredwiththetotalsample consumers on few select food andnon-food items (both users and non-usersofOPs)torateonaseven-pointscale(veryunlikelytonoopinion)ontheirwillingnesstopurchaseOPs ifavailable.Asmaybeseenfromthetable14,beverages,noodles,bread,between meals, pickles, chutney powders, honey, others and aromatherapy are OPsthat consumers are willing to purchase, being mean score is high.
ConclusionFromtheviewpointofhealthandenvironmentit is essential to promote organic products. However, presently the demand for theproducts is constrained. This is so for thereasons that consumers lack knowledge over thebenefitstheproductsbring,theproductsare relatively costly and there are doubts about the true nature of the products, viz.,whether they are truly produced organically. OursurveyamongtheconsumersofOPsinHyderabadcityoftheTelanganastatepointsatthewaysinwhichthemarketfortheOPscanbepromoted.Wenoticefromthesurveythat it is mainly the males, the medium-sized families, the educated, themarried and thehigh-income groups who buy the products. It isfurtherfoundthattheOPsthataccountfora larger shareof thehouseholdbudget areslow to gain popularity among the consumers. In addition, there is evidence that there is a vast market potential for the OPs and thatavailability, advertising and authenticity ofproductsmatterininfluencingtheirsales.ThemarketingstrategiesofthoseproducingOPsshould therefore be devised keeping theseobservations in mind.
References Armagan, G. & Ozdogan, M., (2005).
Determination of ecological characterization of egg and poultry meat consumption and consumer trends, Animal Production, 46 (2), pp:14-21.
Baker, B. P., Benbrook, C. M., Groth, E. & Benbrook, K. L. (2002). Pesticide residues in conventional, IPM-grown and organic foods: Insights from three U.S. data sets, Food Additives and Contaminants, 19(5): 427-446.
Blackwell, R et. al., (2007).Consumer Behavior: AnAsiaPacificApproach,Victoria:NelsonAustralia Pvt Limited.
Byrne, P.J., Bacon, J.R. & Toensmeyer, U.C. (1994). Pesticide residue concerns and shopping location likelihood, Agribusiness, 10(6), pp:491-501.
Cranfield, J.A. & E.Magnusson.(2003).Canadian consumers’ willingness-to-pay for pesticide free food products: An ordered probit analysis, International Food and Agribusiness Management Review, 6(4), pp:14-30.
Davies, A., A.J. Titterington & C. Cochrane. (1995).Whobuysorganicfood?Aprofileofthe purchasers of organic in Northern Ireland, British Food Journal, 97(10), pp:17-23.
Dimitri, C. & Dettmann, R.L, (2012). Organic food consumers: what do we really know about them?, British Food Journal, 114(8), pp:1157-1183.
Ergonul, B., (2013). Consumer Awareness and Perception to Food Safety: A Consumer Analysis, Food Control, 32(2), pp:461-471.
Gracia, A. & de Magistris, T. (2008). The demand for organic foods in the South of Italy: A discrete choice model, Food Policy, 33(5), pp:386-396.

Journal of Marketing Vistas
49
Harper, G.C. & Makatouni, A. (2002). Consumer perception of organic food production and farm animal welfare, British Food Journal, 104(3-5), pp: 287-299.
Janssen, M. & U. Hamm. (2012). Product Labelling in the Market for Organic Food: Consumer Preferences and Willingness-To-Pay for Different Organic CertificationLogos, Food Quality and Preference, 25(1), pp:9-22.
Lobo, A., B. Mascitelli & J. Chen (2013). “Opportunities for Small and Medium Enterprises in the Innovation and Marketing of Organic Food: Investigating Consumers’ Purchase Behavior of Organic Food Products in Victoria, Australia”, AI and SOCIETY, pp:1-12.
Padel, S. & Foster, C. (2005), Exploring the gap between attitudes and behavior: Understanding why consumers buy or do not buy organic food, British Food Journal, 107(8), pp: 606-625.
Richardson, P.S., Jain, A.K. & Dick, A., (1996). Household store brand proneness: A framework, Journal of Retailing, 72(2), pp:159-185.
Roitner-Schobesberger, B., I. Darnhofer, S. Somsook, and C.R. Vogl., (2008), “Consumer Perceptions of Organic Foods in Bangkok, Thailand.” Food Policy, 33(2):112-121.
Seufert, V. Ramankutty, N. & Foley, J. (2012).
Comparing the yields of organic and conventional agriculture, Nature, 485, pp: 229-232.
Shafie, F.A. & D. Rennie (2012). ConsumerPerceptions towards Organic Food, Procedia – Social and Behavioral Sciences, 49, pp:360-367.
Soler, F., Gil, J.M. & Sanchez, M. (2002). Consumers’ acceptability of organic food in Spain: Results from an experimental auction market, British Food Journal,104(8), pp:670-687.
Thompson, G. D. & Kidwell, J. (1998). Explaining the choice of organic produce: Cosmetic defects, prices, and consumer preferences, American Journal of Agricultural Economics,80, pp: 277-287.
Von Alvesleben, R. (1997). Consumer behavior”, in Padberg, D.I., Ritson, C. and Albisu, L.M. (Eds), Agro-food Marketing, CAB International.
Willer, H. & Kilcher, L. (Editors). (2010). The World of Organic Agriculture - Statistics and Emerging Trends 2010. In:IFOAM, Bonn, and FiBL, Frick, released at BioFach in Nuremburg. [Available at: http://www.fibl.org.]
Yin, S., Wu, L., Du, L. & Chen, M. (2010). Consumers’ purchase intention of organic food in China, Journal of the Science of Food and Agriculture, 90(8), pp:1361-1367.

Volume 7, No 2, July-December 201750
Abstract Volkswagen adopted strategies to gain market share for its cars manufactured across the world and in bid to overcome competition, the company installed chips to cheat the regulators. The chips effectively hid the emissions from the cars in the laboratories, whereas the same cars emitted carbon dioxide and other pollutants more than the prescribed norms. The scandal shocked the world as the customers of Volkswagen believed in the prowess and quality of the cars made by the German company.
The chief executive resigned and other heads rolled who were alleged to be associated with the scandal and the new chief executive promised the regulators to act in the most transparent manner and also assured the customers that the company would fix the problem of all those cars considered to be tainted with the manipulative chips.
The company took a huge beating from customers and shareholders. The buyers put off buying the company cars and the investors showed thumbs down to the scandal wiping off the market capital of the company. The regulators initiated proceedings against the company all over the world asked the company to come out with the plan to address the emission scandal. The company too started all the measures to ward off long term implications of the scandal and one such measure being the appointment of the new chief executive. After such severe drubbing, the question which remains unanswered is to ‘what next for Volkswagen’?
KeywordsVolkswagen, Emission, Ethics, Trust, Regulator, Market Share, Leadership
The Volkswagen Way, Profits over Sustainability A. Sridhar Raj*
* AssistantProfessor,InstituteofPublicEnterprise,Hyderabadandcanbereachedat:[email protected]
JournalofMarketingVistasISSN 2249-9067 Volume 7, No 2, July-December 2017 pp. 50-59JMV
Introduction“Securing the trust of our customers and that of the public is and will remain of paramount importance to us! We sincerely and deeply
regret that we have abused your trust. We will take care of all your concerns quickest possible……..…. We at Volkswagen will do everything to fully regain the trust so many
Journal of Marketing Vistas
51
people put in us and do all necessary to avert further damage.” - Volkswagen
We have lost trust; the trust of our customers, investors and employees as well as the trust of politicians - Hans Dieter Pötsch, Chairman of the Supervisory Board of Volkswagen AG We are reviewing our structures. We are reviewing our mindset and the way we do things……… We have a clear mission. We want to create a new, better and a stronger Volkswagen – Matthias Muller, CEO of Volkswagen AG.Theworld was shocked. On 3rd September 2015,Volkswagenadmittedtotheallegationthat a cheat device was installed in certain car models to understate the emissions during the laboratory tests. The admissionto theUSEnvironmentalProtectionAgencyshocked the world. The customers whohave been diehard fans of its quality andprecision did not believe it to be true, but it was true. The trust reposed in Volkswagenwas crestfallen. Exactly after 20 days, on23rd September 2015, the chief executiveofficerofVolkswagenAGMartinWinterkornsubmitted his resignation and expressed his dismay and also his unawareness about such the device which could understate the pollutantsfromitscars.23rdSeptember2015,Volkswagenexpressedits apology for violating the trust reposedby the customers and other stakeholders who trusted the company for a long time.The company assured the customers thatthe company would do all those things that wouldregain the trustof thecustomersandexpressed sincere regrets for abusing theirtrust. The resignation of the CEO, MartinWinterkorn, and the appointment of a newCEO, Matthias Muller, was considered tobe the beginning of the clean up act. On 25th September 2015, the new CEO wasbrought in by the Volkswagen Board torestore the customer trust and the new
CEO immediately swung into action whostated that the crisis would be solved in the most transparent manner to win back the customers and also address the issues raised by the regulators.
The problem of trust was not just limitedto Volkswagen and its different variants inGermany or Europe or US, but across theworld.TheimageofVolkswagenasatrustedautomotive company took a serious beating andthetechnologyfromGermanytoocameunder the scanner. Volkswagen promised to takefullresponsibilityandcostsforaddressingtheemissionprobleminmillionsofcarsinthedays to come. However, Volkswagen as acompanyadoredforitsqualitytookaseveredrubbingandreportedon28thOctober2015thatitrecordeditsfirstquarterlynetlossinatleast15years.
On 10th December 2015, Matthias Mulleradmittedtothe‘mindset’problemswithinthecompany and promised the much needed structural changes in Volkswagen. Thequestion was to what extent the changeswould repose the trust among the customers andinvestors.ThequestionbeforeMatthiasMuller was not just addressing the illegal defeatdevicebutwinbackthecustomersinthe days to come.
History of VolkswagenVolkswagen AG is the parent company ofVolkswagen Group which owned iconic brands in car segment including Audi, SKODA, Bentley, Bugatti, Lamborghini,Porsche, Ducati, etc. The VolkswagenGroup was a leading multi-brand group in the automotive sector. The core activitiesof theGroup include developing, producingand selling passenger cars, light commercial vehicles, trucks and buses. The range ofcars include both fuel efficient small carsand luxury cars which is an indication to the point that Group was well established in the
Volume 7, No 2, July-December 201752
automotive sector since its inception in the late 1930s.
The company ‘Volkswagen’was founded inthe year 1937 as a state owned automobile company to manufacture small cars. Thecompany was originally operated by German Labor Front, a Nazi organization and washeadquartered at Wolfsburg, Germany.Effortsweremade tomake carsaccessibletothepeopleataffordableprices.Theinitialattempts to develop small cars to suit the German people did not materialize due to issues pertaining to cost and design.
The beginning of the Second World Warchanged the nature of the company as itstarted producing vehicles for meeting themilitary requirements of the German army.Aftertheendofthewar,effortsweremadebythealliedforcestoresurrectthecompanyformanufacturingcars.Theeffortsdidnotyieldanyfruitfulresultsasnobodywasinterestedintakingtheownershipofthecompanyandrevivethefortunesofthesame,eventhoughthe company was producing cars after theendofthewar.
When, the revival of the company slowlystarted as the war ended, the cars produced by Volkswagen were exported to the American markets. The advertising blitzcoupled with the reliability of the cars ledto gradual acceptance of the cars by theAmericans. In the early 1950s,VolkswagengaineditsfootholdinCanadaaswellbytheyear1955.TheproductionoftheType1carsincreasedoveraperiodoftimeandreachedone million in the same year. This was aremarkableachievementforVolkswagenandby the year 1973 the total production reached 16 million vehicles.
The 1960smarked a historic turnaround ofthe company as it made its inroads into the luxury segment with the acquisition ofAutoUnion and NSU Motorenwerke AG (NSU).Auto Union was acquired in the year 1964
and in the year 1969, NSU MotorenwerkeAG(NSU)wasacquired.Togainthesynergy,both the companies were merged into Audi Company which manufacturedAudi cars inthe luxury segment.
The merger of these companies providedVolkswagen the much needed technical expertisefortheupgradationofitscarsinallthe segments.The influence of themergedentity led Volkswagen to come out with new models like thePassat,Scirocco,Golf, andPolo in1970s.Thiswasanecessity for thecompanygiventhedecliningsalesofType3andType4models.
Volkswagen witnessed tough challenge from its competitors in1980s fromboth theAmerican and the Japanese automobile companies. The sales of Volkswagen carscame down drastically given the competitive nature of both theAmerican and Japanesecompanies. The companies offered similarproducts at much lower prices which directly hitthesalesofVolkswagen.ThecompetitorsgaveVolkswagenarunforthedevelopmentanddeploymentofnewproductsonparwithits competitors and Volkswagen attempted to cater to different market segments byupgradingtheexistingitsmodels.The1990ssawsteadygrowthofthecompanyinUSandEuropewhichcontinued in thenextdecadeaswell.TheglobalsalesofVolkswagenwhichstood at 6.2 million in the year 2007 reached 9.7 million in the year 2013 and crossed 10 million in the year 2014.
The Broken Promises of VolkswagenVolkswagen was not just a new company which was built around the technology era of the 21st century but a strong company which had a history of hits and misses.The company dominated the European carmarketandwasa strongemerging force indevelopingcountrieslikeChina,Brazil,etc,intherecentpast.Thecompanyhadeverything

Journal of Marketing Vistas
53
in its place and there was a high level oftransparencyregardingtheprocessesofthecompany which helped it to come out with iconic brands in the market. The companyhad all those standard practices which helped ittoattainhighlevelsofefficiencyaswellassustainabilityoveralongperiodoftime.
Martin Winterkorn, the former chiefexecutive in one of the speechesstatedthat,“oursuccessisalsofoundin our ongoing willingness to regularly callourownapproachesintoquestionand then break new ground. In this way we have learned that our business is no longer just about technical aspects like horsepower and torque.We have learned that sustainability, environmental protection and social responsibility can be powerful valuedrivers.”
The company was aware of the emergingcompetition from different sources likenew technologies, hybrid cars and electric cars and this in turn raised the levels ofconcern within the company. The companyalready took strides towards addressing the competitionfromvariousquarters.Theseniormanagementtoowasawareofthechangesand initiatives were taken in the form ofdevelopingelectriccars,singleplatformcars,etc.TheyknewthatthemarketwastoughandVolkswagenneededtofindnewopportunitiestofacethecompetition.
MartinWinterkorn,theformerCEOofVolkswagen AG once stated that, “new trends and new technologies ultimately mean one thing: new business opportunities. But competition forfuturemobilityisruthlessandsuccessis never guaranteed, not least because the business environment in which we operateistougherthanever.”
True, Volkswagen mentioned the terms
‘environment’and‘sustainability’oftenintheirSustainability Report 2014. The companywas keen on both the terms but somehow in the race to edge out the competitors, they conveniently sidelined both of them. In thewordsofthecompany,
“We know that growth can only take place hand in hand with responsibility and environmental protection – more than that, in fact: in recent yearsthese factors have become genuinevalue drivers.” “the expansion of theworldwideSUVmarketasthesegmentwiththefastestrelativegrowthrevealsthe scale of the challenges thatevery automaker faces in respect ofcomplianceofCO2”
Apart from the focus on environment andsustainability, Volkswagen focused evenon the compliance of its vendors andadopted all those measures which went on to strengthen the hands of the vendors inthe maintenance of quality and standardsacross all its production units. “We not only apply high standards to our own activities but also demand compliance with these high standards to our own activities but also demand compliance with these standards fromoursuppliers”
All the focussed approach on environment,compliance and precision were pushed into background and the promises made to the regulators, customers and the society at largewere broken to race to the top of thetable.Theobsession tobecome the largestcare maker made Volkswagen to slowly and stealthilybuildchipswhicheffectivelywinkedtheregulators. In fact,Volkswagenreceivedhigh rating of A in the Carbon DisclosureProject in the year 2014 and this rating is given to those orgnaizations which disclose their greenhouse gas emissions in the most transparentandtrustfulmanner.

Volume 7, No 2, July-December 201754
The Fault Line: Strategy 2018 Ferdinand Piech’s – the former chiefexecutive of Volkswagen AG – plan forVolkswagen was to become the world’sbiggestcarmakerbyvolumebytheyear2018– Strategy 2018. The gusto with which thegoal percolated the Volkswagen family wasvisible in the aggressive growth strategies adoptedbythecompanyandexpansionofitsmarket share. In the year 2006, Volkswagen wasfarbehinditsrivalsToyotaandGeneralMotors and in next five years Volkswagentook the lead over both its competitors and almost tookunassailable lead.TheStrategy2018was almost achieved four years earlyand Volkswagen was the winner in the race to become the largest car maker by volume as desired by Ferdinand Piech’s plan – tobecome the world’s biggest carmaker byvolumeby2018.
Volkswagen
2006 2011 2018*
0 2 4 6 8 10 12
Toyota
General Motors
Renault / Nissan
Hyundai / Kia
Ford
Fiat / Chrysler
Peugeot / Citroӫn
Honda
Suzuki
Source: IHS Automotive
Car making groups’ worldwide sales, units, m
*Forecast Excludes SubaruExcludes Wuling
Source: The Economist, 2012
In 2008, Toyota was the market leaderin passenger cars and by the year 2014,
Volkswagen took the lead by reaching 10 million cars and that was possible due to a holisticfocusonefficiencyandtightfinancialcontrols adopted by Volkswagen. Given the toughcompetitionfromtherivals,Volkswagenwas forced to overhaul its manufacturingprocessesforincreasingitsefficiencyononehandandalsoproducelargenumberofunitsin its production centers.
One such strategy was MQB – a systemfor introducing rationality across disparateplatforms that share engine orientation –regardless of model, vehicle size or brand,which helped the company to increase its efficiencylevelsbutalsoraisetheproductionofitsunits.VolkswagenequippedwithMQBwas now able to produce different brandson a single platform which resulted in thehugebenefitofspeedingthenumberofcarsin all its production centers. In a nutshell, Volkswagen was producing more cars in its production centers. This provided thecompany to expand its market share in the shortest possible time.
The idea of having a shared platform forits different brands was highly appreciatedby the experts as it not only improved the efficiency of the cars but also helped thecompany to invest its precious money in expanding its brand and also production centers.However,whatwasnotappreciatedin the race to reach the top position was its cheatchip,implantedinEA189engines–tohoodwink the regulators – and the company facedbiggestbacklashinitshistoryofnearlyeight decades.
The chief executive officer of VolkswagenMartin Winterkorn resigned and expressed apologies for thescandalandmade itclearthat he was not aware of the happenings.However, some of the engineers of thecompany admitted to the rigging of theengine and implanting the chips to deceive

Journal of Marketing Vistas
55
the regulatorsand thecustomers fora longtime.
How did Volkswagen known for its qualitylandeditselfinamessthatdenteditsimageto the core?
The answer lay in the goal of becoming the largest car maker by the year 2018 – Strategy 2018.
Thecompetitionbetweenthecarmakershasbeeninexistencesincelongtime.Thefocustowardsconqueringmoreandmoremarketsand reach the table top led to whole series of unsavory practices. The car companiesfoughtonthebasisoftheirproductstrengthandtoalargeextentthedisinclinationoftheAmericans in specificandothers ingeneraltowards the diesel engines made Volkswagen to think about anything which could provide powerful cars with minimum emissions asprescribed by the regulators. Volkswagen did notenjoythesupportofthecustomersasitsmarket share hovered around 2-4 percent which was very less considering market leaders like Toyota, GM, etc, whereas asVolkswagen enjoyed dominant position in Europeanda reasonableposition inChina,oneoftheemergingmarkets.
The increasing usage of technology andelectronics in the passenger car sector, the manufacturers introduced dozens of chipsfor addressing various issues pertaining todriving,safety,enginemanagement,braking,lighting, etc. That apart, the pressure wasbuildingon thecarmanufacturers regardingfuel efficiency and pollution control. WhatVolkswagen did was to introduce chips in thoseareaswhich theemissiondataof thecar was covered up during the laboratory tests which the regulators could not detect.
The electronic chips which were usedto regulate various engine management processeswereeffectivelyinfectedwiththosechips which dodged the laboratory testing and Volkswagen passed the regulator’stest in termsofemissionnormsandrelatedcompliance.
Since the year 2009, it was alleged that Volkswagen started implanting these chips which,basedfunctionedonthemovementofthe steering wheel, accelerator, brakes etc, and enabled the car to distinguish between laboratory testingand roaddriving.The carautomatically turned on its pollution controls on and once the car knew that it was not beingtested, thepollutioncontrolswereoff.When the lid blew over the scandal, the world was shocked, including the CEO, MartinWinterkorn.
“Iamshockedbytheeventsofthepastfewdays,” the former CEO, Martin Winterkornsaid. “I am stunned that misconduct on such a scale was possible in the Volkswagen Group.”
The US Market: The Acid Test for Volkswagen The market share of Volkswagen was justtwo percent in theUnitedStates and giventhesizeofitsmarket,thecompanywantedtogarnerthelargerpieinthequickestpossibletimeandtheStrategy2018wasthebeacon.Given the penchant of the Americans forthe Japanese cars and their disinclination towards the diesel cars put Volkswagen at the bottomof themarket.Thecompanywantedto do something to dislodge the Japanese cars from top slots and looked to triple itsmarket share to six percent.

Volume 7, No 2, July-December 201756
TheGermansweregamblingwithwhateverthey had to reach the top of the table andtheyhaddieselcars.Butthedisinclinationofthe Americans towards diesel engines which were considered heavy polluters did not cut much ice with the Americans and coupled with the tight regulations regarding the emission norms, complicated the situation all themoreforthecompany.
VolkswagenwasadominantforceinEuropeand also in emerging countries like China but the US always remained an elusiveplace for Volkswagen due to its strongcompetitors - GM, Ford and Chrysler. TheAmericans wanted to have those cars which couldprovidebetteraccelerator (speedandpickup) and alsomeet the emission norms.TheStrategy2018washangingaround theneckof thecompany tobecomethe largestcarmakerintheworld.LeavingtheUSwouldhavesoundedemptyforthecompany,eventhough they reached the top car maker slot inotherpartsoftheworld.TheAmericancarmarketwasanacid test forVolkswagenasthat gave the car manufacturers the muchneeded ‘psychological advantage’ over thecompetitors.
Result. Electronic chips were implanted incertainengines toovercome the regulator’stestinthelaboratory.ThishelpedVolkswagentotoreachthetopslotofthetable,becomingthe largest car maker in the year 2014. However, when the regulators found thediscrepancy in the emission levels of thecars inside and outside the laboratory, the company had no choice but to accept the cheatchip.Headsrolled.Trusttookabeating.Thestockstumbled.Theregulatorstookthedriving seat.
The Global Impact of the Scandal The emission scandal took a heavy toolforVolkswagengiven the lossof lead to itscompetitorsasjustwithinafortnightafterthescandal hit the headlines, the overall sales ofVolkswagendipped.This inturnprovidedspace for its competitors like Toyota whichzoomed past the sales and pushed down Volkswagen and claimed top position by the endofSeptember2015.
On27thOctober 2015,Toyota claimed thatit sold 7.49 million vehicles by the end ofSeptember, whereas Volkswagen could sell 7.43million.TheproblemforVolkswagendidnotendhereasthedemandfromthebiggestemerging market, Chinese slowdown, too has ledtothedeclineofthesales.Thechallengenow for the company became bigger andlarger: the trust of the customers acrossthe world took a beating and the emerging markets slowed down.
The defeat device which was introducedin the cars manufactured by Volkswagenallowed the vehicles to pass the emission control tests and in reality, they emitted more number of pollutants. The problem becamemoreseverewithmoreandmorenumberofcarsinEuropealsocameunderthescanneroftheregulators.
Theelevenmillioncars,astaggeringnumberhitbytheemissionscandal,intheUSwasabigjotforthecompany.Theregulatorsapart,thefixationproblemitselfpulleddowntheimageofthecompany.Thefinancialimplicationsforthefixationoftheproblemfurtheralteredthedecision focusandprioritiesofVolkswagen.Thecompanyallocatedbillionsofdollars tofixupthevehiclesononehandandalsomeetthe obligatory penalties from the regulators
Journal of Marketing Vistas
57
across those countries where the defeatdevice was detected.
Thecompanyadmittedthatitoverstatedthefuelefficiencyofitscarsandunderstateditsemissions forcing thecompany toputaside8.7 billion Euros for covering up the repaircosts. The issue did not stop at the costlevel but percolated to the trust level of thecustomer and the regulators.
The overall impact of the scandal onVolkswagen was immense given the amount of trust the customers had in the companyand they were shocked as they never expected that a German company would install chips to overcome the regulatory norms. The company immediately startedthe cleaning act, but it was too late given the colossaldamagethecompanysufferedinthehandsofthecustomersandtheregulators.Infact,thesalesofthecompanygotabeatingas the customers adopted the ‘hands off’approach and the Volkswagen cars sales took a beating.
• The Volkswagen shares have taken abeatingbyalmostaquarterandwipedoutthefortuneofthecompanybymorethana25BillionEuros.
• Thecrisiswasmore thanadent for theGermany car makers known for theirprowess, quality and precision. In fact,other carmakers ofGermany too cameunder the regulatory scanner, albeit, they were not indicted for suchmanipulation.Nevertheless, the scandal was not just a dentonVolkswagenbutahugelossofitsimageinthenearfuture.
• More than thecar industry, the imageofGermanyas,thecitadelofquality,tooka
seriousbeating in theeyesof the largerclientele of the world. The Kraftfahrt-Bundesamt(KBA),theGermanregulatorstarted investigations into the emission violationoftheVolkswagencars.
• Theinvestorswereshakentothecoreasthey never expected that Volkswagen had resorted to such a tactics to gain market share.
• The environmentalists were highlymiffedwiththefact thatVolkswagenhadcheated the entire mankind and threw environmental concerns into thin air.
• Thecompanywasledintoaquagmireasthenextquestionwashowtoregaintrustand win back customers and regaining the trust was the biggest challenge forVolkswageninthenextfewyears.
• Thescandalalso forced thecompany tore-prioritize its activities as it got involved inrefittingtheenginesandalsofacingtheregulators across the world, wherever the tainted engines were sold
Implications in India TheAutomotiveResearchAssociation(ARAI)in India started looking into the emission status ofcertaincategoryofvehiclesofVolkswagenAG – Volkswagen Jetta, Skoda, Octavia,Audi A4 and Audi A6. ARAI wanted to make surethat theviolationofemissionnormsbyVolkswagen AG was limited to certain models or across the products of the company, butinitially limited its focusononlycertainhighendvariantsofthecompany.ARAIissuedashow case notice to Volkswagen AG given thehighlevelofsuspicionsraisedinthelightoffloutingofemissionnorms.

Volume 7, No 2, July-December 201758
The show case was intended to find outwhether the company resorted to emission violation in India as it did in other countries, particularlyintheUS.ARAIwasworriedoverthefactthat314000carswerefittedwiththesameengine–EA189–thetaintedengine.Thiswas theenginewhichcameunder thescanner in theUSand theARAIwanted toensure that these engines were not tinkered withthecheatsoftware.
The impact of the global emission scandalledtothedeclineofthesalesofVolkswagencars in themonth of September 2015 aftershowing consistent growth for a period ofsevenmonthswhichpointedtothefact thatVolkswagen was indeed in trouble in markets like India. The customers’ confidence andtrust in Volkswagen took a beating with the emission scandal, resulting in a dip in the salesofitscarsinIndia.
On 29th October 2015, the officials ofVolkswagen India met the officials of theMinistry ofHeavy Industries toexplain theirversion and stated that they were committed to help the government in the probe into emission issues arising out of the globalscandal. The officials of the company alsoexplained to the government they would come out with the detailed report about the all thebrandsinIndiabytheendofNovember2015.
The New Dawn: What Next? The new chief executive officer, MatthiasMuller hinted at the cut backs in terms ofinvestmentsandalsonumberofemployees.However,thatwasnothispriorityashewassaddledwith the responsibility of wiping offthestigmaofVolkswagen–beingascandalhit company and also cheating the customers.
Hehintedout to the fact thatwhatwasnotimportant will be scrapped and admitted that the most important thing was to restore the trustof thecustomersononehandandaddress the issues raised by the regulators on the other hand.
“My most pressing task will be to restore confidence in the VolkswagenGroup- through an unsparing investigation and maximum transparency, but also bydrawingtheright lessonsfromthecurrentsituation,”MatthiasMullersaid.He further said, “Volkswagen undermyleadershipwillmakeeveryefforttodevelop the most rigorous compliance and governance standards in the entire industryandtoimplementthem.”
Matthias Muller was keen to be more open with the regulators and the customers given the scale of the scandal, but the Mulleralso was the head of Volkswagen’s luxurysports-car brand Porsche, when the scandal broke out. Although he was considered as non-tainted, questions were raised aboutthe Muller’s ability to gain the ground lostby Volkswagen as he had been with the companyforthelastthirtyyears.
What next for the company in terms ofproduct line?
Industry experts foresee focus on hybridtechnology and Volkswagen itself focusedon such technologies in the past. Given the climatic focus of the governments all overthe world and the emission scandal that rocked the automotive world, the automotive companieslikeToyota,GM,etc,havealreadytaken a lead I the development of hybridtechnologies. Will Volkswagen the hybrid way?

Journal of Marketing Vistas
59
Before the hybrid way, to what extentVolkswagen will regain the trust of thecustomersandcomplywiththedirectionsoftheregulatorsisthebiggestquestion?
References Emission ghost haunts Volkswagen in India,
Business Standard, 30th October 2015
Emissions, probe set to cover more car makers, Livemint, 6th November 2015, Volkswagen India sales down after 7 months of growth, Business Standard, 5th October 2015
Emission scandal seen as a threat by new chairman, Business Standard, 5th October 2015
ht tp : / /www.cnbc .com/2015/12/10/vw-chairman-main-challenge-is-to-win-back-trust.html
h t tp : / /www.f t . com/ fas t f t /2015 /12 /10 /volkswagen-emission-scandal-a-timeline/
http://volkswagen.gomexlive.com/vw_live_ag/?lang=en
https://en.wikipedia.org/wiki/Volkswagen
Sustainability Report 2014, Volkswagen AG
The Volkswagen Group Code of Conduct
VW conquers the world, The Economist, 7th July 2012
VW sales growth stalls in Europe, Livemint, 16th December 2015
VW scandal could accelerate shift to hybrid cars, Livemint, 30th October 2015

Volume 7, No 2, July-December 201760
Luxury Fashion Goods and Sustainable Consumption BehaviourV. Shilpa1 C. Madhavaiah2
Abstract
While the entire world is talking about sustainability as the new mantra to show the individual responsibility towards environment and consumption of goods or services, it is often considered that sustainability and luxury consumption never coincide. This paper intends to understand the sustainable consumption behavior of consumers when they buy, consume, and dispose the luxury fashion products. Extant literature has highlighted social, economic, and environmental and style consciousness as major dimensions of the sustainable consumption behavior and their impact was ascertained using CFA and SEM. The results show that the social and environmental consciousness has high impact on the sustainable consumption behavior at levels for luxury fashion product. The items related to the dimensions were adopted from previous validated studies & altered according the need of the study.
KeywordsLuxury Fashion, Sustainable Consumption Behavior, Social Learning Theory
1 DoctoralResearchScholar,PondicherryUniversityKaraikal,Pondicherryandcanbereachedat:[email protected]
2 AssistantProfessorPondicherryUniversity,Karaikal,Pondicherryandcanbereachedat:
JournalofMarketingVistasISSN 2249-9067 Volume 7, No 2, July-December 2017 pp. 60-66JMV
IntroductionDuring the last decade, in various public debates and particularly in the media unsustainable consumption in developing countriesistreatedasamajorconcern.Thefocus is mainly on what is called ‘the newmiddleclass’.Sustainabilityinluxuryfashion
isoneoftomorrow’smostimportantfocusesbut is not yet practiced in the industry, neither fromthesideofthebusinessorthecustomer.Eventhoughcustomers’statementsindicatean interest of sustainable fashion, but itis not reflected in their behaviour towardssustainable luxury fashion products, which

Journal of Marketing Vistas
61
in turncanmakesustainable luxury fashionseen as a risky buying option.
Thesustainableconsumptionisconceptfromthe famous 3P (people – planet – profit) ortriplebottomline(TBL)approachofElkington(1998). The TBL explains that ‘Enterprise’sultimate success or growth can and should be measurednotjustbythetraditionalfinancialangle,butalsoby itsperformance insocial/ethical andangle’ (NormanandMacDonald2004:243).
Luxuryfashionhasturnedusersintopassiveconsumers who are constantly chasing fantasy.Thesustainabilityeffortisdrivenby,and aims to achieve, the goal of benefitingbothpeopleandplanet.Thus,whilethefocusofthispaperisonsustainableluxuryfashion,the discussion can also be relevant to the socialcomponentofTBL.
Sustainable or responsible consumption is concerned with the satisfaction of personalneeds without an adverse impact on the lives andconsumption rateofpresentand futuregenerationsandcompliesthereforewiththeprinciples of sustainability (Prothero et. al., 2011).
Luxuryconsumersarecurrentlyinatransitionto a new typeof fashion industry basedonecologicalandholisticprinciplesofclosingtheloop that prioritises community and values in society.Theimportanceofsustainabilityhasgrown significantly; the redefined businessapproaches and contemporary business solutions to create sustainable competitive advantage can encourage luxury brands to promote “Sustainable Luxury” concept(Kapferer,2012).Luxuryconsumer’s valuesareevolvingfrom‘thinking’to‘practising’from‘Outward’to‘inward’andfrom‘Perceptible’to‘Earnest’(E.Sandig,2015).
True luxury is often about reconnectingwith individual’s soul to reflect on choices
consumers make that can leave a happy or a negative imprints on the world. Fashion that is sold on logo, style or glamour may seen incomplete to the luxury consumers today. The fashion industry is evolving to becomeconsiuos industry that has low carbon footprint while respecting the ecosystem. People are starting to think about the values and ideas an outfit can represent for the planetand its people. Luxury and sustainabilityboth share a common thread as they have common objective, they both emphasise on quality, timelessness and durability. Luxuryhas been comprehended as non-essential, wishful goods that gesticulates one’s socialclass and affluence to others. Luxury hastwo features:exclusivityand rarity.Tobe inniche category, a luxury product should be exuberant,exceptionalquality,with reducedecological footprints,andhaveconsiderablebenefitstosociety.Althoughitisadvocatedtoaffiliateluxuryproductswithsustainabletraits,therewasageneralopinionthatconsumer’sintentionisdifferentthantheactualbehaviourwith respect to luxury fashion productsconsumption(Joyet. al.,2012).
Review of LiteratureSocial psychology has demonstrated that not all attitudes transform into behaviour.In particular, despite concern towards the environment consumers fail to purchasesustainable products (Gupta and Ogden,2009).
(HU Biling et. al., 2010) has designed andvalidated the sustainable consumption behaviour scale with six dimensions of 23items all the items were measuring the general sustainable consumption behaviour of consumer. C. Bianchi and G. Birtwistle(2010)explainedhowconsumersinScotland&Australiadisposethefashionclothingaftertheir use.
Volume 7, No 2, July-December 201762
Balderjahn et.al. (2013), have studied theconsciousness for sustainable consumption(CSC)byapplyingEnvironmental,SocialandEconomicdimensionsofsustainability.
(Moscardo, G., & Benckendorff, P. 2010)have explored sustainable luxury in the contextof tourismand found that theseareno strong link between luxury tourism and sustainability.Verma.S(2014)hasattemptedto investigate source of influences andmarketing initiatives that help to establish sustainable consumption behaviour.
NasreenandPooja(2015),madeanattempttounderstandtheroleofgenderininfluencingsustainable consumption behaviour among UAEconsumers.
Annamma Joy et. al.,(2012)haveconcludedthat youngsters separate the fast fashion,luxuryandsustainability.Hefurtherexploresthat the respondents are in favour of theconcept of sustainability but will not exhibitin actual behaviour while consuming luxury fashiongoods.
Kapferer(2012)opinesthatluxurybrandsareresponding to the demand for sustainabilitybut have not taken many initiatives to communicate this change.
Past research has shown that consumers are more likely to reveal all non-sustainable issues iin luxury and hence more inclined to see an inconsistency. In addition, acting as per the standards of sustainable advancementsignals a capacity to ace utilization and apply control, conversely with the embodiment ofextravagance, for which abundance is vital(for instance,overabundance inventiveness,materials,detail,comfort,execution).
Based on the literatures reviewed, it isevident that both the brands and consumers are aware that the sustainability is the agendaoftheworld.Thebrandshavestarted
implementing the sustainable factors in theproducts and consumers have shown mixed responses towards sustainable consumption behaviour while consuming various goods &services.Aftercarefulanalysisofexistingliteratureswecouldinferthattherewereverylimited studies to explain the sustainable consumptionbehaviourinthecaseofLuxuryfashiongoods.
Objectives and Hypotheses• To know the key elements of Social,
Economic and Environmental thatinfluencesustainableconsumerbehaviour
• To ascertain the impact of variousdimensions those facilitate or inhibitsustainable consumption behaviour
• To understand the actual sustainableconsumer behaviour
Followinghypothesesareframedfor testingthe various relationships:H1 Environmental consciousness will have
positive impact on SCB towards luxuryconsumption behaviour.
H2 Social consciousness will have positive impact on SCB towards luxuryconsumption behaviour.
H3Economical consciousness will havepositive impact on SCB towards luxuryconsumption behaviour.
H4 Style consciousness will have negative impact on SCB towards luxuryconsumption behaviour.
Research MethodologyConceptual Framework SocialLearningTheory(SLT)isacategoryoflearningtheorieswhichbuiltonthebeliefthathuman behaviour is ascertained by a three-way relationship between cognitive factors,environmental influences, and behaviour.AccordingtoAlbertBandura,“Sociallearning

Journal of Marketing Vistas
63
theory provides explanation for humanbehaviourintermsofacontinuousreciprocalinteraction between cognitive, behavioural, and environmental determinants” (SocialLearningTheory,1977).
It mentions that people rely on status conferring symbols (speech, dress andpossessions)thatserveastangibleindicantsof their past success. Core values, needs,tastes,priorities,self-concept,mindsetsandaspirations define our world view and areusually less varied in a generation.
SLT explains that oneway tomake people
interested in sustainable consumption might be through modeling, which is a form ofvicarious learning whereby people observe a real-lifeorsymbolicmodelandreplicatetheiractions, attributes, behaviour and emotional responses. Indeed, people also acquireattitude, emotional responses, and new styles of conduct though filmand televisionmodeling(Bandura1977).
In the past the SLT explained conceptof behavioral contagion and gave theimportanceofprestigeandforceitexertsonpeople. Researchers in past demonstrated thisinanexperimentexplainingtheinfluence
Table-1: Statistics of Measurement Model
Measurement construct Standardized Loading
Construct Reliability
Environmental ConsciousnessI do not purchase those products which may cause damage to the environment .860 .863I have purchased products because they cause less pollution .810IwillbuytheLuxuryfashionproductsifitcanbedisposedinaneco-friendlyway
.797
Iwillbuytheluxuryproductifispackagedinaneco-friendlyway .843IwillbuyLuxuryproductproducedinaeco-friendlymanner .800Social ConsciousnessIwillconsiderpurchasingLuxuryproductsfromcompanieswhosharetheprofitstosocialresponsibilityacts
.720 .782
Idon’tbuyLuxuryproductsfromcompaniesengagedinalabourdispute .810IwillpurchaseLuxuryproductwhentheycommunicatethattheyadheringtominimumstandardsforworkers’healthandsafety
.797
IWillbuytheLuxuryproductwhentheycommunicatethattheirlabourersarefairlycompensated
.760
EconomicalConsciousnessIamabletojustifythepurchaseofLuxuryproductaseconomical .810 .790I will buy the luxury product when it is necessary .720I will buy a luxury product which is highly durable .750Idon’twanttosharetheluxuryproductwithothers .818Style Consciousness Iwillbuyluxuryproduct,whichmatchesmyself .790 .873Iliketobuyluxuryproductthatspeaksoutmypreferences .890Iwillbuyluxuryproductstocreatemyownuniquestyle .896I will buy luxury products which are trendy and latest .910

Volume 7, No 2, July-December 201764
of prestige further with phenomena, whichwas considered high status. But when thesame phenomena adorning non status very fewpeoplefollowedit
Applying thepracticeofSLT to theconceptof luxury fashion purchase, the variousdimensions of Sustainable consumptionbehaviour were identified and their impacton the behaviour was ascertained. Figure 1 illustrates the proposed relationships.
Sampling and Data CollectionRespondents were qualified by asking toname one luxury brand that they bought latestAmong 152workable responses, 125selected apparels and 27 selected shoulder bagsorsuitcases.Respondents’belongedto
rangeof18to58years,withaverageof31.Themaximumnumbersofrespondentswerefemale (74.3%).Family incomewas spreadout with the median income of Rs.60,000-Rs.1,00,000.
Analysis and InterpretationTheitemsforconstructswereborrowedfromexisting sustainable consumption behaviour scale.5-pointLikert-typescalewasused tomeasure the items (1 = strongly disagree,5 = strongly agree). The items for StyleConsciousnesswereadaptedfromTai(2005).The items for environmental consciousnesswereadapted fromChoet.al (2015).Socialconsciousnesswas adapted fromChoet.al (2015).
Table-2: Average Variance extracted and Discriminant Validity
ConstructsEnvironmentalConsciousness .570Social Consciousness .358 .751EconomicalConsciousness .339 .584 .614Style Consciousness .416 .481 .242 .732SustainableLuxuryConsumptionBehavior .465 .500 .230 .621 .758
Table-3: Hypotheses Testing Results
Hypothesis Structural pathsEstimate
(standardized (estimate)
Standard error t-value
H1 EnvironmentalConsciousness SustainableconsumptionBehaviourtowardsLuxuryproducts
.634 .068 9.321***
H2 Social Consciousness Sustainable consumptionBehaviourtowardsLuxuryproducts
.601 .072 2.180
H3 EconomicalConsciousness SustainableconsumptionBehaviourtowardsLuxuryproducts
.582 .065 10.140***
H4 Style Consciousness Sustainable consumptionBehaviourtowardsLuxuryproducts
.668 .041 13.419***

Journal of Marketing Vistas
65
Based on the similar studies (Hair,Black, Babin, & Anderson, 2009) to testthe hypothesized paths, Confirmatoryfactor analysis was used to validate themeasurement model. Maximum-likelihood method was used to estimate the parameters. Comparativefitindex(CFI)andNon-Normedfitindex(NNFI)androotmeansquareerrorofapproximationwasusedformodelfit.
Goodfitof thedatawasachievedwithCFAresults:χ²(620)=1988.451,CFI=.976,NNFI=0.971, RMSEA = .070. Construct validitywas confirmed by both construct reliabilityvalues and average variance extracted (AVE) of the latent constructs ranging from0.782 to 0.873, above the threshold of .70,and 0.570 to 0.751 above the threshold of0.50 respectively. Discriminant validity wassatisfactory, asAverage Variance extractedwere larger than the shared variances (i.e.,squaredcorrelationcoefficients)betweenallpossiblepairsofconstructs.
Thestructuralmodelprovidedasatisfactorymodel fit: χ2 (638)=2102.139,CFI= .957,NNFI = .969, RMSEA = .070. As depictedin Table 3, SCB was positively influencedbyEnvironmentalConsciousness(β= .634, p<.001)andsocialconsciousness(β=.601,p < .05) supporting H1 and H2. SCB wasinfluenced by Economical Consciousnessand(β=.582,p<.05),styleconsciousnesswas negate vely influenced (β= .668, p<.001),supportingH3andH4.
ConclusionIn this article we have observed the various dimensions of sustainability and its impacton the Sustainable consumption behavior towards the luxury fashion products. Thedata suggests that consumers have negative SCBwhen they are style conscious.BoniniandOppenheim(2008)arguethatultimatelysustainable fashion is about values andconsumers have to decide what they value.
When it comes to buying sustainable goods, wordsanddeedsoftenpartways.
Theluxurymarketersshallmakethedesignto be satisfactory and stylish, they need tocreate trust by showing transparent and honest actions throughout the supply chains, research in new technologies are requiredand for thecustomers, knowledgeneeds tobeprovidedandthemeaningofsustainablefashionhastochange
The luxury fashion products have seendramatic changes in adopting many sustainable practices. To initiate theresponsible luxury consumption behavior the marketers shall consider the differentdimensionsofSCB.
References
Annamma Joy (2012). Fast Fashion, Sustainability, and the Ethical Appeal of Luxury Brands, Fashion Theory,16(3), pp:273-295.
Balderjahn et. al., (2013). Consciousness for sustainable consumption: scale development and new insights in the economic dimension of consumers’ sustainability, Academy of Marketing Sciences, 3, pp:181-192.
Bandura, A. (1977). Social learning theory. Englewood Cliffs, N.J: Prentice Hall.
Bonini, S. & J. Oppenheim. (2008). Cultivating the Green Consumer, Stanford Social Innovation Review, Fall, pp: 56-61.
Cho, E., Gupta, S. & Kim, Y. K. (2015). Style consumption: Its drivers and role in sustainable apparel consumption, International Journal of Consumer Studies, 39(6), pp:661-669
Constanza Bianchi & Grete Birtwistle (2010). Sell, give away, or donate: an exploratory study of fashion clothing disposal behaviour

Volume 7, No 2, July-December 201766
in two countries, The International Review of Retail, Distribution and Consumer Research, 20(3), pp:353-368.
E. Sandig. (2015). Luxury and Sustainability: A Paradox on the Road towards Convergence. Media & Business. [Available at: http://hdl.handle.net/2105/32648].
East, R. et. al.,(1995)Correlatesoffirst-brandloyalty, Journal of Marketing Management, 11(5).
Elkington, J. (1998). Cannibals With Forks: The Triple Bottom Line of 21st Century Business, Stony Creek, CT: New Society Publishers.
Feltham, T. (1998). Leaving Home: Brand Purchase Influences on Young Adults,Journal of Consumer Marketing, 15(4), pp: 372-385.
Gupta, S. & Ogden, D.T. (2009). To buy or not to buy? A social dilemma perspective on green buying, Journal of Consumer Marketing, 26(6), pp: 376-391.
HU Biling et. al., (2010). An Empirical Study of Sustainable Consumption Behavior Among Residents in Changsha.
Joergens, C. (2006). Ethical fashion: myth or future trend?, Journal of Fashion Marketing and Management: An International Journal, 10(3), P.369.
Joy, A., Sherry, J.F., Jr, Venkatesh, A., Wang, J., & Chan, R. (2012). Fast fashion, sustainability, and the ethical appeal of luxury brands. Fashion Theory, 16(3), pp:273-295.
Kapferer, J.N. (2012). All That Glitters is not Green: the Challenge of Sustainable Luxury,
The European Business Review. Management Journal, 23(2), P. 134.
Moscardo, G., & Benckendorff, P. (2010). Sustainable luxury: oxymoron or comfortable bedfellows?. In: Proceedings of Global Sustainable Tourism Conference. Global Sustainable Tourism, pp: 709-728.
Nasreen Khan & Pooja Trivedi (2015). Gender Differences And Sustainable Consumption Behavior, British Journal of Marketing Studies, 3(3), pp: 29-35, April 2015 Published by European Centre for Research Training and Development UK.
Norman, W. & C. MacDonald (2004). Getting to the Bottom of “Triple Bottom Line, Business Ethics Quarterly, 14(2), pp: 243-62.
Prothero, A et. al., (2011). Sustainable consumption: Opportunities for consumer research and public policy, Journal of Public Policy & Marketing, 30(1), pp: 31-38.
Sanyal, S.N., Datta, S.K. & Banerjee, A.K. (2014). Attitude of Indian consumers towards luxury brand purchase: an application of ‘attitude scale to luxury items, Int. J. Indian Culture and Business Management, 9(3), pp: 316-339.
Tai, S. H. (2005). Shopping styles of working Chinese females, Journal of Retailing and Consumer Services, 12(3), pp: 191-203.
Verma, S. (2014). Psychological interventions in promoting sustainable consumption behaviour: an empirical study, Int. J. Business Innovation and Research, 8(4), pp:373-384.
67
The Journal of Institute of Public Enterprise (ISSN0971-1836)istheflagshipjournalofIPEandisdevotedtopublicationofprofessionalandacademic research on the policy and functional facets of public sectorenterprises and public systems in India and across the world. Studies on thegrowth,working,performance,contributions,problemsandalternatemodelsofpublicpolicyandenterprisesformthecoreofthejournal.
Journal of Economic Policy and Research (ISSN0975-8577)providesaplatformfordiscussionandexchangeoffindingsacrossthebroadestspectrum of scholarly opinion to stimulate theoretical, empirical andcomparativestudiesinthecontextofeconomicpolicyandresearchbothinIndiaandabroad.Differentaspectsofeconomicpolicyanditsimplicationsonthedifferentsectorsoftheeconomyandthecountryingeneral,arethemain areas covered in this journal.
IPE Journals The Institute of Public Enterprise (IPE), Hyderabad is a non-profit educational societyestablished in 1964. It is devoted to Education, Training, Research and Consultancyfor business enterprises in the public and private sector. IPE is one of India’s premierB-schoolsandisrecognizedasa‘CentreofExcellence’fordoctoralstudiesbytheIndianCouncilofSocialScienceResearch(ICSSR),MinistryofHumanResourceDevelopment,GovernmentofIndia.IPEhasmanypremierpublicationswhichincludebooks,journals,research publications, monographs, working papers, bulletins, etc.
The followingare thebi-annual journalspublishedby the Institute.Thecontributions tothese journalsareofa researchnatureandmainlycome fromacademicians, researchscholars,practitioners,policymakersandotherprofessionals.
Indian Journal of Corporate Governance (ISSN0974-6862)providesa forum for discussion and exchange of views by the policy makers,practitioners and academicians on issues of Corporate Governance.It attempts to focus on both Indian andGlobal CorporateGovernanceissuesincludingBoardPractices,RoleofIndependentDirectors,EthicalIssuesandEmergingTrendsinCorporateGovernance.

Journal of Marketing Vistas (ISSN 2249-9067) provides a platformto marketing professionals from academia and the corporate world toexchangeinformationandresearchonemergingmarketingpracticesandtheories across industries around the globe. Articles in the journal cover diverse areas like Strategic Marketing, Promotion Management, New Product Management, Pricing Decisions, Product-Line Management,Competitive Strategy, Buyer Behavior, Marketing Research, MarketInformation System, International Marketing, Services Marketing,SegmentationTargetingandPositioning,SalesForceManagement,RetailManagement, Customer Relationship Management, and e-Marketing.
IPE Journal of Management (ISSN 2249-9040) aims to provide aplatformforresearchers,practitioners,policy-makers,academiciansandprofessionalsfromdiversedomainsofmanagementtoshareinnovativeresearch achievements and practical experiences in the development andemergingtrendsinmanagementscienceanddecision-making.ThefocusareasincludeHRM,FinancialManagement,OperationalPractices,OrganizationalStructures,CorporateStrategies&PracticesandissuesofCorporate Social Responsibility.
Journal of Governance & Public Policy (ISSN 2231-0924) providesa forum for discussion andexchangeof ideasongovernance (local toglobal) and the making and implementation of public policy (includingforeignpolicy) issues.ItmainlycoversareasrelatedtoIndiaandSouthAsia, though governance and public policy issues in other parts of theworld are also discussed. The scope of the journal extends to topicalissues like corruption, transparency, accountability, delivery of goods&services, Public Private Participation and new public management, etc.
Journal of International Economics (ISSN0976-0792)aimstopublisharticles/researchpapers/casestudiesinall theareasofInternationalEconomics like Trade theories and models, Comparative Economics,TradePolicy,Patternsandtraderelations,BalanceofPayments,ExchangeRateMechanismsandForeignexchange,TradeOrganizations/Bodies/ Blocs, International Capital Flows, Multilateral Treaties, MultinationalCorporations, International Monetary Systems and Relations, International LabourMobility,etc.
Volume 7, No 2, July-December 201768

COMMON SUBSCRIPTION FORMToThePublicationsDivision,InstituteofPublicEnterprise,OUCampus,Hyderabad-500007Telangana,India.
Dear Sir / Madam,I/WewishtosubscribeforthefollowingJournal(s)for_______year(s)from__________to__________.
S. No. Journal Title
Annual Subscription Rates Put a Tick
(√) for Selection
For India For other Countries
Individuals Academic Libraries Corporates Foreign
Subscribers (US$)
1 JournalofEconomicPolicy&Research 1500/- 2000/- 3000/- 2002 JournalofInternationalEconomics 1500/- 2000/- 3000/- 2003 JournalofMarketingVistas 1500/- 2000/- 3000/- 2004 TheJournalofInstituteofPublicEnterprise 1500/- 2000/- 3000/- 2005 JournalofGovernance&PublicPolicy 1500/- 2000/- 3000/- 2006 IPEJournalofManagement 1500/- 2000/- 3000/- 200
Pleasefindenclosedherewitha Demand Draft/Cheque,bearingNo._____________drawnonBank
_______________________________ dated _______________for Rs/US$. __________________
(Inwords)____________________________________________________________drawninfavourof
“Institute of Public Enterprise”,payableatHyderabad.Pleaseeffectthesubscriptionfromnextissueonwards.
NamesoftheJournalsforwhichsubscriptionis sent:
1.______________________________________ 2._____________________________________
3.______________________________________ 4._____________________________________
5.______________________________________ 6._____________________________________
Journal Dispatch Address:
Name of the Individual / Organization __________________________________________________
Address __________________________________________________________________________
City__________________Pin_____________Country______________Ph.No.________________
MobileNo.________________________E-mailId________________________________________
Signature: Office Seal:
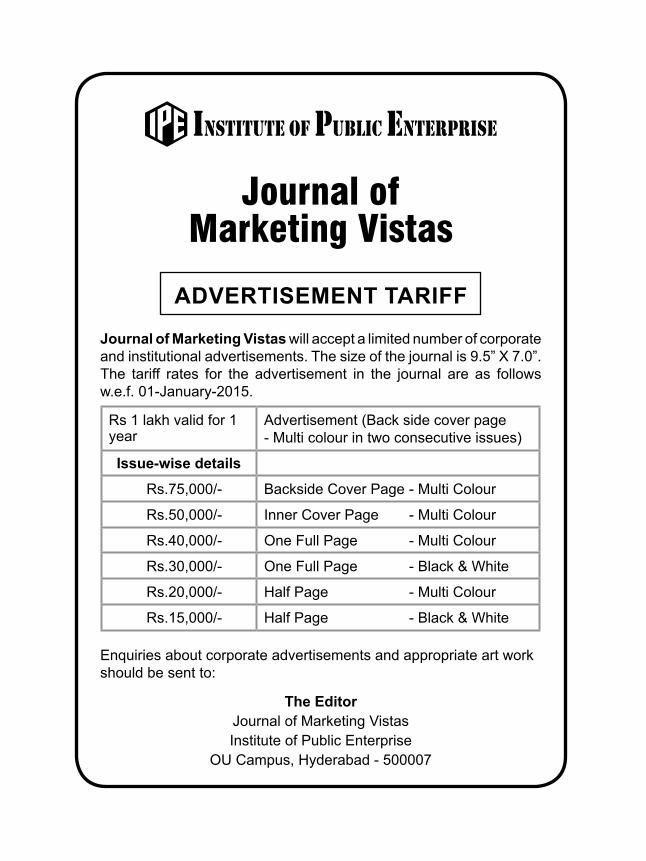
ADVERTISEMENT TARIFFJournal of Marketing Vistaswillacceptalimitednumberofcorporateandinstitutionaladvertisements.Thesizeofthejournalis9.5”X7.0”.The tariff rates for the advertisement in the journal are as followsw.e.f.01-January-2015.
Rs1lakhvalidfor1year
Advertisement(Backsidecoverpage-Multicolourintwoconsecutiveissues)
Issue-wise detailsRs.75,000/- BacksideCoverPage-MultiColour
Rs.50,000/- Inner Cover Page - Multi Colour
Rs.40,000/- OneFullPage -MultiColour
Rs.30,000/- OneFullPage -Black&White
Rs.20,000/- HalfPage -MultiColour
Rs.15,000/- HalfPage -Black&White
Enquiriesaboutcorporateadvertisementsandappropriateartworkshould be sent to:
The EditorJournalofMarketingVistasInstituteofPublicEnterprise
OUCampus,Hyderabad-500007
Journal of Marketing Vistas

JOURNAL SUBSCRIPTION RATES‘Journal of Marketing Vistas’ isbroughtout twice inayear (January-June&July-December).ThesubscriptionratesoftheJournalperAnnumareasfollows:
India Foreign CountriesIndividual Academic Corporate
1,500/- 2,000/- 3,000/- $200
ThesubscriptionamountispayableinadvancebyDemandDraft/Banker’sChequeonlyinfavourof‘InstituteofPublicEnterprise’payableatHyderabad.TheBankDraft/Banker’sChequemaybesentalongwiththe‘SubscriptionRequestForm’givenbelow:
SUBSCRIPTION REqUEST FORMToTheEditorJournalofMarketingVistasInstituteofPublicEnterpriseOUCampus,Hyderabad-500007Telangana,India.
Dear Sir / Madam,
I/Wewishtosubscribeto‘Journal of Marketing Vistas’for________________year(s).Accordingly,
aDemandDraft/Cheque,bearingNo._______________________dated_____________________for
/$_____________drawninfavourof‘InstituteofPublicEnterprise,Hyderabad’isenclosedherewith.
Pleaseeffectthesubscriptionfromnextissueonwards.
Name_____________________________________________________________________________
Address__________________________________________________________________________
________________________________________________________________________________
City____________________________PIN_____________________Country___________________
Phone&Fax_______________________________________________________________________
E-mail Addres______________________________________________________________________
_______________________Signature


Journal of Marketing Vistas
Institute of Public Enterprise (IPE) is a non-profit educational society devoted to Education,Training,ResearchandConsultancyforbusinessenterprises in the public and private sector.
IPE is a premierB-School and is recognized asa ‘CentreofExcellence’by the IndianCouncilofSocial Science Research (ICSSR), Ministry ofHRD,Government of India, for doctoral studies.It is also recognized by nine universities forguidanceofPhDscholars.Ithasdevelopedstronglinks with industry and academic institutions and is the foundermemberof theAssociationof IndianManagementSchools(AIMS).
IPE strongly believes that HR developmentincludingeducationiscrucialforeconomicgrowth.As part of its long-term education program, theInstituterunsanAICTE-approvedPGDiplomainBusinessManagement,which isalsorecognizedasequivalenttoMBAbytheAssociationofIndianUniversities(AIU).Addedtoit,theInstituteoffers
ShamirpetCampus,Medchal-MalkajgiriDist,Hyderabad-500101Ph:+91-40-23490900 Fax:+91-40-23490999 www.ipeindia.org
AboutIPE
RegisteredwiththeRegistrarofNewspapersinIndiaunderSerialNo.TELENG/2011/51846
MBAinPublicEnterpriseforpracticingmanagersincollaborationwithOsmaniaUniversity.Withthechangingneedsof the industry, theInstitutealsoruns sector-specific PGDM programs in Retail& Marketing, Banking, Insurance and FinancialServices, Biotechnology and InternationalBusiness,aswellasanExecutivePGDMprogram.
The Institute has a strong research wing with anumberofresearchscholars,sponsoredbyICSSRandIPE,workingontopicsofcurrentinterest.ItsPh.Dprogramisoneof the largest in thesocialsciencefield.Research,bothbasicandapplied,istheforteoftheInstituteandhelpsitinitstrainingandeducationalactivities.IPE’sresearchstudiesare extensively used by the Committee on Public Undertakings (COPU), other Legislative andGovernmentCommittees,theEconomicAdvisoryCounciltothePrimeMinister,severalMinistriesoftheGovernment of India, PlanningCommission,SCOPEandseveralFinance&PayCommissions.
Apart fromJournalofMarketingVistas, IPEalsopublishesthefollowingsixjournals:
•TheJournalofInstituteofPublicEnterprise•JournalofEconomicPolicyandResearch•JournalofGovernanceandPublicPolicy•JournalofInternationalEconomics•IndianJournalofCorporateGovernance•IPEJournalofManagement

Shamirpet, hyderabad
association of indian Universities
approved by aiCte
Under the aegis of iCSSr, mhrd, Goi
South asian Quality assurance System
traNSFOrmiNG StUdeNtS iNtO GLObaL bUSiNeSS LeaderS
Admissions open2018-20
For eligibility and other details visit www.ipeindia.org Tollfree: 1800 3000 4473
Contact: 9949507969 / 9391932129 Email: [email protected]
Post Graduate Diploma in Management***$
PGDM - Banking, Insurance and Financial Services***$
PGDM - International Business***$
PGDM - Retail Marketing**$
PGDM - Human Resource Management*$
PGDM - Executive* *** Approved by AICTE, recognized as MBA equivalent by AIU, NBA Accredited ** Approved by AICTE, recognized as MBA equivalent by AIU * Approved by AICTE $ AICTE approved program for Foreign Nationals, PIO, OCI, Gulf residents
InstituteofPublicEnterprise,StateofArtShamirpetCampus - Awarded ‘Five Star’ rating by GRIHA
MemberofEUROPEANFOUNDATION FORMANAGEMENTDEVELOPMENT
Why Join ipe? raNked
8th all india in top Govt. b-Schools (CSr-GhrdC 2017)
33rd rank all india in best b-Schools (Outlook 2017)
15th rank South Zone in best b-Schools (the Week 2017)
20th rank South Zone in best b-Schools (business today 2017)
b+ rank in best b-Schools (time mba education & Careers 2017)
excellent placement and internship assistance
State-of-the-art infrastructure with separate aC hostels for boys and girls
Strong industry interface with industry associates and Corporate
attractive merit Scholarships for top scorers of CAT / XAT / GMAT / MAT / CMAT / ATMA