Journal of Marine Technology and Environment
94
Journal of Marine Technology and Environment Vol. II, year 2014
Transcript of Journal of Marine Technology and Environment

Journal of Marine Technology and Environment Vol. II, year 2014

ISSN 1844-6116

JOURNAL OF MARINE TECHNOLOGY AND ENVIRONMENT
YEAR VII, 2/2014 ISSN 1844 – 6116
JOURNAL OF MARINE TECHNOLOGY AND ENVIRONMENT
This Journal has been founded in 2008 as a biannual publication of Constanta Maritime University/ROMANIA
TOPICS
• Marine Science and Engineering • Marine Environmental Issues • Marine Renewable Energy and Sustainability • Maritime Safety • Marine Chemistry • Marine Corrosion and Material Science • Ship Design, Building Technologies • Ocean Engineering • Advanced Technologies for MET • Advances in numerical methods for marine engineering • Algorithms for multidisciplinary problems in marine engineering • Other related topics
Editor in Chief Feiza MEMET (Constanta Maritime University/ROMANIA) Associate Editors Prof. Dumitru DINU, Ph.D. (Constanta Maritime University/ROMANIA) Prof. Nicolae BUZBUCHI, Ph.D. (Constanta Maritime University/ROMANIA) Prof. Francesc Xavier MARTINEZ DE OSES, Ph.D. (Departament de Ciencia I Enginyeria Nautiques/Universitat Politecnica de Catalunya/SPAIN) Prof. Osman Kamil SAG, Ph.D. (Piri Reis University/TURKEY) Prof. Suleyman OZKAYNAK, Ph.D. (Piri Reis University/TURKEY) Prof. Boyan Kirilov MEDNIKAROV, Ph.D. (Naval Academy ”Nikola Y Vaptsarov”/BULGARIA) Prof. Amable LOPEZ, Ph.D. (Universidad Politecnica de Madrid/SPAIN) Prof. Takeshi NAKAZAWA, Ph.D. (World Maritime University/SWEDEN) Prof. Razvan TAMAS, Ph.D. (Constanta Maritime University/ROMANIA) Prof. Radu MIHALCEA, Ph.D. (University of Illinois at Chicago/USA) Prof. Gheorghe SAMOILESCU, Ph.D. (“Mircea cel Batran” Naval Academy/ROMANIA) Prof. Remus ZAGAN, Ph.D. (Constanta Maritime University/ROMANIA) Prof. Adriana Teodora MANEA, Ph.D. (“Ovidius” University of Constanta/ROMANIA) Prof. Ab. Saman BIN ABD KADER (Universiti Teknologi Malaysia) Prof. Kiril Tenekedjiev (Naval Academy”Nikola Y.VAPTSAROV”/BULGARIA) Editorial Secretary Ass .Prof. Alexandra RAICU, Ph.D. (Constanta Maritime University/ROMANIA) Ass. Prof. Liviu STAN, Ph.D. (Constanta Maritime University/ROMANIA)

JOURNAL OF MARINE TECHNOLOGY AND ENVIRONMENT
Secretariate: Toma Anisoara Scientific Board Cornel PANAIT (Constanta Maritime University/ROMANIA) Violeta Vali CIUCUR (Constanta Maritime University/ROMANIA) Eugen BARSAN (Constanta Maritime University/ROMANIA) Emil OANTA (Constanta Maritime University/ROMANIA) Laurentiu Claudiu MANEA (“Ovidius” University of Constanta/ROMANIA) Marin NEDEV (Naval Academy”Nikola Y. VAPTSAROV”/BULGARIA) Chavdar ALEXANDROV (Naval Academy”Nikola Y.VAPTSAROV/BULGARIA) Marcel la CASTELLS i SANABRA (Departament de Ciencia i Enginyeria Nautiques/Universitat Politecnica de Catalunya/ SPAIN) Santiago ORDAS JIMENES (Departament de Ciencia i Enginyeria Nautiques/Universitat Politecnica de Catalunya/SPAIN) Teresa J.LEO (Universidad Politecnica de Madrid/ SPAIN) Miguel Angel HERREROS (Universidad Politecnica de Madrid/ SPAIN) Michael BALDAUF (World Maritime University/SWEDEN) Nikolay ANGELOV (Naval Academy “Nikola Y Vaptsarov”/BULGARIA) Blagovest Chanev BELEV (Naval Academy “Nikola Y Vaptsarov”/BULGARIA) Nikolai Zhelev KOLEV (Naval Academy “Nikola Y Vaptsarov”/BULGARIA) Dimitar Svetlozarov GUEORGUIEV (Technical University of Varna/BULGARIA) Bohos Rupen APRAHAMIAN (Technical University of Varna/BULGARIA) Wan Mohd Norsani B. WAN NIK (University Malaysia Terengganu/MALAYSIA) Sulaiman OLADOKUN Olanrewaju (University Malaysia Terengganu/MALAYSIA)
JOURNAL ADDRESS Journal of Marine Technology and Environment
Constanta Maritime University, 104, Mircea cel Batran Street, 900663, Constanta, Romania
Tel: +40 241 664 740/ 107 Fax: +40 241 617 260 E-mail: [email protected]
http://cmu-edu.eu/jmte/
EDITURA NAUTICA Constanta Maritime University
Constanta Maritime University, 104, Mircea Cel Batran Street, 900663, Constanta, Romania

CONTENTS
1.
ELABORATION AND TESTING OF LABORATORY STAND FOR FREQUENCY CONTROL OF PERMANENT MAGNET SYNCHRONOUS MOTORS APRAHAMIAN BOHOS Technical University of Varna, Bulgaria……………………………………
7
2.
THE HARDNESS OF SUPERFICIAL LAYERS OBTAINED THROUGH ELECTRICAL SPARKING WITH HARD CARBIDE ELECTRODES AND SOFT MATERIALS BARHALESCU MIHAELA-LUMINITA Constanta Maritime Univesity, Romania………………………………….
15
3.
NEW PUBLICATIONS OF THE UNITED KINGDOM HYDROGRAPHIC OFFICE DACHEV YURIY Nikola Vaptsarov Naval Academy - Varna, Bulgaria…………………….
19
4.
IMPLEMENTATION OF INNOVATIVE METHODS FOR STUDYING COLREG RULES DIMITROV DIMITAR Nikola Vaptsarov Naval Academy, Varna, Bulgaria……………………..
25
5.
THE CHALLENGE OF BUILDING GREENFIELD TERMINALS GRANCHAROVA VALENTINA “Nikola Vaptsarov” Naval Academy, Varna, Bulgaria……………………………
33
6.
SPECIFICS OF CHEMICAL TANKERS FLEET AND ITS MARKET OUTLOOK 1GUNES ERGUN, 2DIMITAR DIMITRAKIEV, 3ALEKSANDAR SIRAKOV
1,2,3“N. Y. Vaptsarov” Naval Academy, Varna, Bulgaria………………….
37
7.
FINITE DIFFERENCE TIME DOMAIN METHOD FOR ACOUSTIC WAVES IN ATTENUATE AND ABSORPTIVE MEDIUM FOR LAYERED UNDERWATER ACOUSTIC ENVIRONMENTS 1JAWAD LAKZIZ, 2SOFIANE OTMANE, 3SAID OUASKIT, 4RACHID EL GUERJOUMA 1,2,3Université Hassan II, Faculté des Sciences Ben M’Sik, B.P. 7955-Sidi Othmane Casablanca, Marocco, 4Université du Maine, Avenue Olivier Messiaen, France……………………………………………….......
47
8.
LOADING OF SCRAP-METAL ON SHIP OF «COASTER» TYPE 1KHOMYAKOV VITALIY, 2SAVCHUK VICTOR 1,2Odessa National Maritime Academy; Ukraine………………………………….
55

9.
CONTAINER YARD OPERATION ANALYSIS FOR A CONTAINER TERMINAL 1LOKE K.B., 2A.H. SAHARUDDIN, 3A.R. IBRAHIM, 3I. RIZAL, 4A.S.A.KADER, 5A.M.ZAMANI 1,2,3,4,5,6School Of Maritime Business and Management Universiti Malaysia Terengganu, Malaysia……………………………………………
59
10.
QUAY TRANSFER OPERATION ANALYSIS FOR A CONTAINER TERMINAL 1LOKE K.B., 2A.H. SAHARUDDIN, 3M.R. OTHMAN, 4I. RIZAL, 5A.S.A.KADER, 6A.M.ZAMANI 1,2,3,4,5,6School Of Maritime Business And Management, Universiti Malaysia Terengganu, Malaysia……………………………………………
65
11.
SIMILARITY CRITERIA FOR SHIP MODELLING AND MAGNETIC SIGNATURE ANALYSIS 1MARIN GEORGIANA, 2SAMOILESCU GHEORGHE, 3BALTAG OCTAVIAN 1Research Center for Navy, 2“Mircea cel Batran” Naval Academy, 3“Grigore T. Popa” University of Medicine and Pharmacy, Romania……
71
12.
THEORETICAL APPROACH FOR OPTIMAL DESIGN OF SHELL AND TUBE HEAT EXCHANGERS ON GENETIC ALGORITHM BASIS MEMET FEIZA Constanta Maritime University, Romania…………………………………
79
13.
EDUCATION REGARDING GREEN REFRIGERANTS IN C.M.U. MITU DANIELA-ELENA Constanta Maritime University, Romania................................................
87

JOURNAL OF MARINE TECHNOLOGY AND ENVIRONMENT
7
ELABORATION AND TESTING OF LABORATORY STAND FOR FREQUENCY CONTROL OF PERMANENT MAGNET SYNCHRONOUS
MOTORS
APRAHAMIAN BOHOS
Technical University of Varna, Bulgaria
The paper presents our work in elaboration and testing of laboratory stand for frequency control of permanent magnet synchronous motors (PMSM). These motors are increasingly finding application in ship electric drives.
Keywords: permanent magnet synchronous motor, frequency control, electric drives, Simulink.
1. INTRODUCTION
The permanent magnet synchronous motor (PMSM) is a rotating electric machine where the stator is a classic three-phase stator like that of an induction motor and the rotor has surface-mounted permanent magnets. In this respect, the PMSM is equivalent to an induction motor where the air gap magnetic field is produced by a permanent magnet. The use of a permanent magnet to generate a substantial air gap magnetic flux makes it possible to design highly efficient PMSM with many advantages [1]: medium construction complexity; high reliability (no brush wear), even at very high achievable speeds; high efficiency; driven by multi-phase inverter controllers; sensorless speed control possible; smooth rotation without torque ripple; appropriate for position control. These advantages have resulted in an increased application of the PMSM in hybrid vehicles, ships, etc. Furthermore high-performance, highly dynamic drives with PMSMs have many applications in such production processes and transport systems where a fast and accurate torque response is required. As reliability and cost of modern PMSM drives are of importance, advanced control techniques have been developed [2].
A PMSM is driven by sine wave voltage coupled with the given rotor position. The generated stator flux together with the rotor flux, which is generated by a rotor magnet, defines the torque, and thus speed, of the motor. The sine wave voltage output have to be applied to the 3-phase winding system in a way that the angle between the stator flux and the rotor flux is kept close to 90° to get the maxi mum generated torque. To meet this criterion, the motor requires electronic control for proper operation. For a common three-phase PMSM, a standard three phase power stage is used. The power stage utilizes six power transistors with independent switching. The power transistors are switched in the complementary mode. The sine wave output is generated using a Pulse-width modulation (PWM) technique [1].

JOURNAL OF MARINE TECHNOLOGY AND ENVIRONMENT
8
The paper presents results from elaboration and testing of laboratory stand for frequency control of permanent magnet synchronous motor in the Laboratory of Electric drives of the Technical University of Varna.
2. PERFORMED EXPERIMENTS
А standard control scheme of synchronous motor with permanent magnets powered by a
voltage source inverter (VSI), which is supplied from the mains via the AC / DC converter is implemented - Figure 1. DSP is a digital signal processor. The combination of DSP and VSI gives very precise and fast control.
Fig. 1. А standard control scheme of synchronous motor with permanent magnets
A Siemens SINAMICS G120 modular single-motor drive for low to medium power ratings is used [3]. SINAMICS G120 is a modular inverter system comprising a variety of functional units. The main units are the Control Unit (CU) and the Power Module (PM). The Control Unit controls and monitors the Power Module and the connected motor using several different control types that can be selected. It supports communication with a local or central control and monitoring devices.The Power Module supplies the motor in a power range 0.37 kW to 250 kW.
Fig. 2. Scheme of the experimental set with the SINAMICS G120 drive, the PMSM with the encoder and an oscilloscope

JOURNAL OF MARINE TECHNOLOGY AND ENVIRONMENT
9
The Power Module is controlled by a microprocessor in the Control Unit. Comprehensive protection functions provide a high degree of protection for the Power Module and the motor. Furthermore, a large number of additional components are available, such as: Intelligent Operator Panel (IOP) and Basic Operator Panel (BOP) for parameterizing, diagnosing, controlling and copying drive parameters; line filters; line reactors; braking resistors; sine-wave filters; output reactors, etc.
A Permanent Magnet Synchronous Motor (PMSM) with built-in encoder from Texas Instruments Kit HVPMSMMTR is used [4]. The PMSM Kit is designed for customers looking to use the High Voltage Motor Control with a PMSM motor, commonly used in servo applications. The kit includes a PMSM motor with a built in encoder, which works with the motor control kit software right out of the box.
The included PMSM motor is Anaheim Automation EMJ-04APA22, 400W, 200V, 2.7A, 3000RPM. The scheme of the experimental set with the SINAMICS G120 drive, the PMSM with the built-in encoder and an oscilloscope is shown in Figure 2. General view of the used PMSM is presented in Figure 3.
A large number of experiments were carried out at different frequencies and motor loads. Typical examples of the obtained results are shown in Figures 4, 5, 6 and 7.
Fig. 3. General view of Anaheim Automation EMJ-04APA22 PMSM
Fig. 4. Results from the screen of the oscilloscope for frequency f1= 5 Hz and current I = 0.73 A

JOURNAL OF MARINE TECHNOLOGY AND ENVIRONMENT
10
Fig. 5. Results from the screen of the oscilloscope for frequency f1= 10 Hz and current I = 1.25 A
Fig. 6. Results from the screen of the oscilloscope for frequency f1= 30 Hz and current I = 2.7 A.
Fig. 7. Results from the screen of the oscilloscope for frequency f1= 50 Hz and current I = 3.45 A

JOURNAL OF MARINE TECHNOLOGY AND ENVIRONMENT
11
3. MODELING IN MATLAB SIMULINK
Considerable part of the electric drives works in transient regimes accompanied by changes in static load and speed. The operation in transient regimes is characterized by continuous changes in the torque, the current and the speed depending on the time. In complex automated electric drives transient regimes are described by a system of differential equations of higher order, the theoretical study, which is associated with continuous calculations. Therefore modeling of the electromechanical processes using numerical methods is used.
In the presence of advanced software for automation like Matlab Simulink the method of modeling by describing the processes in the motor called state-space system is used [5]. The equations of the mathematical model are based on physical laws describing the electromechanical processes in the electric motor.
In our study a standard model of frequency control of synchronous motor with permanent magnets in Matlab Simulink – Figure 8. The model continues also a standard model of synchronous motor with permanent magnets – Figure 9.
Fig. 8. Standard model of frequency control of synchronous motor with permanent magnets in Matlab Simulink
The results can be displayed in tabular or graphical form. The main result is the motor’s
current depending on the time at different frequencies of the supplied voltage – Figure 10 and Figure 11. Many other parameters of the motor such as electromagnetic torque, rotor speed, mechanical power, voltage and components of the current on the axes can be easily displayed – Figure 12.

JOURNAL OF MARINE TECHNOLOGY AND ENVIRONMENT
12
Fig. 9. Standard model of synchronous motor with permanent magnets in Matlab
Simulink
Fig. 10. Preview of the results from the Matlab Simulink model at frequency f1 = 10 Hz and current I = 1,25 A, depending on the time

JOURNAL OF MARINE TECHNOLOGY AND ENVIRONMENT
13
Fig. 11. Preview of the results from the Matlab Simulink model at frequency f1 = 50 Hz and current I = 3,45 A, depending on the time
4. CONCLUSIONS The analysis of the transients allows to establish the relationships between the main
electrical and mechanical quantities describing the operation of electric drives as well as to investigate the influence of various parameters on the processes.
The obtained results show that the established models are adequate and, thus, in computational way can be obtained the characteristics of the real machine with high reliability which can be used in their design.
The developed models can be used except in laboratory testing also for sizing and proper selection of motors and the design of inverters and converters of frequency in the frequency control systems.

JOURNAL OF MARINE TECHNOLOGY AND ENVIRONMENT
14
Fig. 12. Preview of other available results from the Matlab Simulink model at
frequency f1 = 50 Hz and current I = 3,45 A such as electromagnetic torque, rotor speed, mechanical power, voltage and currents
REFERENCES
[1]. http://www.freescale.com/webapp/sps/site/application.jsp?code=APLPMSYNCMO [2]. https://www.ugent.be/ea/eesa/en/research/areas/drivesystems/torquecontrol.htm [3]. http://www.automation.siemens.com/sd-static/sinamicsg120/ftp/D11-1-2009-en.pdf [4]. http://www.ti.com/tool/hvpmsmmtr [5]. http://www.mathworks.com/help/simulink/slref/statespace.html

JOURNAL OF MARINE TECHNOLOGY AND ENVIRONMENT
15
THE HARDNESS OF SUPERFICIAL LAYERS OBTAINED THROUGH ELECTRICAL SPARKING WITH HARD CARBIDE ELECTRODES AND
SOFT MATERIALS
BARHALESCU MIHAELA-LUMINITA
Constanta Maritime Univesity, Romania
The work entitled “The hardness of superficial layers obtained through electrical sparking with hard carbide electrodes and soft materials”, presents the research done by the author in regards hardness increase of superficial layers obtained through impulses electrical discharges. This increase appears because of the thermal effect of pulsed discharges. The aria of material which is under the deposited layer is subjected to a pronounced heating followed by rapid cooling by taking over the heat from the base material. In this way occurs a hardening of metallic material located in close proximity to superficial layer deposited.
Keywords: deposition, superficial layer, electrical discharge, increase hardness
1. INTRODUCTION For obtaining thin films with special properties (hardness, wear resistance, corrosion
resistance and shock resistance), in the last time a series of unconventional superficial treatments were imposed. One can remember the thermal treatments with laser beam, thermal treatments with electron beams and, last but not the least, the PVD and CVD [Barankova, H, 1996]. All these methods confer very high hardness to superficial layers, yielding to a considerable enhancement of the treated piece lifetime [Berg, S, 1998].
An important disadvantage of these treatments is the high-price since expensive installations and devices are needed. In the field of surface engineering a new kind of superficial thermal treatment of microalloying and spark deposition was imposed.
Superficial layers are obtained through impulses electrical discharge, that is a procedure through which the proprieties of the metallic materials can be improved. The process is that during the discharges (short period) an erosion of the cathode takes place and a transfer of erosion products on the treated surface takes place. That discharge takes place in a gas environment. Unlike the classic processing through electric-erosion, at the electric sparking is used a power that is recovered pulsate with reversed polarity. In this case the processing through electric spark has the air as a gas environment and the electrode execute a vibrating movement.Through this process is achieved anode (electrode) transfer to the cathode (the sample) and obtaining the superficial layer with chemical and physical properties well-defined [Chatterjee, S.K., 2008].

JOURNAL OF MARINE TECHNOLOGY AND ENVIRONMENT
16
2. EXPERIMENTAL WORK The experiments were done on several samples of steel heat treated and untreated,
through impulse electrical discharges, made with the ELITRON 22A equipment, using electrodes of carbide sintered tungsten, used for scintillation at the same work conditions (discharge current and oscillation frequency).
Treatment through impulse electrical discharges was done on some parallelepiped samples (20x20x10 mm), the probes plane surfaces were done previously prepared. Preparing the surfaces presumes a thorough treatment and degrease with a powerful solvent [Barhalescu, M., 2007].
The treatment through electrical discharges where made manually, the active electrode is under a 60o angle with the treated surface.
When treatment with electrical discharges a significant importance in the formation of the superficial layer and it’s qualities, has the electrode section surface, influence that will be manifested at the working regime temperature variation and at the current density which passes through the electrode [Pauleau, Y, 1994; Santana, A.E., 2004].
In table 1 are presented the recommended values for the electrode cross section in regard tot the work regime of the ELITRON – 22A equipment and the current value at every regime.
Table 1: The recommended values for the electrode cross section
Electric work regime ELITRON – 22A
1
2
3
4
5
Electrode cross section value [mm] 4 5 4 ÷6 5 ÷6 6 ÷9
Work current [A] 0,5 0,8 1,3 1,8 2,3
In the experiments wasn’t specified the electrode vibration amplitude value because this does not influence neither the layer thickness, or it’s structure, the only importance is to be big enough to prevent the solder of the electrode with the surface which will be treated.
The samples microhardness was determined with a PMT – 3 equipment. With this equipment was measured and layer thickness.
Hardness was determined by the relationship [Carpenter, J. S, 2012]:
]/[. 22
41854 mmdaND
PMHV ×= (1)
where: P is weight which press [gf] D is impression diagonal [µm].
Pressing load used for determination hardness was by 50 gf. Main factors leading to change hardness are: thermal discharge action, occurrence of
chemical bonds (formation of carbides, nitrides, inter-metallic compounds) and anode material deposition on the cathode [7].
3. RESULTS AND DISCUTTIONS The first series of experiments were done on several samples of steel using carbide
sintered tungsten electrodes and the same electric work regime: 4.

JOURNAL OF MARINE TECHNOLOGY AND ENVIRONMENT
17
Through electrical sparking process under the deposited layer, especially in hard scintillation regimes, it formed a layer that is the transition layer to the basic structure. Transition layer occurs due to thermal action of impulses electrical discharges and the anode elements diffusion at the cathode elements[Barhalescu, m., 2013].
Measurements of hardness and working conditions are presented in table 2.
Table 2: Measurements of hardness and working conditions
No. Sample material Electrode material
Working conditions
Microhardness HV 50 [daN/mm2]
1 OLC 15 WCo8 4 1660 2 OLC 45 WCo8 4 1665 3 Rp3 WCo8 4 1660 4 205Cr115 WCo8 4 1720 5 51Si17A WCo8 4 1690 6 155MoVCr115 WCo8 4 1715 Alloying constituents from the base material diffuses into the time of the impulse
electrical discharges process, and mix with the material forming intermetallic compounds and carbides which gives a higher hardness newly formed layer.
Determination of superficial layer hardness was made on samples of steel heat treated and untreated, through impulse electrical discharges using tungsten carbide electrodes: WCo8.
Table 3: Hardness of superficial layer obtained using WCo8 electrode
No
Sample
Heat Thickness
[µm] layer Microhardness HV 50
[daN/mm2] material treatment Deposited
layer Transition
layer Deposited
layer Transi-
tion layer
Base struc-ture
1 untreated 40 45-48 1660 890 342 2 OLC 45 Thermal
hardened 41 43-50 1658 650 680
3 untreated 41 44-50 1662 700 420 4 Rp3 Thermal
hardened 40 45-55 1650 670 685
5 untreated 41 54-62 1665 990 640 6 205Cr115 Thermal
hardened 43 60-65 1670 930 985
Data presented in the table 3 show that the thickness of the deposited layer does not
depend by the heat treatment of the basic structure. In the electrical sparking process, under deposited layer it formed a transition layer to the basic structure. During the the electrical sparking process of non-hardened steels, transition zone has a higher hardness than the basic structure due to the hardening process to which is subject.
At small working conditions when the transition layers have not a considerable thickness, the hardness it abruptly changes from low values of the basic structure at much higher values of layer deposited.

JOURNAL OF MARINE TECHNOLOGY AND ENVIRONMENT
18
Another series of experiments were done on OLC 45 carbon steel samples of steel using aluminum electrodes and the electric work regime: 4.
Table 4: Hardness of superficial layer obtained using Al electrode
Sample material
Heat tratment Electrode material
Working conditions
Microhardness HV 50 [daN/mm2]
OLC 45 untreated Al 4 900 Thermal influence of discharge impulses has a decisive role in this case because there
is a hardening of the material sample in the liquid phase in that dissolves and aluminum from electrode (anode). Rapid cooling of the melt leads to the appearance of hardening constituents who are very tough.
4. CONCLUSIONS On previously hardened samples, when obtain hard superficial layers, through impulse
electrical discharges, appear situations where the transition layer hardness is less than the basic structure hardness.
When are use the electrodes from soft materials, the superficial layer obtained hardness has values higher than the basic structure and electrode used.
In the case of metallic materials that do not exhibit phenomena related to hardening, the hardeness of surface processed through impulse electrical discharges is determined by the hardeness size of the electrode material used, or by chemical interactions that appear between materials of electrodes (anode + cathode) and the environment of these interactions
REFERENCES [1]. Barhalescu, M., - Researches regarding the obtaining and structural analysis on corrosion
resistant thin superficial layers, Ph. D Thesis, Jassy, Romania, 2007 [2]. Barhalescu, M.; - Determining of hardness for superficial layers obtained through electrical
sparking, Advances in Production, Automation and Transportation systems, ISBN: 978-1-61804-193-7, ISSN: 2227-4588 pp. 198-200, Proceedings of the 6th International Conference on Manufacturing Engineering, Quality and Production Systems (MEQAPS '13) Brasov, Romania, June 1-3, 2013
[3]. Barankova, H.; Bardos, L.; Berg, S. - Surface and Coating Technology, No. 94-95, 1996 [4]. Berg, S., Katardjiev, I. V., - Preferential sputtering effects in thin film processing, Journal of
Vacuum Science &Technology A: Vacuum, Surfaces,and Films, Vol 17, pp.1916 – 1925, 1998. [5]. Carpenter, J. S., Misra, A., Anderson, P. M., - Achieving maximum hardness in semi-coherent
multilayer thin films with unequal layer thickness, Acta Materialia, Vol. 60, Issue 6-7, 2012 [6]. Chatterjee, S.K.,- Crystallography and the World of Symmetry, Springer, ISBN: 978-3-540-
69898-2, Berlin, 2008 [7]. Pauleau, Y., - Materials and Proceses for Surface and Interface Engineering, Kluwer Academic
Publ., ISBN: 978-0-7923-3458-3, London, 1994 [8]. Santana, A.E., Karimi, A., Derflinger, V.H., Schutze, A., - Microstructure and mechanical behaviour
of TiAlCrN multilayer thin films, Surface and Coatings Technology, Vol 177-178, 2004

JOURNAL OF MARINE TECHNOLOGY AND ENVIRONMENT
19
NEW PUBLICATIONS OF THE UNITED KINGDOM HYDROGRAPHIC OFFICE
DACHEV YURIY
Nikola Vaptsarov Naval Academy - Varna, Bulgaria
The IMO’s Maritime Safety Committee at its 86th session from May 26 to June 5, 2009 approved new regulations, on which is written that all merchant ships engaged on international voyages are obliged to be fitted with ECDIS(Electronic Chart Display and Information System) schedulely to the middle of year 2018 as the main means for navigation for working with maritime Electronic Navigational Charts (ENC). Therefore United Kingdom Hydrographic Office issued new Admiralty publications, related to implementation, operation and service of ECDIS, and to content, used symbolic and way for making corrections of Electronic Navigational Charts. The Hydrographic Office also made important changes in the content of some existing publications, which deserve to be discussed in this article. After 2012 the exterior design of all Admiralty maritime publications has been changed. This fact shows clearly that comes one new stage in the publication activity of the United Kingdom Hydrographic Office.
Keywords : new nautical publications, ECDIS.
1. GENERAL INFORMATION OF THE ADMIRALTY PUBLICATIONS The United Kingdom Hydrographic Office issued more than 34 type of maritime
publications, known as Admiralty publications, which include important navigational, hydrographic, meteorological, astronomical and cartographic information. This publications help navigators for planning ship’s route and conducting the vessel. Depending on type of publication each ot them contains series of books with different numbers. Each book from the series has a unique number, beginning with abbreviation NP, which is a abbreviation of the „Nautical Publication”. For instance the publication “Sailing Directions” contains series of books with numbers from NP1 to NP72, referring to the whole regions of the World Ocean. Total for all type of publications the Hydrographic Office issue over 160 books. In case of reissuing of publication, the number of the relevent books remains. Some of numbers are reserve for future printing of new books from the series. For easy finding out and knowledge of publications, their lateral edgebands are differently coloured (NP131, 2013).
All publications are described in sections “Nautical Publications” and “Related Admiralty Publications” of the Admiralty catalogue NP131 “Charts and Publications Catalogue”. Some of them are reissued annually, others - in longer period of time. The period of reissuing depend on the dynamic change of the data information included. For example the series of books from publication „List of Lights and Fog Signals” are reissued annually, and the series of books “Sailing Directions” – within a period of not less of five years or more. For such book, periodically(after 2-3 years) are printed „Supplements” with all amendments during the period from last issue till the present moment and they are an integral part of the books. (NP131, 2013).

JOURNAL OF MARINE TECHNOLOGY AND ENVIRONMENT
20
Till year 2012 only three from whole publications has to be weekly corrected as per amenmdement, published in „Weekly Admiralty Notices to Mariners” – “Sailing Directions”, „List of Lights and Fog Signals” and “List of Radio Signals”. The updated information is written in sections IV, V and VI of Admiralty “Weekly Notices to Mariners”. (Fig. 1) a)
b)
Fig. 1. Content of Weekly Admiralty Notices to Mariners
a) before 2012; b) after 2012
After 2012 the exterior design of all publications was changed – fact, showing a new stage in the publication activity of the United Kingdom Hydrographic Office. (Fig. 2).
a) b)
Fig. 2. Exterior design of the Admiralty publications a)before 2012; b) after 2012

JOURNAL OF MARINE TECHNOLOGY AND ENVIRONMENT
21
2. NEW PUBLICATIONS The handbook CHART 5011 (INT1), which describes the symbols and abbreviations,
applied in Admiralty and International maritime navigational charts, after year 2012 is transformed into two new publications – NP5011(INT 1) „Symbols and Abbreviations Used on Admiralty Paper Charts” and NP5012 “Admiralty Guide to ENC Symbols used in ECDIS”. (Fig. 3) This change is resulted from mandatory and stages introducing of Electronic Chart Display and Information System (ECDIS) as main instrument for navigation applicable in the world merchant fleet and distinguished symbols, used in Admiralty Paper from these in Electronic Navigational Charts. (www.ukho.gov.uk)
а) b) c)
Fig. 3. Admiralty Symbols and Abbreviations а) CHART 5011 (INT1); b) NP5011(INT1); c) NP5012
In handbook NP5011(INT1) are detaily presented the symbols, applied in Admiralty and
International Paper navigational charts, with their original colours and information concerned with topography, hydrography and navigational aids, abbreviations of the basic terms used and general information for their content. NP5012 contains information for the symbols, used in ENC. In order navigators to receive sufficient knowledge and skills, related to using ENC and ECDIS,
Hydrographic office of the Admiralty printed two new publications - NP231 „Admiralty Guide to the Practical Use of ENCs” and NP232 “Admiralty Guide to ECDIS Implementation, Policy and Procedures” (Fig. 4). The publication NP231 is intended for using as a guide and manual, giving on duty officers the ability for good practical using of ENC. The handbook NP232 is a manual, which forms in the users necessary knowledge and understandings for operating the system ECDIS and obtaining skills for safe and efficient use as a primary means of navigation. The publication offers important informations for ECDIS procedures. (www.ukho.gov.uk ), (www.admiralty.co.uk)

JOURNAL OF MARINE TECHNOLOGY AND ENVIRONMENT
22
a) b) Fig. 4. The new Admiralty Publications: a) NP231; b ) NP232
3. CHANGES IN THE CONTENT OF SOME PUBLICATIONS Issuing of new publications for operation with ENC and ECDIS, lead to changes in
content of some existing publications: • The content of „Weekly Admiralty Notices to Mariners” has been increased with two
sections – VII and VIII. (Fig. 1,b). In the section VII „Updates to Miscellaneous Admiralty Nautical Publications” give information for corrections to other publications (except already mentioned three publications), which also should be updated accordingly. Therefore from year 2012 started correction of all Admiralty publications. In section VIII „Updates to Admiralty Digital Products and Services”, is presented various information, connected with implementation and operation with ENC and ECDIS, such as status of digital products, new format for ENC, some anomalies and errors by operating system ECDIS and etc.(www.ukho.gov.uk/msi).
• The publication NP294 „How to Keep Your Admiralty Charts Up-to-Date” illustrate rules of truly correction of paper navigational charts. After 2012 this publication is transformed into manual, named NP294 “How to Keep Your Admiralty Products Up-to-Date”. The above mentioned manual illustrate rules for making corrections to various Admiralty products – navigational charts, publications and electronic products. (Fig. 5)
• The publication NP247 „Annual Summary of Admiralty Notices to Mariners”, divided in two books – Part 1 and Part 2, after 2012 includes Annual Notices to Mariners for correcting of various Admiralty navigational publications. (Fig. 6,b).

JOURNAL OF MARINE TECHNOLOGY AND ENVIRONMENT
23
a) b)
Fig. 5. The Admiralty Publication NP294
a)before 2012; b)from 2012
a) b)
Fig. 6. The New Admiralty Publication NP24 7 from 2012 a)Part 1; b) Part 2

JOURNAL OF MARINE TECHNOLOGY AND ENVIRONMENT
24
4. CONCLUSION
The new trends in publication activity of the United Kingdom Hydrographic Office are in fully compliance with the high requirements of IMO, related to the safety of navigation. The introduction of ENC and ECDIS in the present navigation lead to necessity of additonal crew competencies for operating these navigational means. The Admiralty Hydrographic Office respond adequately to the situation and duly issued three new publications for ENC and ECDIS operation. This conducted to alteration in form and content of other publications, published from Hydrographic Office. With great interest we will expect next new publications of the Admiralty.
REFERENCES [1]. NP131 -“Charts and Publications Catalogue” , United Kingdom Hydrographic Office, Taunton, 2013. [2]. http://www.ukho.gov.uk [3]. http://www.ukho.gov.uk/msi [4]. http://www.admiralty.co.uk

JOURNAL OF MARINE TECHNOLOGY AND ENVIRONMENT
25
IMPLEMENTATION OF INNOVATIVE METHODS FOR STUDYING COLREG RULES
DIMITROV DIMITAR
Nikola Vaptsarov Naval Academy, Varna, Bulgaria
The ship incidents are related to the loss of human life, significant damage to the marine environment and loss of load. They depend on hydro-meteorological conditions, the density of ship traffic, and the condition of the hull and skills of the officer of the watch. The convention STCW sets various requirements regarding mandatory learning and training of navigators for obtaining the relevant knowledge and skills. Despite of modern technologies for facilitating of navigational watch the number of collisions did not decline. The last IMO bulletin reports that more than 90 percent of collisions are resulted from the human factors: initiated by human error or associated with human error as a result of inappropriate human response. This fact put a question for applying appropriate methods for teaching and training of seafarers in COLREG. The paper propose innovative method for understanding, application and testing of COLREG of navigational officers.
Keywords : colreg, collision avoidance, maritime education.
1. INTRODUCTION According to researches published IMO bulletin 85 % from cases of ship’s collision in
year 2006 happen due to inappropriate human response ( Ziarati R, 2006). During 2010 they has been increased with 5% and reached 90% despite of improvements in navigational aid and implementation of e-navigation (IMO, 2010). In most of cases the officers to one or both ships involved in collision have been taken an action, which contravened the Colreg rules. The last ten years teaching methods have drastically changed. The education material is now presented more realistically with graphics, drawings, pictures and even films often artistically and scientifically presented for easy understanding. For instance PowerPoint presentation of the Colregs should give the student a better perception of this complex subject material.
2. PROPOSAL FOR EFFECTIVE LEARNING AND TRAINING The International regulations for Preventing Collision at sea, known as COLREG provide
various guidelines regarding overtaking manoeuvres, passing and crossing, which should be clear understand and obey. Actually the basic for seafarers rules in real situation has been ignored or disregarded due to improper interpretation of the current standards and regulations or deficiencies in the period of learning. The e-navigation concept integrate the digital navigation information of each navigation equipment within the bridge, including own ship navigation course from the gyro compass, ship speed from the electronic log, ship

JOURNAL OF MARINE TECHNOLOGY AND ENVIRONMENT
26
position from the GPS and various weather information (for instance, wind direction, wind speed, current speed, current direction, etc).
Safe watchkeeping at sea should be maintained at all times. The officers of the navigational watch are responsible for navigating the ship safely during their periods of duty, when they will be particularly concerned with avoiding collision and grounding. Officer of the Watch (OOW) should use all available on board equipment to make meteorological observations (Grancharov I., 2014). The decision support systems (Navigation Aids) also enroll into this area, which covers broad scope of information to assist the navigator in the safe pas-sage of the ship ( Fig. 1).
Having poor lookout is a huge problem and is usually a combination of different factors where the duty officer did not look out of the windows, did not have a designated lookout, did not plot the target, or was confused by the information that the radar or the Electronic Chart Display and Information System (ECDIS) provided, leading the officer to make the wrong decision. Therefore training requires careful consideration of all factors which influence performance and reliability of both the human operator and the equipment as part of a total system.
Fig. 1 Decision support system

JOURNAL OF MARINE TECHNOLOGY AND ENVIRONMENT
27
The main part of the professional knowledge and skills should be acquired during the learning process. The educational equipment has be consistent with the international training requirements for education and training of maritime personnel. Particular attention during training of marine navigators should be paid to the training in Maritime Simulators where students have the opportunity to acquire as close to the real situation in sea conditions, reiterate particularly parts of daily operations at ship (Grancharova V., 2012).
Fig. 2 Proposal for lesson structure
The educational aim in performed under the International Convention “Standards of Training, Certification and Watchkeeping for Seafarers” (STCW) is simulation of real sailing situation carried out at sea, which depending on the requirements for particular position occupied includes:
- Avoiding collision between vessels; - Monitoring the loading, stowage, lashing, securing and unloading of cargoes and
preserving during the voyage; - Ensuring safety as per requirements for preventing pollution; - Maintain ship seaworthiness; - Prevention and control extinguish fire occurred on board; - Operating with life saving appliance (Grancharova V., 2012). Easy understanding and interpretating the COLREG is one of the goals of project
“Avoiding Collision at Sea”, with main partners are Nicola Vaptsarov Naval Academy (Varna, Bulgaria), Faculty of Maritime Studies, University of Rijeka (Croatia) and Piri Reis University

JOURNAL OF MARINE TECHNOLOGY AND ENVIRONMENT
28
(Istanbul, Turkey). As a part from the project during 1st quarter of 2014 have been made a detailed research with 701 participians, with different level of education(secondary school, university) and people, which has been already graudated and work as trainer or navigational officers and masters with different period of sea experience. The research included 50 questions and give detailed picture about level of undertstanding and applying of COLREG. The average percentage of correct answers by people with sea going experience is 72 %, which is not enough. It is noteworthy the low percentage of correct answers in the Section II “Conduct of vessels in sight of one another”. For example the proper and correct application of Rule 15 is 91,5%, and taking action to avoid collision keeping the Rules 17a is 81% and Rule 17c is only 43%.
Fig. 3 Scenario 1 – Basic crossing situation
Fig. 4 Scenario 2 – Border (Head-on) Crossing situation
Having in mind the result from the above mentioned research my proposal, concerning structure of one COLREG lesson is shown on Figure 2. The lesson concerning, conducting of the vessel in clear visibility should start with definition of collsion risk and detailed explanation on Rule 15 and followed by explanation of Rules 16 and 17. It should be mentioned that collision risk occur when there is an encounter where the closest point of

JOURNAL OF MARINE TECHNOLOGY AND ENVIRONMENT
29
approach (CPA) between two ships will reach near zero if no action is taken. In other words, if the compass bearing of an approaching ship does not change appreciably, the two ships will collide. Therefore every officer carefully maintains a proper look-out to observe other ships’ movements so as to make a full appraisal of the risk.
In my opinion Rule 15 should be considered in at least three scenarios of crossing situations. Scenario 1 presents the risk of collision between vessel A and vessel B (Fig. 3). The courses of both vessels are at an angle close to 90 degrees. Scenario 2 explains the crossing situation I which collision risk occurs and the angle between vessels cources is acute so that the ships are under position, bordered by applying of Rule 14 “Head-on situation” (Fig. 4). Scenario 3 clarifies other borderline case "Crossing situation" at which the ship is in relative bearing about 90 degrees (Fig. 5). This case can be wrondgly defined as overtaking situation. When students clearly understand these three main output positions, they should correctly determine that it is necessary to apply Rule 15.
Fig. 5 Scenario 3 – Border (overtaking) Crossing situation After that should be explained Rule 16, as it is the development of initial situiation on
which occurs collision risk. Rule 16 states that every vessel which is directed to keep out of the way of another vessel shall, so far as possible, take early and substantial action to keep well clear (IMO, 2012). This means that the give way vessels should take action well in time, estimate the speed of approach between the two vessels, estimate the approximate time interval and then take action, do not take a late action, since this would make the stand on vessel apprehensive and she may then take an action which would be detrimental to both vessels. Actions of give-way vessel should correspond with Rule 8-c, which state: ”If there is sufficient sea room, alteration of course alone may be the most effective action to avoid a close-quarters situation provided that it is made in good time, is substantial and does not result in another close-quarters situation”.
In crossing situation the manouevring options for give-way vessel (vessel A) can be: 1) Alter her course to starboard (30-50 degreee) and cross astern of vessel B - (Fig. 6a); 2) Alter her course,make a 360° turn to starboard a nd cross astern of vessel B -(Fig. 6b); 3) Alter her course and make a 360° turn to port an d cross astern of vessel B -(Fig. 6c); 4) Alter her course to starboard and make “Z” manoeuvre and cross astern of vessel B. The first alter should be at least 40-50 degree-(Fig. 6d). Taking of proper, early and substantial action should the conntected also with Rule 8 (c

JOURNAL OF MARINE TECHNOLOGY AND ENVIRONMENT
30
It should be clarified the actions of stand-on ship accoding to the Rule 17. The text of Rule 17 a(ii) states that the latter vessel may however take action to avoid collision by her manoeuvre alone, as soon as it becomes apparent to her that the vessel required to keep out of the way is not taking appropriate action in compliance with these Rules. This means that in above mentioned case the vessel B (stand-on vessel) should keep her course and speed until vessel A is manouervring.
a)
b)
c)
d)
Fig. 6 Manouevring of give-way vessel according Rul e 16
The next subsection recommends that in case stand-on vessel finds herself so close that
collision cannot be avoided by the action of the give-way vessel alone, she shall take such action as will best aid to avoid collision. The moment of taking such action and the circumstance are controversial and should be discussed because in the Rule is not precisely clafified the time in which this action should started. Also not mentioned is at what distance. In my opinion the acion for avoiding collision should start at the distance between 3-6 miles , i.e. in case that the elements of movement of both vessel (course and speed) can be mutually identify. Manouevres of vessel B are shown on Fig.7. The explanation should continue with the development of the negative crossing situation, on which the give-way vessel is keeping her course and distance and do not act according COLREG. In such case, the Convention has provided in Rule 17c, which oblige the stand-on vessel (vessel B) to take manoeuver for collision avoidance known in seamanship as "manoeuver at the last minute. If the circumstances of the case admit, stand-on vessel should not alter course to port for a vessel on her own port side and the possible manouevre in this situatuin is altering course to starboard and circulation up to 360 degree. Of course this manouever do not release the vessel A from giving of way by altering of course to port and and circulation up to 360 degree (Fig. 8).
At the end of the lesson can concluded that when a vessel has the duty of giving way to another under the rules, she normally does so by altering course to pass astern of the other, and should make a clear and significant alteration of course in plenty of time to indicate to the other vessel that she is taking the appropriate action. As long as the give way vessel

JOURNAL OF MARINE TECHNOLOGY AND ENVIRONMENT
31
takes a action well in time there is no problem and the stand on vessel follows the above Rule 16, and the stand on vessel is required not to take action, but it does not mean that she would not be alert and monitor the situation. The watch keeper on the stand-on vessel has to be alert and should have been monitoring the situation as it developed. His plan of action for evasive action should be ready at all instances, since he would have to take evasive action if the give way vessel fails to take action or if the action is not sufficient to clear the impending danger.
The action that the stand on vessel finally takes to avoid the situation depends on on what is the nature of the action of the give way vessel, if the action is insufficient to clear the close quarter situation then the stand on vessel has to take action which will get the two ships safely away from each other.
Fig. 7 Manouevring of stand-on vessel according Ru le 17- a,ii
Fig. 8 Manouevring of stand-on vessel according Ru le 17- c –“Manoeuver at the last minute”
The basic fact of these rules are that although the stand on vessel need not take action
initially, she must, repeat must closely monitor the other ship and plan out actions at every step. However the advice is not to alter course to port for a give way vessel which is on her port side. When the stand on vessel has been forced to take action does not mean that the give-way vessel has passed the buck to the stand on vessel.
According to Rule 17-d the give way vessel (A) is still obliged to keep out of the way as it is shown on Fig. 9.
JOURNAL OF MARINE TECHNOLOGY AND ENVIRONMENT
32
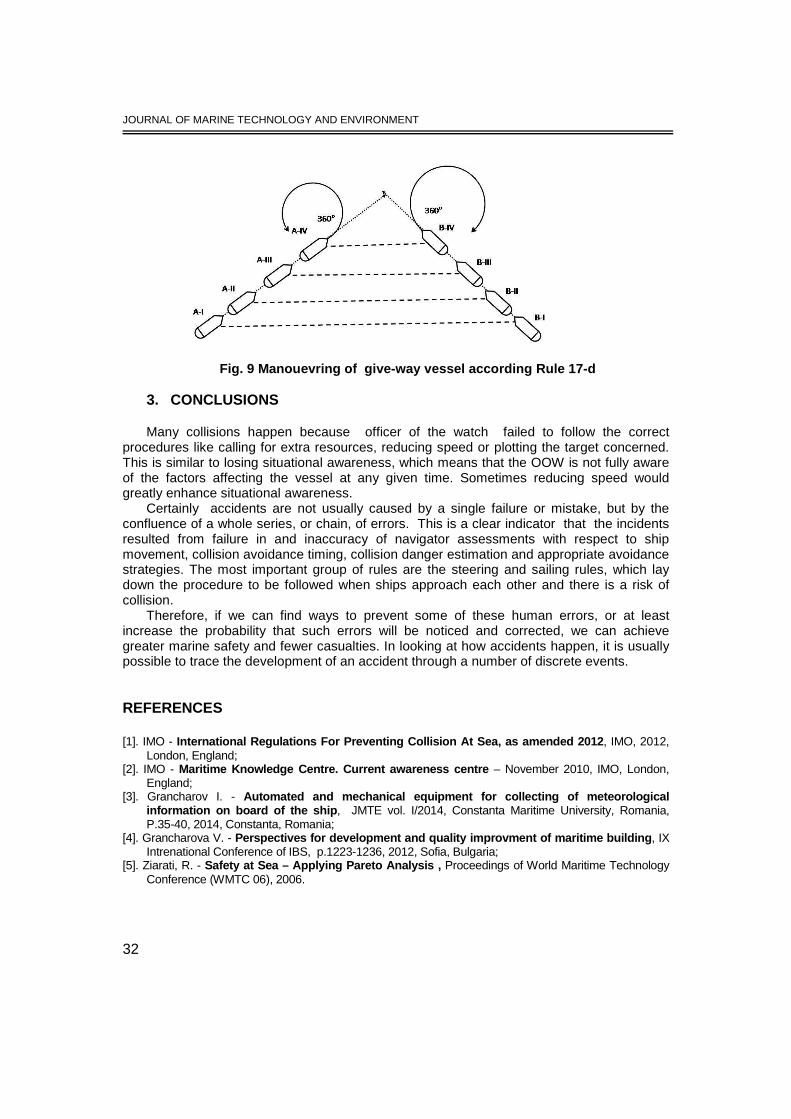
Fig. 9 Manouevring of give-way vessel according Ru le 17-d
3. CONCLUSIONS
Many collisions happen because officer of the watch failed to follow the correct procedures like calling for extra resources, reducing speed or plotting the target concerned. This is similar to losing situational awareness, which means that the OOW is not fully aware of the factors affecting the vessel at any given time. Sometimes reducing speed would greatly enhance situational awareness.
Certainly accidents are not usually caused by a single failure or mistake, but by the confluence of a whole series, or chain, of errors. This is a clear indicator that the incidents resulted from failure in and inaccuracy of navigator assessments with respect to ship movement, collision avoidance timing, collision danger estimation and appropriate avoidance strategies. The most important group of rules are the steering and sailing rules, which lay down the procedure to be followed when ships approach each other and there is a risk of collision.
Therefore, if we can find ways to prevent some of these human errors, or at least increase the probability that such errors will be noticed and corrected, we can achieve greater marine safety and fewer casualties. In looking at how accidents happen, it is usually possible to trace the development of an accident through a number of discrete events.
REFERENCES [1]. IMO - International Regulations For Preventing Collision At Sea, as amended 2012 , IMO, 2012,
London, England; [2]. IMO - Maritime Knowledge Centre. Current awareness centre – November 2010, IMO, London,
England; [3]. Grancharov I. - Automated and mechanical equipment for collecting o f meteorological
information on board of the ship , JMTE vol. I/2014, Constanta Maritime University, Romania, P.35-40, 2014, Constanta, Romania;
[4]. Grancharova V. - Perspectives for development and quality improvment of maritime building , IX Intrenational Conference of IBS, p.1223-1236, 2012, Sofia, Bulgaria;
[5]. Ziarati, R. - Safety at Sea – Applying Pareto Analysis , Proceedings of World Maritime Technology Conference (WMTC 06), 2006.

JOURNAL OF MARINE TECHNOLOGY AND ENVIRONMENT
33
THE CHALLENGE OF BUILDING GREENFIELD TERMINALS
GRANCHAROVA VALENTINA
“Nikola Vaptsarov” Naval Academy, Varna, Bulgaria
The challenge for the container terminals now is to serve fewer but very large calls. The large cargo quantities to be handled in a short period of time are a challenge for the whole chain from ship to gate. The newly build terminals (greenfield terminals) should have lower environmental impact and high rate of automation and energy efficiency. Therefore terminal and process automation has been steadily gaining ground over the last decade and are unalterable part of today’s container terminal. Automation is a credible option offering new possibilities for operational control and visibility with reduced operating costs and enhanced service excellence. The choice for terminal concept and building of terminal operation system especially in greenfield terminals influence for the future extension of the terminal. Both mainly depend on the size of vessels, which are planned to anchorage at the terminal berth and on expected cargo flow through the terminal for certain period of time.
Keywords: container terminals, process automation, container handling.
1. INTRODUCTION
The major trends in world trade are increasing size of containers vessels and reducing
the number of port calls. Variuos technology and equipment combinations can be applied after detailed studiyng and defining the requirement of port operator. Terminal operating system (TOS) solutions have now become standard for most terminal operations around the world. The integration of renewable energy and alternative fuels within the industrial and transport sector and also within the port are has been greatly encouraged (Way K.W., 2009). This make automation and introducing of terminal operation system integral part of current port.
2. DECISIONS FOR TERMINAL AUTOMATION Looking for maximum profitability in greenfield and brownfield ports engender the
necessity of detailed analysis of operations performed in the different terminal areas. Port operators in last years prefer using of automated cranes and electrically powered vehicles(Carteni A., St. de Luca, 2010). Therefore the analyse of performed terminal operations will ensure actual information whether the implemented equipment and automation will provide high quality levels of work and necessary data accuracy and process control.The choice of concept for terminal operations and equipment configurations is related with taking decision of following tasks:
• optimization performance of cranes and supporting vehicles;

JOURNAL OF MARINE TECHNOLOGY AND ENVIRONMENT
34
• defining the suitable location of yard stacking area based upon equipment work-load, available positions, etc.;
• interfacing and control external trucks for avoiding long waiting times; • ensuring preview of whole terminal operations in remote control room; • providing an overview of the terminal status to the operator.
The decision also should be taken based on results from criteria, shown in Figure 1.
Fig. 1 Criteria for choosing of terminal concept As new large container terminals are being built in many places, yard automation is
already an accepted technology with proven benefits, helping drive the change in mindsets towards increased acceptance of automation concepts. The selected concept should be flexible and to have option for performing of partly changes and combination, which will provide possibility of future terminal growth. Automation of small terminals is also an option to help manage the competition. Midsized container terminal could begin automating its operations with an automated yard cranes(straddle carriers) for a relatively small initial investment. In the future few ASC blocks could be introduced for increasing stack density.
Expected quantity of cargo flow and size of handled vessel are very important for approaching of automation and reaching the necessary service level. The grade of automation depends on actual state of terminal (in phase of building or extension), equipment (available or planned for introducing) and requires carefully analysis.There are different approaches for automation, depending current terminal state and phase of introducing:
- automation from the beginning of building (greenfield terminal); - upgrade of existing system of automation (brownfield terminal).
Full automation in greenfield terminals offers new opportunity for operational control and visibility with low operating costs and good quality of service.
Automation of crane operation let easy adaption to cargo flow changing and possibility to increase speed of crane movement per hours. Nowadays automation of STS crane lead to 25-30 movement of containers per hours (ABB Crane System, 2011). Using automated cranes on quay front area and stacking are make possible:

JOURNAL OF MARINE TECHNOLOGY AND ENVIRONMENT
35
1) implementation of different system for easy container identification and weighting such as Radio Frequency Identification and Optical Character Recognition;
2) continuous loading/discharging, which is very important for reducing the time of vessel’s stay at berth;
3) automation of container landing processes on platforms, ground and vehicles; 4) increasing crane capacity with systems for multiple handling like double trolley and
double hoist; 5) lifting of working crane height up to 50 meters for handling larger container ships from
“triple E” class; 6) moving the operators from the crane cabin to the remote control room. For performing of yard operation and assuring of good service of landside transportation
terminals are equipped with automated stacking cranes. Implementation of automated cranes in combination with AGVs make possible container moving without using any manned machine in the process and ensure timely delivery of container to the quay front or to truck or rail terminal. The performed yard operations are controlled from a distance by means of terminal management system.
Terminal Operating System (TOS) and its interaction with the equipment control system are essential for increasing of efficiency in automated terminals. The automation improve operational quality of service in terminal by decreasing the period of handling and to facilitate for remote control of cargo operations, ensuring more efficient movement of container from vessel through the yard and gate (see Figure 2).
Fig. 2 Terminal automation Introdution of effective terminal management system allow to operators viewing real-time
vessel traffic in a single, convenient display, gain access to every aspect of an actively managed incident in userdefined safety zones, and share realtime information and reporting with remote participants and other operation centres to drive compliance and create incident reports.The connection and real-time information flows between the TOS and the terminal equipment, applied by equipment control system, which enable management of all operational processes related to equipment. Decisions for movement are made by related system algorithms and models. Software of TOS and work models allows easy configuration, adaptation and support in fully compliance with fundamental priciples of terminal design. The systematic choice of location and information exchange between equipment requires more exact rapid information networking than the traditional container terminal. Moreover integrating multiple terminal operating systems in one complex system enables this port system to manage the holistic planning of all operational processes related to equipment moves whilst simultaneously overseeing operational decisions.

JOURNAL OF MARINE TECHNOLOGY AND ENVIRONMENT
36
Assuring an effective transition towards the use of energy sources with lower environmental impact in terms of greenhouse gas (GHG) emissions is also one of the requirements of European Commission. The main tasks, which should be performed for improvement of terminal power consumption of existing port container terminals are:
- quantifying the amount of energy consumed and its location; - analyzing possibility for using of eco-efficient facilities and innovative technologies for increasing terminal productivity.
Port automation is in fully compliance with above mentioned requirements of European Commission, because reduce the disposal of exhausted gases and ensure uninterrupted production and maximum profitability. Automation of terminal operation and using of modern technique with lower energy consumption and set a question for qualification of the port working staff (Paul Scott Abbott, 2011). The personnel, working in remote control centres in container terminal should be high qualified in order to make decisions and to play an active role in planning, monitoring, analysing and controlling highly advanced operations. New system architecture, modern software technologies, simulation programs for testing are helping to address the challenge of providing functional consistency independently of selected terminal concept and equipment configuration.
3. CONCLUSIONS Introducion of automation and terminal operation system are very important and integral
part of current port. The process automation makes possible adopting of STS cranes to the indented level of productivity.
Implementation of new technologies in existed (brownfield) terminals especially for these with partially automation is matter of optimizing operations and can lead to alteration of operational concept. One of the requirement by automation in brownfield port is the compatibility between new and existed equipment and their operating system.
The role of humans in container process handling are very different from the requirements for the traditional container terminal operator, because automation of processes allows using the full capacity of all cranes, locating at terminals. Automation demands a high level of qualification and intellectual skills in personnel working at control centres in container terminals.
Summary, the main benefits of automation in terminals are: 1) the ability to reduce energy consumption and labour costs; 2) improvement of safety and performing more efficient movement of containers to and
from a vessel and through the yard and gate.
REFERENCES [1]. ABB Crane System - Remotely controlled STS crane, Port Technology N. 52/2011, London, p.42-43;
2011 [2]. Carteni A., St. de Luca – Analysis and modelling of container handling equipment activities,
European Transport No. 46/2010, , p.52-71, 2010 [3]. Paul Scott Abbott – Technology delivers productivity in cost-effective, eco-friendly way, APPA
Seaports Magazine, 2011 [4]. Way K.W. - The Changing Nature of Port Infrastructure and Port Management, University of
Singapore, 2009

JOURNAL OF MARINE TECHNOLOGY AND ENVIRONMENT
37
SPECIFICS OF CHEMICAL TANKERS FLEET AND ITS MARKET OUTLOOK
1GUNES ERGUN, 2DIMITAR DIMITRAKIEV, 3ALEKSANDAR SIRAKOV
1,2,3“N. Y. Vaptsarov” Naval Academy, Varna, Bulgaria
This paper introduces a general outlook of the chemical tanker market and examines the performance of chartering contracts over the period 2008 to 2013. The number of the liquid chemical cargoes has increased enormously since at the early days, the tanker market was expressing only for carriage of petroleum products. As long as the number of the carriage of chemical cargoes by sea are growing up rapidly, the study aim is to clarify peculiar and main characteristics of these tankers. Although, the big part of these chemical cargoes are extremely dangerous to the environment as well as to the life of the seafarers, it may be considered as a small risk due to the very high standards required regarding safety.Apart of the technical point view, the chemical tanker market is forecasted and expected to recover and improve in/after 2014. The main evidence for this theory is that declining fleet growth, shrinking tonnage growth and increasing seaborne trade. Due to these influences, the market gives positive forecast for its short and near future. However, the chemical products market is still weaken enough and presently demand is still shaky, but due to the limited order books, it could be considered as a positive sign in medium period. Nevertheless, the fleet is still in overcapacity and expectations for improving is at the end of 2014 or later on. The purpose of this paper is to study on the present market and strive to forecast the future chemical tanker market situation.
Keywords: chemicals tankers, tanker market, regulations, tanker outlook
1. INTRODUCTION Chemical tankers are required to transport a wide range of different cargoes, and many
tankers are designed to carry a large number of segregated products simultaneously. The operation of chemical tankers differs from any other bulk liquid transportation operations, in that on a single voyage a large number of cargoes with different properties, characteristics and inherent hazards may be carried. Moreover, in port several products may be handled simultaneously at one berth, typically including different operations such as discharge and loading as well as tank cleaning. Even the less sophisticated chemical tankers are more complex to operate than oil tankers. Transportation of bulk chemicals by sea not only requires specialized ships and equipment, but also peculiar crew training, both theoretical and practical, in order for those involved to understand the characteristics of the various chemicals and be aware of the potential hazards involved in handling them. A particularly important aspect of this requirement is the provision of a data sheet, or cargo information form, giving details specific to a substance, to be held on board whenever that substance is carried by the vessel.

JOURNAL OF MARINE TECHNOLOGY AND ENVIRONMENT
38
A modern chemical tanker is primarily designed to carry some of the several hundred hazardous products now covered by the IMO Bulk Chemical Codes [1]. The following general types of chemical carriers have developed since the trade began:
• Sophisticated parcel chemical tankers
Typically up to 40,000 deadweight with multiple small cargo tanks - up to 54 - each with an individual pump and a dedicated pipeline, to carry small parcels of high grade chemicals. These ships have a significant proportion of the cargo tanks made with stainless steel, allowing maximum flexibility to carry cargoes that need their quality safeguarded.
• Product / chemical tankers
Similar size to parcel tankers but with fewer cargo tanks, mostly of coated steel rather than stainless, and less sophisticated pump and line arrangements. Such ships carry the less difficult chemicals, and also trade extensively with clean oil products.
• Specialized chemical carriers
Small to medium sized ships, often on dedicated trades and usually carrying a single cargo such as an acid, molten sulphur, molten phosphorus, methanol, fruit juice, palm oil and wine. Cargo tanks are coated or stainless steel according to the trade.
2. REGULATIONS Carriage of chemicals in bulk is covered by regulations in SOLAS Chapter VII - Carriage
of dangerous goods and MARPOL Annex II - Regulations for the Control of Pollution by Noxious Liquid Substances in Bulk. Both Conventions require chemical tankers built after 1 July 1986 to comply with the International Code for the Construction and Equipment of Ships carrying Dangerous Chemicals in Bulk (IBC Code). The IBC Code provides an international standard for the safe carriage by sea of dangerous and noxious liquid chemicals in bulk. To minimize the risks to ships, their crews and the environment, the Code prescribes the design and construction standards of ships and the equipment they should carry, with due regard to the nature of the products involved. In December 1985, by resolution MEPC.19 (22), the Code was extended to cover marine pollution aspects and applies to ships built after 1 July 1986 [2].
In October 2004, IMO adopted revised MARPOL Annex II Regulations for the control of pollution by noxious liquid substances in bulk. This incorporates a four categorization system for noxious and liquid substances and it entered into force on 1 January 2007. Consequential amendments to the International Bulk Chemical Code (IBC Code) were also adopted in October 2004 [3], reflecting the changes to MARPOL Annex II. The amendments incorporate revisions to the categorization of certain products relating to their properties as potential marine pollutants as well as revisions to ship type and carriage requirements following their evaluation by the Evaluation of Hazardous Substances Working Group.
Ships constructed after 1986 carrying substances identified in chapter 17 of the IBC Code [4], must follow the requirements for design, construction, equipment and operation of ships contained in the Code

JOURNAL OF MARINE TECHNOLOGY AND ENVIRONMENT
39
IMO types chemical tankers
Ships subject to the Code shall be designed to one of the following standards:
• Type 1 ship is a chemical tanker intended to transport chapter 17 products with very severe environmental and safety hazards which require maximum preventive measures to preclude an escape of such cargo.
• Type 2 ship is a chemical tanker intended to transport chapter 17 products with appreciably severe environmental and safety hazards which require significant preventive measures to preclude an escape of such cargo.
• Type 3 ship is a chemical tanker intended to transport chapter 17 products with sufficiently severe environmental and safety hazards which require a moderate degree of containment to increase survival capability in a damaged condition.
Thus, type 1 ship is a chemical tanker intended for the transportation of products
considered to present the greatest overall hazard and type 2 and type 3 for products of progressively lesser hazards. Accordingly, type 1 ship shall survive the most severe standard of damage and its cargo tanks shall be located at the maximum prescribed distance inboard from the shell plating.
SHIP TYPE 1 SHIP TYPE 2 SHIP TYPE 3
Fig. 1 IMO Chemical Tankers Types 1, 2 and 3
The Figure 1 shows that the cargoes intended to be carried with Ships Type 1 that the
locations shall located at a minimum distance from the ships side shell plating of B/5 or 11.5m, whichever is less. At the vertical distance from the moulded line of the bottom shell plating at center line not less than B/15 or 6m, whichever is less but not less than 760mm from the shall plating.
The cargoes tended to be carried with ships type 2, shall be loaded into the tanks which is located at e vertical distance from moulded line of bottom shall plating at centerline of B/15 or 6m, or whichever is less, but not less than 760 mm from the shall plating.
For ship Type 3, there is no restriction in respect of the cargo tank location.
3. TANKER MARKET OUTLOOK Since second part of 2008, the chemical tanker market has negatively been affected due
to the global crisis and many of the owner postponed their new buildings and cancelled their

JOURNAL OF MARINE TECHNOLOGY AND ENVIRONMENT
40
investment into the chemical tanker market. However, due to the high level of freight until this date, many orders had already been given and many new building vessels entered into the market, which was one of the most important reason for breaking the supply & demand curve.
Fig. 2 Number of Tankers by types up to 2013 [5] [6]
Data Source: Clarkson, Jefferies As the Figure 2 shows that the dominant market in respect of the number of the tankers
into the wet market is chemical tankers. Having look into the percentage of the number of the tankers, we can consider in case the total amount is 8392, it may be considered the chemical market cover 49%, the refined petroleum tanker market (Product Market) cover 28% and finally crude oil tankers market cover 23% of the market.
Fig. 3 Tanker fleet capacity by type up to 2013 [6] Data Source: Jefferies
In regard with the tonnage carried, the Figure 3 shows that the dominant market is Crude Tankers fleet.

JOURNAL OF MARINE TECHNOLOGY AND ENVIRONMENT
41
Drawing attention that the total carried wet tonnage is 507.9 Million DWT, we may say that the crude market covers 68% of the wet market, which is followed by product tankers with %22 and Chemical Tanker market with roughly rate 10%.
Fig. 4 Number of chemical tankers by size up to 2013 Data Source: Clarkson Total number of chemical tankers is 4139, dominant is position of carriers 0-20000 dwt [7]
Fig. 5 Chemical tanker fleet capacity by size up to 2013
Data Source: Clarkson
4. CHEMICAL TANKER MARKET
The Chemical tanker market has lost acceleration in last few years as demand has failed to comply with supply and demand growth. Actually the demand growth was largely driven by Asian demand which was projected to increase. With depressed freight markets, owner’s orientations for building new vessels seems to have disappeared. In 2013 the gap between supply and demand was narrowed a bit and this narrowing of the gap between supply and demand has and will be supported the rates and values in the short and medium term.

JOURNAL OF MARINE TECHNOLOGY AND ENVIRONMENT
42
Having look into the trend, the expectation for the chemical trade for increasing is in positive ways. The reason for that would be especially the expansion of the refineries into the Middle East, which can be considered as a driver of the CPP as well as chemical trade flows into the region [8][9][10].
It should be drawn deep attention that the demand growth for chemical cargoes is strongly correlated to global GDP growth [11].
Table 1 Gross Domestic Product growth real and as expected to 2015 As expected
GDP Growth
2011 2012 2013 2014 2015
World %4 %3.2 %3.3 %4 %4.4 Real growth
GDP 2008 2009 2010 2011 2012 2013 World 1.5 - 2.2 4.1 2.8 2.2 2.1
Data: Maritime transport review 2013
Growth rate in supply and demand correlated until 2007 and also expected supply and demand equilibrium was expected in 2014-2015, as shown in the figure. Fortunately these expectation are based on the expected growth of GDP.
Fig. 6 D& S growth on chemical tankers market as expected for 2014 and 2015 [12] Data Source: Eitzen Chemical based on industry sources
Even though, the reports show us that the new orders for chemical tankers are almost stopped, it also should be considered the demand growth is also slowed down, thus the Fig. 7 demonstrate that the actual equilibrium of the market will be in force after certain years.
JOURNAL OF MARINE TECHNOLOGY AND ENVIRONMENT
43
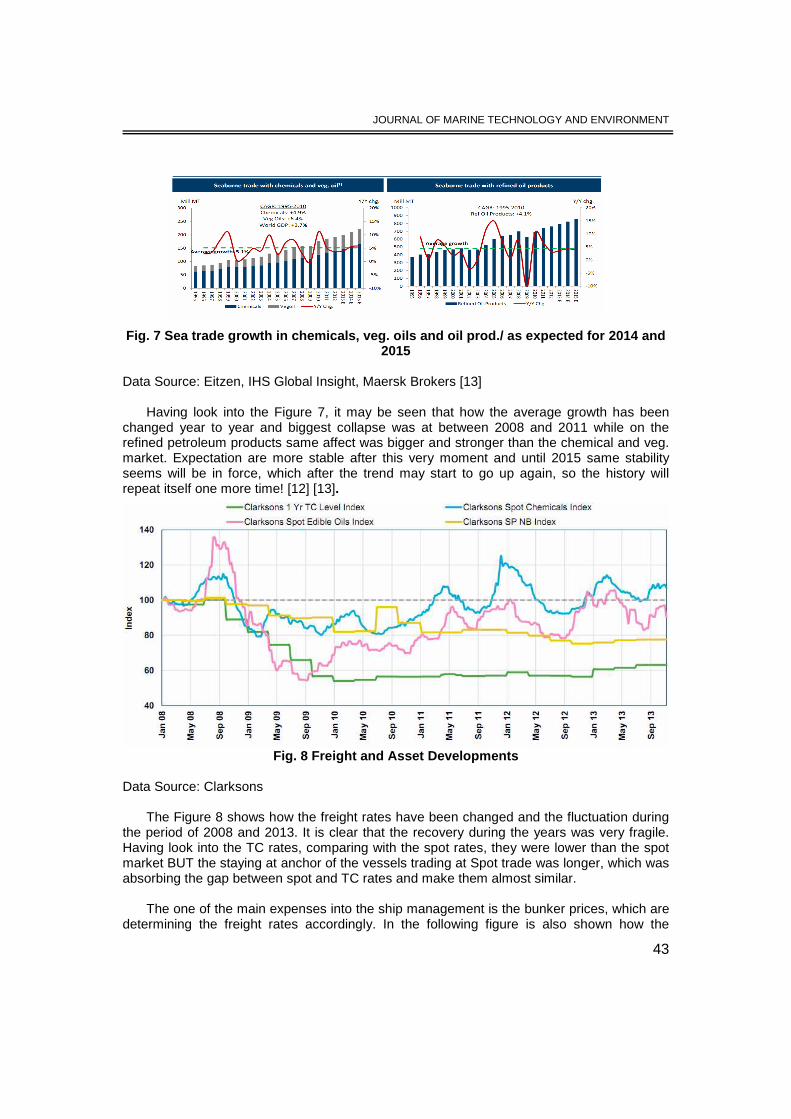
Fig. 7 Sea trade growth in chemicals, veg. oils and oil prod./ as expected for 2014 and 2015
Data Source: Eitzen, IHS Global Insight, Maersk Brokers [13]
Having look into the Figure 7, it may be seen that how the average growth has been changed year to year and biggest collapse was at between 2008 and 2011 while on the refined petroleum products same affect was bigger and stronger than the chemical and veg. market. Expectation are more stable after this very moment and until 2015 same stability seems will be in force, which after the trend may start to go up again, so the history will repeat itself one more time! [12] [13].
Fig. 8 Freight and Asset Developments Data Source: Clarksons
The Figure 8 shows how the freight rates have been changed and the fluctuation during the period of 2008 and 2013. It is clear that the recovery during the years was very fragile. Having look into the TC rates, comparing with the spot rates, they were lower than the spot market BUT the staying at anchor of the vessels trading at Spot trade was longer, which was absorbing the gap between spot and TC rates and make them almost similar.
The one of the main expenses into the ship management is the bunker prices, which are determining the freight rates accordingly. In the following figure is also shown how the

JOURNAL OF MARINE TECHNOLOGY AND ENVIRONMENT
44
bunker prices have been fluctuated during the determined period and maybe from the point of the view of the freight, the reason why the crisis became. The rates of the bunkers have been increased but the freight rates were stand at the same level even less due to the oversupply.
Fig. 9 Bunker & Crude Developments
Data Source: Clarksons
As is known the market is repeating itself in a certain period of time. At the end of the 5 years of a deadly market for the owners, its again coming the time for the freights to cross roads of a new cycle, means the freight direction to be up trends. Briefly the demand for the vessels is declining which is followed by recycling and later again demand for long-haul transportation is rising. So All areas are expected to improve in 2014 [14] [15].
5. CONCLUSIONS
The chemical cargoes are extremely dangerous for handling as well as for environmental area. Thus it must be comply with all national and international conventions and rules regarding safety and environment protections. However, the history of the chemical tankers has been started around 1950, when there was not more chemical cargoes and existed cargoes were carrying by the product tankers. By increasing the chemical cargoes, there became a need for a special tankers to carry them and also to have necessary protecting measurements due to the manners of the cargoes. Nevertheless the cargoes are extremely dangerous, especially the new buildings tankers may be considered as a small risk due to the very high standards, which the tankers and the seafarers must comply with. On the other hands, due to the absent of the necessary number of tankers into the market, the freight rates were extremely high and amortization of the tankers was returning in a considerable period of time. But, due to the oversupply vessels into the market in a very short time, the freight rates decreased a lot and thus the owners became in a very difficult situation. The purpose of this paper is to study on the present market and strive to forecast the future chemical tanker market situation.

JOURNAL OF MARINE TECHNOLOGY AND ENVIRONMENT
45
Also it should be drawn attention on that this study on the chemical tanker market has been done by the data taken as well as extracted from shipbroking and chartering companies, who are offering statistical and research service to the practitioners into the shipping and to the all maritime industry. Also this publication tried to highlights fleet database such as seaborne trade, freight rates, and fleet size in the chemical tanker market.
It is obvious that the chemical cargoes by ships is technically is different than oil transportation. In general, the chemical tankers are more complex comparing with product tankers and due to this complexity in 2007 Marpol annex II re-classified the chemical cargoes as X, Y, Z and OS (Other Substances) and ships types as IMO Tank I, II and III, which have observed the convention as Pollution category and ships type requirements. The main requirements of this change was that all chemical shipments to comply with IBC Code.
As a result, reducing of the new buildings and healthy demolition will affect the chemical market positive and hopefully for the ship-owners. At the glance seems that the stainless steel chemical tankers freights are the almost same with the coated once, which will make sense to the investor/ ship owner to decline for such investment.
Current earning levels are not sustainable and major factor after supply and demand influences is the political conditions at Middle East and especially Iran, which is very important player of the market, which keep the tension in high level. Regulatory changes such as ECAs (Emission Control Area) as well as Ballasting Water Management, may bring some implications on the rates also. It should be noted that 68% of the general tanker market is by the chemical tankers, which covers considerable high percentage into the market. After this study, it has been noted also that the dominant market within the chemical market is the size between 10-20000 DWT tonner’s chemicals, which is followed by the MR tankers.
Another result after this study is that the Global economic conditions are expected to improve from 2014 onward as long as the GDP is growing and same will be reason for demand for such [16]. The chemical market almost reached the breakeven point which means the freight should start to have trends up. As per practitioners the dominant and favorable tonnage in the chemical tankers will be MR size which is the bigger than 40000 DWT tonners.
Forecast is that in the middle future the chemical tanker owners will start to dominate the charter party terms again.
REFERENCES [1] Arun Sharma, - Statutory surveys course MARPOL 73/78 Annex II & The chemical codes, Shanghai December 2009 [2] Rules for classification of ships / Chemical Tankers / DNV [3] International code for the construction and equipment for ships carryingdangerous chemical in bulk, 1983 [4]http://www.lr.org/compliance/codes/175364MARPOLAnnexIIandtheIBCCode.aspx [5] Patrick Curry, Sinan Berdan - Specialised Products Market Outlook 2014 & Beyond, [6] Presentation of Crude, Product and Specialty Tankers by Jefferies LLC, 06/19/2013 [7] https://www.fatsandoils.org/wp-content/uploads/2013/10/Panel-Discussion-2013-Brian Cleary.pdf

JOURNAL OF MARINE TECHNOLOGY AND ENVIRONMENT
46
[8] http://www.cefor.no/Documents/About%20Cefor/2013/Jonas%20Kraft %20%20Shipping%20market%20outlook.pdf
[9] http://www.marinemoney.com/sites/all/themes/marinemoney/forums/SIN12/ presentations/Day1/1118%20Domenik%20Nizet.pdf
[10] http://hugin.info/137124/R/1703597/563175.pdf [11] http://www.navigateevents.com/pdf/pdf_1363195568.pdf [12] http://www.brs-paris.com/annual/annual-2013/pdf/05-chemical-a.pdf [13] http://www.shippingherald.com/Admin/ArticleDetail/ArticleDetails
Analysis/tabid/115/ArticleID/9077/Chemical-tanker-market-improves-as-orderbook-shrinks.aspx
[14] https://www.fonasba.com/wp-content/uploads/2012/10/Chemical-Market-Report.pdf [15] http://www.shipfinance.dk/en/Publications/Download/~/media/Shipping-Market-
Review/Shipping-Market-Review-October-2012.ashx [16] http://unctad.org/en/publicationslibrary/rmt2013_en.pdf

JOURNAL OF MARINE TECHNOLOGY AND ENVIRONMENT
47
FINITE DIFFERENCE TIME DOMAIN METHOD FOR ACOUSTIC WAVES IN ATTENUATE AND ABSORPTIVE MEDIUM FOR LAYERED
UNDERWATER ACOUSTIC ENVIRONMENTS
1JAWAD LAKZIZ, 2SOFIANE OTMANE, 3SAID OUASKIT, 4RACHID EL GUERJOUMA
1,2,3Université Hassan II, Faculté des Sciences Ben M’Sik, B.P. 7955-Sidi Othmane Casablanca, Marocco, 4Université du Maine, Avenue Olivier Messiaen, France
In this work, we use Finite Difference Time Domain (FDTD) method to investigate the underwater acoustic wave propagation problem; in order to understand the acoustic wave propagation properties and determining the effects of the attenuation and absorption for the sound intensity in the sea. The results are presented for calculated Transmission Loss (TL) of propagating acoustic waves in layered underwater acoustic environments by using Finite (FDTD) method. In a first step; the sea environment are modeled as one layered medium before generalizing the resolution to two layered (fluid-fluid and fluid-solid) medium. The sea surface and the sea bottom are considered to be planar surfaces. The discretized acoustic wave equations are used in the algorithm of the FDTD method and Perfectly Matched Layer absorbing boundary condition is applied to eliminate numerical reflections from the ends of the grid .Two cases are discussed (Taking account of absorption and attenuation).The good performance of this method is validated with the results of BELHOP program and by comparison with the analytical method.
Keywords : FDTD, Transmission Loss (TL),attenuation, Absorption, PML.
1. INTRODUCTION The main effect of propagation of acoustic waves in water is the decrease of the signal
amplitude by absorption.This due to the chemical properties of sea- water,and is a definite factor of the propagating waves.In particular this is a limiting factor to reach high frequencies domain. The estimation of propagation losses is a very important factor in the evaluation of sonar system performance.The underwater propagation medium is usually limited by two well-marked interfaces:the sea surface (water/air) and the bottom (water/solid). Consequently, the propagation of an acoustic signal is accompanied by interferences and reflections; which give rise to bursts and replicas of the primary signal at high frequency and special field of stable interference at low frequencies. These unwanted interferences are common sources of trouble for reception and exploitation of useful signals. The Finite Difference Time Domain (FDTD) approach is rapidly becoming one of the most widely used computational methods in electromagnetic, capable of computing electromagnetic interactions for problem geometries that extremely difficult to analyze by other methods [1].In this paper, the Finite Difference Time Domain (FDTD) Method is proposed to calculate the propagation of sound in shallow water. The recent development of computer system enables the method to be applied in acoustics takes account of attenuation and absorption [2]. For

JOURNAL OF MARINE TECHNOLOGY AND ENVIRONMENT
48
underwater acoustics problems the starting point is the Helmholtz equation, which is have many approximations introduced such as: The ray trace [3], FFP (Fast field program) [4], PE(Parabolic equation) [5], or once again the direct numerical solution of Navier stockes (DNS) [6]. For the research environment the parabolic equation PE provides the best compromise between accuracy and efficiency for such problem[7]. The analytical validation is taken from knightly and from Vefring MjØlsne [8]. It involves a homogeneous waveguide of constant depth with a pressure-release surface and a rigid bottom. These parameters yield a maximum of 27 modes witch propagate up to about 84 from the horizontal. In the other hand in order to calculate the amplitude of pressure (P), with respect to depth and range, we use Bellhop program which is a Gaussian beam tracing to find the transmission loss (TL) using an isospeed sound velocity profile[9]. We note that the bellhop popular code is especially used in the cases of two layered under water environment (fluid-solid). In this work The FDTD algorithm is validated both by analytical solutions based on the parabolic equation PE and numerical results provided by the Bellhop program at frequencies as high as 1 kHz for two dimensional problems.
2. FDTD FORMULATION
2.1. Basic equations 2.1.1. Taking account of absorption Two fundamental acoustic equations are numerically solved by using the FDTD method
[1] satisfy the basic Newton’s law of motion and equation of continuity
ρ(r)∂v(r, t)
∂t= −∇p(r, t) (1)
),()²()(),()²()(),( trvrcrtrprcrtrt
p ∇−=+∂∂ ργ (2)
Where p(r,t) is the spatial and the time dependent acoustic pressure field (N/m²), v(r,t) is the
particle velocity (m/s),
)(rρ : is the density (kg/ m3),
)( rγ : is the absorption coefficient, c(r) is the sound speed (m/s.
This absorption coefficient is related to the attenuation coefficient ),( wrα
by using the complex wave number:
),(),(/)/(),( '2/122 ωαωωωγωω rircicrk +=+= −,
c’(r,ω) is the dispersive wave velocity. 2.1.2. Taking account of attenuation The basic equation of the FDTD method, which is taking account attenuation are given
as follows:

JOURNAL OF MARINE TECHNOLOGY AND ENVIRONMENT
49
y
p
t
v y
∂∂−=
∂∂
ρ1
( ) ( ) ( ) ( )trrtrptrt
,,, υηυρ +∇=∂∂− (3)
( ) ( )trtrtp
K,, υ∇=
∂∂− 1 (4)
with )( rρ ,p(r,t) and v(r,t) are defined as in the first case (taking account of absorption).K is
the bulk modulus, )( rη is the particle velocity and must be decided to take account of
influence of absorption by the media. )²()(K rcrρ= ,
)()(²2²1
212)( rcrr ρ
γγγγη
−=
, γ1
is the wave number and γ2Is the attenuation constant in dB/km [10].
²100.3²4100
²44
²1
²11.0103.32 43
khzkhz
khz
khz
khzfx
f
f
f
fx −− +
++
++≈γ
. 2.2. Discretization principal
The FDTD equations derived from (1) to (4) are discretized in time and spice to obtain
the update equations given as follow.
2.2.1. Absorption case:
2.2.2. Attenuation case:
)),()((1
tyvry
p
t
vy ηρ
+∂∂−=
∂∂
x
p
t
vx
∂∂−=
∂∂
ρ1
))(²()(),,()²()(),,(y
v
x
vrcrtyxprcrtyx
t
p yx
∂∂
+∂∂
−=+∂∂ ργ
)(),,(y
v
x
vKtyx
t
p yx
∂∂
+∂
∂−=
∂∂
)),()((1
txvrx
p
t
vx ηρ
+∂∂−=
∂∂

JOURNAL OF MARINE TECHNOLOGY AND ENVIRONMENT
50
3. NUMERICAL CONSIDERATIONS The FDTD cell size is myx 9375020 ./ ==∆=∆ λ are chosen for 80 Hz frequency
( λ is the wavelength) in the construction of the spatial FDTD grids for evaluation of the geometrical problem details, properly with the time step: ( )cxt 2/∆=∆ , (where c is the speed of sound in the water). The real physical dimensions of the problem space are 60m x 1000m. And the total number steps are 4000. The real physical dimensions of the problem space are 60mx1000m. And the total number steps are 4000.The bottom layer is in 20 m of depth for fluid-fluid and 40m depth for the fluid-solid media and all of the boundaries except pressure-release sea surface are modeled by PML absorbing boundary condition. Where the source is placed at the 2m depths as shown in the Figure1. Due to the temperature and pressure variations, the velocity of acoustic waves varies specially in the sea, mostly with depth and the paths of acoustic waves are thus refracted depending on velocity variations. In this FDTD simulation, for simplicity reasons, we use respectively isospeed sound velocity profile [9]., and Munk sound speed profile [11].
Fig. 1. Geometrical of the underwater propagating
Fig. 2. The Munk Sound speed profile

JOURNAL OF MARINE TECHNOLOGY AND ENVIRONMENT
51
3. RESULTS
3.1. Taking account with attenuation
Fig. 3. Acoustic FDTD for one layered mefium taking account with attenuation
Fig. 4. Acoustic FDTD for two layers (fluid-fluid) taking account with attenuation
Fig. 5. Acoustic FDTD for two layers (fluid-solid) taking account with attenuation
Fig. 6. Acoustic field distribution for the two lay ers environment (fluid-solid) taking
account with attenuation

JOURNAL OF MARINE TECHNOLOGY AND ENVIRONMENT
52
3.2. Taking account with absorption
Fig. 7. Acoustic FDTD for one layered medium taking account with absorption
Fig. 8. Acoustic FDTD for two layers (fluid-fluid) taking account with absorption
Fig. 9. Acoustic FDTD for two layers (fluid-solid) taking account with absorption
Range (m)
Dep
th (m)
100 200 300 400 500 600 700 800 900 1000
10
20
30
40
50
60
Fig. 10. acoustic field distribution for the two La yers environment (fluid-solid)
taking account with absorption
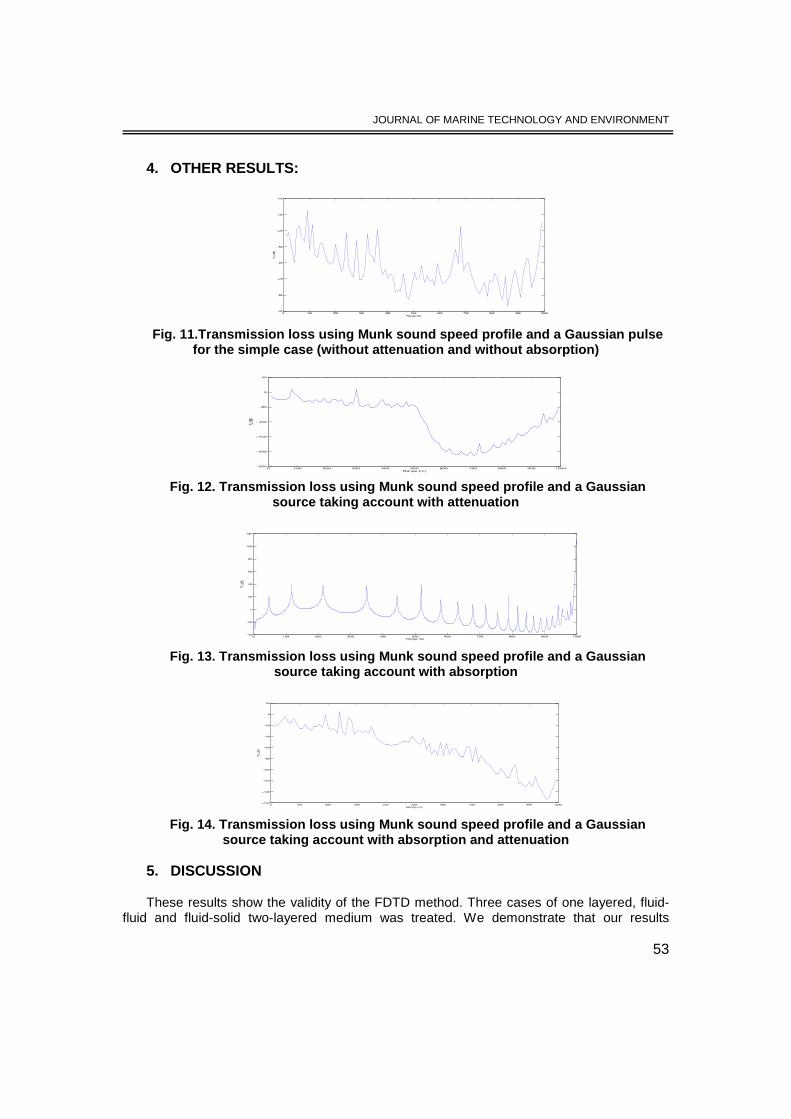
JOURNAL OF MARINE TECHNOLOGY AND ENVIRONMENT
53
4. OTHER RESULTS:
Fig. 11.Transmission loss using Munk sound speed pr ofile and a Gaussian pulse
for the simple case (without attenuation and withou t absorption)
Fig. 12. Transmission loss using Munk sound speed p rofile and a Gaussian
source taking account with attenuation
Fig. 13. Transmission loss using Munk sound speed p rofile and a Gaussian
source taking account with absorption
Fig. 14. Transmission loss using Munk sound speed p rofile and a Gaussian
source taking account with absorption and attenuati on 5. DISCUSSION These results show the validity of the FDTD method. Three cases of one layered, fluid-
fluid and fluid-solid two-layered medium was treated. We demonstrate that our results

JOURNAL OF MARINE TECHNOLOGY AND ENVIRONMENT
54
agrees well with Bellhop method for all cases at high frequencies. Bellhop was chosen for this analysis as “it has proven to be an accurate modeling tool for high-frequency (>1 kHz) transmissions. At low frequencies our Simulation Show also a good agreement with analytical results. We have separately investigated the effect of attenuation related to water viscosity and the dissipative effect related to the absorption coefficient depending on the chemical composition of seawater.
6. CONCLUSIONS
The FDTD method is used to calculate the propagation of acoustic plane wave in shallow water with different environment. The simulation results of the transmission loss pattern are compared with analytical results of parabolic equation (PE) [8] and numerical results of Bellhop code. The FDTD is also able to visualize the propagation of the sound field in the same simulation model. We can clearly see the interference between direct wave and reflected waves.
As a future work, it is aimed to develop FDTD model with more realistic properties of the medium like roughness, temperature and pressure for calculating the TL in more realistic environments using spherical acoustic waves in three dimensions space and extend our study to more realistic sound source.
7. ACKNOWLEDGEMENT
The authors thank Mr NIKOLAI KOLEV PHd from the Naval Academy, Varna, Bulgaria
for support on this work. REFERENCES [1] Kunz,Karl S,Raymound Luebbers, -The Finite Difference Time Domain Method for Electromagnetics , CRC Press LLC, 1993 [2] Erkul Başaran, Deniz Bölükbaş, Sevgi Akgün, Serkan Aksoy, - Finite Difference Time Domain Method as a Validation Tool of Transmission Toss Cal culations for Layered Underwater Acoustic Environments , 2008 [3] Salpmons E.M., - Computational atmospheric acoustic. Kluwer academic publishers, 2001 [4] Gilbert K.E.,White M.J., - Application of the papabolic equation to sound prop agation in a refracting atmosphere, J. Acoust. Soc.Am.85,630-637, 1989 [5] D. Lee and A.D. Pierce, - Parabolic Equation Development in Recent Decade , J.Comp. Acoust. 3, 1995 [6] Colonius T.,Lele S.K., Moin O., - The scattering of sound waves by a vortex: numerical simulations and analytical solutions , J.Fluid Mech. 260, 271-298, 1994 [7] Mordane, Soumia; Maroihi, Kamal L.; ORBI, Abdellatif; Chagdali, Mohamed, - Une formulation parabolique pour la propagation en profondeur finie des ondes de gravité en surface , Oceanologica Acta, Volume 24, issue 3 (May - June,), p. 287-294, Elsevier Science, 2001 [8] Vefring, E.H. and MjØlsnes, S.,- A parabolic equation based on a rational-cubic appr oximation , J. Acoust. Soc. Am., 87,619-623, 1990 [9] J.C. Torres. - Modeling of Hight-freqency Acoustic Propagation in Shallow Water , M.S. thesis, Naval Postgraduate School,Monterey,Ca, 2007 [10] F.B. Jensen, W.A. Kuperman;M.B.Porter,and H. Schmidt, - Computational Ocean Acoustics. New York: Springer- Verlag New York, Inc., 2000 [11] W.H. Munk, P. Worcester, and C. Wunsch, -Ocean Acoustic Tomography . Cambridge: Cambridge University Press, 1995

JOURNAL OF MARINE TECHNOLOGY AND ENVIRONMENT
55
LOADING OF SCRAP-METAL ON SHIP OF «COASTER» TYPE
1KHOMYAKOV VITALIY, 2SAVCHUK VICTOR
1,2Odessa National Maritime Academy; Ukraine
The article is devoted to the technology of carrying of scrap metal on coasters. Scrap metal, being the cargo, possesses characteristics, which should be taken into consideration by navigator at ship loading. The peculiarity of such category of cargo is relatively serious stowage factor. The pile of scrap metal contains various metal components and items of different shape, size and weight. The observations during the voyage have allowed the determination of the following fact: when grab tears some scrap metal off the pile, it destroys or straightens the parts of the cargo that have lain affected by the pressure forces, and while being loaded into the hold, they may change shape and size. This phenomenon is noticed, when the cargo consists of spring products, wire, tin plates and deformed sheet metal. At present to reduce the loss of the space of the hold at the loading of scrap metal the technology of its “compression” with grab, press or other devices is used. The maximum attention should be paid to the process of “compression” as very often it becomes the reason of underloading of the vessel with the scrap metal. At the designing of the coaster vessels for the future fleet the constructive characteristics of the hold are suggested to be reviewed. The possibility to install the special moving metal bulkhead should be foreseen. It will allow making this fleet more specialized and adapted for the carrying of two or more kinds of scrap metal, bulk cargo simultaneously. The ship-owners will obtain wider opportunities for the exploitation of the new fleet at different freight markets.
Keywords: coaster, loading of scrap-metal, transportation of scrap-metal.
1. INTRODUCTION Raising of problem in a general view and its connection with important scientific or
practical tasks. The consumption of different crow-bar exceeds more than 600 million ton/year presently, from which steel-making industry uses 500-550 million ton. Between ports of Europe considerable mass of this load is transported on the courts of type «coaster». Cargo, as a rule, to. If to examine a scrap-metal as cargo, properties which a navigator must take into account ships at a load are inherent him.
The characteristic feature of this category of loads is an in relation to large specific-loading volume. In port a crow-bar is left the different types of transport and to the load of ship warehoused on moorage. Transport descriptions of this raw material dictate organization of transloading of this load in ports and his load on the ships of type «coaster». Volume of load of scrap-iron. At transporting a sea a crow-bar which was high-usage on a ship without an additional compression can be exposed to slump, on occasion considerably.
Formulation of aims of the article (raising of task) Purpose of the article is consideration of technology of loading of scrap-metal for his transportation between ports of Europe on the courts of type (class) «coaster».

JOURNAL OF MARINE TECHNOLOGY AND ENVIRONMENT
56
2. THE INVESTIGATION AND THEORETICAL SUBSTANTIATION If to examine a scrap-metal as cargo, the properties which must be taken into account at
the load of ship are inherent him. Positive and subzero qualities of this raw material dictate his organization of transloading in ports.
In most cases scrap-iron in ports is overloaded by stationary moorings faucets or mobile faucets and power-shovels. All these freight facilities use pyati-eightpetalous (jaw) clamshells or scoops (hydraulic, electro-hydraulic or rope) are closed, half-closed, wide opened and the opened type.
A stack of scrap-metal is different metallic details and articles of different form, size and weight.
Trip supervisions allowed to set that in that moment when a clamshell from the stack of crow-bar tears away bulldoggen part, he destroys or straightens the particles of load, which to it lay under act of forces of pressure, and getting in a hold, they can occupy other position and volume. It is observed, when mass of load consists of spring products, wire material, tin and deformed sheet-metal [3].
It should be noted that than anymore size of clamshell, the less than it will be done loadings cycles, and, consequently, less «splendor» will be devoted a load. A navigator must take into account this aspect, as a volume of load which is on moorage in a state of rest and planned to the load on a ship on preliminary calculations initially contained in the volume of holds, and in the process of loading revealed, that his volume was increased and the planned mass of load can not go in a hold [2].
The observance of all rules of loading, in trips a tendency comes to light to the decline of the use of cargo capacity of ship, from quality of load and ramming of skraba in a hold. As supervisions, declared amount of tons of load, show, which a ship was initially ready to accept on mass and volume, it is impossible to load hard-over. By reason fully chosen cargo capacity became it, I.e. ship, as a rule, choosing cargo capacity, can not choose the indicated carrying capacity, and, as a result, there is a loss of freight for every underloaded ton. The trips of m/v «PLATO» were analysed, when a ship transported scrap (Fig. 1).
Fig. 1. Indexes of load of ship of m/v «PLATO»
Presently for diminishing of loss of volume of freight apartment of ship at loading of scrap-metal technology of his «prelum» is used through a clamshell, the press or other adaptations. It enables to give the same mass of crow-bar other volume which less than

JOURNAL OF MARINE TECHNOLOGY AND ENVIRONMENT
57
primary. Supervisions rotined that effect of «prelum», it will be anymore and brighter expressed then, when he was used to large the masses of load. The shots of clamshell on mass of scrap-metal were arrive at the effect of «prelum». As practice shows, this method smoothly works and allows ships at a load, maximally to use all volume of hold [4].
As a rule, to begin to press a scrap-metal it is possible from the beginning of loading. But here the first ball ofload must be laid out on a height 1,5-2,0 m. whereupon he can be begun to make more compact by shots by a clamshell from above. If the thickness of layer will be less than, a moment from a blow can be passed on the deck of hold and result in its deformation, and details of crow-bar, such as pipes and armature, which at loading was abortively disposed into mass, and became athwart to the deck, can from a blow break through it [1; 3].
Above enumerated moment of specific of overload of load of scrap-metal, will help fully to form the various methods of decision of arising up problems of technology of transportation of scrap-metal. During a trip a ship transported such load once or twice, that allowed to look after and expose moments which reduce the economy of work of fleet. Analysing theoretical sources and recommendations, existing now on the transloading of such type of load and supervisions which were conducted, we will make attempt find the optimum ways of decision for arising up with such load problems.
Next moments behave to the well-known rules of technology of loading. To beginning of loading it is necessary to spare the special attention defence of ship equipment and systems from possible shots the pieces of metal. At the beginning of loading it is recommended to pour out a scrap-metal from a height a more than 0,3 not mcode from payola, but in future - from a height no more than 2 m from the surface of load. Filling of subdeck spaces by the special stow trays or folias must begin at a gap between the lower edge of coaming of hatch and surface of load no less than 3 m [1].
At loading of scrap-metal it is necessary to watch after his even piling on a freight room measure, shut out even the brief exceeding of the possible specific loadings on a deck. In the examined trips to loading there was a crow-bar with plenty of soft metals, without an overall armature and wastes.
If on preliminary calculations a load is not contained in a hold, it is necessary to execute the row of preliminary calculations, and to build the plan of loading, than ship command scorns in most cases. Before loading, it is necessary to ask a shipper once or twice to strike a clamshell on mass of crow-bar, being on moorage for that, that to define as far as he is squeezed at pressure of concrete scoop
Measure depth of cavity from a blow, it is possible to calculate, on how many balls of load it will be necessary to ram mass for the valuable load of all load. Knowing the height of ramming and height of hold, it is possible to expect the amount of balls which will be subject ramming. It should be remembered that these calculations will be exemplary, and to take into account their inaccuracy.
Frequently an error at a load consists in that ramming of load is begun on the finishings stages by loads. It can result in worsening of stability. It contingently that at shots on mass of load, when a hold is practically filled on 3/4, the overhead balls of load crumple only [4].
A compression is not passed evenly on all layer of load to the deck, but made more compact only overhead ball. In future, finishing loading a crow-bar in a hold, and continuing him to press, at the surface of hold the layers of load are formed with a greater closeness, I.e. get the undesirable effect of weight located higher «easy». For avoidance of such phenomenon it is necessary to expect the amount of balls, which will turn out at downloading of concrete hold from a concrete height, and to make more compact a load on every ball, with the even distributing on all area of hold [2].

JOURNAL OF MARINE TECHNOLOGY AND ENVIRONMENT
58
Quality of «prelum» depends on the amount of the made more compact balls of load in a hold at loading in port. This moment is very important, he needs maximally to spare attention, as in most cases he is reason of underloading. As practice shows, most ports are not executed this process for lack of the proper equipment or unwillingness to romp with an additional loading inventory. More frequent than all a crow-bar is loaded a clamshell and the same clamshell press him on motion a load. However it should be noted that neither the scoop of clamshell nor mobile mechanisms of loading technique is intended for such work.
In practice took place to be case, when on m/v «PLATO» transported two parties of load on two different bills of lading, in addition scrap was different kind, and on the terms of charter mixing up them in a hold was forbidden. Reservation in an agreement consisted in that a relation of parties of load on mass must be as 1:3 here coming to load loads are as many as possible. For the calculation of the masses used the freight program. It is difficult to place in a hold cargo without mixing between itself of separate Bill of Lading parties.
3. CONCLUSIONS The trip looking after existing in ports of Europe technology of overload of different
scrap-metal allow to do the followings conclusions: For the decision of such task divisions was used are industrial folias DSP in 2-3 see
thick, which were united between itself in the artificially erected partition. Such method is most rapid and structurally simple. In subsequent divisions can be easily cleaned for the further use or utilize. This method is found by application on the vessel of coaster type with structurally by one hold. Such partitions are ergonomics and comfortable, if subject divisions to party of crow-bar with different metals or for dividing of Bill of Lading parties of load between itself into the shipped parts. But stands to remember that pressing mass of scrap-metal near-by such partition is impossible. If pressure of load both-side will be not identical or at the blow of clamshell mass of load will be moved toward such partition, it can crack.
For the maximal use of freight capacity and tonnage it is necessary preliminary, to beginning of loading, to expect the optimum amount of cycles of «ramming» of load of scrap-metal taking into account his factious composition. At planning of the special terminals for the overload of scrap-metal it is necessary to develop technology of pressing of scrap-metal in the packages of small size («preforms»).
At planning of coaster-ship for the future fleet of World it is suggested to revise the structural features of freight hold and foresee possibility of setting of the special mobile metallic partition, that will allow to do this fleet more specialized and adjusted for transportation two and more types of scrap-metal, loadings and bulk loads simultaneously. For the shipowners it is mean the enlarge possibility of exploitation of new fleet on the different chartered markets. REFERENCES [1].Code of Safe Practice for Cargo Stowage and Securing , IMO, pp. 57, 2011 [2].Egorov G., Tonuc V. - A new generation of ships of coastal navigation // Automation of ship's technical means , scientific & technical collection, edit. #10, Odessa/ONMA, pp. 27-31, 2005 [3].Savchuk V. - The technology of cargo transportation , textbook for cadets and students of maritime higher education institutions , Odessa/ONMA, pp. 241-243, 2008 [4].Snopkov V. - Technology of cargo transportation by sea , textbook for high schools, 3-rd.edition, revised and enlarged supplementary, S.Petersburg, pp.135-140, 2001

JOURNAL OF MARINE TECHNOLOGY AND ENVIRONMENT
59
CONTAINER YARD OPERATION ANALYSIS FOR A CONTAINER TERMINAL
1LOKE K.B., 2A.H. SAHARUDDIN, 3A.R. IBRAHIM, 4I. RIZAL, 5A.S.A.KADER, 6A.M.ZAMANI
1,2,3,4,5,6School of Maritime Business and Management, Universiti Malaysia Terengganu,
Malaysia
This paper studied the key delays factor of container yard for a container terminal. It explored the key delays factor that affected the operating performance of container yard operation. Hence, a survey is conducted and analyzed by SPSS. Descriptive analysis, normality test and reliability test are used to analyze and display the result. The initial result showed that rubber tyred gantry crane, turning for 90o and waiting for prime mover are often happened during the container yard operation. As a conclusion, the handling equipment is the main cause of the delays factor.
Keywords : delays factor; container terminal; container yard operation; operating performance; handling equipment.
1. INTRODUCTION
A container terminal consists of ship operation, quay transfer operation, container yard operation, receipt and delivery operation, and container freight station operation. Each of the operations are influencing by each other (Thomas et al, 1994; Loke, 2007). The faster vessel turnaround time the better performance of a container terminal, and it would encourage vessel calls at the terminal. The vessel turnaround time is highly dependent on ship operation’s handling rate, and the ship operation is affecting by continuous operation. Therefore, to be speeding the ship operation and improving the vessel turnaround time, the delays factor of container yard operation is studied.
2. LITERATURE REVIEW Container yard serves as temporary storage for inbound and outbound containers. The
equipments that serving the container yard are rail-mounted gantry (RMG) crane, rubber-tyred gantry crane (RTG), straddle carriers, mobile harbour cranes, and heavy-duty forklift trucks (Zhang et al, 2002). The number of handling equipment is increase when the stacking height of container stack increases (Kim, 1997). Kim et.al. (1999) recommended model to minimize the number of handling equipment with certain condition, where import containers arrival rate, cyclic pattern of arrival containers and irregular way of arrival containers are considered. Linn and Zhang (2010) proposed a mixed integer program to determine crane deployment frequency and patterns in a planning time horizon to minimize the overall workload.

JOURNAL OF MARINE TECHNOLOGY AND ENVIRONMENT
60
There are two storage system in container yard; namely chassis and grounding. Chassis system storage each container is individually in the ground flood, and grounding system storage the container by stack up them (Chen, 1999). Container terminal may use buffer area to support the ship and container yard operations. As a result, a reduction of 4% total loading time is achieved (Chung et al, 1988). Ng et.al. (2010) proposed a simpler integer program to balance the export yard template in container terminal. Iris et.al. (2002) highlighted that the typical problem for a container terminal is to store and retrieve the container in yard.
Kim et.al. (2002) highlighted that the investment of import container yard related to the
required space and the number of transfer cranes. Greater the import containers space causes the lower stack height, fewer number of re-handling during retrieval operations, longer travel, and higher investment cost for the construction of the yard.
3. METHODOLOGY An extensive observation and pilot tests data search were done to confirm the
questionnaires setting. Thereafter, survey was conducted with interviewed relevant groups from Malaysian Port; there are operation department, operation labor management, and prime mover contractors. The respondents consisted of managers, executives and prime mover operators. The survey included in the samples belong to 20% of members from each group, it fulfilled the survey requirement (Sekaran, 2000).
Statistical Package Social Science (SPSS) used for quay transfer operation delay
analyses. Primary data were checked for normality and reliability test. Normality test is important to determine the applying statistical techniques (McClave et.al, 2001). The significance level is 0.05 (Siegel and John, 1988). Reliability test used to check for the accuracy of data collected. Alpha value above or equal to 0.6 can be assumed as good and acceptable (Abu and Tasir, 2001). Descriptive analysis was used to analyze the data. Then, the results were presented by percentage and frequency.
4. RESULT AND DISCUSSION 4.1 Analysis on normality test
Table 1 shown the container yard operation’s test of normality. The Kolmogorov-Smirnov statistic test the hypothesis that the data are normally distributed. A significance value of 0.000 indicated that the distribution of the data differs significantly from a normal distribution.

JOURNAL OF MARINE TECHNOLOGY AND ENVIRONMENT
61
Table 1: Container yard operation’s test of normali ty
Tests of Normality
Kolmogorov-Smirnova
Statistic df Sig.
Waiting Game Plan 0.135 91 0.000
Waiting for PM 0.177 91 0.000
RTG Breaks Down 0.204 91 0.000
Shift Change 0.224 91 0.000
System Failures 0.163 91 0.000
Need for Turning 90 Degree 0.213 91 0.000
Need for Shifting to Other Blocks 0.288 91 0.000
Out of Gauge (OOG) 0.229 91 0.000
Human Factors 0.188 91 0.000
a. Lilliefors Significance Correction
4.2 ANALYSIS ON RELIABILITY TEST Table 2 shown reliability analysis for container yard operation. Reliability analysis
indicated that the alpha value is 0.6011. Reliability would be acceptable if alpha value is equal or above 0.6. Therefore, questionnaires data for container yard operation are reliable and acceptable.
Table 2: Reliability analysis for container yard op eration
Reliability Analysis – Scale (Alpha)
Reliability Coefficients Item Value
No. of Cases 91 No. of Items 9 Alpha 0.6011
4.3. DESCRIPTIVE ANALYSIS Table 3 shown the percentage and frequency for container yard operation’s delays
analysis. The method of categorizing the delay factor is similar to the quay transfer operation. For waiting game plan, 24.1% of respondents rated 4 but only 4.4% of respondents rated 8. As for waiting of PM, 24.1% of respondents rated 9 but only 1.1% of respondents rated 2. Moreover, as for RTG break down, 33.0% of respondents rated 8 but only 1.1% of respondents rated 10. On the other hand, for shift change, 37.4% of respondents rated 6 but only 4.4% of respondents rated 9. For system failures, 25.2% of

JOURNAL OF MARINE TECHNOLOGY AND ENVIRONMENT
62
respondents rated 5 but only 4.4% of respondents rated 9. For RTG need for turning 900, 30.7% of respondents rated 8 but only 7.7% of respondents rated 2, 4 and 6. For RTG needed shifting to other blocks, 38.4% of respondents rated 3 but only 2.2% of respondents rated 10. For OOG, 43.9% of respondents rated 3 but only 5.5% of respondents rated 1. For human factors, 26.3% of respondents rated 5 but only 1.1% of respondents rated 1.
Table 3: Percentage and frequency for container yar d operation’s delays analysis
Variables 1 2 3 4 5 6 7 8 9 10 Total
16.5 9.9 9.9 24.1 15.4 12.1 7.7 4.4 0.0 0.0 100.0 Waiting Game Plan 15.0 9.0 9.0 22.0 14.0 11.0 7.0 4.0 0.0 0.0 91.0
0.0 1.1 2.2 4.4 12.1 9.9 18.7 22.0 24.1 5.5 100.0 Waiting for Prime Mover 0.0 1.0 2.0 4.0 11.0 9.0 17.0 20.0 22.0 5.0 91.0
0.0 0.0 0.0 4.4 11.0 15.4 23.0 33.0 12.1 1.1 100.0 RTG Breaks Down 0.0 0.0 0.0 4.0 10.0 14.0 21.0 30.0 11.0 1.0 91.0
0.0 0.0 9.9 5.5 14.3 37.4 23.0 5.5 4.4 0.0 100.0 Shift Change
0.0 0.0 9.0 5.0 13.0 34.0 21.0 5.0 4.0 0.0 91.0 5.5 8.8 7.7 8.8 25.2 18.7 11.0 9.9 4.4 0.0 100.0 System
Failures 5.0 8.0 7.0 8.0 23.0 17.0 10.0 9.0 4.0 0.0 91.0
0.0 7.7 9.9 7.7 8.8 7.7 16.5 30.7 11.0 0.0 100.0 Need for Turning 90 degree 0.0 7.0 9.0 7.0 8.0 7.0 15.0 28.0 10.0 0.0 91.0
0.0 16.5 38.4 6.6 6.6 5.5 12.1 6.6 5.5 2.2 100.0 Need for Shifting to Other Blocks 0.0 15.0 35.0 6.0 6.0 5.0 11.0 6.0 5.0 2.0 91.0
5.5 25.3 43.9 18.7 6.6 0.0 0.0 0.0 0.0 0.0 100.0 Out of Gauge 5.0 23.0 40.0 17.0 6.0 0.0 0.0 0.0 0.0 0.0 91.0
1.1 3.3 12.1 17.6 26.3 12.1 8.8 8.8 6.6 3.3 100.0 Human Factors 1.0 3.0 11.0 16.0 24.0 11.0 8.0 8.0 6.0 3.0 91.0
The two values for each of the variables refer to the (bold) percent and (underneath) the frequency
Table 4 shown delays ranking of container yard operation. For delay factors that are rated as ‘often’ are RTG break down (33.0%), needed for turning 900 (30.7%) and waiting for PM (24.1%). Delay factors that are rated as ‘moderate’ are shift change (37.4%), human factors (26.3%), system failures (25.2%) and waiting game plan (24.1%). Finally, factors that are rated as ‘seldom’ are out of gauge (43.9%) and need for shifting to other blocks (38.4%).
This indicated that there are 3 delay items ‘often’ affected the container yard operation, 4 delay items ‘moderately’ affected the operation, 2 delay items ‘seldom’ affected the operation. Therefore, the 3 delay factors that ‘often’ affect the operation should be given the priority to be solved, and then followed by factor that ‘moderately’ and ‘seldom’ that affected the operation. According to the results, the initial findings showed that all variables are shown as non-normal distribution. So, non-parametric tests are applicable. Then, the alpha value proved that the data are reliability accepted.

JOURNAL OF MARINE TECHNOLOGY AND ENVIRONMENT
63
Table 4: Delays ranking of container yard operation
Variables Ranking Maximum Percentage (%) Frequency (people)
Out of Gauge (OOG)
3
43.9
40
Need for Shifting to Other Blocks
3
38.4
35
Shift Change
6
37.4
34
RTG Breaks Down
8
33.0
30
Need for Turning 90 Degree
8
30.7
28
Human Factors
5
26.3
24
System Failures
5
25.2
23
Waiting Game Plan
4
24.1
22
Waiting for PM
9
24.1
22
5. CONCLUSIONS AND RECOMMENDATIONS
The purpose of this paper is to analyze the key delays factor of container terminal
operation, it aims to minimize the affect of delays and increase the handling performance. The result determined that RTGs break down, need for turning 900 and waiting for PMs are ‘often’ occurred during operation. At the same time, this paper also highlighted that shift change, human factors, system failures and waiting game plan are ‘moderate’ affected the operation. Finally, out of gauge and need for shifting to other blocks are rated as ‘seldom’ delayed the operation. As a conclusion, RTG and PM are the main cause of the delay in container terminal operation.
As a result, this study recommended that the problem ‘often’ happening on operation
should be solve priority, like ‘RTGs break down’, ‘need for turning 900’, and ‘waiting for PMs’. Then, followed by the problem ‘moderately’ and ‘seldom’ delays the operation. It would enhance the handling performance of container yard operation and further more increase the handling efficiency of container terminal as a whole.
ACKNOWLEDGMENTS
We extend our sincere appreciation and indebtedness to Malaysian Port operation department, statistics department, human resource department, and technical department for the guidance, support and encouragement. We extend our sincere appreciation and indebtedness to UMT and their funder for the guidance, support and encouragement. We would also like to thank the reviewers of this paper for they helpful suggestion.

JOURNAL OF MARINE TECHNOLOGY AND ENVIRONMENT
64
REFERENCES [1]. Abu, M.S. and Tasir, Z. - Pengenalan kepada Analisis Data Berkomputer SPSS
10.0, Venton Publishing, Kuala Lumpur, pp. 299, 2001 [2]. Chen, T. - Yard Operations in the Container Terminal Unproduct ive Moves ,
Maritime Policy and Management, Volume 26, Number 1, pp. 27-38, 1999 [3]. Chung, Y.G., Randhawa, S.U. and Medowell, E.O. - A Simulation Analysis for a
Transtainer – Based Container Handling Facility , Computers and Industrial Engineering, Volume 14, Number 2, pp. 113-125, 1988
[4]. Iris, F.A.V. and Rene, D.K. - Transhipment of Containers at a Container Terminal: An Overview , European Journal of Operational Research, Volume 147, Issue 1, 16 May 2003, pp. 1-16, 2002
[5]. Kim, K.H. - Evaluation of the Number of Rehandles in Container Yards , Computer and Industrial Engineering, Volume 32, Issue 4, pp. 701-711, 1997
[6]. Kim, K.H. and Kim, H.B - Segregating Space Allocation Models for Container Inventories in Port Container Terminals , International Journal of Production Economical, Volume 59, Number 1-3, pp. 415-423, 1999
[7]. Kim, K.H. and Kim, H.B - The Optimal Sizing of the Storage Space and Handlin g Facilities for Import Containers , Transportation Research Part B, Volume 36, pp. 821-835, 2002
[8]. Linn, R.J. and Zhang, C.Q. – A Heuristic for Dynamic Yard Crane Deployment in a Container Terminal, IIE Transactions, 35(2), pp. 161-174, 2010
[9]. Loke, K.B. – Handling Efficiency of Containers at Port of Tanjun g Pelepas, (PTP) , Master of Science in Maritime management, Faculty of Machanical Engneering, Universiti Malaysia Teknologi, pp. 149, 2007
[10]. McClave, J.T., Benson, P.G. and Sincich, T. - Statistics for Business and Economics , Prentice-Hall, Inc., Upper Saddle River, New Jersey 07458, pp. 1028, 2001
[11]. Sekaran, U. - Handbook for Total Quality Management , Published by Infinity Books, New Delhi, pp. 197, 2000
[12]. Siegel, S. and John C.N. - Nonparametric Statistics for the Behavioral Science s, Second Edition, McGraw-Hill, United States of America, pp. 399, 1988
[13]. Thomas, B.J., Roach, D.K., Interface4 Ltd, and International Labour Office - A Project by the International Labour Office (ILO), Financed by the Royal Government of The Kingdom of The Netherlands, Port Development Programme, C.1.1 Container Terminal Operations, pp. 56, 1994
[14]. Ng, W.C., Mak, K.L. and Li, M.K. – Yard Planning for Vessel Services with a Cyclical Calling Pattern , Engineering Optimization, 42(11), pp. 1039-1054, 2010
[15]. Zhang, C.Q., Wan, Y.W. and Liu, J.Y. - Dynamic Crane Deployment in Container Storage Yards , Transportation Research Part B: Methodological, Volume 36, Issue 6, pp. 537-555, 2002

JOURNAL OF MARINE TECHNOLOGY AND ENVIRONMENT
65
QUAY TRANSFER OPERATION ANALYSIS FOR A CONTAINER TERMINAL
1LOKE K.B., 2A.H. SAHARUDDIN, 3M.R. OTHMAN, 4I. RIZAL, 5A.S.A.KADER, 6A.M.ZAMANI
1,2,3,4,5,6School of Maritime Business and Management, Universiti Malaysia Terengganu,
Malaysia
A lot of studies focused on quay transfer operation efficiency. It emphasized on increasing the handling rate and improving the performance by mathematical, modeling or empirical study. Therefore, this study aimed to study delay factors of quay transfer operation in a container terminal, which affected the productivity performance. It tried to overcome the shortcoming of previous studies. Quay transfer operation is one of the operation systems in container terminal, which is affected by many factors and also affected other operations. The delays of the operation will slow down the handling performance and increase the handling time and cost. Hence, an extensive observation and survey activities were done in Malaysian container terminal. The data obtained from relevant respondents that involve in operation. The initial result showed that waiting for prime mover ‘often’ occurred on quay transfer operation. Delay of quay crane and prime mover break downs ‘moderately’ delay the operations. However, waiting for game plan ‘seldom’ affected the operation. Therefore, this study concluded that the handling equipment is the main cause of delay in quay transfer operation in a container terminal.
Keywords: quay transfer operation; delay factors.
1. INTRODUCTION
Quay transfer operation is one of the main operations in a container terminal. It may affect by many delay factors; such as handling equipment, incoming vessel, allocation plan, container size, breakdown, and others. At the same time, it also may delay the other operations that are connected with them; such as ship operation and container yard operation. Therefore, this study aimed to analyze the delay factors of the operation, to overcome the shortcoming and improve the handling performance.
2. LITERATURE REVIEW
When a container vessel arrived at the container terminal, the containers on board would be unloaded from the vessel. This task is handled by quay crane (QC). After that, the containers are transferred from the QC to prime mover (PM), which would carry the containers from the berthing area to the stacking area. Next, the rubber tyred-gantry crane (RTG) or straddle carrier (SC) arranged the containers in the storage area. The containers

JOURNAL OF MARINE TECHNOLOGY AND ENVIRONMENT
66
must be stored in a manner that would minimize the time taken to retrieve the containers. For export containers, the prime mover would carry the containers from container yard to berthing area for loading. Thereafter, the container vessel would carry the containers departed from the port (Iris and Rene, 2002). For export and import of containers, they would passed by entry gate and custom clearance. Some of the containers would store and repackaging in container freight station, mostly is for consolidation shipment.
Therefore, there are four main operation systems in container terminal; such as ship operation, quay transfer operation, container yard operation and receipt/delivery operation. In terminals that have Container Freight Station (CFS) would have fifth system that is CFS operation (Thomas et al, 1994). It indicated that the terminal operations involve many interactions (Koh et al, 1994). In the real container terminal system the interactions are the critical issues; some of the principal aspects involve with interference among dock cranes, interference among yard cranes, interference among connections units, interference among containers themselves, access problems and other interactions and externality (Bruzzone et al, 1999). Quay transfer operation serves as connection process in between ship operation and container yard operation. It transits the inbound container from quay side to yard side and outbound container from yard side to quay side. It would affects the berth turnaround time and consequently reduce the productivity performance. Hence, many studies have carried out to increase their efficiency. Thomas et.al. (1994) suggested that the connection units should be compatible to the crane operation, and the transfer rate is affected by quay transfer cycle and the number of equipment deployed. Sanchoy and Lazar (2003) proposed the used of algorithm scheduling to match the operation of straddle carriers and trucks. This paper selected straddle carriers as connection units and servicing the external trucks. Vis et.al. (2001) estimated the number of connection unit deployed at a target rate by integrated system. Chao et.al. (2012) proposed the used of mix cross-operation to optimize the operation scheduling of connection unit. A algorithm model proposed to reduce the operation cost and travel distance. Lee et.al. (2009) proposed hybrid insertion algorithm to integrate connection unit scheduling and container storage allocation. Nishimura et.al. (2005) proposed a dynamic routing method to minimize the total travel distance of connection unit. Cao et.al. (2010) proposed of used a mixed-integer programming model to solve the connection unit and yard crane scheduling problem.
The previous studies neglected on the delay factors on the quay transfer operation that may affected the handling rate of the operation. Therefore, this paper emphasized on the delay factors on the operation which not highlighted in previous studies. It aims to analyst the factors that affected the quay transfer operation performance and by then to increase the handling performance of the operation.
3. METHODOLOGY An extensive observation and pilot tests data search were done to confirm the
questionnaires setting. Thereafter, survey was conducted by interviews relevant groups from Malaysian Port; that are operation department, operation labor management, and prime mover contractors. The respondents consisted of managers, executives and prime mover operators. The survey included in the samples belong to 20% of members from each group, it fulfilled the survey requirement (Sekaran, 2000).

JOURNAL OF MARINE TECHNOLOGY AND ENVIRONMENT
67
Statistical Package Social Science (SPSS) was used for quay transfer operation delay analyses. Primary data were checked for normality and reliability. Normality test is important to determine the applying statistical techniques (McClave et.al, 2001). The significance level is 0.05 (Siegel and John, 1988). Reliability test used to check the accuracy of data collected. Alpha value above or equal to 0.6 can be assumed as good and acceptable (Abu and Tasir, 2001). Descriptive analysis was used to analyze the data. Then, the results were presented by percentage and frequency.
4. RESULT AND DISCUSSION 4.1 ANALYSIS ON NORMALITY TEST
Table 1 shows normality test for quay transfer operation. The Kolmogorov-Smirnov statistic tests the hypothesis that the data are normally distributed. A low significance value 0.000 indicated that the data differs significantly from a normal distribution.
Table 1: Normality test for quay transfer operation
Kolmogorov-Smirnova
Statistic df Sig. Waiting Game Plan 0.204 98 0.000 Waiting for Incoming Vessel 0.129 98 0.000 Waiting for Quay Crane 0.148 98 0.000
Waiting for Rubber Tyred-Gantry Crane 0.159 98 0.000 Distant between Yard and Berth 0.136 98 0.000 Out of Gauge 0.202 98 0.000
Prime Mover Breaks Down 0.107 98 0.000 Shift Change 0.197 98 0.000 System Failures 0.142 98 0.000
Human Factors 0.139 98 0.000 a. Lilliefors Significance Correction
4.2 ANALYSIS ON RELIABILITY TEST
Table 2 shows reliability test for quay transfer operation. The result shows that alpha value for quay transfer operation is 0.7517. So, the result is acceptable. The alpha value is acceptable if it is equal or above 0.6.
Table 2: Quay transfer operation reliability analysis
Reliability Coefficients Item Value
No. of Cases 98 No. of Items 10 Alpha 0.7517

JOURNAL OF MARINE TECHNOLOGY AND ENVIRONMENT
68
4.3 DESCRIPTIVE ANALYSIS According to the Handbook for Total Quality Management (Sarkar, 2000), data from
questionnaires can be analyzed in table format. For analysis purpose, frequency of delay factor were categorized in such a way that 1 to 3 is ‘seldom’; 4 to 7 is ‘moderately’ and 8 to 10 is ‘often’ occurs on quay transfer operation.
Table 3: Percentage and frequency for quay transfer operation delays analysis
Variables 1 2 3 4 5 6 7 8 9 10 Total
37.8 15.3 12.3 8.2 12.2 7.1 5.1 0.0 0.0 2.0 100.0 Waiting Game plan 37 15 12 8 12 7 5 0 0 2 98
6.1 21.4 12.3 14.3 16.3 8.2 6.1 6.1 5.1 4.1 100.0 Waiting for Incoming Vessels 6 21 12 14 16 8 6 6 5 4 98
11.2 18.4 19.4 21.4 9.2 12.2 4.1 3.1 1.0 0.0 100.0 Waiting for Quay Crane 11 18 19 21 9 12 4 3 1 0 98
0.0 0.0 0.0 0.0 2.0 4.1 20.4 29.6 24.5 19.4 100.0 Waiting for Rubber Tyred-Gantry Crane 0 0 0 0 2 4 20 29 24 19 98
1.0 4.1 12.2 9.2 23.5 23.5 12.3 11.2 1.0 2.0 100.0 Distant between Yard and Berth 1 4 12 9 23 23 12 11 1 2 98
11.2 21.4 22.5 10.2 12.3 6.1 10.2 4.1 2.0 0.0 100.0 Out of Gauge 11 21 22 10 12 6 10 4 2 0 98
4.1 15.3 12.3 13.3 18.4 19.4 7.1 6.1 2.0 2.0 100.0 Prime Mover Breaks Down 4 15 12 13 18 19 7 6 2 2 98
3.1 14.3 24.5 13.3 2.0 9.2 14.3 7.1 5.1 7.1 100.0 Shift Change 3 14 24 13 2 9 14 7 5 7 98
15.3 15.3 11.2 9.2 14.3 12.3 14.3 6.1 2.0 0.0 100.0 System Failures 15 15 11 9 14 12 14 6 2 0 98
13.3 14.3 10.2 4.1 12.3 11.2 14.3 11.2 7.1 2.0 100.0 Human Factors 13 14 10 4 12 11 14 11 7 2 98 The two values for each of the variables refer to the (bold) percent and underneath) the frequency
Table 3 showed that 37.8% of respondents rated waiting game plan as 1 (seldom), but
only 2.0% of respondents rate 10 (often). On the other hand, waiting for incoming vessels, 21.4% of respondents rated 2, but only 4.1% rate 10. Then, 21.4% of respondents rated 4, but only 1.0% of respondents rated 9 for waiting for quay crane. Next, waiting for rubber

JOURNAL OF MARINE TECHNOLOGY AND ENVIRONMENT
69
tyred-gantry crane, 29.6% of respondents rated 8, but only 2.0% of respondents rated 5. For distant between yard and berth, 23.5% of respondents rated 5 and 6 but only 1.0% of respondents rated 1 and 9. For out of gauge, 22.5% of respondents rated 3 but only 2.0% of respondents rated 9. For prime mover breaks down, 19.4% of respondents rated 6 but only 2.0% of respondents rated 9 and 10. Then, Shift change has 24.5% of respondents rated 3 but only 2.0% of respondents rated 5. Next, system failure has 15.3% of respondents rated 1 and 2 but only 2.0% of respondents rated 9. Finally, human factor has 14.3% of respondents rated 2 and 7 but only 2.0% of respondents rated 10. The summary results are shown in table 4.
Table 4 showed quay transfer operation delays ranking. The summarized result indicated that, respondents rated that waiting for RTG (29.6%) ‘often’ occur on quay transfer operation. Next, respondents rated that distant between yard and berth (23.5%) has ‘moderate’ delays for the operation. Other respondents rated that waiting for quay crane and prime mover break down respectively to be a ‘moderate’ delays factor (21.4% and 19.4%). The ‘seldom’ delays factor rated by respondents are waiting game plan (37.8%), shift change (24.5%), out of gauge (22.5%), waiting for incoming vessels (21.4%) and system failure (15.3%). However, as for human factors, as a delay factor, respondent rating is at two tiers between ‘seldom’ and ‘moderate’.
Table 4: Quay transfer operation delays ranking
Maximum
Variables Ranking Percentage (%)
Frequency (people)
Waiting Game Plan 1 37.8 37 Waiting for Rubber Tyred-Grantry Crane 8 29.6 29
Shift Change 3 24.5 24 Distant between Yard and Berth 5,6 23.5 23
Out of Gauge 3 22.5 22 Waiting for incoming Vessels 2 21.4 21
Waiting for Quay Crane 4 21.4 21 Prime Mover Breaks Down 6 19.4 19
System Failures 1,2 15.3 15 Human Factors 2,7 14.3 14
5. CONCLUSIONS AND RECOMMENDATIONS
Prime mover downtime was investigated as the prime mover was the main vehicles for quay transfer operation in Malaysian Port. 29.6% of respondents agreed that waiting for rubber tyred grantry crane ‘often’ happened and delayed the operation. Distant between yard and berth, waiting for quay crane and prime mover breaks down are ‘moderately delayed the operation. The initial result showed that the main delay factor is caused by vehicle interference. Therefore, the management of vehicles must be enhanced. All the activities must keep in step with each other, to guarantee a good-co-ordination between the inter-changing container processes. First, the number of prime mover and rubber tyred gantry crane to be allocated and deployed must be based on quantity of quay crane. Besides, number of container, expected speed of ship operation, types of crane selection, size of vessel, distant between quayside and container yard should be considered during the vehicles allocation (Thomas et.al., 1994). Second, the interaction between vehicles should

JOURNAL OF MARINE TECHNOLOGY AND ENVIRONMENT
70
be more flexible. Vehicles need to be prepared to re-deploy, increase extra vehicles or return into the pool.
ACKNOWLEDGMENTS
We extend our sincere appreciation and indebtedness to Malaysian Port for the guidance, support and encouragement. We extend our sincere appreciation and indebtedness to UMT and their funder for the guidance, support and encouragement. We would also like to thank the reviewers of this paper for they helpful suggestion.
REFERENCES [1]. Abu, M.S. and Tasir, Z. - Pengenalan kepada Analisis Data Berkomputer SPSS 10.0, Venton
Publishing, Kuala Lumpur, pp. 299, 2001 [2]. Bruzzone, A.G., Giribone, P., and Revetria, R. - Operative Requirements and Advances for
the New Generation Simulators in Multimodal Container Terminals, Proceedings of the 1999 Winter Simulation Conference, pp. 1243-1252, 1999
[3]. Cao, J., Shi, Q., Lee, D. - Integrated Quay Crane and Yard Truck Schedule Problem in Container Terminals, Tsinghua Science and Technology 15(4), pp. 467-474, 2010
[4]. Chao, C., Qingcheng, Z. and Zhe Z. - An Integrating Scheduling Model for Mixed Cross-Operation in Container Terminals, Transport, 27(4), pp. 405-413, 2012
[5]. Iris, F.A.V. and Rene, D.K. - Transhipment of Containers at a Container Terminal: An Overview, European Journal of Operational Research, Volume 147, Issue 1, 16 May 2003, pp. 1-16, 2002
[6]. Koh, P.H., Goh, J.L.K., Ng, H.S. and Ng, H.C. - Using Simulation to Preview Plans of a Container Port Operation, Proceedings of the 1994 Winter Simulation Conference, Orlando, Florida, December, 1994
[7]. Lee D-H., Cao, J.X.; Shi, Q, Chen, and J.H. - A heuristic Algorithm for Yard Truck Scheduling and Storage Allocation Problems, Transportation Research Part E: Logistics and Transportation Review 45(5), 810-820, 2009
[8]. McClave, J.T., Benson, P.G. and Sincich, T. - Statistics for Business and Economics, Prentice-Hall, Inc., Upper Saddle River, New Jersey 07458, pp. 1028, 2001
[9]. Sarkar, D. - Handbook for Total Quality Management, Published by Infinity Books, New Delhi, pp. 197, 2000
[10]. Nishimura, E., Imai, A., Papadimitrious, S., - Yard Trailer Routing at a Maritime Container Terminal, Transportation Research Part E: Logistics and Transportation Review, 41(1),pp. 53-76, 2005
[11]. Sekaran, U. - Handbook for Total Quality Management, Published by Infinity Books, New Delhi, pp. 197, 2000
[12]. Siegel, S. and John C.N. - Nonparametric Statistics for the Behavioral Sciences, Second Edition, McGraw-Hill, United States of America, pp. 399, 1988
[13]. Sanchoy, K.D. and Lazar, S. - Scheduling Material Handling Vehicles in a Container Terminal, Production Planning and Control: The Management of Operations, 14(7), pp. 623-633, 2003
[14]. Thomas, B.J., Roach, D.K., Interface4 Ltd, and International Labour Office - A Project by the International Labour Office (ILO), Financed by the Royal Government of The Kingdom of The Netherlands, Port Development Programme, C.1.1 Container Terminal Operations, pp. 56, 1994
[15]. Vis, I.F.A., DE Koster, R., Roodbergen, K.J. And Peeters, I.W.P. - Determination of the Number of Automated Guided Vehicles at a Semi-automated Container Terminal, Journal of the Operational Research Society, 52, pp. 409-417, 2001

JOURNAL OF MARINE TECHNOLOGY AND ENVIRONMENT
71
SIMILARITY CRITERIA FOR SHIP MODELLING AND MAGNETIC SIGNATURE ANALYSIS
1MARIN GEORGIANA, 2SAMOILESCU GHEORGHE, 3BALTAG OCTAVIAN
1Research Center for Navy, 2“Mircea cel Batran” Naval Academy, 3“Grigore T. Popa” University of Medicine and Pharmacy, Romania
In order to analyze the magnetic signature of a naval ship, there was employed a physical scale model of the respective vessel. The model was built to a scale of 1:100, respecting the geometric similarity criteria, in terms of main dimensions proportionality. A physical similarity criterion characteristic to the magnetic signature issue was formulated, taking into account the ratio between the hull sheet thickness and the electric and magnetic properties of the ship and the model, respectively. There have been performed a large volume of triaxial measurements of the magnetic signature, to acquire the magnetic field distribution for an horizontal plane situated below the hull, at reference depth. Based on the analysis of magnetic signature components of the model ship, some conclusions regarding their shape can be drawn.
Keywords : Physical scale model, magnetic signature, similarity criteria, ship model.
1. INTRODUCTION The issue of reducing the ship magnetic presence in the underwater environment is
generated by various types of weapons operating in this environment and exploiting the ship’s magnetic signature, particularly the naval mine. Modern magnetic mines incorporate vectorial magnetometers - fluxgate type (Ripka, 2000), (Baltag, 2001).
The most important source of the ship’s magnetic field is given by magnetization in the Earth’s magnetic field, of the ferromagnetic steel used in the ship construction (Aird, 2000). The ship’s ferromagnetic signature is dominant compared to all other magnetic field sources on board (Baltag, 2001). Since measuring magnetic signature is extremely laborious and costly, there can be used instead physical scale models of the ship (Holmes, 2007).
In order to analyze the magnetic signature of a naval ship, there was employed a physical scale model of the respective vessel. The model was constructed respecting the criteria of geometric and physical similarity, as possible (Nanu, 2005). For this purpose, there are described and discussed the similarity criteria used in modeling the ship and its magnetic signature. To overcome the difficulties imposed by hull sheet scaling, there is proposed a novel criterion, relating the sheet width with material conductivity and permeability.
There have been performed a large volume of triaxial measurements of the magnetic signature (McFee, 1994). Thus there was acquired the magnetic field distribution for the horizontal plane situated below the hull at reference depth (Samoilescu, 2010).
2. FORMULATION AND CONTROL OF THE SIMILARITY CRITERIA For the analysis there was chosen a naval ship, with main dimensions: length L = 60 m,
width B = 10 m, draft T = 3 m, height D = 5 m. The ship hull is built of high strength naval

JOURNAL OF MARINE TECHNOLOGY AND ENVIRONMENT
72
steel, with sheet thickness of 12 mm. The similarity criteria refer to geometric and physical similarity (Constantinescu, 2010).
Geometric similarity is ensured by the compliance of body shape and maintaining the ratio between the vessel and model dimensions, expressed by the ratio series:
m
h
h
B
B
L
L
k
k =′
=′
=′ (1)
where: L ', B' represent the model length and width, respectively, hk, hk' denote the depth below the keel of the vessel and model, respectively, of the plane of measurement, and the scaling factor m is 100, in this case.
Choosing the physical parameters of the scale model aims to ensure the proportionality to the ship parameters. Physical similarity criteria are obtained from Maxwell's equation (Nanu, 2005):
t
DJHcurl
∂∂+=r
rr
(2) Curl operator is applied to Eq. (2) and each term is calculated. This gives:
t
H
t
HH
∂∂+
∂∂=∇
rrr
σµεµ2
22
(3) Where:
2
2
2
2
2
22
z
H
y
H
x
HH
∂∂+
∂∂+
∂∂=∇
r
(4) In order to obtain the similarity criteria, Eq. (3) is to be reformulated in a dimensionless
system. There are introduced the unit quantities: H0 , x0, y0, z0, µ0 , σ0, ε0, l0 and T. Quantities involved in Eq.(3) are expressed in relative units, resulting the dimensionless quantities:
====
====
T
t
z
z
y
y
x
xH
HH
zyx τλλλ
σσσ
εεε
µµµ
,,,
,,,
000
0
0
0
0
0
0
0
0
rr
(5) By replacing the dimensionless quantities and simplifying Eq. (3), it becomes:
τµσ
µστ
µεµε
∂∂⋅
+
∂∂⋅
=∇
000
2000
2
0200
2
200002 H
T
lH
T
lH
rrr
(6) In order to ensure the magnetic field similarity, the products of the square brackets must
remain constant for the two systems: ship and scale model. The first criterion of similarity is given by the first square brackets:
T
l2000
1µσ
=Π (7)
The second criterion is obtained from the second square brackets, taking into account the first criterion of similarity:
T0
02 σ
ε=Π
(8)

JOURNAL OF MARINE TECHNOLOGY AND ENVIRONMENT
73
Fig. 1 - Ship model at scale 1 : 100
If the displacement currents are neglected, then only the first similarity criterion must be
obeyed. The original ship has the following characteristics: relative magnetic permeability µr= 180 and electrical conductivity σ= 4.8 MS/m (Moobrugger, 2000). Since the ship's magnetic field is slowly varying in time, it is considered that the variation of the magnetic field has the same period T for ship and model, and it is therefore neglected.
The scale model illustrated in Fig.1 is made of galvanized steel sheet, thickness 0.4 mm, reproducing the ship hull and superstructure, leaving aside the vessel equipment. The material used for the model construction has the following characteristics: relative magnetic permeability µ'= 285 and electrical conductivity σ' = 5.2 MS/m (Moobrugger, 2000). The ratio between the two systems specific linear dimensions l / l' is the ratio of the vessel and model main dimensions m = 100.
There are actually two scales to represent the ship: a scale for the main dimensions and another for the sheet thickness dimension. For some ship classes, hull thickness is too small to be reproduced to scale, without hull deformation during model construction and testing. In these conditions there is employed a scaling method in which the main dimensions ratio remains constant, although the model may be manufactured from materials with magnetic and mechanical properties different from those of the original ship (Holmes, 2007). If the sheet thickness and magnetic permeability of model is given by d' and µ', then their product can be computed with:
m
dd
µµ ⋅=′⋅′
(9)
Where d and µ denote the metal sheet thickness and magnetic permeability of the ship, and m is the model scaling factor. Consideration should be given to the simultaneous fulfillment of two conditions, obtained from the first criterion of similarity and the proportionality condition of the permeability-thickness product. This gives the third criterion of similarity:
30
2003 µσ ⋅⋅=Π d
(10) Where d0 is the characteristic dimension of the ship or model hull sheet thickness.
Similarity criterion Π3 refers to both magnetic field and the proportionality between the main dimensions and hull sheet thickness of the ship and model, respectively. Based on it there is obtained:
132
=
′⋅
′⋅
′µµ
σσ
d
d (11)
Where σ, d and µ are the electrical conductivity, sheet thickness, and the magnetic permeability of the ship hull, respectively, while quantities σ', d' and µ' are specific to the

JOURNAL OF MARINE TECHNOLOGY AND ENVIRONMENT
74
scale model. Substituting in Eq. (11) the values of the characteristic quantities of the two systems, we obtain the value of the ratio:
0047780180
285
12
40
84
253232
..
.
.'''
=
⋅
⋅=
⋅
⋅
µµ
σσ
dd
(12)
Achieving physical similarity in this case analyzed is difficult, requiring the use of
materials with electric and magnetic properties very different from the original system, so as to take into account the proportionality of sheet thickness.
The chosen model is not an exact reproduction of the magnetic behavior of the ship, in terms of the magnetic signature order of magnitude. However, it is extremely useful in the analysis of signature variance on the three components, because the hull shape plays an important part in the development of the magnetic signature components.
3. CONSIDERATIONS ON THE SHIP MAGNETIC SIGNATURE ASPECT From the practice of the magnetic field measurements, there have emerged a few
considerations on the vessels magnetic signature aspect. The variation form of the longitudinal, vertical and athwart components of the vessel signature is characterized by the number of half-waves. A half-wave is defined as the portion of the same polarity of the magnetic signature component.
For the vertical component, the number of half-wave nz is 2 or 3, depending on the aspect ratio of the main vessel. It has been established experimentally that the number of half-waves of the longitudinal component, denoted nx, is larger by 1 than the number of half-waves of the vertical component nz.
1+= zx nn (13) The number of half-waves of the athwart component ny, is twice the number of half-
waves of the vertical component nz.
zy nn ⋅=2 (14)
The normal measurement depth of the ship magnetic signature is defined as the depth at
which the ship’s field, after the demagnetization process, does not exceed a threshold value. It depends on the ship's aspect ratio, the area of navigation and the area of the demagnetization range.
Studying the magnetic signature in the reference plane of normal depth measurement is performed within certain limits. Beyond these limits, the ship field is considered negligible. The magnetic signature analysis distances in the longitudinal Xk and athwart plane Yk, are given by the following relations:
( ) LXk ⋅÷= 8.15.1 (15) ( ) BYk ⋅÷= 43 (16)
where L and B are the ship’s length and width, respectively.
4. MEASUREMENT SET-UP AND RESULTS The acquisition system is drawn schematically in Figure 2 and consists of:

JOURNAL OF MARINE TECHNOLOGY AND ENVIRONMENT
75
- Triaxial fluxgate magnetometer; - Optical encoder to command the magnetometer signal acquisition; - Data acquisition board with LabView data acquisition and processing software.
Fig. 2. Simplified scheme of the model magnetic sig nature measurement
installation
The model is fastened to an aluminum beam connected to the mobile platform. The magnetometer is mounted on a transversal wooden beam and independent to the mobile platform, located in the center of a shielded room, between the mobile platform and the analyzed model ship.
In order to record the values of the three components of the model magnetic signature, there was adopted the rectangular coordinate system Oxyz, coinciding with the coordinate system of the model ship hull, as follows:
- the Ox axis coincides with the longitudinal axis of the ship, being oriented towards the bow, therefore coinciding with the heading direction of measurements,
- the Oy axis is oriented towards starboard (on the right side of the measurement heading direction),
- the axis Oz is directed vertically downwards. At each run on the longitudinal axis there is obtained a measurement line consisting of
103 equidistant points located at ∆x = 1 cm. The first measurement line is obtained at coordinate y = 29, corresponding to model’s center line (beneath the keel). The following lines are arranged equidistant in the positive direction of the Oy axis, with ∆y = 2 cm, performing 14 successive runs of the model ship above the sensor [20]. The magnetic signature is considered symmetrical to the center line plane of the model ship.
Measurements were performed for various depths, representing the vertical distance between model ship keel and the triaxial sensor position. The reference depth in measuring the magnetic signature of the vessel is designated as the normal measurement depth. For the respective ship class, the measuring normal depth is 7 m from the ship’s keel. In compliance with geometric similarity, the normal measurement depth for the model is 7 cm.
The three components of the magnetic signature at the reference depth are illustrated in Figures 3-5. The results are given in nT. In the longitudinal plane, there are 103

JOURNAL OF MARINE TECHNOLOGY AND ENVIRONMENT
76
measurement points, upwards from bow to stern. The distance between two consecutive points is 1 cm, covering nearly twice the ship model length of 60 cm.
Fig. 3. Longitudinal component B x of the model ship magnetic signature at depth
z = 7 cm and representation of the model ship, as r eference
Fig. 4. Vertical component B z of the model ship magnetic signature
at depth z = 7 cm

JOURNAL OF MARINE TECHNOLOGY AND ENVIRONMENT
77
Fig. 5. Athwart component B y of the model ship magnetic signature
at depth z = 7 cm
5. RESULTS AND DISCUSSION
The longitudinal component Bx has the three half-waves of alternating polarity. The half-waves of positive polarity are located approximately at the fore – aft extremities of the model and reach maximum values of approximately 2.61 nT. The negative half-wave corresponds to the rear part (the astern half) of the model, with the extreme value of 1.24 nT.
The vertical component Bz has two half-waves of opposite polarity, the positive one being located in the first half of the longitudinal distance, with a maximum of 5.27 nT, while the opposite polarity half-wave lies in the second half of the measurement distance, with the extreme value of 2.84 nT.
The aspect of the longitudinal and vertical components complies with the theoretical form of the tangential and the normal component, respectively, of the magnetic dipole, since measurements were performed at a sufficiently high depth from the model ship hull [1]. It is noted that the extreme values are reached in the vicinity of bow - stern extremities of the model.
Since the athwart component By presents symmetry to the longitudinal axis of measurements, with the corresponding ordinate of y = 29 cm, the following comments will be made only on the athwart component distribution in one side of the plane. The two half-waves of the athwart component have the extreme values lying in the longitudinal plane approximately next to the forward – stern extremities of the model, at athwart distance of about 1 - 1.5 widths of the model ship, corresponding to the theoretical indications. The maximum positive value is 0.26 nT and negative one is -0.74 nT.
Of the three components, the vertical one (Bz) is the dominant, due to the model ship magnetization in the Earth’s magnetic field, which also has as dominant component the vertical one. The half-wave number of the vertical, longitudinal and athwart components, are nz = 2, nx = 3, and ny = 4, respectively. This is in full compliance with ship signature aspect considerations. This proves that the model ship is viable in terms of magnetic signature components variation and relative size, although their values are much lower compared to the magnetic signature components of the original system – the actual ship.

JOURNAL OF MARINE TECHNOLOGY AND ENVIRONMENT
78
6. CONCLUSIONS
The paper objective is an extensive analysis on a scale model of a naval ship. The model was built to a scale of 1:100, respecting the proportionality between the main dimensions and, consequently, the geometric similarity criteria. As for the physical similarity, it is difficult to construct a scale model generating the same level of magnetic signature as the original ship.
A physical similarity criterion characteristic to the magnetic signature issue was formulated, taking into account the ratio between the hull sheet thickness and the electric and magnetic properties of the ship and the model, respectively.
From the extensive volume of measurements performed on the model, there was selected for magnetic signature analysis the values measured at normal measurement depth of z = 7 cm. Based on the analysis of magnetic signature components of the model ship, some conclusions regarding their shape can be drawn.
Longitudinal and vertical components shapes approximate very well the aspect of the tangential and normal components, respectively, of the theoretical model of magnetic dipole, since measurements were performed at a sufficiently high depth from the hull. The longitudinal component (Bx) has three half-waves, the vertical one (Bz) - two half-waves, and athwart component (By) - two half-waves. All these shapes correspond to the theoretical and experimental data regarding the ships magnetic signature. The vertical component Bz is dominant, due to the model ship magnetization in the Earth’s magnetic field, which also has as dominant component the vertical one.
The aspect of the magnetic signature components for the scale model fully complies with the general characteristics regarding the ships magnetic signature shape and relative order of magnitude of components.
REFERENCES
[1]. G. Aird - Modelling the Induced Magnetic Signature of Naval V essels, PhD Thesis , University of Glasgow, pp. 1-12, 2000 [2]. O. Baltag, D. Costandache, O. Robu, V. Ignat - Magnetometrie , Inventica Publishing House, Iasi, 2001. [3]. O. Baltag, D. Costandache, M. Rău, A. Ifrim, I. Rău - Dynamic shielding of magnetic fields, Advances in Electrical and Computer Engineering, 10, 4, pp. 135 – 142, 2010. [4]. M. Constantinescu - Amprenta magnetica a navei , Naval Academy Publishing, Constanţa, 2010. [5]. J. Holmes - Modeling a Ship’s Ferromagnetic Signatures , Morgan & Claypool, 2007. [6]. J.E. McFee, R.O. Ellingson, and Y. Das - A Total-Field Magnetometer System for Location and Identification of Compact Ferrous Objects , IEEE Transactions On Instrumentation And Measurement, 43, 4, pp. 613 – 619, 1994. [7]. C.Moobrugger, F. Cverna - Electrical and Magnetic Properties of Metals , ASM Ready Reference, Ohio, 2000. [8]. D. Nanu, A. Sotir, G. Samoilescu, M. Constantinescu - Considera ţii privind teoria similitudinii şi model ării fizice în sinteza înf ăşurărilor de compensare magnetic ă a navelor , NAV.MAR.EDU Conference Proceedings, pp. 325-330, Constanţa, 2005. [9]. P. Ripka - Magnetic Sensors and Magnetometers , Artech House, London, pp. 111-118, 2000. [10]. Gh. Samoilescu, G. Marin - Ship’s magnetic field characteristics in normal dep th plane , Army Academy Scientific Bulletin, 15, 1, pp. 80-84, 2010. [11]. A. Tugulea, I. V. Nemoianu - Quasi-stationary electrokinetic models of Earth’s m agnetic internal field sources , Rev. Roum. Sci. Techn. – Électrotechn. et Énerg., 56, 2, pp. 149–159, 2011. [12]. S. Tumanski - Handbook of Magnetic Measurements , CRC Press, pp. 351-354, 2011.

JOURNAL OF MARINE TECHNOLOGY AND ENVIRONMENT
79
THEORETICAL APPROACH FOR OPTIMAL DESIGN OF SHELL AND TUBE HEAT EXCHANGERS ON GENETIC ALGORITHM BASIS
MEMET FEIZA
Constanta Maritime University, Romania
Heat exchangers are devices used to transfer heat between at least two fluids heaving different temperatures; in most of the situations, these fluids are separated by a solid wall. Shell and tube heat exchangers are the most common type of heat exchangers; this is why more attention on their design, optimization and analysis is absolutely needed for energy conservation in the process of heat transfer. This paper presents an approach related to optimum design of shell and tube heat exchangers. The approach relies on the genetic algorithm for optimization of this kind of devices. The genetic optimization algorithm is based on the value of an objective function. It will be assumed that the objective function is the total cost function, which should be minimized. The use of such a method in practice will leed not only to optimal geometric design features, but also to the consideration of economic aspect of these devices.
Keywords : shell and tube heat exchanger, optimization, cost.
1. INTRODUCTION Heat exchangers are thermal equipments used in complex engineering systems dealing
with energy generation and energy transformation (Patel and Mavani, 2013). Since heat transfer is one of the most important industrial processes, the design of heat exchangers is very important and usually the overall system performance and efficiency depends on it.
The generalized design of heat exchangers can be summarized as follows (Babu and Manawar, 2007):
- are established process conditions, - are specified required physical properties over the temperature and pressure
ranges, - it is selected the type of heat exchanger, - it is preliminary estimated the size of the device, based on a heat transfer coefficient
which is specific to the working fluids, the process and the equipment, - it is selected the design of the heat exchanger, - it is assessed this design according to its capacity to face the process specifications
with respect to heat load and also pressure drop, - results the final design, able to meet process requirements, at lowest cost. Shell and tube heat exchangers are the most common category of heat excgangers, met
in a wide range of operating temperatures and pressures.

JOURNAL OF MARINE TECHNOLOGY AND ENVIRONMENT
80
These devices are found in chemical industry, refrigeration, power generation and so on. This construction has a set of tubes put in a shell or container.
The fluid inside the tube is called “tube side fluid”, while the fluid outside the container is known as “shell side fluid”.
Some of the advantages of this type of exchangers are: - the pressures and pressure drops can be modified over a wide range, - thermal stresses can be accommodated without high costs, - for the shell and tubes can be used different materials, - fins can be used to enhance heat transfer, - maintenance is relatively straightforward due to the fact that the equipment can be
dismantled when it is needed. A representation of a shell and tube heat exchanger is given in Figure 1.
Fig. 1. A typical shell and tube heat exchanger, ha ving shell (1), connection chamber (2), guide chamber (3), internal tubes (4), tube sheets (5), baffles (6),
apparatus seal (7). The design of shell and tube heat exchangers involves an important amount of
calculation. Having in mind the importance of this equipment, many techniques have been developed for the design optimization.
In this paper, it is described the genetic algorithm (GA) optimization method. The optimization is based on the minimization of a total cost function, which will be defined in the following.
2. ABOUT THE GENETIC ALGORITHM (GA) Before using this optimization design technique, it is useful a method to encode potential
solution to the optimization problem in a way a computer can process.

JOURNAL OF MARINE TECHNOLOGY AND ENVIRONMENT
81
A possibility is to encode solutions as a binary strings, sequences of 1’s and 0’s where the digit of every position gives the value of some aspect of the solution (Shewale et al, 2010).
It is introduced a metric named fitness function; it will permit each individual, or potential solution, to be quantitatively assessed.
It is generated a random initial population in the ranges of design variables. Then the algorithm creates a sequence of new generations iteratively until it is reached the stopping crtiterion. During this process, the selection of parents relies on their fitness.
Children, meaning the next generation or population, are produced by making random changes to a single parent (mutation) or by combining the vector entries of a pair of parents (crossover), and replace the current population with the children to form the next generation. This algorithm selects individuals having better fitness values as parents and eliminates the inferior.
In this way, the algorithm offers the best individual, which might be the best solution for the studied case.
When talking about economic optimization of heat exchanges, the steps to be followed are:
- finding of heat transfer surface of the exchanger, - costs assessment, - the use of optimization algorithm for the chose of a new set of values for the design
parameters, - iteration of the previous steps until a minimum of the objective function is found. In this paper, it is considered that the objective function to be minimized is the total cost
“Ctot”, which will be defined in the following section. 3. EQUATIONS OF THE PROPOSED APPROACH In this section are given equations specific to heat exchanger design and pressure drop
evaluation (Hadidi et al 2013) and it is also established the objective function to be minimized as the total cost (Caputo et al, 2009).
The heat exchanger surface is found with:
FTU
QS
LM∆= (1)
where: Q – heat load, W, U – the overall heat transfer coefficient, W/(m2K), ∆TLM – the logarithmic mean temperature difference, for counter flow circulation, K, F – correction factor.
( ) ( )2i022p2011i1p1 TTcmTTcmQ −=−= (2)
Above, subscrits “1” refer to shell side and “2” to tube side.

JOURNAL OF MARINE TECHNOLOGY AND ENVIRONMENT
82
+++
=
22f
i
01f
1
1R
dd
R1
1U
αα
(3)
where: α – convective heat transfer coefficient, W/(m2K), Rf – fouling resistance, (m2K)/W, d0 – inlet tube diameter, m, di – outlet tube diameter, m.
14.0
w
133.01
55.01
e
11 PrRe
D36.0
=
µµλα (4)
where: λ – thermal conductivity, W/(mK), De – shell hydraulic diameter, m, Re – Reynolds number, Pr – Prandtl number, µ – dynamic viscosity, (Pa s), w – subscript which refers to the wall. “De” is found with Eq (5) for square pitch and with Eq (6) for triangular pitch.
( )[ ]
0
20
22
e d4dP4
Dπ
π−= (5)
( )[ ]
0
20
22
e d5.04d5.0P43.04
Dπ
π−= (6)
1
1p11
cPr
λµ
= (7)
1
e111
DvRe
µρ= (8)
where: cp – specific heat, kJ/(kg K), ρ – density, kg/m3, v – velocity, m/s. The shell side fluid velocity is given by:

JOURNAL OF MARINE TECHNOLOGY AND ENVIRONMENT
83
11
11 a
mv
ρ= (9)
where: a1 – the cross section area normal to flow direction,
11
11 a
BClDa
ρ= (10)
where: D1 – shell diameter, m, B – baffles spacing, m, Cl – clearance, m.
02 dPCl −= (11)
For the tube side heat transfer coefficient, same Hadidi et al give:
+
+= 3.0
i22
33.1
i22
i
22
Ld
RePr1.01
Ld
PrRe0677.0657.3
dλα
(12)
For Re2<2300, while for 2300<Re2<10000:
( )
( )
+−+
−=
67.0
i
67.02
2
222
i
22 L
d1
1Pr8f
7.121
Pr1000Re8f
dλα
(13)
where: L – length of tube, m, f – friction factor.
with:
( ) 22102 64.1Relog82.1f −−= (14)
For Re2>10000:
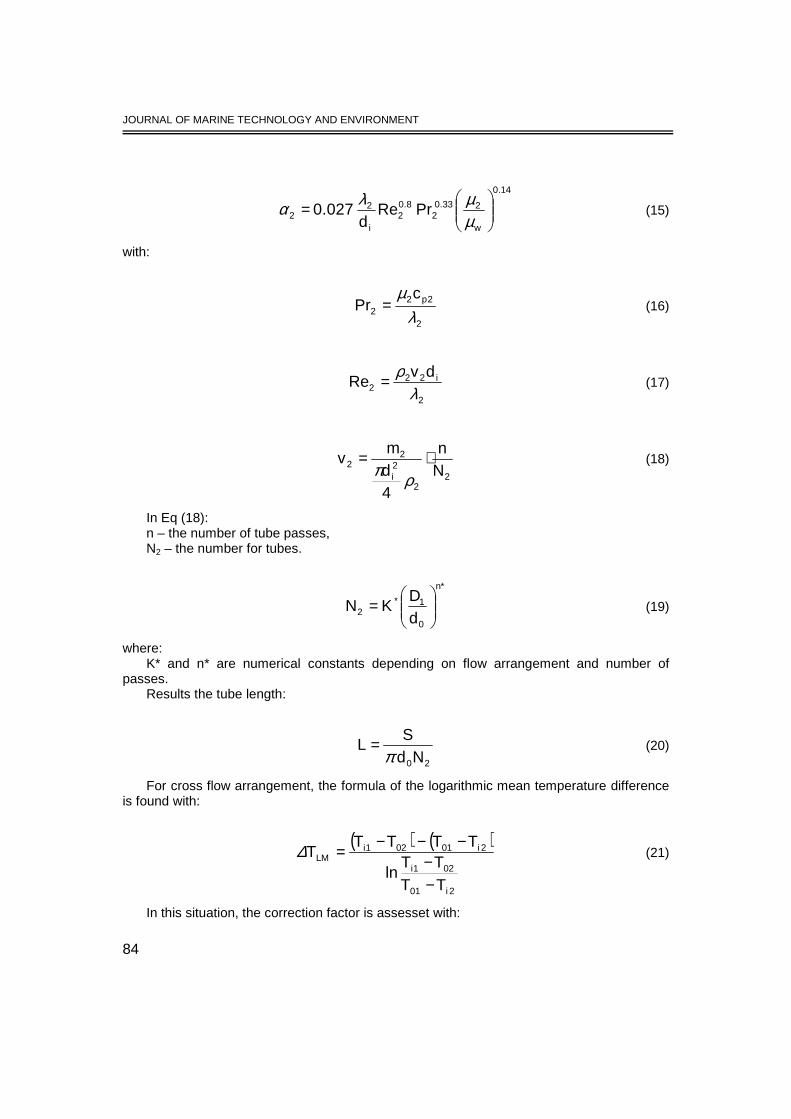
JOURNAL OF MARINE TECHNOLOGY AND ENVIRONMENT
84
14.0
w
233.02
8.02
i
22 PrRe
d027.0
=
µµλα (15)
with:
2
2p22
cPr
λµ
= (16)
2
i222
dvRe
λρ= (17)
2
2
2i
22 N
n
4dm
v ⋅=ρπ
(18)
In Eq (18): n – the number of tube passes, N2 – the number for tubes.
*n
0
12 d
DKN
= ∗ (19)
where: K* and n* are numerical constants depending on flow arrangement and number of
passes. Results the tube length:
20Nd
SL
π= (20)
For cross flow arrangement, the formula of the logarithmic mean temperature difference is found with:
( ) ( )
2i01
021i
2i01021iLM
TTTT
ln
TTTTT
−−
−−−=∆ (21)
In this situation, the correction factor is assesset with:

JOURNAL OF MARINE TECHNOLOGY AND ENVIRONMENT
85
( )( )
+++−+−+−
−−
⋅−
+=
1R1RP2
1R1RP2ln
PR1P1
ln
1R1R
F
2
2
2
(22)
2i02
011i
TTTT
R−−= (23)
2i1i
2i02
TTTT
P−−= (24)
During heat exchanger design, it is need to evaluate pressure drop because of its
connection with heat transfer process. The shell side pressure drop:
=
e
1211
11 DD
BL
2v
fpρ∆ (25)
with:
15.0101 Reb2f −= (26)
where b0 is a constant. The tube side pressure drop:
npfdL
2v
p 2i
222
2
+= ρ∆ (27)
where: p – constant, n – number of tubes passages. In total cost “Ctot” is considered as the objective function, the main objective being the
minimization of this function. The equation for the calculus of this objective function is given bellow (Caputo et al,
2009).
( )
( ) ( ) ∑∑∑===
⋅⋅++
+++
+=v
1ifittjj
N
1ii
i,cleani,cleanN
1iieirop
invtot Cbvbar1
CN
r1
C1CCC
yryr
(28)

JOURNAL OF MARINE TECHNOLOGY AND ENVIRONMENT
86
where: Cinv – capital investment, €, Cop – annual operating cost related to pumping power to overcome friction losses, €/yr, Ceir – energy cost inflation rate, %/yr, r – interest rate, %/yr, Nyr – equipment life, yr, Nclean (1/Tclean) – annual cleanings number, 1/yr, Cclean – unit cost related to every cleaning operation, €, baj – binary activation index for the j – th constraint: 0 – for omitted constraint and 1 – for considered constraint, bvj – binary violation index for the j – th constraint: 0 – for not violated constraint and 1 – for oposit situation, Cfitt – fictitious cost able to reject solutions which do not satisfy one or more constraints. The above equations contribute to the finding of the geometric configuration of a shell
and tube heat exchanger taking into account also economic aspects related to this thermal device, in an optimization model.
4. CONCLUSIONS Working with more energy efficient devices is the main task for today specialists. Having
in mind that shell and tube heat exchangers are the most often met type in different industries, this paper dealed with the optimization of this device.
It was used the genetic algorithm for the description of optimal design of shell and tube heat exchangers, considering as objective function the total cost.
The total cost function should be minimized, in the framework of this method, the named function including costs as: the capital investment, annual operating cost due to pumping power, energy cost inflation rate, costs for cleaning.
REFERENCES [1]. Babu B.V., Manawar S.A. – Differential evolution for optimal design of shell – and – tube heat
exchangers, Chemical Engineering Science 62, pp.3720-3739, 2007 [2]. Caputo A.C., Pelagagge P.M., Salini P. – Economic optimization of heat exchanger design and
maintenance policy, Proc. 20 th International Congress of Mechanical Engineering, Gramado, Brasil, 9 pp, November 15-20, 2009
[3]. Hadidi A., Nazari A. – Design and economic optimization of shell – and – t ube heat exchanger using biogeography – based (BBO) algorithm, Applied Thermal Engineering 51, pp.1263-1272, 2013
[4]. Hadidi A., Hadidi M., Nazari A.– A new design approach for shell – and – tube heat e xchangers using imperialist competitive algorithm (ICA) from economic point of view, Energy Conservation and Management 67, pp.66-74, 2013
[5]. Patel K.S., Mavani A.M. – Baffle space impact on the performance of shell and tube heat exchangers, International Journal of Energy Trends in Engineering and Development, Issue 3, pp.351-358, 2013
[6]. Shewale V.C., Tailor P.R., Parekh A.D. – Application of Genetic Algorithm for optimization o f shell and tube heat exchanger, Proc. of the 37 th National and 4 th International Conference on Fluid Mechanics and Fluid Power, Chennai, India, 10 pp, December 16-18, 2010.

JOURNAL OF MARINE TECHNOLOGY AND ENVIRONMENT
87
EDUCATION REGARDING GREEN REFRIGERANTS IN C.M.U.
MITU DANIELA-ELENA
Constanta Maritime University, Romania
From technical point of view and from environmental point of view, and also for a sustainable development of our society are needed tools which enable to analyse the effects of human activities, including maritime transport. Refrigerated transport is essential for our society due to the need to preserve and protect food or medical supplies during transportation, to the benefit of the people worldwide. But the education of future marine engineers is in closely connected to environmental protection. The paper is focused on needed to knowledge and to understanding the working principles of the marine refrigerating plans, tools which should be at hand of future marine engineers. These competences should be gained during faculty, through a discipline called “Marine Refrigerationg Plants” included in the curricula of the license program entitled “Electromechanics”, developed in C.M.U. This paper is mainly focused on the selection of refrigerants. There are some classic selection criteria: thermophysical properties, technological and economic aspects, safety and environmental factors; however, in addition to these criteria, others have to be considered: local regulations and standards and “cultural” criteria.
Keywords: Marine Refrigerating Plants, green refrigerants, ODP, GWP, environment
1. INTRODUCTION Perishables, such as vegetables and fruits, meat and fish, are goods with high risk when
we talk about their transportation, if proper measures are not taken in terms of temperature control; this is why transport of perishables is one of the most important aspect of refrigeration (Memet, 2100).
The purpose of refrigeration or air-conditioning system is to maintain the temperature of an enclosed space below its surroundings.
There is always a flow of heat from the surroundings into the refrigerated area because the heat flows from a region of higher naturally from temperature to one of lower temperature. By proper insulation the amount of this flow of heat can be minimized and for to maintain a constant temperature in the refrigerated space, the refrigeration system must remove heat from the space at the same rate as the heat is entering from the surroundings.
Aboard ship is using mechanical refrigeration for many purposes, including refrigerated ship’s stores, air-conditioning, and refrigerated cargo storage. Reciprocating compressors are used by the most marine refrigeration systems. But the systems using rotary and centrifugal compressors are becoming more common.
To preserve the food required for consumption by the crew and passengers in good conditions, all the ships has ship’s stores refrigeration equipment. The food is typically stored in insulated walk-in type storage compartments. The installation for a commercial ship such a tanker or containership commonly consists of a freeze room, dairy room, fruit and

JOURNAL OF MARINE TECHNOLOGY AND ENVIRONMENT
88
vegetable room, with two condensing units. The system is designed to maintain the freeze room at -18oC and chill rooms at 0,5oC.
The lowering of the product temperature to desired one in two days after loading the product represent the maximum system capacity. Defrosting of freeze box evaporator coils is done to permit removal of accumulated ice, in order to maintain efficiency. Electric heaters or the use of hot refrigerant gas from the compressor are needed for accomplish the defrosting.
As James Harbach mention in his book, air-conditioning is the control of the temperature and humidity of enclosed spaces to make the environment more comfortable for the people living and working there. While technically it includes winter heating, air-conditioning is normally taken to mean cooling and dehumidifying during warm weather.
A typical air-conditioning system is similar to that used for refrigerated ship’s stores except that higher temperatures are involved and the system tonnage is larger.
Air-conditioning applications are different from refrigerated storage applications in that standby condensing capacity is normally not furnished. The system capacity is selected based on the estimated peak load with all condensing units in service. The plant is typically arranged to permit cross connection of condensing units thus allowing securing unneeded units.
To enable the transport of perishable are installed refrigerated cargo spaces with different sizes from small stand-alone unit on a refrigerated container for complex brine system on a cargo ship in the refrigerator. To permit the carriage of different cargoes at different temperatures, the systems on refrigerated cargo vessels are usually designed for maximum flexibility.
During storage some cargoes such as fruit and vegetables gives off carbon dioxide (CO2) and to prevent dangerous concentrations, ventilation systems are commonly provided to force fresh air into the refrigerated space and exhaust state compartment air to the outside.
It is most economical to employ brine as a secondary refrigerant in an indirect system, in large systems. The primary refrigerant evaporator is employed to chill the secondary refrigerant, the brine, which is then circulated to the refrigerated spaces. The most common types of brine used are calcium chloride and sodium chloride.
Refrigerated containers are fitted with self-contained electric heating and cooling units. The typical unit is mounted flush with the front face of a standard-size container.
Liquefied natural gas (LNG) is an increasingly important refrigerated cargo. Natural gas, wich is primarily methane, is liquefied is shoreside facilities to increase its density and thus the quantity that can be carried in the tanker. The LNG tanker carries the cargo in insulated tanks at atmospheric pressure at a temperature of -160oC.
2. ABOUT MARINE REFRIGERATION EDUCATION IN C.M.U. In Constanta Maritime University (C.M.U.), marine refrigeration education is delivered to
students enrolled in Electromechanics, during one semester, 42 hours. Course, Marine Refrigerating Plants, is study in the 7th semester, in 4th year.
The course objectives are to understanding of the need of marine refrigerating plans, to understanding of the working principles and learning of the specific calculus algorithm.
The application objectives are: practical knowledge regarding assembling, optimization, exploitation, maintenance of marine refrigerating plants.
This course is according to competence A-III/1 - 4.1 Basic construction and operation principles of machinery systems and to the Appendix 3 from STW44, IMO Model Course 7.04 - Marine engineering at the operational level and covers the number of hours required

JOURNAL OF MARINE TECHNOLOGY AND ENVIRONMENT
89
by the STW44, IMO Model Course 7.02 - Marine engineering at the managerial level, competence A-III/2-7.02.
According to STW requires the topics of Marine Refrigerating Plants are: refrigerating cycles; principles of refrigeration; refrigerating compressors on board the ships; components of marine refrigeration plant; brines; cooled spaces for storage; ventilation and air conditioning systems.
In course record of C.M.U., Figure 1,were allocated for refrigerants 3 hours per week: 2 hours/week in the first chapter – Refrigerating cycle and one hour/week in Brines chapter.
Figure 1. Content of the discipline from course record
3. SELECTION OF REFRIGERANT
Following selection criteria are presented during the course on marine refrigeration, delivered in C.M.U. (Hera, 2009 and Iosifescu, 2003).
3.1. THERMODYNAMIC CRITERIA: - the normal vaporization temperature should be low; - the condensation pressure should be moderate; - the compression rate should have low values; - the refrigeration capavity should be high; - the temperature of vapors leaving the compressor should be low.
3.2. THERMO-PHYSICAL CRITERIA: - the thermal conductivity and convective coefficient should presint high values; - the dynamic viscosity should be low.
3.3. TECHNOLOGICAL BEHVIOUR: - compatibility between refrigerant and the oil; - compatibility between refrigerant and materials in use; - possibility for an easy leacking detection.
3.4. ENVIRONMENTAL ASPECTS
Excepting the need for chemicals with null Ozone Depletion Potential (ODP = 0),
refrigeration technology must accomplish the request in respect with the direct Global Warming Potential (GWP) due to refrigerant emission. Natural refrigerants present no or very low GWP and zero ODP, being able to meet Montreal Protocol restrictions (Memet, 2012).
The trend in marine refrigeration consists in the use of HFCS or ammonia instead of CFCS and HCFCS, which have an unfriendly behaviour with the environment (Memet, 2012).

JOURNAL OF MARINE TECHNOLOGY AND ENVIRONMENT
90
4. ENVIRONMENTAL AWARNESS In this section are described ODP and GWP aspects, related to refrigerants often met in
marine refrigeration, aspects familiar to our students at the end of Marine Refrigerating Plants course (Memet, 2011).
The refrigerated transport is a sector that indicates a high potential for technological innovation. Currently, in many cases, there are in use refrigerants belonging to the HCFC family like: HCFC 22 (or R22), R401A, R401B, R409A. The main innovative trend in this respect is the HCFC phase out.
Since 2007, International regulations ask the acceleration of the HCFCs phase – out. These refrigerants are gases with low ozone depletion potential, which were introduced on the market as transitional replacements for CFCs. Developing countries should freeze the HCFC production and consumption at their 2009 – 2010 level by 2013, and phase – out of these compounds by 2030. Till 2040 it is permitted a percent of 2, 5 for existing equipments. Regarding developed countries, their phase out schedule suffered also an acceleration of 10 years to completely eliminate HCFC production and consumption by 2020, the allowed percent for existing equipments being of 0,5.
The accelerated phase – out of HCFCs facilitates the adoption of ozone and climate friendly technologies. These technologies are close related to the improvement of the energy efficiency of the equipment, to the replacement of HCFCs with non or low GWP refrigerants, to the design improvement of the old system and insulating foam or to the integrated strategies and management plans.
More frequently are discussed the existing R22 transport refrigerating systems because this HCFC is more present in transport application. All HCFC’s and blends containing HCFC’s follow the same legislation, and they must be treated in the same way.
The alternatives for R22, chosen depending on the type of the system are: NH3, CO2 and dry ice, HCFs.
NH3 is a refrigerant suitable for large plants, but a special attention is paid to its toxicity, being needed special additional safety requirements;
CO2 and dry ice are able to maintain the cold chain during the entire distribution chain, from production to the end used; involved in airline catering allows the maintenance of a constant low temperature for a long time, without resulting any residues;
HCFs are the best alternative for the systems in which NH3 is not suitable; these refrigerants offer the best solution for accomplish the requirements of the refrigerating transportation due to their availability on the market, energy efficiency, low toxicity, cost, safety, etc.
4.1. OZONE DEPLETION
In order to solve the problem of ozone depletion it was wanted phasing out the
production and consumption of CFC and HCFC refrigerants, because their use is connected directly to the destruction of stratospheric ozone
The ozone layer serve to protect the Earth against ultra – violet radiation, element essential for life, but deadly in overdose. The high level of the international concern related to this issue determined the initiation of a major agreement: the Montreal Protocol. According its directions, the manufacture, sale and use of chlorinated refrigerants are scheduled for phased out.
The effect on the ozone layer of some refrigerants, measured by ODP (Ozone Depletion Potential), for the refrigerants most encountered in the refrigerated transportation is presented in Table 1.

JOURNAL OF MARINE TECHNOLOGY AND ENVIRONMENT
91
Table 1: The effect on the ozone layer of some refrigerants
Family of refrigerants
CFCs HCFCs HFCs Natural refrigerants
Main refrigerants
ODP Main refrigerants
ODP Main refrigerants
ODP Main refrigerants ODP
CFC 11 CFC 12
1 1 HCFC 22 0,05
HFC 134a HFC 404A HFC 407C HFC 410A
0 0 0 0
R717 (ammonia) R744 (carbon dioxide)
Hydrocarbons
0 0 0
4.2. GLOBAL WARMING
The Earth is warming at an unprecedented level because of carbon dioxide emissions resulted from human activities. The consequences of the global warming are alarming: the melting of the polar ice caps, an importing rising of sea level, extreme weather phenomena, erosion, desertification, disappearance of many species. Refrigerated transport and refrigeration itself, have their contribution, measured by Global Warming Potential (GWP), coming from the direct release of refrigerants having high GWP, and from the release of carbon dioxide resulted from the fuel combustion needed to produce power to drive refrigerating and air conditioning equipments.
Direct release of refrigerants represents about 2% of total equivalent carbon dioxide release, while the refrigerating and air conditioning industry is responsible of about 20% of the registered global warming.
The global warming challenge is expressed by the minimization of the demand for mechanical cooling, by the efficiency improvement in order to diminish the power consumption, by the leakage diminishing or by the development of new refrigerants offering high efficiency and low global warming potential.
Table 2 show the effect of the global warming of some refrigerants often met in the refrigerated transportation.
Table 2: the effect of the global warming of some refrigerants
Family of refrigerants CFCs HCFCs HFCs Natural refrigerants
Main refrigerants
ODP Main refrigerants
ODP Main refrigerants
ODP Main refrigerants ODP
CFC 11 CFC 12
7750 10890 HCFC 22 1810
HFC 134a HFC 404A HFC 410A
1430 3900 2100
R717 (ammonia) R744 (carbon
dioxide) Hydrocarbons
<1 1
20
4.3. REFRIGERANT SELECTION
There is no general rule governing the selection of refrigerants. There are, of course, the five classic criteria: thermophysical properties, technological and economic aspects, safety and environmental factors; however, in addition to these criteria, others have to be considered: local regulations and standards and “cultural” criteria. The best approach when presenting evolution and trends is certainly the per-application approach.
The ideal refrigerant is not nominated till now. Challenges facing the refrigerated transportation are translated into the defining the most suitable refrigerant for this sector and the climbing of disadvantages shown by each refrigerant. The selection of refrigerants has to comply with different criteria, among these the environmental aspect being a major one.
There are some new refrigerants, which reply to the environmental demands, able to replace the old refrigerants. The selection for a specific application, also for the refrigerating transport, must consider:

JOURNAL OF MARINE TECHNOLOGY AND ENVIRONMENT
92
- the specific refrigerating capacity, - the specific mechanical work, - the coefficient of performance (COP).
An assessment done for different refrigerants, leads to: - the specific refrigerating capacity, which gives the dimensions of the compressor,
should be at least equal with the one of the old refrigerant, in the situation of a retrofitting; in the case of a new installation, a lower value leads to a compressor with increased dimensions;
- the specific mechanical work, which gives the power of the motor, should be equal or less at the new refrigerant that the old one, in the situation of a retrofitting; in the case of a new equipment must be established a correlation between the compressor and the size of the electric motor;
- refrigerants showing higher values for COP show less energy consumption for the same cooling effect.
5. CONCLUSIONS
In Constanta Maritime University (C.M.U.), Marine Refrigarating Plants course is delivered to students enrolled in Naval Electromechanics, during 1 semester, 42 hours. Course objectives comply with STW44, IMO Model Course 7.04 and 7.02, Marine engineering at the operational level and managerial level, and want to demonstrate a knowledge and understanding the need of marine refrigerating plans, the working principles and the practical knowledge regarding assembling, optimization, exploitation, maintenance of marine refrigerating plants.
The trend in marine refrigeration consists in the use of HFCS or ammonia instead of CFCS and HCFCS, which have an unfriendly behaviour with the environment.
NH3 is a refrigerant suitable for large plants, but a special attention is paid to its toxicity, being needed special additional safety requirements;
CO2 and dry ice are able to maintain the cold chain during the entire distribution chain, from production to the end used; involved in airline catering allows the maintenance of a constant low temperature for a long time, without resulting any residues;
HCFs are the best alternative for the systems in which NH3 is not suitable; these refrigerants offer the best solution for accomplish the requirements of the refrigerating transportation due to their availability on the market, energy efficiency, low toxicity, cost, safety, etc.
REFERENCES [1]. Memet F. – The impact of HCFC phase out on marine refrigeration and air conditioning, CMU
Annals, year XI, vol 13, pp 110-113, 2010. [2]. Harbach J.A. – Marine refrigeration and air-conditioning, Cornell Maritime Press, Centreville,
Maryland, ISBN-13:978-0-87033-565-5, 2005. [3]. Hera D. – Instalatii frigorifice, Vol. I, Agenti frigorifici, Matrix Rom, Bucuresti, 2009. [4]. Iosifescu C., Iosifescu C. – Calculul si constructia instalatiilor frigorifice, Ed.BREN, Bucuresti,
2003. [5]. Memet F. – Scientific and religious considerations on the protective role of the ozone layer,
European Journal of Science and Techology, Vol.8, NO2, pp. 55-62, 2012. [6]. Memet F. – A first and second law analysis development on a two stage vapor compression
refrigeration system, Journal of Marine Technology and Environmental, Vol. I, pp. 81-86, 2012. [7]. Memet F. – An aspect of maintaining R-22 systems in refrigerated transportation. The selection
of R404A, Journal of Marine Technology and Environmental, Vol.I, pp. 71-76, 2011.


For Authors Are edited scientific papers in topics, written in English. Papers are selected after a peer review. Each participant is allowed to send maximum 2 papers as first author. Authors should make sure that the manuscripts submitted are ready for refereeing. The papers that are to be published must bring scientific contributions to the journal. The papers also have to contain the results of some of your work. It is strongly recommended an even number of pages, no longer than 6-10 pages. The papers that do not respect the publishing conditions and which are not integrated in the thematic of this journal will be rejected from the start by the Editorial Board. Authors submitting an article affirm that the same manuscript is not concurrently submitted to another publication. The authors are entirely responsible for the content of their papers.
PUBLISHED SINCE 2008
ISSN:1844-6116 ON LINE SINCE: 2008
PUBLISHED BY: Editura Nautica/ Constanta Maritime University