JOURNAL OF LA Region Growing for Segmenting Green...
14
JOURNAL OF L A T E X CLASS FILES, VOL. 13, NO. 9, SEPTEMBER 2014 1 Region Growing for Segmenting Green Microalgae Images Vinicius R. P. Borges, Member, IEEE, Maria Cristina F. de Oliveira, Member, IEEE, Tha´ ıs Garcia Silva, Fellow, OSA, Armando Augusto Henriques Vieira, Fellow, OSA, Bernd Hamann, Member, IEEE, Abstract—We describe a specialized methodology for segmenting 2D microscopy digital images of freshwater green microalgae. The goal is to obtain representative algae shapes to extract morphological features to be used in a posterior step of taxonomical classification of the species. The proposed methodology is based on the seeded region growing principle and employs specific filtering and contrast enhancement preprocessing steps to improve segmentation precision. After preprocessing it automatically computes a pre-segmentation image which is employed to determine where to place the seed points and also to estimate the statistical probability distributions that characterize the target regions, i.e., the algae regions and the background, respectively. This information is used to set the homogeneity criterion for region growing. We evaluate the proposed methodology by comparing the resulting segmentations with a set of corresponding ground-truth segmentations (provided by an expert biologist) and also with segmentations obtained with existing strategies. The experimental results show that it achieves highly accurate segmentation rates with greater efficiency, as compared with the performance of current segmentation approaches from the literature and with a previous level-set based solution specialized for this particular problem. Index Terms—Seeded region growing, freshwater green microalgae, image segmentation, Gaussian distribution ✦ 1 I NTRODUCTION Algae are a food source and primordial oxygen producers in aquatic environments, thus affecting water properties such as color, odour and taste [1]. Due to their sensitivity to environmental changes, these microorganisms act as effec- tive indicators of water quality and ecological conditions. Researchers have been studying the potential of microalgae as biomass [2] or protein sources [3], in chemical processes [4], in oil production [5], and in medicine [6]. There is a huge variety of microalgae species and fami- lies and their taxonomical classification is a highly relevant problem in phycology. For the particular case of freshwater green microalgae, image-based taxonomical classification is carried out manually by an expert. The procedure requires sampling algae cultures for observation under a microscope and then categorizing the observed organisms according to a predefined set of so-called “identification keys” which take into account mainly their morphological features as their life cycle develops. This is a highly complex and time consuming process, demanding a detailed manual analysis of multiple images in order to identify the distinguishing features of the various species. Furthermore, the accuracy of a suggested taxonomical classification is highly dependent • Vinicius R. P. Borges and Maria Cristina F. de Oliveira are with the Instituto de Ciˆ encias Matem´ aticas e de Computa¸ c˜ ao, University of S˜ ao Paulo (USP), S˜ ao Carlos, SP, Brazil E-mail: { viniciusrpb, cristina } at icmc.usp.br • Bernd Hamann is with the Department of Computer Science, University of California, Davis (UC Davis), Davis, CA, 95616, United States E-mail: [email protected] • Tha´ ıs G. Silva and Armando A. H. Vieira are with the Departamento de Botˆ anica, Federal University of S˜ ao Carlos, S˜ ao Carlos, SP, Brazil E-mail: [email protected],[email protected] Manuscript received April 19, 2005; revised September 17, 2014. on the taxonomist’s training and expertise. Even for experts, the task may prove difficult and error prone, as some algae species share similar morphological features, rendering their proposed classification inherently innacurate. This is the case, for example, of the species in a particular family complex identified as Selenastraceae, which is known to have an inconsistent taxonomy [7]. There have been previous efforts towards the develop- ment of computational support for taxonomical classifica- tion of algae species. Typically, the systems embed image processing and pattern recognition algorithms that capture the relevant image properties and derive an appropriate representation for further processing. Nonetheless, some systems [8] [9] employ computationally expensive manual or user-guided segmentation procedures that render them difficult to use and unfeasible to handle larger image sets. Thus, the problem of how to extract representative informa- tion from green algae images with minimum user effort and maximal accuracy is still open. In this paper we address this problem, focusing on strategies for automatically and accurately segmenting algae regions from microscope images, a necessary step to support the subsequent extraction of the shape features required for the taxonomical classification task. The goal of image segmentation is to partition a digital image into its disjoint constitutent regions that share ho- mogeneous properties (color or texture) and are expected to characterize the target objects [10] [11]. The problem is particularly challenging for the case of images depicting samples from the Selenastraceae green algae family, due to peculiarities resulting both from the application domain and the image acquisition process, which are detailed in Section 2.2. From the wide diversity of image segmentation meth-
-
Upload
truongdien -
Category
Documents
-
view
213 -
download
0
Transcript of JOURNAL OF LA Region Growing for Segmenting Green...

JOURNAL OF LATEX CLASS FILES, VOL. 13, NO. 9, SEPTEMBER 2014 1
Region Growing for Segmenting GreenMicroalgae Images
Vinicius R. P. Borges, Member, IEEE, Maria Cristina F. de Oliveira, Member, IEEE, Thaıs Garcia
Silva, Fellow, OSA, Armando Augusto Henriques Vieira, Fellow, OSA, Bernd Hamann, Member, IEEE,
Abstract—We describe a specialized methodology for segmenting 2D microscopy digital images of freshwater green microalgae. The
goal is to obtain representative algae shapes to extract morphological features to be used in a posterior step of taxonomical
classification of the species. The proposed methodology is based on the seeded region growing principle and employs specific filtering
and contrast enhancement preprocessing steps to improve segmentation precision. After preprocessing it automatically computes a
pre-segmentation image which is employed to determine where to place the seed points and also to estimate the statistical probability
distributions that characterize the target regions, i.e., the algae regions and the background, respectively. This information is used to
set the homogeneity criterion for region growing. We evaluate the proposed methodology by comparing the resulting segmentations
with a set of corresponding ground-truth segmentations (provided by an expert biologist) and also with segmentations obtained with
existing strategies. The experimental results show that it achieves highly accurate segmentation rates with greater efficiency, as
compared with the performance of current segmentation approaches from the literature and with a previous level-set based solution
specialized for this particular problem.
Index Terms—Seeded region growing, freshwater green microalgae, image segmentation, Gaussian distribution
1 INTRODUCTION
Algae are a food source and primordial oxygen producers inaquatic environments, thus affecting water properties suchas color, odour and taste [1]. Due to their sensitivity toenvironmental changes, these microorganisms act as effec-tive indicators of water quality and ecological conditions.Researchers have been studying the potential of microalgaeas biomass [2] or protein sources [3], in chemical processes[4], in oil production [5], and in medicine [6].
There is a huge variety of microalgae species and fami-lies and their taxonomical classification is a highly relevantproblem in phycology. For the particular case of freshwatergreen microalgae, image-based taxonomical classification iscarried out manually by an expert. The procedure requiressampling algae cultures for observation under a microscopeand then categorizing the observed organisms according toa predefined set of so-called “identification keys” whichtake into account mainly their morphological features astheir life cycle develops. This is a highly complex and timeconsuming process, demanding a detailed manual analysisof multiple images in order to identify the distinguishingfeatures of the various species. Furthermore, the accuracy ofa suggested taxonomical classification is highly dependent
• Vinicius R. P. Borges and Maria Cristina F. de Oliveira are with theInstituto de Ciencias Matematicas e de Computacao, University of SaoPaulo (USP), Sao Carlos, SP, BrazilE-mail: viniciusrpb, cristina at icmc.usp.br
• Bernd Hamann is with the Department of Computer Science, Universityof California, Davis (UC Davis), Davis, CA, 95616, United StatesE-mail: [email protected]
• Thaıs G. Silva and Armando A. H. Vieira are with the Departamento deBotanica, Federal University of Sao Carlos, Sao Carlos, SP, BrazilE-mail: [email protected],[email protected]
Manuscript received April 19, 2005; revised September 17, 2014.
on the taxonomist’s training and expertise.Even for experts, the task may prove difficult and error
prone, as some algae species share similar morphologicalfeatures, rendering their proposed classification inherentlyinnacurate. This is the case, for example, of the species in aparticular family complex identified as Selenastraceae, whichis known to have an inconsistent taxonomy [7].
There have been previous efforts towards the develop-ment of computational support for taxonomical classifica-tion of algae species. Typically, the systems embed imageprocessing and pattern recognition algorithms that capturethe relevant image properties and derive an appropriaterepresentation for further processing. Nonetheless, somesystems [8] [9] employ computationally expensive manualor user-guided segmentation procedures that render themdifficult to use and unfeasible to handle larger image sets.Thus, the problem of how to extract representative informa-tion from green algae images with minimum user effort andmaximal accuracy is still open.
In this paper we address this problem, focusing onstrategies for automatically and accurately segmenting algaeregions from microscope images, a necessary step to supportthe subsequent extraction of the shape features required forthe taxonomical classification task.
The goal of image segmentation is to partition a digitalimage into its disjoint constitutent regions that share ho-mogeneous properties (color or texture) and are expectedto characterize the target objects [10] [11]. The problem isparticularly challenging for the case of images depictingsamples from the Selenastraceae green algae family, due topeculiarities resulting both from the application domain andthe image acquisition process, which are detailed in Section2.2.
From the wide diversity of image segmentation meth-

JOURNAL OF LATEX CLASS FILES, VOL. 13, NO. 9, SEPTEMBER 2014 2
ods, thresholding, edge-based and region-based strategieshave been employed to segment biological images acquiredwith a microscope, such as phytoplankton [12], diatoms[13] and related algae genera [14]. Some authors adoptededge-based methods which search for image discontinuitiescharacterized by abrupt intensity changes among regions[15]. Generally, these approaches compute derivatives be-tween neighboring points in the image domain and selectthe higher responses, which are associated with edges. Con-ventional edge operators such as Roberts, Sobel and Prewitt[11] or the Canny edge detector [16] are popular choices.However, edge-based methods are sensitive to noise andrequire additional postprocessing steps to obtain regionswith closed contours.
Methods based on dynamic curves that evolve towardsimage objects boundaries, such as Active Contours [17] andLevel Set [18] [19] have also been succesfully applied inthis context. In a previous research, we combined a levelset approach with automatically extracted edge and regioninformation to guide the curve evolution towards the algaeregion boundaries [20]. Although it achieves good segmen-tation accuracy, the method suffers from a known limitationof contour-based approaches in general: it requires numeri-cally solving Partial Differential Equations (PDEs), yieldinga time consuming segmentation process unfeasible for real-time applications [21]. Moreover, it does not perform wellon images of certain algae species with transparent areas.
Region-based methods, on the other hand, work by par-titioning the image into multiple disjoint regions. A classicalexample is the Seeded Region Growing (SRG) algorithmproposed by Adams and Bischof [22]. The underlying ratio-nale is, given a set of seeds (an image domain point orsubregion), to grow regions by merging points with theirnearest neighboring seeded region that satisfies a predefinedhomogeneity criterion. A criterion is chosen by taking intoaccount the distinguishing characteristics of the multipleimage regions. Region growing is effective, fast, robust tonoise and requires no complex parameter tuning [23]. How-ever, the suitable number of seed points, their placementin the image domain and the homogeneity criteria thatcharacterize the multiple image regions must be informed[10].
We exploit the region growing principle and a homo-geneity criterion of image regions to introduce a specializedmethodology to handle the described segmentation prob-lem. Images are initially preprocessed for noise supressionand then transformed to the Hue-Saturation-Value (HSV)space in order to reduce the intensity variation in theirregions. After that, we perform a contrast enhancement inthe hue channel using an equalized version of the valuechannel. A pre-segmentation image is automatically gener-ated from the original RGB image that makes it possibleto define the proper number of seed points, avoiding un-desirable situations of missing relevant regions or placingmultiple seeds in a single region. The pre-segmentationimage is also used to sample intensities of the algae andbackground regions in order to estimate their associatedGaussian distributions. The region homogeneity criterion toguide region growth is set by performing likelihood tests onthe estimated Gaussian distributions. Finally, algae regionsare smoothed with a morphological operation based on the
rolling ball operator [24]. These steps compose a highlyaccurate and efficient technique for segmenting green algaein digital images.
This paper is organized as follows: Section 2 presentssimilar region-based approaches for segmenting algae andbiological images and establishes the motivation for thiswork. Section 3 describes the preprocessing steps for con-trast enhancement and image smoothing. Section 4 detailsthe proposed method, including the computation of the pre-segmentation image used in the sampling procedure and toobtain the seed points. Section 5 presents experimental re-sults obtained by applying the proposed strategy to a set ofgreen algae images. Finally, Section 6 provides conclusionsand discusses possible future research.
2 RELATED WORK AND MOTIVATION
The quality of segmentation directly affects the ability ofsuccessfully performing feature extraction from images.Defining an appropriate segmentation technique is a highlyapplication dependent problem that requires a solid knowl-edge about specific image properties such as brightness,noise, texture and contrast. In the next sections we reviewrelated work from the literature and their limitations in faceof the challenges identified for the green algae images, anddescribe the specific issues involved when segmenting algaeimages of the Selenastraceae family.
2.1 Previous work on microalgae segmentation
Over the last two decades many approaches have beenintroduced to identify or explicitly segment cells, objectsor regions of interest in biological images. Most techniquesreported in the literature also detail preprocessing and post-segmentation procedures, since raw biological images arenaturally noisy or present low contrast.
Edge-based segmentation methods based on identifyingabrupt intensity changes are often employed in this context.Differential operators such as Sobel, Canny and Laplacianof Gaussian are typically combined with thresholding or theWathershed transform [25] [26] to improve the accuracy ofedge detection. Jalba et al. [27], for example, introduced ahybrid strategy that combines edge and region informationto automatically segment diatoms. Their solution combinesthe Watershed transform and a mathematical morphologyoperation to select markers (small groupings of pixels). Inorder to avoid over-segmentation, a known drawback ofthe watershed method, a specific case of the Image ForestingTransform (IFT) is employed to change the image homotype.A final segmentation is obtained by extracting the externalcontour of the diatoms in the resulting watershed image.The method by Jalba et al. produced up to 98% correct con-tours. The failure cases were registered on diatom imageswith low contrast or blurred objects due to low resolution.
Mosleh et al. [28] developed a computer-based systemto automatically detect, recognize, and identify specific mi-croalgae species. Segmentation is based on detecting regionboundaries with the Canny filter. However, the approachrequires performing an edge linking in the resulting binaryimages for a correct identification of the algae’s externalclosed contours. Then, essential morphological operations

JOURNAL OF LATEX CLASS FILES, VOL. 13, NO. 9, SEPTEMBER 2014 3
such as image border removal, boundary area filling andexclusion of small regions are performed on the binaryimages to preserve the algae regions only.
Promdaen et al. [29] proposed an automated methodologyfor microalgae classification which also includes prepro-cessing, segmentation and feature extraction steps. Specif-ically, segmentation can be performed in a single or ina multiresolution fashion, according to the morphologicalcharacteristics of the algae, determined during the process.The single approach is useful for algae shapes with subtledetails and it is based on edge detection by the Canny filter.The multi-resolution part consists of running the singleapproach several times and incorporating additional stepsto smooth the region boundaries.
Accurate segmentation based on edge detection requiresobject boundaries to be closed, otherwise further processingprocedures are necessary, such as edge-linking. Contour-based approaches [17] [30] [20] based on dynamic curvescan minimize such limitations, but depend on computingnumerical solutions and on the convergence of an optimiza-tion process. In our previous research [20] we developeda specialized level set methodology that considers a statis-tical description of the algae and the background regionsby means of Gaussian distributions. Although it achievesgood segmentation accuracy, the method is computation-ally expensive, since it depends on the convergence of anoptimization process. Another weakness of this method isrelated to the preservation of certain perculiar structuresthat appear in some specific algae species, such as mucilage.
Alternatively, region-based approaches rely on groupingneighboring pixels into regions according to a similaritycriterion. Region growing algorithms have been applied toblood cell images [31], digital mammography [32], retinalvessel segmentation [33] and remote sensing [34]. Someauthors have focused on developing application-specificapproaches for automatic seed placement and the similaritydecision strategy.
A marine phytoplankton identification system devel-oped by Cuiping et al. [35] segments algae cells with aregion-growing algorithm. First a Canny edge detector isapplied to the original image to detect algae boundaries, fol-lowed by a morphological operator to remove small regions.Thresholding with Otsu’s method is then applied to obtaina background patch for which a mean intensity value isestimated. The region-growing method uses intensities froma coarse background as a stopping criterion to automaticallydistribute the seeds through the image domain.
Tan et al. [36] proposed an automated system for marinealgae identification which comprises the steps of filter-ing, segmentation, feature extraction and classification ofspecies. First, a preprocessing step is required to highlightthe presence of algae, due to the low contrast of the originalimages. A histogram of the corresponding HSV model isanalyzed to decide whether to use green or white color forthe threshold-based binarization. After the segmentation, amorphological operation attempts to fill holes and removeisolated microregions.
Schulze et al. [37] devised an automated system forphytoplankton recognition named PlanktoVision, which in-tegrates image acquisition, segmentation, feature extractionand the classification process. Preprocessing consists of con-
trast adjustment by means of histogram normalization andboundary enhancement with the Sobel operator to handletransparency. Segmentation is based on region growing,in which the seeds are computed and placed through thebackground region using a rough segmentation obtainedwith the Watershed Transform. The mode values of eacharea in this segmentation are computed and the differencesin their standard deviations are used to determine whetherto merge similar regions.
Despite being successfull on the applications to whichthey have been designed, the above methods cannot handlethe specific challenges faced in the segmentation of imagesdepicting algae from the Selenastraceae family, as detailed inthe next section.
2.2 Problem characteristics
Observing the images available we noticed that the algaespecies in the Selenastraceae family are of diverse shapes,e.g., from round-shaped single cells, as illustrated in Figure1(a), to the ellongated organisms shown in Figure 1(b).Furthermore, the algae morphologies change slighly alongtheir life cyclean algae can remain solitary or form colonies(grouped cells), also very diversely shaped, as depicted inFigures 1(c) and 1(d).
This diversity and other peculiar image characteristicsresulting from the acquisition process render the automaticsegmentation of these images a very difficult task. Thus,a segmentation method which is shown to be effective onthese samples is likely to perform well also on other samplesdepicting less complex microalgae families—providing anessential tool for developing further computational supportto the taxonomical classification task.
(a) (b)
(c) (d)
Fig. 1. Examples of green microalgae images: (a) image characterizedby the presence of noise, artifacts and small objects; (b) ellongatedsingle algae image characterized by the mucilage in its bottom corner(c) image with the presence of colonies, showing overlap of multiplealgae cells; (d) a colony of multiple ellongated cells.
The images are acquired in the microscope with a res-olution of 600 × 800 and are quantized in 8 bits per colorchannel. Each image depicts one or multiple algae regions,

JOURNAL OF LATEX CLASS FILES, VOL. 13, NO. 9, SEPTEMBER 2014 4
but they are all from a single species, as the image cap-tures an observation of a specific cultured strain under themicroscope. Notice how the intensities in the backgroundregions of the multiple images in Figure 1 differ, and howeach image shows a slight and smooth variation in itsbackground. Moreover, although algae cells are generallygreen, they sometimes present brighter regions near corners(see Figures 1(c) and 1(d)) due to the algaes’ movementunder the microscope lens.
The images also present noise and artifacts, for example,the image in Figure 1(a) shows some dark particles and anartifact in the bottom area. In Figure 1(b) we notice a trans-parent dead cell membrane touching the algae, surroundedby bright pixels, which will likely affect a shape detectionprocedure. Figure 1(c) presents round-shaped objects withbright interior and dark boundaries. Thus, the proposedsegmentation methodology must be robust to noise and tothe presence of artifacts.
To further illustrate the complexity of the segmentationtask in this case, Figure 2 shows some segmentation resultsobtained with standard approaches from the literature thathave been previously applied to biological images. We per-formed a binarization on the green channel of the originalRGB image shown in Figure 1(d), using a threshold valuecomputed with Otsu’s method [38], which produced theimage shown in Figure 2(a). The poor segmentation resultsare due to the wide range of intensities found in the interiorof algae regions.
Alternatively, applying the Canny Edge detector to thegreen channel of the image in Figure 1(d) generates thebinary image shown in Figure 2(b). Noticeably, the contoursdetected are not closed. The abrupt changes in intensities inthe algae regions prevent the method from obtaining closedand regular contours.
In Figure 2(c) we present a segmentation result obtainedwith the Watershed Transform applied to the smooth imageshown in Figure 2(a), in which we selected manually thearea corresponding to the algae region in the watershedimage. This result is affected by the smooth intensity varia-tion in the background and the transparencies in the algaecorners, which lead to poor segmentation because somealgae areas could not be correctly recognized.
Figure 2(d) shows the segmentation produced by thelevel set approach introduced in our previous work [20],which did not manage to group some colony cells due tothe presence of transparent areas, specifically in the regionswhere the algae cells meet. Thus, the diffusion process, in-herent to the level set equation and responsible for smooth-ing the image, was not capable of supressing the noise andhandling the transparent regions, due to limitations of theRGB color model.
In the next sections we detail our novel approach to han-dle the segmentation. By changing the image representationto the HSV model and applying an appropriate contrastenhancement to highlight the critical areas we can improvesegmentation accuracy and preserve the intrincate shapeproperties of these microalgae species.
(a) (b)
(c) (d)
Fig. 2. Conventional approaches for segmenting biological images: (a)Original RGB green microalgae image; (b) result obtained with binariza-tion using Otsu’s threshold; (c) result obtained with edge detection usingthe Canny algorithm; (d) result obtained with the Watershed Transform.
3 PREPROCESSING STEPS
Some preprocessing steps are executed to improve imagequality before applying the region growing algorithm. Thefirst step smooths the original RGB image prior to obtainingits corresponding HSV representation. Further processingis applied to the Hue channel of the HSV representation,which provides sufficient contrast to distinguish betweenthe algae and the background regions. A contrast enhance-ment is then applied to generate a smooth image withhighlighted algae regions.
3.1 Image Smoothing
The original RGB image is initialy filtered to supress noiseand artifacts observed in regions describing both algaecells and background. Smoothing is also important becausethe curves defining the algae cell boundaries are naturallyrough and the pixel values in their internal regions areconsiderably heterogeneous, with colors varying from greento white.
In order to obtain smoother images in which both back-ground and algae regions present homogeneous intensities,from a wide diversity of possible image filtering techniqueswe chose to apply the annisotropic diffusion filter (ADF)introduced by Barcelos et al. [39], because its smoothingprocess blurs the image internal regions while preservingboundary information.
Let Ω ⊂ R2 be the image domain and I : Ω → R
3
the function designed to describe a digital color image. Themathematical model for the ADF filter is given by:
ut = g|∇u|div(
∇u|∇u|
)
− λ(1− g)(u− I), (1)
in which div is the divergent operator, I = I(x) is the imageto be filtered and u = u(x, t) is a smooth version of I at atime step t > 0, where u(x, 0) = I(x). The parameter λ

JOURNAL OF LATEX CLASS FILES, VOL. 13, NO. 9, SEPTEMBER 2014 5
balances the smoothness of the region boundaries – the goalis to smooth the boundary whilst preserving the importantshape properties. g is a positive boundary potential, usuallychosen as a decreasing function of the image gradient. Thisfunction is chosen to satisfy lims→∞ g(r) = 1, so that thediffusion process is reduced on the boundaries. Thus, anusual choice for g is given by:
g(r) =1
1 + |∇r|2 . (2)
Eq. (1) is solved numerically by computing the Euler-Lagrange equations associated with a gradient descentscheme [40]. The partial differential equations obtained arediscretized using the Finite Difference Scheme [41]. In orderto compute the numerical solution for u, the parameters inEquations (1) and (2) were set to λ = 0.01 and t = 20 timeiterations. These values were set after experimentation withmultiple combinations of parameter values, picking thosevalues which yielded the best segmentation accuracy rateson a test data set. In the subsequent steps we shall denotethe filtered image IADF as the final u.
(c) (d)
Fig. 3. Annisotropic diffusion filtering: (a) original RGB image; (b) smoothimage IADF .
3.2 HSV Model
We chose to work with the HSV representation of the filteredRGB image IADF , which is more effective to capture thecontrast between the algae cells and the background.
The corresponding HSV model of a given RGB inputimage may be computed using the equations given in[11]. Figure 4 illustrates the results of the conversion fora particular green algae image. Figure 4(a) presents theoriginal RGB image, whereas Figures 4 (b), (c) and (d) showthe Hue (H), Saturation (S) and Value (V) channels of thecorresponding HSV image. It is noticeable in the imageshowing the V channel, depicted in Figure 4(b) that the algaecells are characterized by a uniform gray intensity, whilst thebackground is noisy – it is possible to observe the lightingvariation in the background areas. The saturation channel,shown in Figure 4(c), presents the algae regions in brighterintensities with blurred boundaries and it is not used in thesubsequent steps. The V channel image depicted in Figure4(d) is simply a grayscale image, and is used in the followingstep responsible for the Hue contrast enhancement.
3.3 Image Enhancement
A contrast enhancement procedure is applied to the Huechannel in order to enable a more accurate identification of
(a) (b)
(c) (d)
Fig. 4. Green algae image transformed to the HSV representation: (a)original RGB image; (b) Hue channel; (c) Saturation channel; (d) Valuechannel.
the algae regions. The procedure also considers the intensityinformation registered in the Value channel, since the Huechannel alone may not disclose sufficient information. Therationale is to perform a histogram equalization in the Valuechannel that allows inspecting the intensity variation ofthe background pixels and then identifying those intensitylevels most likely associated with algae pixels. Such inten-sities are determined by thresholding the equalized image,thus generating a binary image that is used to weight andhighlight the algae pixels in the Hue channel.
The histogram equalization generates a new image byquantizing the intensities in the Value channel to a prede-fined number of discrete gray levels. The pixel values areroughly uniformly distributed across the quantized graylevel bins in image IEQ, so that its histogram is approxi-mately flat. Here, we chose to transform the value channel to64 intensities due to a better discrimination of algae-relatedpixels, obtaining the equalized image IEQ.
The algae regions are associated with the lower inten-sities in the histogram of image IEQ, we thus binarize theequalized image IEQ by setting a threshold value τ accord-ing to a histogram analysis. Our strategy is to consider thefour lowest intensities in the histogram that have non-zeroresponses and set τ as the gray level with the second higherresponse. Then, we compute the binary image as:
BEQ(x) =
1, if IEQ(x) ≤ τ
0, otherwise,(3)
where BEQ is the binary mask image flagging the algae-related pixels. The image enhancement will weight suchpixels to emphasize their intensities, while preserving back-ground patterns. This operation is described in Eq. (4),which doubles the intensities of the background pixels inthe Hue channel Ihue:
IH(x) =
2Ihue, if BEQ(x) = 0
0, otherwise.(4)

JOURNAL OF LATEX CLASS FILES, VOL. 13, NO. 9, SEPTEMBER 2014 6
The intermediate image IH in the above equation refersto the updated Hue channel in which the algae regions arehighlighted. Afterwards, IH is normalized and its squarefunction computed, in order to correct the different shadesthat may arise in the enhanced Hue channel:
IEN = I2H . (5)
The resulting image IEN displays a better visual contrastbetween the algae and the background regions, as comparedto the original hue channel. The steps of the enhancementprocedure are illustrated in Figure 5. Figure 5(a) shows theoriginal Hue channel image. Figure 5(b) presents IEQ, theValue channel image after equalization, in which the pixelsassociated with the algae cells have the lowest intensities.Figure 5(c) shows the weighted image BEQ that indicateswhich pixels in the Hue channel must be enhanced. Finally,Figure 5(d) depicts the final enhanced Hue channel image,in which the algae regions are noticeably enhanced whereasthe intensity patterns have been preserved.
(a) (b)
(c) (d)
Fig. 5. Image enhancement: (a) the original Hue channel image Ihue;(b) the equalized Value channel image IEQ; (c) the binary image BEQ;(d) the enhanced Hue channel image IEN .
Once the preprocessing steps are finished, we obtain anappropriate Hue channel IEN for the upcoming segmenta-tion process, in which algae cells have distinct intensitiesrelative to the background pixels. In the following sectionwe describe the segmentation technique based on the regiongrowing principle.
4 SEEDED REGION GROWING
The seeded region growing algorithm, or simply regiongrowing algorithm, operates by grouping (i.e., growing)pixels or subregions into larger regions based on a prede-fined similarity criterion [11]. Some seed pixels are initiallyselected based on some criterion (e.g. color, intensity, or tex-ture). Once the initial seeds are placed, the growth processseeks to obtain homogeneous image regions, i.e., it tries tofind an accurate segmentation of the image into regions withthe property that each connected component of a region
contains exactly one of the initial seeds. The presence ofnoise may result in oversegmentation, which is typicallyhandled with a subsequent region merging process.
Two major concerns must be handled when performinga segmentation based on region growing: where to place theinitial seeds in the image domain and which homogeneitycriterion should be adopted to characterize the image re-gions. As for the seed placement problem, it is expected thatsegmentation of an image composed by N relevant targetobjects should start with N initial seeds, one located at eachobject. As for the region growing, the homogeneity criterionmust capture the properties of the target objects.
For our specific problem, each relevant algae region(either a single cell or a colony) would require a seed rep-resentative. Thus, we devised an approach to automaticallydetermine where to place the seed points, guaranteing thatone single seed will be placed in the interior of each algaeregion. The seed placement relies on a pre-segmentationimage obtained from the filtered RGB image IADF , whichprovides a binary mask useful to determine the seed points.
The homogeneity criterion and the conditional test todrive the region growth must account for the intensity vari-ations of the algae pixels in the Hue channel. We chose tocharacterize the image regions (algae cells and background)by the Gaussian distributions of their intensities, describedby their mean and standard deviation. These parametersare computed by automatically sampling a sub-set of pixelsfrom each region. All the algae regions can be modeled witha single probability distribution, as the pixels associatedwith algae have the lowest intensities (darker regions) inthe Hue channel.
In the following we detail the strategies to handle eachproblem.
4.1 Presegmentation for region sampling and seedplacement
We initially compute a pre-segmentation image, using theeigenvalues of the covariance matrix of the filtered RGB im-age. This is a binary image that provides a mask employedboth to identify the target foreground and background re-gions and to compute where to place the region seeds in theimage domain.
First, we compute the local mean values µL relative toeach point in the image domain x ∈ Ω:
µL(x) =1
|Ω|
∫
Ω
I(x− y)dy. (6)
A(x) = I(x)− µL(x). (7)
Then a local covariance matrix C(x) of the color channelsrelative to each domain point is computed, given by:
C(x) = A(x)TA(x). (8)
Finally, the eigenvalues and eigenvectors of the covariancematrix C(x) are computed:
V −1C(x)V = D, (9)
in which V is the matrix of eigenvectors and D is a di-agonal matrix of the eigenvalues of C(x), given by v =

JOURNAL OF LATEX CLASS FILES, VOL. 13, NO. 9, SEPTEMBER 2014 7
D1,1, ..., Dm,m. The eigenvalues, which are computedfor each pixel, can be represented as m images, each onecapturing the image properties from a different perspective.An inspection of these eigenvalue images substantiated ourchoice of picking the third eigenvalue image (the greenchannel), which was the most effective to capture the algaecharacteristics.
It is possible to obtain a binary mask BM that flags thepixels as associated with either algae or background regionsby thresholding the third eigenvalue image using its meanintensity value. As a result, the algae-related pixels are one-valued in BM , whereas the background pixels are assignedzero values.
Figure 6 illustrates the process of obtaining the binarymask BM departing from the original image depicted inFigure 4(a). Figures 6(a), 6(b) and 6(c) depict the images con-structed from the first, second and third eigenvalues of eachimage domain point. After selecting the third eigenvalueimage and thresholding it by its mean intensity value, thebinary mask shown in Figure 6(d) is obtained.
(a) (b)
(c) (d)
Fig. 6. Illustration of the steps in the computation of the binary mask:(a-b-c) the images representing the computed eigenvalues; (d) the pre-segmentation image obtained after thresholding the third eigenvalueimage by its mean intensity value.
The pre-segmentation image BM is then used in theregion sampling procedure and also to define the seedpoints for each target region.
Region Sampling
The foreground and background regions in the image maybe characterized by their intensity probability model distri-butions. The parameters characterizing the respective distri-butions may be estimated by sampling the foreground andbackground regions—as identified in the presegmentationimage BM—in the enhanced Hue image. The quality of theprobability distribution estimation depends on an effectivesampling procedure.
The sampling procedure is exemplified in Figure 7. Fig-ure 7(a) illustrates the patches used to sample the target re-gions, namely the algae (shown in red) and the background(in green). For performance reasons, it is sufficient to sampleonly 10% of the background pixels. Figure 7(b) presents theestimated Gaussian distributions estimated for algae and
background, given by their mean and standard deviationsas computed from the sampled intensities in their respectiveregions.
(a) (b)
Fig. 7. Illustration of the region sampling procedure: (a) the red patchesdepict the algae region, while the green patch refers to the backgroundregion; (b) the estimated Gaussian distributions of the intensities in thealgae (red line) and in the background (green line) regions.
Setting the seeds
The pre-segmentation image possibly includes multiple al-gae regions, and it is our goal to select a single pixel ineach representative algae region. Artifacts characterized bysmall areas with less than 100 pixels may be found in theseimages, which must be disregarded. The principle is thusto analyse regions with area greater than 100 pixels andcompute their centroids in an eroded version of BM , thusmaking sure that the seed points are placed inside relativeto the target shapes.
Computing the seed points thus requires the followingsteps:
1) Perform a morphological erosion operation on im-age BM using a disk structuring element of size 5,obtaining a new image BEr .
2) Discard all regions in BEr with area sizes smallerthan 100 pixels, obtaining image BGr .
3) Compute the centroid of each of the N remainingregions on BGr .
4) Pick the center point of each region i in BGr as therespective region seed (si,1, si,2).
The above methodology guarantees that one seed isplaced inside each algae region. The size of the structuringelement was manually set by taking into account the imageresolution and the algae area sizes. This process generatesa set of seeds S = (s1,1, s1,2); ...; (sN,1, sN,2) to be placedin the image domain for the region growing process.
(a) (b)
Fig. 8. Determining the seeds: (a) the image BGr ; (b) the seed pointplaced over the algae region (shown in red).
Figure 8 illustrates the strategy for computing the seedpoints. Figure 8(a) shows the image BEr resulting from

JOURNAL OF LATEX CLASS FILES, VOL. 13, NO. 9, SEPTEMBER 2014 8
executing Step 1 in the above sequence. Figure 8(b) showsthe seed point computed (shown in red) placed over theenhanced Hue channel image IEN .
4.2 Homogeneity criterion
The homogeneity criterion defines whether a candidatepixel should be incorporated into a specific region. As such,it must consider the statistically relevant patterns of thedifferent image regions, such as color, texture or intensity.Thus, a criterion must be chosen that captures the intensitypatterns of the algae and the background regions.
In this case, the Gaussian distributions of the pixel in-tensities are effective to characterize the algae and the back-ground regions in the Hue channel. First, the distributionsparameters θ1 = µ1, σ1 and θ2 = µ2, σ2 are estimated,taking as parameters the means µi and the standard de-viations σi computed from the algae and the backgroundregion samples, respectively, in the enhanced Hue imageIEN . Distributions P1 and P2 are thus computed as:
Pi(I(x)|µi, σi) =1
σi
√2π
exp
(
− ||I(x)− µi||22σ2
i
)
(10)
in which ||.|| refers to the Euclidean norm. The distinctiveGaussian distributions of both regions are clearly depictedin the corresponding plots shown in Figure 7(b).
4.3 Region growth process
This process can be interpreted as a pixel labeling procedurein which all pixels belonging to a homogeneous region willbe assigned the same label. The seed pixel is compared withits neighboring pixels, and they are grouped into a singleregion if the homogeneity criterion is satisfied. The regiongrowing finishes once all pixels have been assigned a regionlabel. No merging procedure is required in this particularcase.
Our implementation follows the region growing formu-lation described by Gonzalez et al. [11]. Let S be the setof seed points, in which si ∈ Ω, and let P1 (P2) be theprobability distribution associated with all the algae regions(background). Considering an 8-connectivity neighborhood,each image pixel is tested to verify whether it satisfies thecriterion for inclusion in an algae region:
1) IF P1(IEN (x)|µ1, σ1) < P2(IEN (x)|µ2, σ2)2) THEN x belongs to an algae region;3) ELSE x belongs to the background;
A binary image is obtained, where pixels that satisfythe conditional (domain points likely to belong to an algaeregion) are assigned a value 1, otherwise pixels are assigneda value 0. The next step relies on appending to each seedpoint in S all the 1-valued points in the binary image whichare 8-connected to it, resulting in an image with connectedcomponents corresponding to each algae cell, colony andbackground areas. In this process, a neighbor pixel y isgrouped to the region associated to a seed s when the con-dition |P1(IEN (y)|µ1, σ1)−−P1(IEN (s)|µ1, σ1)| < 0.1is satisfied. Finally, each connected component receives adistinct region label, so that each algae region is uniquely
identified.Figure 9 illustrates the result of applying this procedure
to the enhanced Hue channel image IEN , departing fromthe seed point indicated by the red marker in Figure 8(b).
Fig. 9. Result of the region growing process for a particular image.
4.4 Rolling ball transformation
The algae movement during the image acquisition leads toblurred corners and/or some transparent parts in the algaecells. As a result, in some cases the segmented algae shapesmight present small concavities and holes, as observedin the images depicted in Figure 10(a-b). This problem ishandled by applying a rolling ball transformation to fill inany undesirable holes or concavities in the shapes obtainedwith the region growing process.
(a) (b)
Fig. 10. (a) Original RGB image; (b) binary image resulting from theregion growth process.
The rolling ball transformation [42] can be described asa morphological closing of the target region, followed by ahole filling operation. A hole is a set of background pixelsthat cannot be reached by filling in the background from theedge of the image. In the rolling-ball transformation, a diskstructuring element with a predefined radius is applied tothe binary images.
Determining the size of the disk radius is difficult, sincethe algae shapes differ a lot in size and complexity. Settinga single radius size to handle all shapes would likely resultin some poor quality segmentations.
We compute the radius size automatically for each case,taking into account the perimeter of the algae contours andsome prior knowledge on their shapes. First, small algaedo not require large disks for the rolling ball, because itis important to preserve their characteristic concavities, asshown in Figure 12(a). On the other hand, for algae coloniesit is better to adopt medium-sized radii sizes, since thejunctions between cells must be preserved. Finally, largerradius can be used on ellongated algae shapes, which oftenpresent blurred corners and the rolling ball operation will

JOURNAL OF LATEX CLASS FILES, VOL. 13, NO. 9, SEPTEMBER 2014 9
not affect the shape essence, in this case.Shape complexity is determined by identifying the num-
ber of peaks in its corresponding Curvature Scale Space (CSS)map [43]. The CSS descriptor captures the key local shapefeatures by representing the shape boundary curvatures ina scale space which describes the locations of convex (orconcave) segments and also detects the degree of convexity(or concavity) of such segments. The scale space represen-tation of a shape is created by tracking the position ofinflection points in a shape boundary filtered by low-passGaussian filters of variable widths. As the width of theGaussian filter increases, negligible inflections are removedfrom the boundary and the shape becomes smoother. Theremaining inflection points in the representation are likelyto describe relevant object characteristics. The result ofthis multi-scale smoothing process is a map depicting aninterval tree formed by several inflection points. The shapecontours have been subsampled to 200 points. Figures 11(a)and 11(b) show the CSS maps of the algae shapes depictedin Figures 9 and 10(b), respectively, in which the red pointsare the maxima. The x−axis presents the arc length of thealgae contour after subsampling to 200 points. The y−axisrefers to the width of the Gaussian low-pass filtering in thecontour. It is noticeable that maps of colonies have morepoints of maximum than maps of single algaes.
(a) (b)
Fig. 11. Curvature Scale Space maps: (a) map of the algae colony shapedepicted in Figure 9; (b) map of the single algae shape depicted inFigure 10(b).
The number of peaks is identified by thresholding theCSS map at the Gaussian width 10, indicated in Figure 11 bythe dashed red lines. Defining NCSS as the number of peaksand p the shape perimeter, the disk radius is computed as:
1) IF p < 2002) THEN radius← 2;3) ELSE IF NCSS > 24) THEN radius← 4;5) ELSE radius← 6;
Figure 12 shows the result of applying the rolling balloperator to the binary image produced by the region grow-ing algorithm. This postprocessing filled the holes and con-cavities in Figure 10, resulting in a smoother contour of thecorresponding algae shape.
We can finally summarize the steps of the proposedsegmentation framework based on region growing:
1) Filter the original RGB image using the annisotropicdiffusion filter, resulting in image IADF ;
(a) (b)
Fig. 12. Rolling ball operation: (a) binary image after the region growth;(b) binary image representing the final segmentation, after applying therolling ball operator.
2) Transform the RGB image IADF into its HSV repre-sentation, obtaining three channels: Hue, Saturationand Value;
3) Enhance the contrast of the Hue channel, producingan enhanced Hue image IEN ;
4) Compute the eigenvalue and eigenvectors of IADF
and compose the binary mask image BM ;5) Use the binary mask BM to place the seeds S =s1, ..., sN in IEN ;
6) Sample pixel intensities from both the algae andbackground regions in IEN using the binary maskBM ;
7) Estimate the Gaussian probability distributions pa-rameters θ1 = µ1, σ1 and θ2 = µ2, σ2 given thealgae and the background region samples, respec-tively.
8) Compute the Gaussian distributions P1 and P2 ofthose regions, according to Eq. (10).
9) Perform region growing to obtain the set of algaeregions ΩA = Ω1, ...,ΩN, the background is givenby Ω\ΩA;
10) Perform the rolling ball morphological operation tofill in holes in the algae contours.
In Section 5 we present results obtained from applyingthe above method and others from the literature on a partic-ular set of green algae images.
5 EXPERIMENTAL RESULTS
We evaluated the performance and the effectiveness ofthe proposed method on a set of 40 green algae imagesdepicting different species of the Selenastraceae algae familycomplex.
The accuracy of the segmentation results obtained withour strategy and with methods from the literature arecompared with the manual segmentations of the imagesprovided by the expert biologist, refered to as ground-truth(GT) images. The accuracy measure (Acc) is defined as:
Acc =TP + TN
TP + TN + FP + FN, (11)
in which TP (true positive) refers to the pixels labeled asbelonging to algae regions in both segmentation and GT im-ages; FP (false positive) are the pixels labeled as belongingto algae regions in the segmentation, but as non-algae pixelsin GT; TN (true negative) are the pixels labeled as non-algae in both segmentation and in the corresponding GT

JOURNAL OF LATEX CLASS FILES, VOL. 13, NO. 9, SEPTEMBER 2014 10
image; and FN (false negative) refers to the pixels labeledas non-algae in the segmentation, but actually labeled asalgae pixels in the corresponding GT image. We measure theaverage accuracy for an image set by averaging the accuracyvalues computed for each image.
First, the proposed segmentation strategy is comparedwith three alternative approaches: two of them are tech-niques commonly employed for segmenting biologicalimages, namely the thresholding-based binarization withOtsu’s automatic method for computing the thresholdvalue, and the Watershed transform. The third technique isa specialized level set implementation targeted at the sameproblem of segmenting green algae images [20] .
To ensure a fair comparison, the input images to the foursegmentation approaches are the smoothed original images,resulting from applying the ADF filter with the same param-eter setting and the rolling ball transformation is applied inall cases to the initial segmentation results. The segmenta-tions obtained with the Watershed transform required someadditional postprocessing, as the method outputs multiplesubareas. The relevant algae region is selected from the set ofsubareas by determining the seed points with the approachdescribed in Section 4.1 and identifying the subareas thatinclude the seed points.
Table 1 presents the computed mean accuracy ratesand the standard deviations (std) for our method and thethree other techniques on the test image set. The RegionGrowing framework introduced in this paper yielded higheraccuracy rates. This is mainly due to the appropriate designof the preprocessing and postsegmentation steps, as well asthe use of Gaussian distributions to characterize the targetregions. The standard deviation (std) rates also suggest thatit is more consistent, obtaining satisfactory segmentations inmost test cases. We also observed that the segmented algaeshapes are highly similar to the ground truth images.
TABLE 1Average accuracy rates and standard deviation (std)
Segmentation techniques accuracy std1. Region Growing framework 0.988 0.0012
2. Specialized level set [20] 0.962 0.009
3. Binarization using Otsu’s threshold 0.89 0.05
4. Watershed transform 0.932 0.08
In the following analysis we detail the method’s perfor-mance for some complex segmentation cases. We show theinitial RGB image, the segmented image and also the im-ages output by the preprocessing and the postsegmentationsteps, due to their relevance to the processs. In each case,the difficulties faced when segmenting such images are alsodiscussed and visually illustrated.
Figure 13 depicts a very small single algae. A signi-ficative intensity variation is observed, for example, whencomparing its corners. Figure 13(a) shows the original RGBimage and Figure 13(b) shows the Hue channel, where thelow contrast among the algae and the background is clear.Figure 13(c) shows the enhanced Hue channel with im-proved contrast between algae and background pixels dueto the contrast enhancement procedure, clearly indicatingthat the preprocessing is indeed effective to improve imagequality for further processing. Figure 13(d) illustrates the
binary image produced by the region growing algorithmand 13(e) shows the final segmentation after applying therolling ball transformation. Finally, Figure 13(f) presents theground-truth image. It is noticeable that the segmentationobtained is quite close to the manual segmentation, with anaccuracy rate of 0.998.
(a) (b)
(c) (d)
(e) (f)
Fig. 13. Segmentation of a small round-shaped algae with 0.998 ac-curacy: (a) original RGB image; (b) Hue channel; (c) enhanced Huechannel after contrast enhancement; (d) output of the region growingalgorithm; (e) result after applying the rolling ball transform; (f) ground-truth image.
The image in Figure 14 shows an algae colony, whichposes a particular challenging segmentation case. Becausethe organisms are typically moving when the digital imageis captured, the color intensity of algae cells vary consid-erably. The original image is shown in Figure 14(a); noticehow the areas where the different cells meet are nearly trans-parent. Figure 14(b) shows the hue channel, which clearlycan benefit from the smoothing and contrast enhancementsteps. The preprocessing produces the new Hue channelshown in Figure 14(c). The image resulting from the regiongrowing algorithm is presented in Figure 14(d), and Figure14(e) shows the final segmentation, in which several holeswere succesfully filled by the rolling ball operator. Figure14(f) depicts the associated ground-truth. The “star” shapeof the colony was very well preserved in the segmentation,which attained an accuracy rate of 0.957.
Another segmentation case concerns an ellongated algaecell which shows mucilage in the bottom corner. Handlingthe mucilage correctly is difficult. Ideally, it should remainconnected to the algae cells, as it is characteristic of this kindof algae. However, conventional segmentation approacheswill very likely separate the structures. Figure 15 (a) depictsthe original RGB image with a single algae. Figure 15(b)shows the Hue channel, which is pretty noisy in this case.The smoothing and the enhancement processes produce an

JOURNAL OF LATEX CLASS FILES, VOL. 13, NO. 9, SEPTEMBER 2014 11
(a) (b)
(c) (d)
(e) (f)
Fig. 14. Segmentation of an algae colony with 0.957 accuracy: (a)original RGB image; (b) Hue channel; (c) enhanced Hue channel aftercontrast enhancement; (d) output of the region growing algorithm; (e)result after applying the rolling ball operator; (f) ground-truth image.
image with homogeneous regions and improved contrastbetween algae and background, shown in Figure 15(c). Thefinal segmentation is presented in Figure 15(d), and theground-truth is shown in Figure 15(e). Again, the algaecell shape including its particular mucilage was very wellpreserved, with a segmentation accuracy rate of 0.99. Figure15(f) presents the result of our previous level set approach,which shows the algae organism without its distinguishingmucilage structure.
We now analyze a particular case of the segmentationresults obtained with the method proposed in this paper incomparison with those obtained with the Otsu’s threshholdbinarization, the Watershed transform and our own pre-vious attempt using a specialized level set approach [20].The original image, depicting a single algae, is illustratedin Figure 16(a), whereas Figure 16(b) shows the manualsegmentation generated by the biologist. Figure 16(c) repli-cates the segmentation result obtained with our method.Figures 16(d), 16(e) and 16(f) illustrate the results obtained,respectively, with the binarization approach, the adapted theWatershed transform and the specialized level set approach.
The segmentation obtained with the proposed regiongrowing strategy is clearly most similar to the ground-truth,with a segmentation accuracy of 0.984. The segmentationobtained with the thresholding-based method deformed theoriginal algae shape and its accuracy rate is 0.934. TheWatershed based method achieved 0.966 accuracy in thiscase, but although the shape properties are well preservedthe binary region presents a rough contour. The special-ized level set also resulted a highly accurate segmentation(0.9601), but still inferior to the region growing, besides
(a) (b)
(c) (d)
(e) (f)
Fig. 15. Segmentation of an ellongated algae cell with 0.99 accuracy:(a) original RGB image; (b) Hue channel; (c) enhanced Hue channel;(d) segmentation after the rolling ball operator; (e) ground-truth image;(f) obtained resulting using the previous method [20].
being an extremely time consuming procedure.
(a) (b)
(c) (d)
(e) (f)
Fig. 16. Comparing results from different segmentation techniques:(a) original RGB image; (b) ground-truth image; (c) segmentation ob-tained with the proposed region growing method; (d) segmentationobtained with thresholding; (e) segmentation obtained with the Water-shed method; (f) segmentation obtained with a specialized level setapproach [20].

JOURNAL OF LATEX CLASS FILES, VOL. 13, NO. 9, SEPTEMBER 2014 12
As reported elsewhere [20], the Gaussian distributionsestimated using the HSV color space images can statisticallycharacterize the target image regions effectively. The figuresdepicting the Hue channel images reveal target regionswith a wide variety of patterns, which are well capturedby the respective Gaussian distribution models. The pre-segmentation image provides the input to the region sam-pling procedure, ensuring a correct sampling of the rep-resentative intensities of each target region. The proposedsolution also benefits from the pre-segmentation image bothto determine a single seed point for each region and toensure that they are correctly placed in the interior of thealgae regions.
Beyond its higher segmentation accuracy rates, the newmethod can naturally handle noise and artifacts, and alsotreat the variability observed in the hue channel and the pre-segmentation images. Small noisy signals are disregardedwhen computing the seed points, so that only the relevantalgae regions are kept in the final segmentation. This is amajor advantage over our previous results obtained on thisimage collection with a modified level set approach [20],which departs from the assumption that any boundaryinformation potentially describes an algae region. Further-more, the current method is computationally more efficientthan the level set approach, which depends on the conver-gence of the dynamic contour.
A limitation that remains to be further investigated con-cerns the detection of transparent algae cells, since neitherthe pre-segmentation image nor the enhancement processcould correctly identify the algae shapes in these cases,hampering the subsequent steps of intensity sampling andseed point placement. In this situation, the intensities ofthe algae regions and the background are very similar.Thus, edge-based methods are likely to perform better, sincethey can still detect the algae boundaries in these adverseconditions.
6 CONCLUSION
In this paper we presented a methodology for segmentinggreen microalgae images based on the region growing prin-ciple and incorporating specific smoothing and contrast en-hancement steps. The image regions, i.e., the algae cells andthe background, are described by Gaussian distributionscomputed prior to the region growing, estimated by meansof region intensity samples. The key idea for generating thisrepresentation is to capture the intensity variation observedin the algae cells for an accurate segmentation.
The proposed method performs segmentation in the Huechannel, which better captures the contrast between algaeand background regions. In the region growing algorithm,each seed point is associated with a specific region andthe growth process groups neighboring pixels that satisfy apredefined homogeneity criterion characterizing the imageregions. We also developed a strategy for computing abinary image from the original RGB, useful to automaticallydetermine the seed points and to obtain patches for theregion sampling procedure.
Experimental results have shown that the proposedmethod achieves high segmentation accuracy when com-pared with ground-truth segmentations provided by the
biologists. Moreover, it also yielded better accuracy ratesthan some segmentation methods from the literature, suchas segmentation with the Watershed transform, binarizationusing Otsu’s technique, and a specialized level set methoddevised for green algae images.
Our method may be applicable to other biological imageprocessing problems with similar characteristics. From theperspective of image segmentation, exploring alternativeapproaches to characterize and describe image regions andderiving a similarity criterion that drives the growth processmight also be a good direction for further research. Nonethe-less, our next goal is to extract morphological features ofthe green algae using the segmented shape properties, inorder to provide computational support for the taxonomicalclassification of these particularly challenging algae species.
ACKNOWLEDGMENT
The authors acknowledge the support of the State ofSao Paulo Research Funding Agency (FAPESP), procs.2011/22749-8, 2012/00269-7, 2013/26647-0 and the BrazilianFederal Funding Agency (CNPq), proc. 305696/2013-0.
REFERENCES
[1] P. McCormick and J. Cairns, “Algae as indicators of environmentalchange,” Journal of Applied Phycology, vol. 6, no. 5, pp. 509–526,1994.
[2] A. Demirbas, “Use of algae as biofuel sources,” Energy conversionand management, vol. 51, no. 12, pp. 2738–2749, 2010.
[3] E. W. Becker, “Micro-algae as a source of protein,” Biotechnologyadvances, vol. 25, no. 2, pp. 207–210, 2007.
[4] K. Skjanes, C. Rebours, and P. Lindblad, “Potential for greenmicroalgae to produce hydrogen, pharmaceuticals and other highvalue products in a combined process,” Critical reviews in biotech-nology, vol. 33, no. 2, pp. 172–215, 2013.
[5] M. Shiho, M. Kawachi, K. Horioka, Y. Nishita, K. Ohashi, K. Kaya,and M. M. Watanabe, “Business evaluation of a green microalgaebotryococcus braunii oil production system,” Procedia Environmen-tal Sciences, vol. 15, pp. 90–109, 2012.
[6] M. Soheili and K. Khosravi-Darani, “The potential health benefitsof algae and micro algae in medicine: a review on spirulinaplatensis,” Current Nutrition & Food Science, vol. 7, no. 4, pp. 279–285, 2011.
[7] L. Krienitz, I. Ustinova, T. Friedl, and V. A. R. Huss, “Traditionalgeneric concepts versus 18s rrna gene phylogeny in the greenalgal family selenastraceae (chlorophyceae, chlorophyta),” Journalof Phycology, vol. 37, no. 5, pp. 852–865, 2001.
[8] K. Embleton, C. Gibson, and S. Heaney, “Automated countingof phytoplankton by pattern recognition: a comparison with amanual counting method,” Journal of Plankton Research, vol. 25,no. 6, pp. 669–681, 2003.
[9] S. Brasch, L. Linsen, and G. Fuellen, “Vanlo-interactive visualexploration of aligned biological networks,” BMC Bioinformatics,vol. 10, no. 1, p. 327, 2009.
[10] S. C. Zhu and A. L. Yuille, “Region competition: unifying snakes,region growing, energy/bayes/mdl for multi-band image seg-mentation,” IEEE Transactions on Pattern Analysis and MachineIntelligence, vol. 18, pp. 884–900, 1996.
[11] R. C. Gonzalez, Digital image processing. Pearson Education India,2009.
[12] H. M. Sosik and R. J. Olson, “Automated taxonomic classificationof phytoplankton sampled with imaging-in-flow cytometry,” Lim-nology and Oceanography: Methods, vol. 5, no. 6, pp. 204–216, 2007.
[13] I. Dimitrovski, D. Kocev, S. Loskovska, and S. Dzeroski, “Hierar-chical classification of diatom images using ensembles of predic-tive clustering trees,” Ecological Informatics, vol. 7, no. 1, pp. 19–29,2012.
[14] H. Zheng, H. Zhao, X. Sun, H. Gao, and G. Ji, “Automatic setaesegmentation from chaetoceros microscopic images,” Microscopyresearch and technique, vol. 77, no. 9, pp. 684–690, 2014.

JOURNAL OF LATEX CLASS FILES, VOL. 13, NO. 9, SEPTEMBER 2014 13
[15] S. Gupta and S. G. Mazumdar, “Sobel edge detection algorithm,”International journal of computer science and management Research,vol. 2, no. 2, pp. 1578–1583, 2013.
[16] J. Canny, “A computational approach to edge detection,” IEEETransactions on Pattern Analysis and Machine Intelligence, no. 6, pp.679–698, 1986.
[17] M. Kass, A. Witkin, and D. Terzopoulos, “Snakes: Active contourmodels,” International Journal of Computer Vision, vol. 1, no. 4, pp.321–331, 1988.
[18] S. Osher and J. A. Sethian, “Fronts propagating with curvature-dependent speed: algorithms based on hamilton-jacobi formula-tions,” Journal of Computational Physics, vol. 79, no. 1, pp. 12–49,1988.
[19] R. Malladi, J. A. Sethian, and B. C. Vemuri, “Shape modelingwith front propagation: A level set approach,” IEEE Transactionson Pattern Analysis and Machine Intelligence, vol. 17, no. 2, pp. 158–175, 1995.
[20] V. R. P. Borges, B. Hamann, T. G. Silva, A. A. Vieira, and M. C. F.Oliveira, “A highly accurate level set approach for segmentinggreen microalgae images,” 28th Conference on Graphics, Patterns andImages (SIBGRAPI), pp. 87–94, 2015.
[21] M. Emmett and M. Minion, “Toward an efficient parallel in timemethod for partial differential equations,” Communications in Ap-plied Mathematics and Computational Science, vol. 7, no. 1, pp. 105–132, 2012.
[22] R. Adams and L. Bischof, “Seeded region growing,” IEEE Transac-tions on Pattern Analysis and Machine Intelligence, vol. 16, no. 6, pp.641–647, 1994.
[23] J. Fan, G. Zeng, M. Body, and M.-S. Hacid, “Seeded regiongrowing: an extensive and comparative study,” Pattern RecognitionLetters, vol. 26, no. 8, pp. 1139 – 1156, 2005.
[24] S. Lou, X. Jiang, and P. J. Scott, “Applications of morphologicaloperations in surface metrology and dimensional metrology,”Journal of Physics: Conference Series, vol. 483, no. 1, p. 012020, 2014.
[25] K. Haris, S. N. Efstratiadis, N. Maglaveras, and A. K. Katsaggelos,“Hybrid image segmentation using watersheds and fast regionmerging,” IEEE Transactions on Image Processing, vol. 7, no. 12, pp.1684–1699, 1998.
[26] L. J. Belaid and W. Mourou, “Image segmentation: a watershedtransformation algorithm,” Image Analysis & Stereology, vol. 28,no. 2, pp. 93–102, 2011.
[27] A. C. Jalba, M. H. F. Wilkinson, and B. T. M. Roerdink, “Automaticsegmentation of diatom images for classification,” Microscopy Re-search and Technique, vol. 65, no. 1, pp. 72–85, 2004.
[28] M. A. Mosleh, H. Manssor, S. Malek, P. Milow, and A. Salleh, “Apreliminary study on automated freshwater algae recognition andclassification system,” BMC Bioinformatics, vol. 13, no. Suppl 17, p.S25, 2012.
[29] S. Promdaen, P. Wattuya, and N. Sanevas, “Automated microalgaeimage classification,” Proc Computer Science, vol. 29, pp. 1981–1992,2014.
[30] S. Osher and R. P. Fedkiw, “Level set methods: an overview andsome recent results,” Journal of Computational Physics, vol. 169,no. 2, pp. 463–502, 2001.
[31] S. H. Shirazi, A. I. Umar, N. U. Haq, S. Naz, and M. I. Razzak,“Accurate microscopic red blood cell image enhancement andsegmentation,” Bioinformatics and Biomedical Engineering, pp. 183–192, 2015.
[32] T. Berber, A. Alpkocak, P. Balci, and O. Dicle, “Breast mass con-tour segmentation algorithm in digital mammograms,” Computermethods and programs in biomedicine, vol. 110, no. 2, pp. 150–159,2013.
[33] Y. Q. Zhao, X. H. Wang, X. F. Wang, and F. Y. Shih, “Retinal vesselssegmentation based on level set and region growing,” PatternRecognition, vol. 47, no. 7, pp. 2437–2446, 2014.
[34] X. Zhang, P. Xiao, X. Feng, J. Wang, and Z. Wang, “Hybrid regionmerging method for segmentation of high-resolution remote sens-ing images,” ISPRS Journal of Photogrammetry and Remote Sensing,vol. 98, pp. 19–28, 2014.
[35] S. Cuiping, Y. Chenhui, L. Huizhen, and K. Lin, “A system foridentification of marine phytoplankton,” 2nd International Confer-ence on Signal Processing Systems, vol. 3, pp. 423–426, 2010.
[36] C. S. Tan, P. Y. Lau, S.-M. Phang, and T. J. Low, “A frameworkfor the automatic identification of algae (neomeris vanbosseae mahowe): U 3 s,” International Conference on Computer and InformationSciences (ICCOINS), pp. 1–6, 2014.
[37] K. Schulze, U. M. Tillich, T. Dandekar, and M. Frohme,“Planktovision–an automated analysis system for the identifica-tion of phytoplankton,” BMC Bioinformatics, vol. 14, no. 1, p. 115,2013.
[38] N. Otsu, “A threshold selection method from gray-level his-tograms,” Automatica, vol. 11, no. 285-296, pp. 23–27, 1975.
[39] C. A. Z. Barcelos and V. Pires, “An automatic based nonlineardiffusion equations scheme for skin lesion segmentation,” AppliedMathematics and Computation, vol. 215, no. 1, pp. 251–261, 2009.
[40] G. Aubert and P. Kornprobst, “Mathematical problems in imageprocessing: partial differential equations and the calculus of vari-ations,” Springer Science & Business Media, vol. 147, 2006.
[41] W. F. Ames, Numerical methods for partial differential equations.Academic Press, 2014.
[42] S. R. Sternberg, “Grayscale morphology,” Computer Vision, Graph-ics, and Image Processing, vol. 35, no. 3, pp. 333 – 355, 1986, specialSection on Mathematical Morphology.
[43] F. Mokhtarian and R. Suomela, “Robust image corner detectionthrough curvature scale space,” IEEE Transactions on Pattern Anal-ysis and Machine Intelligence, vol. 20, no. 12, pp. 1376–1381, 1998.
Vinicius Ruela Pereira Borges received theB.Sc. in computer science and M.Sc. in com-puter science from the Federal University ofUberlandia, Minas Gerais, Brazil, in 2008 and2011, respectively. He is currently a Ph.D. can-didate at the University of Sao Paulo and hasrecently been a visiting scholar researcher atthe University of California, Davis, United Statedof America. His main research interests are inimage processing, pattern recognition and visualanalytics.
Maria Cristina Ferreira de Oliveira is cur-rently a Full Professor at the Computer Sci-ence Department of the Instituto de CienciasMatematicas e de Computacao (ICMC), at theUniversity of Sao Paulo, Brazil, where sheteaches courses on Data Structures, ComputerGraphics and Visualization. She received aB.Sc. in computer science from the University ofSao Paulo, Brazil, in 1985, and a Ph.D. degreein electronic engineering from the University ofWales, Bangor, in 1990. Her current research
interests are in data and information visualization, pattern recognition,visual analytics and visual data mining. She is a member of the ACM,IEEE and of the Brazilian Computer Society.
Thaıs Garcia Silva received bachelor degree inBiology from Sao Paulo State University, Braziland Ph.D. degree in Sciences, focused on Ecol-ogy and Natural Resources from Federal Uni-versity of Sao Carlos, in 2009 and 2016, re-spectively. Her research interests include taxon-omy, systematics and phylogeny of freshwaterphytoplankton and diversity and biogeography ofgreen algae.
JOURNAL OF LATEX CLASS FILES, VOL. 13, NO. 9, SEPTEMBER 2014 14
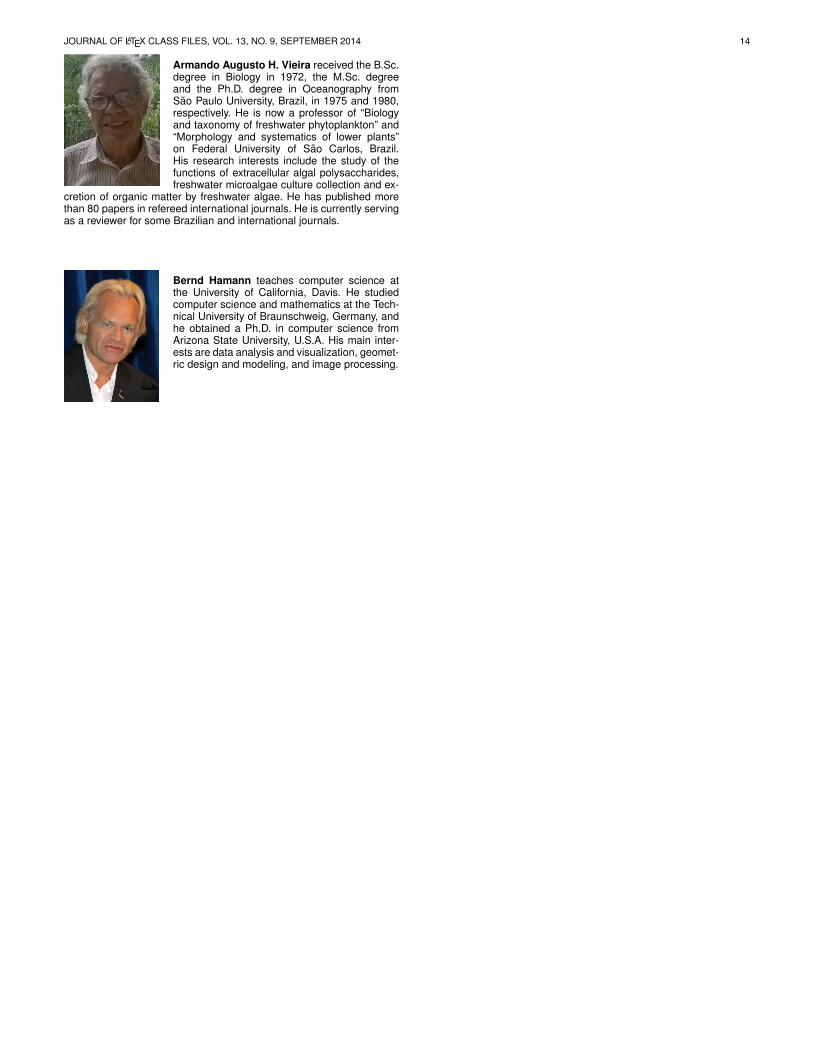
Armando Augusto H. Vieira received the B.Sc.degree in Biology in 1972, the M.Sc. degreeand the Ph.D. degree in Oceanography fromSao Paulo University, Brazil, in 1975 and 1980,respectively. He is now a professor of “Biologyand taxonomy of freshwater phytoplankton” and“Morphology and systematics of lower plants”on Federal University of Sao Carlos, Brazil.His research interests include the study of thefunctions of extracellular algal polysaccharides,freshwater microalgae culture collection and ex-
cretion of organic matter by freshwater algae. He has published morethan 80 papers in refereed international journals. He is currently servingas a reviewer for some Brazilian and international journals.
Bernd Hamann teaches computer science atthe University of California, Davis. He studiedcomputer science and mathematics at the Tech-nical University of Braunschweig, Germany, andhe obtained a Ph.D. in computer science fromArizona State University, U.S.A. His main inter-ests are data analysis and visualization, geomet-ric design and modeling, and image processing.