Journal of Information Technology and its Utilization
33
Transcript of Journal of Information Technology and its Utilization


Journal of Information Technology and its Utilization
Volume 2, Issue 1, 2019
Journal of Information Technology and Its Utilization is a journal published by the BBPSDMP Kominfo Makassar with the aim of disseminating
information on scientific developments in information technology area and its utilization. The manuscript published in this journal is derived
from research, scientific study conducted by researchers, academics and information technology expert. Publish with frequency of 2 times a year,
namely in August and December.
PERSON IN CHARGE Chief of Balai Besar Pengembangan SDM dan Penelitian Komunikasi dan Informatika Makassar
EDITORIAL BOARD
Editor in Chief : Bahrawi (BBPSDMP Kominfo Makassar) Section Editor : Mukhlis Amin, ST, MT (BBPSDMP Kominfo Makassar) Herman, S.Kom, MT (BBPSDMP Kominfo Makassar)
Nur Alam, S.Kom (BBPSDMP Kominfo Makassar)
Copy Editor : Darman Fauzan Dhahir (Komunikasi Terapan, BBPSDMP Kominfo Makasar) Layout Editor : Rudy Hermayadi, ST, MT (BBPSDMP Kominfo Makassar) Proofreader : Tasmil, S.Kom, MT (Teknik Sistem Informasi, BBPSDMP Kominfo Makassar)
MANAGING EDITOR
Chief Manager : Achmad Radil, SE, M.Adm.SDA Staff : Drs. Darsa Jaya Hedar, MAP
Dr. Faisal Risani, SE, M.Adm.SDA
REVIEWER
Dr. Ir. Zulfajri Basri Hasanuddin, M.Eng (Teknologi Informasi dan Komunikasi, Unhas) Irfan Syamsuddin, ST, M.Com. ISM, Ph.D (Teknologi Informasi dan Komunikasi, PNUP) Dr. Ahmad Nizar Hidayanto, M.Kom (Teknologi Informasi dan Komunikasi, UI) Dr. Ir. Rhiza, S. Sadjad, MSEE (Teknik Elektro, Unhas) Dr. Zulkifli Tahir, ST, M.Sc (Teknik Informatika, Unhas)
Alamat Redaksi: Balai Besar Pengembangan SDM dan Penelitian Komunikasi dan Informatika Makassar
Jl. Prof. Abdurahman Basalamah II No 25 Makassar, 90234, Telp. 0411-4660370 Fax. 0411-4660084
http://jurnal.kominfo.go.id/index.php/jitu

Journal of Information Technology and it’s Utilization Volume 2 Issued. 1, 2019
TABLE OF CONTENTS
Design Web-Based Electrical Control System Using Raspberry Pi
Dolly Indra, Tasmil, Herman, St. Hajrah Mansyur, Erick Irawadi Alwi . ..................................... 1 - 3
Analysis And Design Of Distributed System For Monitoring Computer Infrastructure
Management Based On Client/Server By Using Windows Management Instrumentation
Technology
Musawarman, Muhammad Nugraha .................................................................................................. 4 - 11
Assessment of Essay Quiz System in The LMS Vidyanusa Platform Using the Nazief and
Adriani Stemming Algorithms “Comparison of Teacher, Expert Rubric, and System
Assessments”
Ratih Kusuma Dewi, Mervin Tangguar Hutabarat ........................................................................... 12 - 17
Benchmarking Mysql And Nosql Database On Egovbench Application
Nur Aini Rakhmawati, Muhammad Zuhri, Radityo Prasetianto Wibowo, Anwar Romadhon,
Herdy Ardiansyah, Olive Khoirul ....................................................................................................... 18 - 23
Scheduling Using Genetic Algorithm And Roulette Wheel Selection Method Considering
Lecturer Time
Herman, Lukman Syafie, Irawati, Lilis Nur hayati, Harlinda ........................................................ 24 - 28

Journal of Information Technology and it’s Utilization Volume 2 Issued. 1, 2019
PREFACE
Bismillahirrahmanirrahim,
Assalamualaikum wa Rahmatullah wa Barakatuh.
First of all, we wants to express his thanks to Allah SWT, because of His bless and grace,
electronic scientific journal “Journal of Information Technology and Its Utilization (JITU)” can be
finished and published in this year. JITU is semester international referred journal with the objectives
to explore scientific developments in information technology area and its utilization. Published by
BBPSDMP Kominfo Makassar, one of Balitbang SDM Kominfo-Ministry of communication and
information units. This June is the first edition of JITU, with interesting topic papers like
Design Web-Based Electrical Control, Monitoring Computer Infrastructure Management Based
On Client/Server, Assessment of Essay Quiz System in The LMS Vidyanusa Platform Using the Nazief
and Adriani Stemming Algorithms, Benchmarking Mysql And Nosql Database On Egovbench
Application, Scheduling Using Genetic Algorithm And Roulette Wheel Selection Method Considering
Lecturer Time.
Finally, we expects this edition can be a medium for the reader to develop and deepen the
knowledge about information technology and its utilization. look forward to our next edition in
December 2019
June 2019
Editorial Team
Journal of Information Technology and its Utilization Volume 2 Issued. 1, 2019
Keywords is extracted from paper. Abstract sheet may reproduced without permission and charge.
1DDC 005.12
Dolly Indra, Tasmil, Herman, St. Hajrah Mansyur, Erick
Irawadi Alwi
Computer Science Dept. Universitas Muslim Indonesia,
BBPSDMP KOMINFO Makassar
DESIGN WEB-BASED ELECTRICAL CONTROL
SYSTEM USING RASPBERRY PI
Journal of JITU Vol. 2 Issued, June 2019
page 1-3
Abstract - The use of current website technology can be
applied as a control and monitoring system, which is used
to control electrical devices, so that the user can only
control the PC or smartphone that has been connected to
Wi-Fi or the Internet. In this case the control uses the
Raspberry Pi Mini PC which has several advantages such
as low power and is relatively easy when connected with a
web server compared to a microcontroller. By utilizing the
Raspberry Pi Mini PC as a web server, it can replace PC
functions in general. The results in this study are the
Electric Control System that has been made capable of
controlling 4 AC voltage electronics as well as 4 relays
with each relay capable of bearing a maximum load of
2200 watts using a power supply on the Raspberry Pi which
has a minimum of 0.7 amperes and Control of electrical
load can be done within a distance of 0 meters - 15 meters
from the wireless router
Keywords: Web-design; Electrical control; Raspberry pi
2DDC 005.12
Musawarman, Muhammad Nugraha
Politeknik Enjinering Indorama, Indonesia
ANALYSIS AND DESIGN OF DISTRIBUTED SYSTEM
FOR MONITORING COMPUTER INFRASTRUCTURE
MANAGEMENT BASED ON CLIENT/SERVER BY
USING WINDOWS MANAGEMENT
INSTRUMENTATION TECHNOLOGY
Journal of JITU Vol. 2 Issued, June 2019
page 4-11
Abstract - This research aims to analyze and develop a
system for monitoring computer infrastructure management
in real time (real-time monitoring). The developed system
was a distributed system that would help IT Administrators
work at the Center for Computing and Information
Technology Faculty of Engineering Universitas Indonesia
(CCIT FTUI) to monitor the computer infrastructure in
real-time. The Real-time referred to a system that was able
to do direct monitoring to computer infrastructure, and
quickly able to transmit the data status of the device.
Limitations of the current monitoring process were that the
IT Administrator checks directly into the computer lab
room if there were problems related to a computer or cable
that was not connected from the computer system based on
a report from teachers or students. The developed
monitoring system was a client/server based system that
used network infrastructure so that the computer
infrastructure could be optimally monitored. The modules
used in this research are computer input and output
modules, and installed applications or system services. This
research is expected to be able to overcome the problems
associated with computer infrastructure’s performance,
conduct supervision and centralized control in helping the
problems that often occur during the learning process or
examination.
Keywords: Monitoring; Computer Infrastructure
Management; Distributed System; Computer Network;
Real-time
3DDC 006.3
Ratih Kusuma Dewi, Mervin Tangguar Hutabarat
Bandung Institute of Technology
ASSESSMENT OF ESSAY QUIZ SYSTEM IN THE
LMS VIDYANUSA PLATFORM USING THE NAZIEF
AND ADRIANI STEMMING ALGORITHMS
“COMPARISON OF TEACHER, EXPERT RUBRIC,
AND SYSTEM ASSESSMENTS”
Journal of JITU Vol. 2 Issued, June 2019
page 12-17
Abstract – This study focuses on the assessment system of
the essay quiz answers on the LMS VidyaNusa platform
using Nazief and Adriani algorithms. The stemming
algorithm is a word cutting process that makes use of basic
words using certain rules. This method uses LSA (Latent
Semantic Analysis) which determines the similarity values
of two documents, to find interaction between sentences
using SVD (Singular Value Decomposition) algebraic
calculation of each statement then to get the similarity
value from each statement using cosine similarity
algorithm. This system is followed to assist the teacher in
evaluating answers to student essay quizzes because this
system is equipped with value weighting so that it reduces
subjective assessors and increases accuracy in assessment.
The results of this study from 15 students by answering 10
questions and 1 teacher obtained results, that the

assessment given by the teacher without the vulnerable
rubric was 8-10, the value given by the vulnerable system
was 0-10, and the assessment of the system with the
vulnerable rubric was equal 0 -10. So when viewed from
the function of the rubric on the objectivity of the
assessment, the value given by the teacher without rubrics
is less objective. Correlation or relationship between expert
assessment system using rubric with the results of r =
0.82166624 So that both variables have a close relationship
and the form of the relationship is linearly positive.
Keywords: LMS; Essay Quiz; Nazief dan Adriani
Algorithms; LSA; VidyaNusa; Rubric
4DDC 005.74
Nur Aini Rakhmawati, Muhammad Zuhri, Radityo
Prasetianto Wibowo, Anwar Romadhon, Herdy
Ardiansyah, Olive Khoirul
Institut Teknologi Sepuluh Nopember
BENCHMARKING MYSQL AND NOSQL DATABASE
ON EGOVBENCH APPLICATION
Journal of JITU Vol. 2 Issued, June 2019
page 19-24
Abstract - Egovbench application monitors websites or
social media of Indonesia local governments daily. The
process of crawling done by Egovbench produces extensive
data, which reduced performance in the data processing.
Therefore, there is a need for a database solution that has
the best performance such as high processing speed and
small database size. This study examined the comparison
between relational databases and non-relational databases
based on selected metrics to obtain the most suitable
database solution for Egovbench. The results show that the
MySQL database has the advantage of complex query
processing and the use of the database with the smallest
storage space. MongoDB database has the advantage of
low data transfer volumes. Couchbase database has the
advantage of short and straightforward query processing
with a high number. The evaluation results show that
MySQL is more suitable for Egovbench needs, which is the
best response time and query per second. MySQL
outperformed the other two databases on backup and
storage file sizes testing.
Keywords: benchmark, database, crawling, E-
government
5DDC 006.73
Herman, Lukman Syafie, Irawati, Lilis Nur hayati,
Harlinda
Informatics Engineering Study Program STMIK
Dipanegara Makassar, Indonesia
SCHEDULING USING GENETIC ALGORITHM AND
ROULETTE WHEEL SELECTION METHOD
CONSIDERING LECTURER TIME
Journal of JITU Vol. 2 Issued, June 2019
page 24-28
Abstract – Scheduling lectures is not something easy,
considering many factors that must be considered. The
factors that must be considered are the courses that will be
held, the space available, the lecturers, the suitability of the
credits with the duration of courses, the availability of
lecturers' time, and so on. One algorithm in the field of
computer science that can be used in lecture scheduling
automation is Genetic Algorithms. Genetic Algorithms can
provide the best solution from several solutions in handling
scheduling problems and the selksi method used is roulette
wheel. This study produces a scheduling system that can
work automatically or independently which can produce
optimal lecture schedules by applying Genetic Algorithms.
Based on the results of testing, the resulting system can
schedule lectures correctly and consider the time of
lecturers. In this study, the roulette wheel selection method
was more effective in producing the best individuals than
the rank selection method.
Keywords: Scheduling; Genetic algorithms; Roulette
wheel

JOURNAL OF INFORMATION TECHNOLOGY AND ITS UTILIZATION, VOLUME 2, ISSUE 1, JUNE-2019:1-3 ISSN 2654-802X
1
DESIGN WEB-BASED ELECTRICAL CONTROL SYSTEM USING
RASPBERRY PI
Dolly Indra1, Tasmil2, Herman3, St. Hajrah Mansyur4, Erick Irawadi Alwi5 1345Computer Science Dept. Universitas Muslim Indonesia,
2BBPSDMP KOMINFO Makassar
([email protected], [email protected], [email protected], [email protected],)
Abstract-- The use of current website technology can be
applied as a control and monitoring system, which is used
to control electrical devices, so that the user can only control
the PC or smartphone that has been connected to Wi-Fi or
the Internet. In this case the control uses the Raspberry Pi
Mini PC which has several advantages such as low power
and is relatively easy when connected with a web server
compared to a microcontroller. By utilizing the Raspberry
Pi Mini PC as a web server, it can replace PC functions in
general. The results in this study are the Electric Control
System that has been made capable of controlling 4 AC
voltage electronics as well as 4 relays with each relay
capable of bearing a maximum load of 2200 watts using a
power supply on the Raspberry Pi which has a minimum of
0.7 amperes and Control of electrical load can be done
within a distance of 0 meters - 15 meters from the wireless
router
Keywords: Web-design; Electrical control; Raspberry pi
I. INTRODUCTION
In the current era of globalization, technology greatly helps
human activities to be easier and more efficient. Electronic
equipment technology is one of the technologies that will
certainly help humans in doing various things, especially in
controlling various electrical devices.
The use of current website technology can be applied as
control and monitoring, which is used to control electrical
devices, so that the user can only control the PC or smartphone
that has been connected with Wi-Fi or the Internet. In this case
the control uses the Raspberry Pi which has several advantages
such as low power and is relatively easy when connected with
a web server compared to a microcontroller. By utilizing
Raspberry Pi Mini PC as a web server, it can replace PC
functions in general [1], [2], [3]. Some studies have utilized the
Raspberry Pi Mini PC, [4], [5].
II. METHOD
A. Proposed System
The control system proposed in this study is shown in Figure 1.
This control system uses logic 0 and logic 1 output from the
Raspberry Pi GPIO pin it controls via a web server. Control of
electronic devices is done by users of PCs or smartphones that
have been connected to Wi-Fi. Users are connected to a web
server, which can then be selected on the web page "ON" or
"OFF". After pressing the button on the web server, the web
server will send data to the Raspberry Pi that has been
connected to Wi-Fi.
Fig. 1. Control system schema
B. Flowchart system
Figure 2 shows that the first client to do is configure an IP
address, PC or similar device according to the local network.
After the configured IP address client connects the client device
to the local network via wireless.
Fig. 2. Control system access flowchart
If it cannot connect to the local network, there may be an error
in configuring the IP address, repeat the configuration steps.
after connecting to the local network, open a web browser, then
open the electric control system web page. On the web page to
enter the electrical control system first fill in the username and
password, if the login is successful then enter the main menu of

JOURNAL OF INFORMATION TECHNOLOGY AND ITS UTILIZATION, VOLUME 2, ISSUE 1, JUNE-2019:1-3 ISSN 2654-802X
2
the control system web page. The electrical control system is
only limited to relay status via the button, the relay function is
on and off only.
C. Control system program flowchart
Figure 3 shows that in the initial stage of the control system
program, initialization of the GPIO pin is used. After that,
reading each relay status depends on the GPIO pin used. To find
out the relay status through a web page that is represented by
the status button of each relay.
Fig. 3. Control system program flowchart
The client can input actions via the button on the web page.
there are 4 buttons representing 4 relays. input action on if you
want to turn on and input the action off if you want to turn off
the relay. And if you don't want to do an action, or just check
the status, the client can immediately exit by closing the web
page.
III. RESULT AND DISCUSSION
The implementation phase of this system is the preparation
of the Raspberry Pi 2 model B. It includes steps to assemble
system equipment including power supply, relay, raspberry pi,
and electrical load terminals into 1 part. Next step is to install
OS Raspbian Jessie Lite on the MicroSD card, step network IP
address settings, install Python steps, code control system
programs, step install Apache as a web server, Chromium web
browser for displaying systems through the website.
A. Stringing System Equipment
The power supply used is the DVD regulator circuit because
it is simpler and safer for the resources of the system to be built.
The power supply circuit used has a 5 volt output to connect to
the Raspberry Pi module and 12 volts for relay circuits are
shown in Figure 4.
Fig. 4. Power suplay circuit with output 12 volt and 5 volt
In the design of the electrical load control system limits the
number of loads to be controlled by 4 electronic equipment. It
means using 4 pieces of relay. But in this system design, 8
channel relays are used to anticipate if there is a problematic
relay circuit shown in Figure 5.
Fig. 5. Relay circuit 8 Ch 12 volt
The Raspberry Pi used is the Raspberry Pi 2 Model B 1Gb.
GPIO pins used on raspberry pi include GPIO 7, 11, 27 and 22
shown in Figure 6.
Fig. 6. Module rapsberry Pi 2 model B
The system design output uses 4 AC terminals so that all
electrical equipment to be controlled is shown in Figure 7.
Fig. 7. AC terminal
B. Testing
In this test we performed with 2 stages, namely, First using
the Test from a Web Browser on the Laptop Client and Second
using the Testing from a Web Browser on an Android Mobile
Client.

JOURNAL OF INFORMATION TECHNOLOGY AND ITS UTILIZATION, VOLUME 2, ISSUE 1, JUNE-2019:1-3 ISSN 2654-802X
3
In the first test, the test is carried out using the Laptop Client.
Tests carried out are how far the client laptop can control the
system. These test results are shown in Table I.
TABLE I
Result of client laptop testing
No. Distance
(Meter)
Control
Capability Description
1 1 Good Good Connection
2 5 Good Good Connection
3 10 Good Good Connection
4 20 Good Good Connection
5 30 Good Good Connection
6 40 Not Good Slow Connection
7 50 Not Good Lost Connection
Based on Table 1, testing the distance control by using the
laptop above, that electronic devices can work at a considerable
distance, which is in the range of 30 meters and is located in 1
adjacent building area. However, not only does the distance that
determines the performance of the tool run well or not. Given
that Wi-Fi has the nature of LOS (Line Of Sigh), or in other
words that the nature of the waves used Wi-Fi is microtic waves
that have a straight propagating nature, so the signals emitted
by Wi-FI will be received maximally if there are no obstacles
which inhibits it.
In the second test, Testing on the Android Mobile Client.
Testing of a Web Browser on an Android Mobile Client.
Testing is done is how far the Android Mobile client can control
the system. The test results are shown in Table II.
TABLE II
Result of client laptop testing
No. Distance
(Meter)
Control
Capability Description
1 1 Good Good Connection
2 5 Good Good Connection
3 10 Good Good Connection
4 20 Good Good Connection
5 30 Not Good Slow Connection
6 40 Not Good Slow Connection
7 50 Not Good Lost Connection
Based on Table II, the test results, it can be seen that there
is a difference between testing using a laptop with testing using
Android mobile. Testing using a laptop has a greater control
distance compared to using an Android phone. This happens
because laptops have Wi-Fi adapters with better specifications
compared to Wi-Fi adapters that are on Android phones. Then,
Wi-Fi adapters that are on Android phones also have less power
when compared to Wi-Fi adapters available on Laptops.
IV. CONCLUSION
The Electric Control System that has been made is able to
control 4 AC voltage electronic devices at the same time by 4
relays with each relay capable of bearing a maximum load of
2200 watts using a power supply on the Raspberry Pi which has
a minimum of 0.7 amperes and Control will have performance
more leverage if controlled via a PC / Laptop compared to using
an Android mobile.
V. ACKNOWLEDGMENT
We would like to thank the Universitas Muslim Indonesia
who have helped carry out this research in terms of funding.
VI. REFERENCES
[1] K. Londhe, "Design and Implementation of Embedded
web Server Using Raspberry Pi for Monitoring Battery/
Solar System," International Journal of Innovative
Research in Computer and Communication Engineering
International Journal of Innovative Research in
Computer and Communication Engineering, vol. Vol. 5,
no. Issue 1, pp. 1111-1116., 2017.
[2] C. W. Zhao, J. Jegatheesan and S. C. Loon, "Exploring
IOT Application Using Raspberry Pi," International
Journal of Computer Networks and Applications, vol. 2,
no. 1, pp. 27-34, 2015.
[3] S. Wisnusenna, M. S. Yonatana, A. Wibisurya, F. and T.
Yuwon, "Model of Web Based Application to Control
Brigde Traveler Using Raspbery Pi," ElSEVIER, vol.
Procedia Computer Science 135, no. 135, pp. 518-525,
2018.
[4] N. Shroff, . P. Kauthale, A. Dhanapune and N. S. Patil,
"IOT Based Home Automation system using Raspberry
Pi-3," International Research Journal of Engineering and
Technology (IRJET), vol. 04, no. 05, pp. 2824-2826,
2017.
[5] M. Anwaruddin and M. A. Ali, "A Review On Raspberry
Pi Based Industrial Process Monitoring And Control
Using Modbus Protoco," INTERNATIONAL JOURNAL
OF INNOVATIVE TECHNOLOGY AND RESEARCH
(IJITR) , vol. 5, no. 1, pp. 5483-5486., 2017.

JOURNAL OF INFORMATION TECHNOLOGY AND ITS UTILIZATION, VOLUME 2, ISSUE 1, JUNE-2019:4-11 ISSN 2654-802X
4
ANALYSIS AND DESIGN OF DISTRIBUTED SYSTEM FOR
MONITORING COMPUTER INFRASTRUCTURE MANAGEMENT BASED
ON CLIENT/SERVER BY USING WINDOWS MANAGEMENT
INSTRUMENTATION TECHNOLOGY
Musawarman1, Muhammad Nugraha2 1 2Politeknik Enjinering Indorama, Indonesia
Abstract-- This research aims to analyze and develop a
system for monitoring computer infrastructure
management in real time (real-time monitoring). The
developed system was a distributed system that would help
IT Administrators work at the Center for Computing and
Information Technology Faculty of Engineering
Universitas Indonesia (CCIT FTUI) to monitor the
computer infrastructure in real-time. The Real-time
referred to a system that was able to do direct monitoring
to computer infrastructure, and quickly able to transmit the
data status of the device. Limitations of the current
monitoring process were that the IT Administrator checks
directly into the computer lab room if there were problems
related to a computer or cable that was not connected from
the computer system based on a report from teachers or
students. The developed monitoring system was a
client/server based system that used network infrastructure
so that the computer infrastructure could be optimally
monitored. The modules used in this research are computer
input and output modules, and installed applications or
system services. This research is expected to be able to
overcome the problems associated with computer
infrastructure’s performance, conduct supervision and
centralized control in helping the problems that often occur
during the learning process or examination.
Keywords: Monitoring; Computer Infrastructure
Management; Distributed System; Computer Network; Real-
time.
I. INTRODUCTION
Computer infrastructure monitoring systems cannot be
separated from the process of monitoring some hardware that is
often lost or not automatically detected by a centralized system
that has a significant impact, such as delayed learning process
or exam for some students. Some hardware those may be
missing or undetectable is a mouse, keyboard, graphics adapter,
storage adapter, network adapter, services, and applications
installed on the computer. This research is going to build a
system that is able to conduct a comprehensive monitoring
process on computer systems, especially computer
infrastructure located in Computer Lab of Center for
Computing and Information Technology Faculty of
Engineering, Universitas Indonesia. The system development
method used in this research is a prototyping [1] which consists
of several stages, including identifying the requirements of
system users, developing prototypes, determining whether
prototypes can be used, and prototype implementations. The
system development with a prototyping model is used because
the problem is not properly structured and the data requirements
are uncertain.
A. Prototyping Model
The prototyping model is a model used to identify detailed
input, processing, or output requirements. In different cases, the
developer might be not sure of the efficiency of the algorithm,
adaptability to the system, or the interaction form between
human and computer to be performed, so that the prototyping
model (Pressman, 2001) can be applied.
There are two kinds of prototypes. Type I prototype is a
model that will develop into an operational system. The Type II
prototype is a discardable model that serves as a blueprint for
the operational system. The approach to the Type I prototype is
only possible if prototyping equipment enables prototypes to
load all the essential elements of the new system while the Type
II prototype approach is conducted if the prototype is only
intended for the display as operating systems and is not
intended to contain all the essential elements (McLeod, 2001).
B. Database Management System
DBMS (Database Management System) is a software that
allows users to define, load, maintain, and manage access to
databases (Connolly and Beg, 2010). DBMS is a software that
interacts with users of application programs and databases.
C. Distributed System
The distributed system is a computer system that is
geographically distributed, the system has databases, functions,
and processes distributed. The common architecture for
distributed systems is a local area network (LAN) client/server
system [2]. The advantage of a distributed system is that when
designed properly, it is able to integrate different applications
running on different computer system into one system [3].
D. Real-time Application
Real-time application is an application that manages a
hardware and software system that is limited by time span and
has clear deadlines relative to the time of an event or operation
such as manufacturing process control, or high-speed data

JOURNAL OF INFORMATION TECHNOLOGY AND ITS UTILIZATION, VOLUME 2, ISSUE 1, JUNE-2019:4-11 ISSN 2654-802X
5
acquisition devices. The unique characteristic of real-time
application is that it not only provides the correct response but
also responds within a certain time frame. The real-time system
is the set of all hardware system elements, operating systems,
and applications required to meet the system requirements [4].
E. Windows Instrumentation Management
Windows Management Instrumentation (WMI) is an
infrastructure for data management and operation on Windows
operating systems. Writing programming using WMI support
can automatically run administrative tasks on computers that
are connected to the network. WMI implements the
functionality described in WMI class function and class
characteristic called WMI Provider and WMI Class [5].
F. Programming Language C#
C# is an object-oriented programming language that is
modern, created and developed by Microsoft along with the
.NET platform. There is various software developed with C#
and .NET platform: office applications, web apps, websites,
desktop apps, mobile apps, games and more. C# is a high-level
language like Java and C ++ and, to some extent, other
languages like Delphi, VB.NET and C. All C# programs are
exploring. The C# language consists of a set of definitions in
the class that include the functions and functions of a computer-
run program [6].
G. Local Area Network (LAN)
Local Area Network (LAN) is a network bounded by a
relatively small area, generally restricted by an environmental
area such as an office building, or a school, and usually not far
from about 1 square kilometer. Some LAN configuration
models, one computer then become a File Server. The server is
used to store network activities devices, or as software that can
be used by computers which are connected to the network. The
computers that are connected to the network are commonly
called workstations. Usually, a workstation capability is lower
than a File Server and has other applications in the storage
devices. Most of LAN use the media cable to connect one
computer to another.
H. Network Topology
Network topology is a way to connect one computer with
another computer to form a network. There is one central
computer or hub, all computers in the network are directly
connected to the central.
I. Client/Server Computing
Client/server computing is a system model that divides
processing between clients and servers residing within the
network, providing a specific function to a computer machine,
so it’s able to process an instruction or command [1].
J. Black Box Testing
Black-box testing is an approach to testing where test results
are obtained from the program or component specifications. In
this case, the black box testing is more focused on the functional
requirements of the software and not from its implementation
(Sommerville, 2001).
II. METHOD
The research method used in this research was the
prototyping model development system. There are several
stages in system development using this methodology [1],
including Identification of Users’ Requirements, Prototype
Development, Prototype Validation, and Operating the
Prototype
Figure 3.1. System Development Stages
A. Identification of Requirements
At this stage, developer and users met and objectively
defined the whole of the software and identified all the
requirements and outline of system coverage. Information
requirements analysis was done by discussing with the users,
which were the System Administrators in the Information
Technology division so that at this stage would be obtained the
expected results. At this stage, several steps can be done to
identify and analyze Requirements are as follows [1]:
a. Problem Identification
The problem faced was how to develop a system for
monitoring hardware and services system that were in the
computer system in the Lab. Data collection was done by
observing the operation of some installed devices in the
computer system. It was conducted based on type, object,
source, and preparation of data collection. Object and source of
data consist of elements, characteristics, population, and
sample. Preparation of data collection was done technically and
nontechnically. The data could be obtained directly or
indirectly. The data and information collection was conducted
through the collecting process of information resources by the
user of information.
b. Users Restriction Analysis
The process undertaken at this stage was to define user
limits. Information obtained from discussion with IT
Administrator, that system user consists of only one user, the IT
Administrator. It was caused by the fact that the monitoring
function may only be performed by a single user, the IT
Administrator.
c. System Requirements Analysis
This stage was the process of determining some functions
would be built, including the determining monitoring function
of computer hardware.
d. User Requirements Analysis
The activity undertaken at this stage was determining the
requirements of the system user. The requirements of users
were obtained by determining the function of the system where
the users could access information related to the computer
infrastructure.

JOURNAL OF INFORMATION TECHNOLOGY AND ITS UTILIZATION, VOLUME 2, ISSUE 1, JUNE-2019:4-11 ISSN 2654-802X
6
e. Information Requirements Analysis
This stage was the process of information requirements
analysis needed by the system user. The information
requirements referred to information needed to show the
detailed data, notification system and the search system.
f. System Analysis
At this stage, an observation was done to collect system
requirements. The system requirements specification that had
been analyzed was a system that was able to know the detailed
availability of computer devices, take over the computers even
though they were in different places, and notify the computer
Administrator if there were problems related to the computer
infrastructure, especially the computer network.
B. Prototype Development
The prototype was developed through several stages as
follow [7]:
a. Database Design
This stage was the stage of designing a specific database
related to installing computer devices in the computer system.
The design was done by using SQL Server 2014 database
software.
b. System Interface Design
The system interface was designed by using Visual Studio
2015 to get a detailed design that described the overall system
functionality.
c. Alternative System Configuration
This stage was the stage of determining the specification of
the hardware and software requirements which were required to
run a computer monitoring system. At this stage, some software
was required to support the implementation of the design result.
Software specification used in the prototype development of the
system including SQL Serves 2014 as the database processor,
C# as the programming language, and Visual Studio 2015 as
the programming language editor.
C. Prototype Validation
The developed prototype was then explained its function to
the users. The prototype testing would be done directly by the
users by checking the functions of the system. If the developed
prototype satisfied the users then proceeded to step 4, Operating
the prototype. If the prototype failed to satisfy the users then the
prototype would be revised by repeating step 1,2, and 3 (Figure
3.2) with additional input or suggestions for improving the
prototype.
D. Operating the Prototype
The final stage of System Development by using Prototyping
Model was operating stage. At this stage, the prototype would
be explained how to use operational functions of each part in
the system.
III. RESULT AND DISCUSSION
A. Requirements Identification Results
1. Problem Identification Result
In improving the process of monitoring the computer
infrastructure in the classroom, IT Administrator has not yet
had the relevant system to perform real-time monitoring using
computer network that has been built, it is necessary to build a
system that is able to perform the process of computerized and
network connected monitoring.
Identify basic requirements
Develop a working prototype
Use the prototype
User satisfied?
Operational Prototype
Revise and enhance the prototype
YES
NO
Step 1
Step 2
Step 3
Step 4
Figure 3.2. Prototyping Model
The process of monitoring the infrastructure currently
being carried out was by direct inspection if there are reports
from users, for example by calling the IT Administrator directly
if there is a problem related to hardware or network so that from
time aspect would charge the IT Administrator to conduct an
infrastructure inspection.
Based on the above information, several problems that
arise, including:
There was no computerized monitoring process so the
computer inspection process became ineffective.
There was no computerized notification process in case of
hardware and software related problems using the network.
Unavailability of audit report process to some problems
that arise related to process monitoring of computer
infrastructure.
2. User Restrictions
The users of this system consisted of only one person, the
Administrator, who had the authority to access all parts of the
system, such as the process of monitoring computerized
infrastructure.
3. System Requirements Analysis Results
The developed system would be named CCIT Surveillance
System (CCSS) which would have several features, including:
The function of computerized monitoring to the computer
infrastructure.
Tools to provide immediate notification if there were
infrastructure related issues.
4. User Requirements Analysis Results
The needs of users which successfully identified were:
Required a system that was accessible on both server and
client sides in real-time.
Required a system that was able to notify the Administrator
directly if a problem had occurred related to the computer
infrastructure.
Required a system that was able to manage the monitoring
results in the form of reports.

JOURNAL OF INFORMATION TECHNOLOGY AND ITS UTILIZATION, VOLUME 2, ISSUE 1, JUNE-2019:4-11 ISSN 2654-802X
7
5. Information Requirements Analysis Results
Referring to the results of discussions with the IT
Administrator, it found the needs for information required by
the researcher, including:
Displayed the details of data. The data displayed were the
status of the mouse, keyboard, storage device data,
computer addresses, services and applications installed on
the computer.
Notification information if there was a problem with the
system.
The system had a search function to display specific
information, such as a computer address and a specific
computer infrastructure.
Figure 4.1. Database Design
6. System Analysis Results
The developed system should have several facilities,
including:
Monitoring System
In this section, the system was able to perform real-time
monitoring of some components of the computer
infrastructure. In this section, client-based applications
would be installed on the computer and provide detailed
information about the computer's infrastructure status. The
data would be stored into the database provided and the
server would display the data if needed.
Remote Computer Monitoring System
The system could perform remote computer monitoring
using network devices.
Notification System
The system could notify directly to the Administrator if a
problem with the computer infrastructure was detected.
Reporting System
The system could print computer infrastructure data in the
form of reports for audit purposes.
B. Prototype Development Results
1. Detail of System Design
A system that was able to display some computer
information, such as computer network, mouse, storage media,
services, and computer graphics adapters. Administrators could
view the status of each device listed in the system
automatically. Any computer that installed the automation
system could display detailed information on its computer
information. The system was designed using a data flow
diagram to view the data transmission of each process.
2. System Interface Design Results
The design of the developed system interface consisted of
database design, menu interface, and submenu.
Figure 4.2. System Menu Design
Menu design was done to provide a clear picture of the
information that would be displayed. Basically, the menu
design consisted of several parts, including navigation menu,
search and display data as shown in Figure 4.2.
The sub-menu interface design was used to display detailed
information about the status of the scanned computer. The
design of the interface can be seen in Figure 4.3.
Figure 4.3. Sub-menu Interface Design
3. Alternative System Configuration
Hardware requirements for servers and clients were
different in terms of performance. In order to the system
developed could work optimally, the minimum hardware
requirements that recommended for the server and client were
as follows:
Server
Processor Core i3 2.1 GHz. High-speed processors are
needed for the system to work properly and the process can
take place quickly.
4 GB memory is used to support the performance of the
system to run properly, required large memory capacity.
Minimum storage capacity 1 GB for system installation.
Monitor resolution 1152 x 864. The display system will be
better if using a high-resolution monitor.
Client
Dual Core Processor 1.8 GHz.
2 GB of memory.
Minimum 500 MB storage capacity for system installation.
Monitor resolution 1152 x 864. System display will be
better if using a high-resolution monitor.
C. Prototype Validation Results
At this stage, the test was held by using black box testing
method, where each function was tested to get the expected
results. The cases that have been tested can be seen in Table 4.1.
Table 4.1. Black Box Testing

JOURNAL OF INFORMATION TECHNOLOGY AND ITS UTILIZATION, VOLUME 2, ISSUE 1, JUNE-2019:4-11 ISSN 2654-802X
8
Test
Case
Input
Value
Scenario Expected Results Test
Result
Display of the
Main Page
Correct Users press the navigation
monitoring button.
Displays the information about the identity of the
computer
Success
Users press the Stop button.
Stopping the process monitoring of
infrastructure computer.
Success
Users press the
information notification
button.
Get the Information Success
Users press the
Export to File button.
Obtain the device
information report.
Success
The System displays
computer information on
Datagrid
Get computer device information on the
Datagrid
Success
Users press the
data grid to display computer
details when the data grid is
pressed.
Datagrid displays
detailed computer information
Success
Detailed
Page View
Correct Displays the
information of IP data, status
and computer name.
Data showing on the
panel to display IP, status, and computer
name.
Success
Function button to the remote
client computer.
The client computer can be remote
Success
Function button to return to the
main menu.
Users can return to the main menu.
Success
Function to display mouse
data.
Mouse data can be visible in the Datagrid
Success
Function for
displaying keyboard data.
The keyboard data can be
visible on the Datagrid.
Success
Function for displaying
network device data.
Network device data can be visible on the Datagrid
Success
Function to display monitor
device data.
Monitor device data can be visible on the datagrid
Success
Function to
display storage media data.
Storage media data can
be visible on the Datagrid
Success
Function to display universal
serial bus data.
USB data can be visible on the Datagrid
Success
Function to
display CD-ROM data.
The CD-ROM data can
be visible on the Datagrid
Success
Function to display computer
service data.
The computer services data can be visible on the
Datagrid
Success
Function to
display application data
installed on the computer.
Application data can be
visible on the Datagrid
Success
Remote Desktop
Display Function
Correct The function of the connection
button to gain access to the
client computer.
Users successfully to remote client computer
Success
The function of
the Disconnect button to stop
connecting to the client computer.
Disconnect from client
computer
Success
D. Prototype Implementation Result
Prototype implementation result is divided into two:
1. Operating System Functions On The Client
Store Mouse Device Data
The data stored while running this function is the computer
address, device name, user's computer name, device ID, and
mouse device status (Figure 4.4).
Figure 4.4. Mouse Device Data
Store Keyboard Device Data
The next function is a function to store keyboard data
installed on a computer system. Data is stored every second
after the function is executed by the system (Figure 4.5).
Figure 4.5. Keyboard Data
Store Network Device
The function that is run is used to store the data of computer
network devices, such as hardware adapters. The data adapter
is stored in the database once every second. The test results of
the function can be seen in Figure 4.6.
Figure 4.6. Network Data
Store Universal Serial Bus (USB) Data
USB data is required by the Administrator to check some
of the connected devices to the computer system. The stored
USB data includes computer address, device name, device ID,
USB version and device status. The result of the function that
runs on the client computer produces the data as shown in
Figure 4.7.
Figure 4.7. USB Data
Store Services Data
Network administrators need to check the services of the
software running on the computer system. Monitoring covers
computer address data, service names, on-going software
names, process IDs, and system service statuses. The executed
function manages to get data every second to enter data related
to the computer system service (Figure 4.8).
Figure 4.8. Services Data
2. Operating System Functions On The Server
The function of the operating system on the server
computer is used for the monitoring process of every computer

JOURNAL OF INFORMATION TECHNOLOGY AND ITS UTILIZATION, VOLUME 2, ISSUE 1, JUNE-2019:4-11 ISSN 2654-802X
9
device installed in the computer system, the computer device
consists of the mouse device, keyboard, universal serial bus,
system services, graphics, computer network, CDROM, and
installed applications. There are several functions associated
with the operating system on the server computer, including:
Computer Identity Monitoring Function
The function that is run is used for monitoring the process
of general information on computer identity. The identity of the
computer successfully displayed is the computer's address data,
computer name, status, and name of the operating system used
(Figure 4.9).
Figure 4.9. Computer Monitoring Result
The monitoring result in Figure 5.8 explains that there is
one computer network device that is not connected to the server,
this can be caused by the cable device that is not connected to
the computer. The system error indicator is indicated by
displaying an error message, i.e Error: 1 which means there is 1
computer not connected to the computer system.
Mouse Device Monitoring Function
The computer monitoring functionality is used to facilitate
IT Administrators to get detailed information related to the
mouse device. The information displayed consists of computer
address, device name, user's computer name, device ID, and
mouse device status (Figure 4.10).
Figure 4.10. Mouse Monitoring Result
Keyboard Monitoring
Keyboard device information needs to be displayed for
general device information details. The information displayed
consists of the computer address, device name, computer name,
device status, and device ID as seen in Figure 4.11.
Figure 4.11. Keyboard Monitoring Result
Network Monitoring
The monitoring function of the network device is used to
display information consisting of a computer network device,
the name of the network device, the device type, the device
description, the computer system name, the device ID, the
physical address of the computer, and the status of the network
device (Figure 4.12).
Figure 4.12. Network Monitoring Result
USB Monitoring
The USB device monitoring function is used to display the
computer's address data, device name, device ID, USB version
and device status (Figure 4.13).
Figure 4.13. USB Monitoring Result
Services Monitoring
Computer services is a service that runs in the background
system when the operating system is run for the first time and
provide specific functions. The information displayed consists
of computer address, service name, current software name,
process ID, and system service status (Figure 4.14).
Figure 4.14. Services Monitoring System
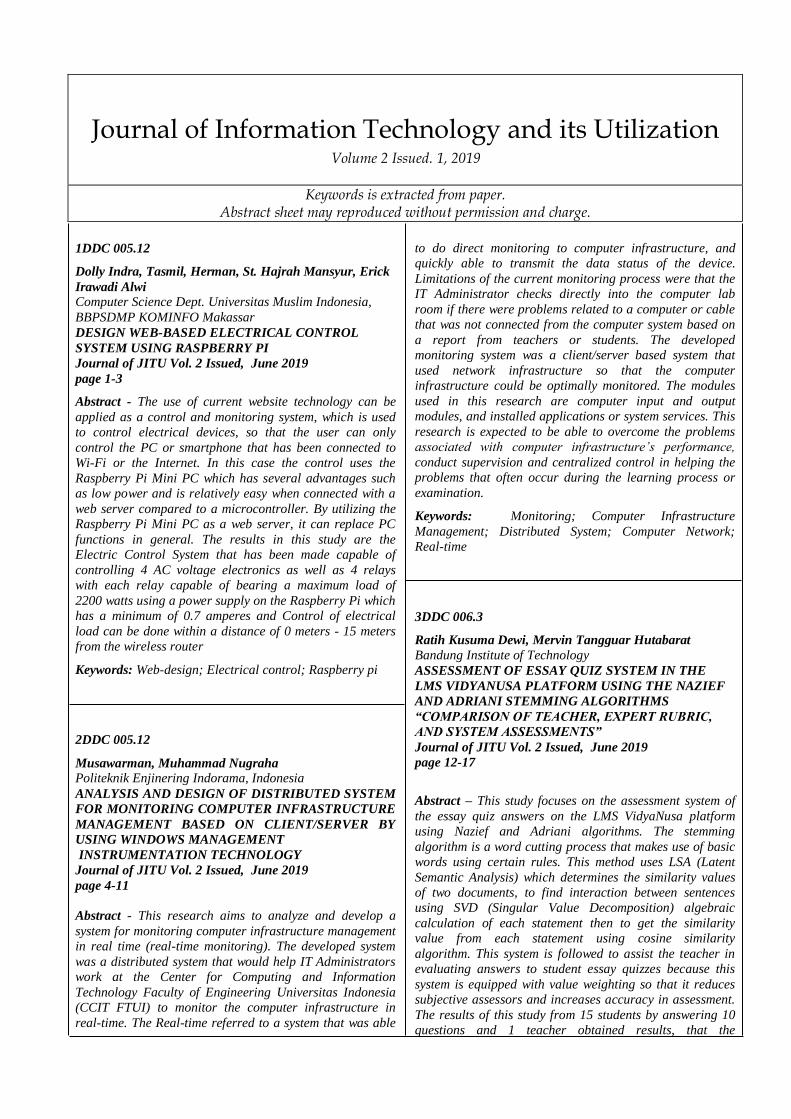
E. Performance Measurement Results
The performance measurement of computer infrastructure
monitoring process was done on one server computer and a
client computer. The parameters used for this performance
measurement were the use of a computer processor and
memory. On the client side, with the process name
RealTimeMonitoring.vshost.exe, processor performance
measurement obtained data that the monitoring system used
0.61% processor of the total 100% (Figure 4.15).
JOURNAL OF INFORMATION TECHNOLOGY AND ITS UTILIZATION, VOLUME 2, ISSUE 1, JUNE-2019:4-11 ISSN 2654-802X
10
Figure 4.15. Processor Performance Measurement from Client Side
The client-side monitoring system used 38.284 KB (0.0365
GB) of memory from a total of 4 GB of memory used (Figure
4.16). From the performance measurement results concluded
that the monitoring system on the client side did not burden the
performance of the processor and did not require excessive
computer memory usage.
Figure 4.16 Memory Performance Measurement from Client Side
On the server side, with the process name
ServerManager.vshost.exe, performance measurement of the
processor found that the monitoring system used 1.01%
processor consumption of the total 100% (Figure 4.17).
Figure 4.17. Processor Performance Measurement from Server Side
The measurement of the computer's memory performance
on the monitoring system from the server side showed that the
system used 58.620 KB (0.056 GB) from a total of 4 GB used
(Figure 4.18). The system usage did not burden the computer's
performance significantly in terms of memory and processor.
Figure 4.18. Memory Performance Measurement from Server Side
IV. CONCLUSION
ICT has been widely used in rural areas. ICTs are used by
individual and household communities, although they are
mostly used only for social media and entertainment. In
addition to individuals, in some regions, ICTs are also used to
support journalism through village portals and community
radio. ICT has also been used by farmers and fishermen. in
addition, local governments have also used ICTs to promote
their regions.
Most of ICT for development models in Indonesia,
especially in rural area are the telecenter. The kind of
telecenters has held in Indonesia such as PLIK, MPLIK,
Information Village and DBT. Most of literatures states that this
telecenter program was less successful.
Some ICT problems for development, especially in rural
areas are revealed in the literature, such as problem of ICT
programs for development (limited infrastructure, management
and communication), territories problems (location, culture), e-
literacy problems, and public awareness issues.
The challenge of ICT for development especially in rural
areas is a literacy problems. ICT literacy itself, public
awareness, cultural issues and the problem of unsuccessful
various ICT programs for development, one of the reasons is
illiteracy. In addition, Indonesia's territorial issues are quite
difficult challenges, so an ICT model for development is really
planned and mature. In addition, the important thing is that this
work must be carried out together.
V. ACKNOWLEDGMENT
I gratefully acknowledge to Head of Politeknik Enjinering
Indorama for all facilities I use to complete this paper. Big
thanks also to researchers partnert for supporting me to
complete this paper.
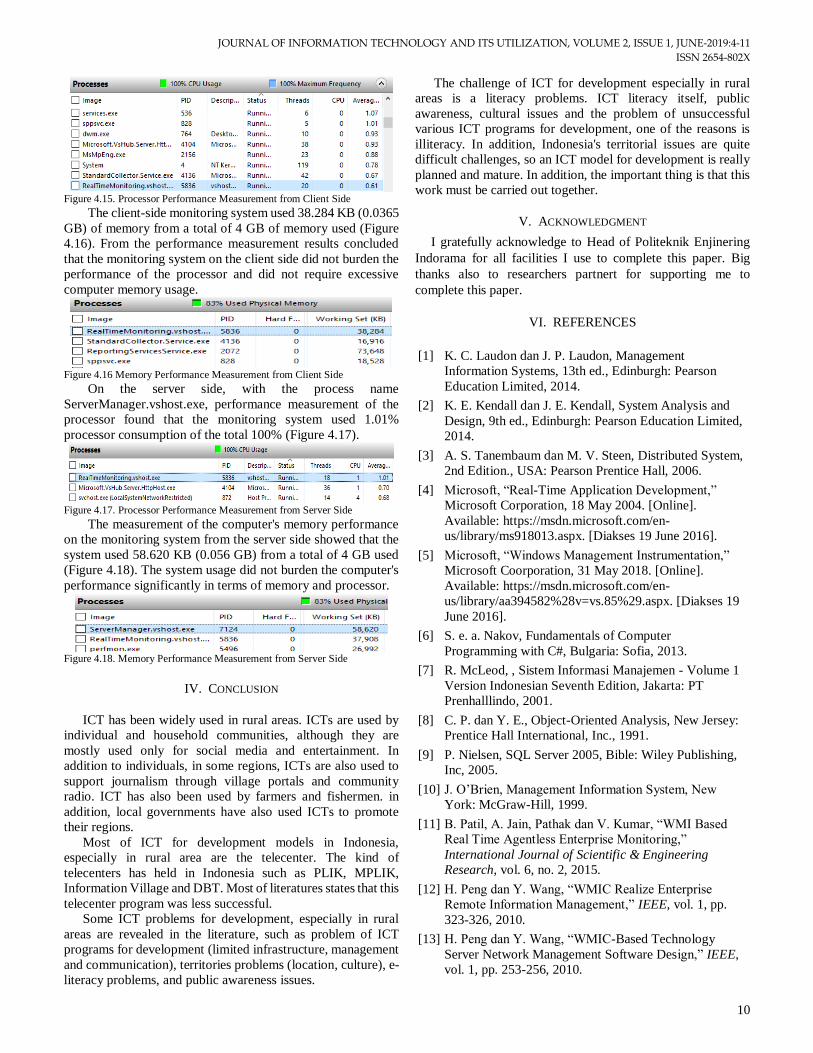
VI. REFERENCES
[1] K. C. Laudon dan J. P. Laudon, Management
Information Systems, 13th ed., Edinburgh: Pearson
Education Limited, 2014.
[2] K. E. Kendall dan J. E. Kendall, System Analysis and
Design, 9th ed., Edinburgh: Pearson Education Limited,
2014.
[3] A. S. Tanembaum dan M. V. Steen, Distributed System,
2nd Edition., USA: Pearson Prentice Hall, 2006.
[4] Microsoft, “Real-Time Application Development,”
Microsoft Corporation, 18 May 2004. [Online].
Available: https://msdn.microsoft.com/en-
us/library/ms918013.aspx. [Diakses 19 June 2016].
[5] Microsoft, “Windows Management Instrumentation,”
Microsoft Coorporation, 31 May 2018. [Online].
Available: https://msdn.microsoft.com/en-
us/library/aa394582%28v=vs.85%29.aspx. [Diakses 19
June 2016].
[6] S. e. a. Nakov, Fundamentals of Computer
Programming with C#, Bulgaria: Sofia, 2013.
[7] R. McLeod, , Sistem Informasi Manajemen - Volume 1
Version Indonesian Seventh Edition, Jakarta: PT
Prenhalllindo, 2001.
[8] C. P. dan Y. E., Object-Oriented Analysis, New Jersey:
Prentice Hall International, Inc., 1991.
[9] P. Nielsen, SQL Server 2005, Bible: Wiley Publishing,
Inc, 2005.
[10] J. O’Brien, Management Information System, New
York: McGraw-Hill, 1999.
[11] B. Patil, A. Jain, Pathak dan V. Kumar, “WMI Based
Real Time Agentless Enterprise Monitoring,”
International Journal of Scientific & Engineering
Research, vol. 6, no. 2, 2015.
[12] H. Peng dan Y. Wang, “WMIC Realize Enterprise
Remote Information Management,” IEEE, vol. 1, pp.
323-326, 2010.
[13] H. Peng dan Y. Wang, “WMIC-Based Technology
Server Network Management Software Design,” IEEE,
vol. 1, pp. 253-256, 2010.

JOURNAL OF INFORMATION TECHNOLOGY AND ITS UTILIZATION, VOLUME 2, ISSUE 1, JUNE-2019:4-11 ISSN 2654-802X
11
[14] R. S. Pressman, Software Engineering: A
PRACTITIONER’S APPROACH. Fifth Edition,
McGraw-Hill, 2001.
[15] A. Steven, Information Systems: A Management
Perspective. Second Edition, Menlo Park:: The
Benjamin/Cumming Publishing Company, Inc, 1996.
[16] I. Sommerville, Software Engineering – 6th Edition,
Essex: Addison-Wesley, 2001.
[17] C. TM dan B. CE, Database Systems: A Practical
Approach to Design, implementation, and Management
– Third Edition, USA: Addison Wesley, 2002.
[18] Y. Wang dan Y. Yu, “WMIC in the Remote Monitoring
System,” IEEE, pp. 1-4, 2010.

JOURNAL OF INFORMATION TECHNOLOGY AND ITS UTILIZATION, VOLUME 2, ISSUE 1, JUNE-2019:12-17 ISSN 2654-802X
12
ASSESSMENT OF ESSAY QUIZ SYSTEM IN THE LMS VIDYANUSA
PLATFORM USING THE NAZIEF AND ADRIANI STEMMING
ALGORITHMS “COMPARISON OF TEACHER, EXPERT RUBRIC, AND
SYSTEM ASSESSMENTS”
Ratih Kusuma Dewi1, Mervin Tangguar Hutabarat2 1 2Bandung Institute of Technology
([email protected], [email protected] )
Abstract— This study focuses on the assessment system
of the essay quiz answers on the LMS VidyaNusa platform
using Nazief and Adriani algorithms. The stemming
algorithm is a word cutting process that makes use of basic
words using certain rules. This method uses LSA (Latent
Semantic Analysis) which determines the similarity values
of two documents, to find interaction between sentences
using SVD (Singular Value Decomposition) algebraic
calculation of each statement then to get the similarity value
from each statement using cosine similarity algorithm. This
system is followed to assist the teacher in evaluating answers
to student essay quizzes because this system is equipped
with value weighting so that it reduces subjective assessors
and increases accuracy in assessment. The results of this
study from 15 students by answering 10 questions and 1
teacher obtained results, that the assessment given by the
teacher without the vulnerable rubric was 8-10, the value
given by the vulnerable system was 0-10, and the assessment
of the system with the vulnerable rubric was equal 0 -10. So
when viewed from the function of the rubric on the
objectivity of the assessment, the value given by the teacher
without rubrics is less objective. Correlation or relationship
between expert assessment system using rubric with the
results of r = 0.82166624 So that both variables have a close
relationship and the form of the relationship is linearly
positive.
Keywords: LMS; Essay Quiz; Nazief dan Adriani Algorithms;
LSA; VidyaNusa; Rubric
I. INTRODUCTION
E-Learning is a system or concept of education that utilizes
information technology in the teaching and learning process. E-
Learning is a learning system that is used as a means for
teaching and learning that is carried out without having to face
to face directly between the teacher and students (Ardiansyah,
2013) [1]. In the concept of e-learning, all teaching and learning
processes can be done online, starting from giving material,
evaluating learning to the results of evaluation. Evaluation is a
process of collecting data to determine how far, in what way,
and how educational objectives have been achieved. If not,
what is not and why (Ralp Tyler (in Arikunto, 2011: 3)) [2].
Learning evaluation is very important for students to know the
understanding of a material. Evaluation of manual evaluation in
the form of a test requires a very long time so that a solution is
needed to minimize the assessment time of the exam results.
Sometimes manual assessment there are several obstacles,
namely an inconsistent assessment between students with one
another even though the answer is almost the same, then
because the writing of each student is different sometimes there
is something that is difficult to read it also makes it difficult for
the teacher to make an assessment, this can reduce the quality
from the teacher's assessment of students' answers sometimes
the study is no longer objective. Objectivity is an honest
attitude, not influenced by personal or group opinions and
considerations in taking decisions or actions. Then at the time
of paper quiz collection sometimes the paper was scattered
which resulted in invaluable student exam papers and it was
very detrimental to students. To overcome these problems, an
essay examination system is needed online. This system will
correct students' answers quickly and precisely and
automatically as well as assessments to be more effective and
efficient because usually used paper that accumulates will
become a pile of garbage.
A. Essay Question
Essay questions are questions used to measure (the goal)
achievement of learning outcomes in complex aspects. And it
is recommended that the test designer measure the ability of test
participants in the form of analysis, organizing and expressing
ideas about something [3]. Also called essay examination is a
tool to evaluate learning outcomes, in the form of written
questions that demand answers: describe, explain, compare,
give reasons, using words and languages themselves or express
ideas through written language [4]
B. Automatic Essay Assessment
Manual essay assessments have several problems, such as
lack of objectivity in assessment, lack of accuracy, tend to take
time [5], to reduce the problem, several automatic essay
assessment systems are proposed, including: essay grader
(PEG) project developed in 1960- [6] But PEG is criticized
because it ignores the semantic aspects of the essay and focuses
more on the structure of the word length, the number of
semicolons or commas, the number of spaces [6] [7]. Then
Intelligent Essay Assessor (IEA) developed by Landauer,
Laham, and Foltz. This IEA system uses a semantic text
analysis method called Latent Semantic Analysis (LSA). IEA

JOURNAL OF INFORMATION TECHNOLOGY AND ITS UTILIZATION, VOLUME 2, ISSUE 1, JUNE-2019:12-17 ISSN 2654-802X
13
was developed in 2001 while LSA itself was developed in 1996
[6]. Furthermore Electronic Essay Rater (E-rater) developed by
Educational Testing Service (ETS) in 1999. E-rate uses natural
Language Processing (NLP). Currently E-rater is used to assess
GMAT essay exams (Postgraduate Admissions Manager Tests)
[6] [7] [8] [9].
C. Stemming
Stemming is the word cutting process to determine the basic
word. The process of stemming this by eliminating all types of
affix (affix).
D. Morphology Word Indonesian
Words in Indonesian can be divided into four types, namely
basic words, repetition words, derivative words, compound
words. Indonesian can be developed into new words or different
meanings by adding affixes according to the language grammar.
There are several types of affixes or affixes in Indonesian
including: prefix, suffix, suffix (confix), insert (infix).
E. Rubric
The rubric is a guide used to assess consistently by the
teacher and can be accounted for the quality of student work.
Rubrics can also be said to be feedback on the quality of student
work.
F. Assessment Formative and Summative
Formative assessment is an assessment process, which is
used to obtain information and learning evidence from students
to plan the next instructional activities. While summative
assessment is an assessment used at the end of the student
learning process.
II. METHOD
Nazief and Adriani algorithms have a high degree of
accuracy in the stemming process compared to other
algorithms. The method used in this study is Latent Semantic
Analysis (LSA This LSA concept will look for similarity values
between two segments of text without regard to word
arrangement. The main function of this LSA is to calculate the
similarity of documents by comparing vector representations of
each document. In the formation of a vector-based term
representation, LSA will form a matrix that represents the
relationship between terms and documents called semantic
space, that is, words and documents that are closely associated
will be placed close to each other represented by vectors [6].
between the sentence and the word algebraic method used is a
singular value decomposition.
III. RESULT AND DISCUSSION
There are many development projects using the Nazief and
Adriani algorithms. Dheru Alam Perkasa, Eki Saputra, S.Kom,
M.Kom, Mona Fronita, S.Kom used Nazief and Adriani
algorithms to develop the Essay Online Examination System
with Assessment using the Latent Semantic Analysis (LSA)
Method. The results of their research between the expected
values and the observed values generated by the difference
system are only 0.04 [10]. Atqia Aulia, Dewi Khairani, and
Nashrul Hakiem. Their research produced a perfect recall score
of 1 and an accuracy of 0.961 [11]. Reina Setiawan, Aditya
Kurniawan, Widodo Budiharto, Iman Herwidiana
Kartowisastro, Harjanto Prabowo. They conducted a study
using 1,704 text documents in the forum by comparing their
approach better than the confix-stripping approach stemming
from Nazief and Adriani [12]. Rahardyan Bisma Setya Putra,
Ema Utami. They modified the Nazief and Adriani algorithm
with Flexible Affix Classification to be able to stem 40 of the
60 non-formal words [13]
In making this application, several supporting devices are
needed including hardware, software and users.
a. Hardware Requirements
This hardware requirement is used at the time of making
the system, the following hardware specifications are used:
1. Processor intel i5-7200U CPU @ 2.50GHz 2.71 GHz
2. RAM 12.0GB
3. 1T hard drive
4. Operating system Windows 10
b. Software requirements
This software requirement is used at the time of making
the system, the following software specifications are used:
1. WebStorm
2. Robo3T
3. Postman
4. Filezilla
5. Command Prompt
6. MEAN (Mongo, Express, Angular, NodeJS)
7. ArgoUML
8. Microsoft Visio 2010
c. User/ Brainware
To support the system that has been created, this system
requires users who are familiar and understand using a
computer.
LMS VidyaNusa is made with several menus for
teachers and students.

JOURNAL OF INFORMATION TECHNOLOGY AND ITS UTILIZATION, VOLUME 2, ISSUE 1, JUNE-2019:12-17 ISSN 2654-802X
14
Figure 1 LMS System
Actor description
1. Guru
Login is the initial step that is done by the teacher or students
to enter the LMS module. In the LMS module, there are two
main menus in the teacher section, namely making a quiz and
uploading material. On the quiz menu the teacher can create a
new quiz or reload the existing quiz. There are two quiz choices,
namely multiple choices and essays. When you have entered the
quiz form the teacher is required to fill out the quiz information
first such as the name of the quiz, the name of the lesson, the
duration of work, time to work and choose the type of quiz to
proceed to the question menu. After entering the menu the
teacher must fill in all available forms, namely the question
form, answer form and value form. After that when students
have taken the quiz, there will be a report containing the weight
of the values received from each student. In the upload material
menu the teacher must also fill in all available forms including
subjects, discussion material, descriptions of the material to be
uploaded and the material documents. After uploading the
material the teacher can also see the material that has been
uploaded on the dashboard menu then the teacher can also
download the material.
2. Siswa
The LMS module on the student side has two main menus,
namely taking a quiz and downloading material. Before
students take the quiz, students are required to log in first, then
students choose the quiz menu to take part in the quiz. Students
will find out the amount of grades obtained after completing the
available quiz. Then besides participating in the quiz, students
can also view and download material that has been uploaded by
the teacher.
Figure 2 Student Flowchart Quiz
In the flowchart, the student's process flow answers the quiz
starting from the login, then the student chooses the quiz that
will be followed. After choosing the quiz, students will work on
the quiz that has been selected if they have finished working on
the student pressing the submit or send answer then the system
will process the student's answer and produce the final grade of
the student.
Quiz essay application is a web-based application. Users of this
application are teachers and students. The teacher will enter the
question, answer key, along with the weight of each question
into the system. Students see and answer questions, the answers
are typed in the form provided. The system will process the
student's answers and match the answer keys that have been
provided, then will calculate the value of the similarity between
the student's answers and the teacher's answers. This process
will go through two stages, namely preprocessing and
correction of answers using the LSA algorithm. After going
through the final score is obtained.
I. Assessment Design Using Nazief and Adriani
Stemming
a. Designing questions and Answers
Question: Apa yang dimaksud dengan kuman
Answer Key: Organisme mikroskopis yang bisa menyebabkan
penyakit dan infeksi bila mereka masuk ke dalam tubuh
Answer:
- Siswa 1: Organisme yang bisa menyebabkan penyakit
dan infeksi pada manusia dan hewan
- Siswa 2: Organisme yang membuat manusia sakit jika
masuk kedalam tumbuh
- Siswa 3: Organisme yang dapat menimbulkan rasa
sakit dan infrksi nagi masnua jika masuk kedalam
tubuh
- Siswa 4: Organisme yang dapat menimbulkan
penyakit bagi manusia jika masuk kedalam tubuh.
b. Processing
After the key answers and answers are implemented, the next
process is the processing process. In the process there are
several stages, namely:
1. Stage of the removal of punctuation marks (stoplist)

JOURNAL OF INFORMATION TECHNOLOGY AND ITS UTILIZATION, VOLUME 2, ISSUE 1, JUNE-2019:12-17 ISSN 2654-802X
15
2. The phase of solving the sentence becomes a fragment of
words (tokenization)
3. Removal of prepositions, links that are not related to the
essence of the sentence (stopword)
4. The word cutting stage becomes the basic word (stemming)
c. Answer Correction
1. Correction of answers or the application of the Latent
Semantic Analysis method is to determine each query,
including the answer key query (Q), query the student
answer (D), and query the combined student answer and
answer key (QS).
2. Weighting the word or TR (term frequency) from the
answer key query (Q), querying the student answer (D),
and querying the combined key of the student's answer
and answer (QS).
3. Form a matrix with Amxn size
4. Calculate the value of the matrix U, S, VT using the
Singular Value Decomposition (SVD) calculation.
Manual calculations can use the matrix calculator found in
the toolmat website http://www.bluebit.gr/matrix-
calculator/calculate.aspx
5. Reduction of k = 2
6. Calculate the key vector answers and answers
The key vector answers with the following formula:
Matrix Q = tf x matrix Uk x matrix Sk
Q = | 1010011010010 | x matrix Uk x matrix Sk
Then the results
Q = 6,296 4,256
The answer vector is obtained from the corresponding column
in the Vt matrix of the SVD results with the following results:
D1 = 0.317 0.916
D2 = 0544 -0.030
D3 = 0.526 -0.376
D4 = 0.572 0.133
7. Calculate CoSim values from each matrix Q and D, with
calculations using the following formula:
CoSim (𝐷𝑛𝑄) =∑ Q𝐷𝑛
|Q||𝐷𝑛|
The CoSim calculation uses the Cosine Similarity
Calculator with a Web address
http://scistatcalc.blogspot.com/2015/11/cosine-similarity-
calculator.html#.
The results of the calculation are as follows:
CoSim (D_1 Q) = 08002
CoSim (D_2 Q) = 0.8284
CoSim (D_3 Q) = 0.3483
CoSim (D_4 Q) = 0.9338
8. Multiply the cosim value by the value weight
In this case the weight of the problem is 100. The results are as
follows:
Value D1 = 80.02 (Student final score 1)
Value of D2 = 82.84 (Student's final grade 2)
Value D3 = 34.83 (Student final score 3)
Value of D4 = 93.38 (Student's final grade 4)
II. Testing Value Validation
The test is done by giving a quiz in the form of essay
questions to students then the teacher assesses manually and
compares the value given by the teacher to the assessment
carried out by the system. The following is an assessment
conducted by the teacher and system:
Question : Apa yang dimaksud dengan merangkum
Answer Key : Kegiatan menyusun gagasan pokok dari
suatu bacaan/ buku menjadi bentuk yang
ringkas atau pendek
Table 1 Testing Value Validation
N
o
Stude
nt Id Answer
Grade
Teach
er
Syste
m
Rubri
c
1 599q menyimpulkan kata
yang pentingnya
saja
10 7.41 6
2 59d2 persingkat uraian
dengan
perbandingan
secara proporsional
8 1.3 5
3 59fw meringkas suatu
paragraf dengan
cara mengambil
poin-poin
pentingnya saja
10 7.32 7
4 5a0z suatu kegiatan yang
mengambil pokok-
pokok suatu tulisan
atau pembicaraan
atau menjadi suatu
uraian yang lebih
singkat dengan
perbandingan
secara proporsional
antara bagian yang
dirangkum dengan
rangkuman
10 3.73 4
5 5a0x mencatat pokok-
pokok teks dan
menyusunnya
menjadi singkat dan
jelas
10 8.23 8
6 5a0c memendekan suatu
paragraf yang
panjang menjadi
lebih pendek
8 2.52 4
7 5a0v mempersingkat
uraian dengan
10 2.52 4

JOURNAL OF INFORMATION TECHNOLOGY AND ITS UTILIZATION, VOLUME 2, ISSUE 1, JUNE-2019:12-17 ISSN 2654-802X
16
N
o
Stude
nt Id Answer
Grade
Teach
er
Syste
m
Rubri
c
perbandingan
secara proporsional
8 5a0b merangkum atau
kegiatan meringkas
yang isinya penting-
penting saja
10 2.54 6
9 5a0n merangkum adalah
mempersingkat
uraian dengan
perbandingan
secara proporsional
10 1.3 4
1
0
5a1s merangkum adalah
suatu tek yang
hanya di ambil
intinya saja, jadi
mengambil yang
pentingnya saja
10 6.91 6
1
1
5a0w merangkum adalah
mengambil inti-inti
dari sebuah teks
yang membuatnya
menjadi lebih
ringkas.
10 9 6
1
2
5a0u merangkum adalah
pengambilan
pokok-pokok
tulisan atau
pembicaraan yang
penting saja
menjadi uraian yang
lebih singkat
10 8.33 9
1
3
5a0 merangkum adalah
menyimpulkan kata
yang pentingnya
saja
10 7.18 7
1
4
5a0m merangkum adalah
menyimpulkan kata
yang pentingnya
saja
10 7.18 7
1
5
5a0s merangkum adalah
kegiatan menyusun
gagasan pokok dari
suatu bacaan / buku
menjadi bentuk
yang ringkas atau
pendek
10 9.47 9
Vulnerable values that are given by the teacher manual system
and assessment are far enough, while assessments that use
rubrics and systems are not far enough. For more details, here
is a comparison chart of assessments given by the teacher,
system, and using rubrics.
Figure 3 Analisys Beween System Assessment, Experts
With Rubrics, and Teacthers without Rubrics
From the diagram above shows that the value given by the
teacher without the vulnerable rubric is 8-10, the value given by
the vulnerable system is 0-10, and the evaluation of the system
with the vulnerable rubric is equal to 0-10. So when viewed
from the function of the rubric on the objectivity of the
assessment, the value given by the teacher without rubrics is
less objective. In the essay quiz assessment, a rubric is needed
to help guide the objective assessment, information on the value
weight, determine student learning strategies. So with the
assessment system, the essay quiz can help the teacher's
assignment for assessment.
III. Discussion
Figure 4 Corelation of System Assessment and using
Rubrics
From the picture, shows that there is a correlation or
relationship between the appraisal system and expert judgment
using a rubric with the results of r = 0.82166624 So that both
variables have a close relationship and the form of the
relationship is linearly positive. When checking the variance
value of the two data, it is found that the value for variance
using the rubric is s2 = 2.98095238 and the variance using the
system is s2 = 8.75746381. From the results of the variance can
be seen the distribution of its value. If the value of variance uses
the rubric s2 = 2.98095238, it means that it is close to the
average value of the student as a whole. Because it is getting
closer to 0, the data is getting more homogeneous and vice
versa. The value of the variance of the system value indicates

JOURNAL OF INFORMATION TECHNOLOGY AND ITS UTILIZATION, VOLUME 2, ISSUE 1, JUNE-2019:12-17 ISSN 2654-802X
17
that the results of system data vary, between students one with
other students. Assessment using this system can be used as a
formative assessment..
IV. CONCLUSION
This system needs further research, because there is still a
considerable difference between the assessment of the system
and the teacher's assessment, for example students get a score
of 10 using a manual assessment by the teacher and get a score
of 1.39 using the assessment by the system, although this
assessment has been assisted by the rubric assessment.
This appraisal system can help teachers, but it still needs
system development that is adding a method that can recognize
the similarity of words with different representations but has the
same meaning.
V. ACKNOWLEDGMENT
This is my thesis project, , I would like to thank Mr. Kokon
Komarudin for his assistance in making assessment rubric and
assessing the student’s quiz using the rubric and Mrs. Wati who
helped in getting a comparison in the assessment of this
system.References
VI. REFERENCES
[1] M. Riyadi, “Pengertian, Karakteristik dan Manfaat E-
Learning,” 17 June 2014. [Online]. Available:
https://www.kajianpustaka.com/2014/06/pengertian-
karaktiristik-dan-manfaat-elearning.html. [Diakses 03
July 2018].
[2] Nurwahyuningsih, “ANALISIS KUALITAS SOAL
TRY OUT ... Bab 2 - 04201244078,” 1 Februari 2013.
[Online]. Available:
http://eprints.uny.ac.id/9672/3/bab%202%20-
%20%2004201244078.pdf -
http://eprints.uny.ac.id/9672/. [Diakses 03 July 2018].
[3] S. Anwar, Penilian Berbasis Kompetensi, Padang: UNP
Press, 2009.
[4] N. Sudjana, Penilaian Hasil Proses Belajar Mengajar,
Bandung: PT. Remaja Rosdakarya, 1991.
[5] A. A. P. Ratna, B. Budiardjo dan D. Hartanto,
“SIMPLE: SISTIM PENILAI ESEI OTOMATIS
UNTUK MENILAI UJIAN,” MAKARA, TEKNOLOGI,
vol. 11, pp. 5- 11, 2007.
[6] Turkish Online Journal of Distance Education-TOJDE,
“Automated Essay Scoring,” Semire DIKLI. Florida
State University Tallahassee, FL, USA, vol. 7, no.
January 2006 ISSN 1302-6488, p. Number: 1 Article: 5,
2006.
[7] A. A. P. Ratna, A. Henry dan A. B. Anantasatya,
“GLSA Based Online Essay Grading System,” dalam
IEEE - TALE, Bali, 2013.
[8] S. D. S. L. T. F. G. a. H. R. Deerwester, “Indexing by
Latent Semantic Analysis,” Journal of the American
Society for Information Science & Landauer, 1990.
[9] J. e. a. Burstein, “Enriching automated essay scoring
using discourse marking. Proceedings of the Workshop
on Discourse Relations and Discourse Marking,” dalam
Annual Meeting of the Association of Computational
Linguistics, Montreal, Canada, 1998.
[10] D. A. Perkasa, Sistem Ujian Online Essay Dengan
Penilaian Menggunakan Latent Semantic Analysis
(LSA) Pada Jurusan Sistem Informasi Universitas Islam
Negeri Sultan Syarik Kasim Riau, Riau: Fakultas Sains
dan Teknologi. UIN Suska, 2014.
[11] A. A. , D. K. dan N. H. , “Development of a Retrieval
System for Al Hadith in Bahasa (Case Study: Hadith
Bukhari),” dalam 5th International Conference on
Cyber and IT Service Management (CITSM), Denpasar,
pp. 1-5, 2017.
[12] K. A. B. W. K. I. H. P. H. S. Reina, “Flexible Affix
Classification for Stemming Indonesian Language,”
dalam Internasional Conference IEEE, 2016.
[13] P. R. B. S. U. Ema, “Non-formal Affixed Word
Stemming in Indonesian Language,” dalam
International Conference on Information and
Communications Technology (ICOIACT), Yogyakarta,
2018.
[14] R. B. Aji, “Automatic Essay Grading System
Menggunakan Metode Latent Semantic Analysis,”
dalam Seminar Nasional Aplikasi Teknologi Informasi
2011 (SNATI 2011), Yogyakarta 17-19 Juni 2011, 2011.

JOURNAL OF INFORMATION TECHNOLOGY AND ITS UTILIZATION, VOLUME 2, ISSUE 1, JUNE-2019:18-23 ISSN 2654-802X
18
BENCHMARKING MYSQL AND NOSQL DATABASE ON EGOVBENCH
APPLICATION
Nur Aini Rakhmawati, Muhammad Zuhri, Radityo Prasetianto Wibowo, Anwar Romadhon, Herdy
Ardiansyah, Olive Khoirul
Departement of Information Systems, Institut Teknologi Sepuluh Nopember
Jalan Raya ITS, Keputih, Sukolilo, Kota Surabaya, [email protected], [email protected],
[email protected], [email protected], [email protected],
Abstract-- Egovbench application monitors websites or
social media of Indonesia local governments daily. The
process of crawling done by Egovbench produces extensive
data, which reduced performance in the data processing.
Therefore, there is a need for a database solution that has
the best performance such as high processing speed and
small database size. This study examined the comparison
between relational databases and non-relational databases
based on selected metrics to obtain the most suitable
database solution for Egovbench. The results show that the
MySQL database has the advantage of complex query
processing and the use of the database with the smallest
storage space. MongoDB database has the advantage of low
data transfer volumes. Couchbase database has the
advantage of short and straightforward query processing
with a high number. The evaluation results show that
MySQL is more suitable for Egovbench needs, which is the
best response time and query per second. MySQL
outperformed the other two databases on backup and
storage file sizes testing.
Keywords: benchmark, database, crawling, E-government
I. INTRODUCTION
In recent decades, there has been a revolution in computing
and communication, with the indications that technological
advances and the use of information technology[1]. The internet
is the place for the development and use of information
resources that include a sea of global information [2]. For
billions of people around the world, the internet has become an
essential component of their daily social and business life [3].
Based on a survey conducted by the Indonesian Internet Service
Providers Association (APJII), in 2016 there were 132.7 million
Indonesians who had used the internet. With a total population
of 256.2 million people, more than 52% of Indonesia's
population is connected to the internet [4]. With the breadth of
the field of information technology, the world moves from the
industrial age to the information age. The manifestation of this
transformation and the emergence of transitions of terms and
concepts have become part of everyday life. The economic field
emerged ideas such as E-commerce, E-business, and electronic
money, while in the area of public sector appeared the concept
of E-government [5]. E-Government is defined as a way for
governments to use the most innovative information and
communication technology, especially web-based internet
applications, that provides citizens and businesses with easier
access to information and government services, to improve
service quality and to provide more significant opportunities for
participating in democratic institutions and processes [6].
E-government services can be provided through several
media, such as websites and social media. Based on the various
E-government media, there are differences in quality so that the
assessment of different data models is needed to provide a level
of consistency, availability, and efficiency in measuring this E-
government service using the Egovbench application.
Egovbench (E-government benchmarking) is an application
that is used to assess, compare and rank websites and social
media owned by local governments[7]. Egovbench assessed
whether the website and social media were indeed used as E-
Government media that served the community or not.
Egovbench is used to determine the quality, performance, and
quality of official government social media sites and media.
Egovbench crawler obtains information from existing
websites or social media. This crawling generates very large
data. As a result, it might decrease performance in the data
processing. The development of database technology in the last
few years has become popular with the presence of non-
relational or NoSQL database technology. The NoSQL
database appears as a new data management system for
managing and processing large volumes of data in an efficient
manner [8]. Many companies integrate both databases; users
interact with Relational Database (RDB) to handle small scale
data, NoSQL databases function as a back-end system for data
analysis. NoSQL databases process large volumes of data and
produce results in real time such as the analysis of millions of
tweets [9]. Unlike the database in general, NoSQL follows
different data models and provides a level of consistency,
availability, and efficiency.
This research is intended to find out the database
performance as the Egovbench storage. We compare MySQL
databases, MongoDB, and Couchbase by using four metrics:
the response time metrics, query throughput, storage size, and
volume of data transfers. Data used for benchmarking is data
from social media crawling and government websites. By
comparing existing databases, it can be seen how to store

JOURNAL OF INFORMATION TECHNOLOGY AND ITS UTILIZATION, VOLUME 2, ISSUE 1, JUNE-2019:18-23 ISSN 2654-802X
19
Egovbench data using those three databases. In addition, it can
determine the relevance of performance metrics in data
processing and can compare performance in Egovbench data
processing. By measuring the performance of the database used
and conducting website and social ranking of E-government
media, it can find out which performance of E-government
services are good and which E-government services still need
to be improved to provide the best service to the public through
the internet.
A. Egovbench
Based on the 2014 United Nations E-Government Survey,
the definition of E-Government or Electronic Government is
the use of information technology and its application by the
government to provide information and public services to the
public [11]. The Egovbench system currently stored data in the
form of documents from content that has been crawled by
Egovbench. Data storage is divided into two parts, namely
social media data and government website data. Egovebench is
an application that is useful for assessing, comparing and
ranking e-government websites and government social media.
The assessment criteria are:
1. The website must follow the President Instruction Number
3 the Year 2003
2. Website availability
3. Website Update Frequency
4. Social Media availability (Facebook, Twitter, Youtube)
5. Social Media Updates Frequency
B. NoSQL Database
NoSQL or Not only SQL or Non-SQL Databases are terms
used for formless database types. The NoSQL database follows
different data models and provides a level of consistency,
availability, and efficiency [9]. Although there are many
NoSQL databases on the market, various industry trends show
that the top three used today are MongoDB, Apache Cassandra,
and HBase [13]. The characteristics below distinguish NoSQL
from RDB or Relational Database [14]. NoSQL generally has
the following features:
6. Schema-free
7. Easy replication support
8. Simple API
9. Consistent / BASE
MongoDB is a schema-free document-based database
written in C ++ and developed open-source. The primary
purpose of MongoDB is to close the gap between fast and
highly scalable key-/ value-stores and feature-rich traditional
RDBMS. MongoDB has better scalability, meaning MongoDB
can connect and utilize multiple devices while managing data
[12]. MongoDB databases can provide faster results because
MongoDB supports nested documents. By querying the
document ID, all documents can be given. In contrary to the
relational database, to obtain all the contents of the database a
query is needed that involves several tables because they are
interrelated.
Couchbase or Membase is a schema-less and document-
oriented NoSQL database system and supports zero document
storage in JSON format. Couchbase is intended to run in
memory and use as many database nodes as possible to store
datasets in RAM before they are written to disk[17].
C. Database benchmarking
The database system contributes enormously to the proper and
efficient organizational functions and business information
[15]. Therefore, choosing the right database with the right
features is often a critical decision. Benchmarking is called the
process of evaluating a system for the performance of the
system. Benchmark is a process to measure performance using
specific indicators that produce a value that will be used as a
comparison with other objects[16]. The benchmark
performance of MongoDB is slightly under Couchbase. The
latency of MongoDB increases when additional database
servers are performed[13].
Yunhua Gu et al. [12] describes how the type of NoSQL
database, namely MongoDB acts as a data storage media in the
web crawling process. The purpose of the study was to
determine the performance and characteristics of the NoSQL
database, especially the MongoDB database. The results
obtained from the study show that the MongoDB database does
not have the same schemes found in the relational database. In
the MongoDB database, there is also no need to specify the
number of columns and rows to store data and the absence of a
foreign key. Therefore, MongoDB has a more flexible structure.
For queries performed can provide faster results because it
supports layered or nested documents. By querying the
document ID, all the contents of the document can be returned,
whereas in the relational database to obtain all the contents of
the database a query that involves several tables is needed. On
a very large amount of data (above 50 GB), the difference in
MongoDB access speed can be up to 10 times faster than the
relational database. Also, MongoDB has better scalability, it
means that MongoDB can connect and utilize multiple devices
while storing and managing data. Yunhua Gu's research has a
relationship with this research because it discusses the
performance and characteristics of MongoDB in the web
crawling process.
Datastax Corporation [13] did a benchmarking the Amazon
Web Services EC2 platform by testing using the Cassandra,
Couchbase, HBase, and MongoDB databases. The results
obtained were that almost all MongoDB performance
benchmarks were slightly under Couchbase and latency in
MongoDB increased sharply when adding servers to the
database.
Joao Ricardo Lourenco, et al. [18] conducted a quality
comparison of some of the popular NoSQL databases,
Aerospike, Cassandra, Couchbase, CouchDB, HBase,
MongoDB, using quality attributes that are measurement
parameters, namely Availability, Consistency, Durability,
Maintainability, Read & Write Performance, Recovery Time,
Reliability, Robustness, Scalability, and Stabilization Time.
With the aim to determine the performance of the NoSQL
database when measured using several predetermined
parameters. The results obtained are that Couchbase is superior
in availability, scalability, stabilization time and write-
performance when compared with MongoDB which excels in
consistency, recovery time, and reliability. The study of Joao

JOURNAL OF INFORMATION TECHNOLOGY AND ITS UTILIZATION, VOLUME 2, ISSUE 1, JUNE-2019:18-23 ISSN 2654-802X
20
Ricardo Lourenco has a relationship with this research because
it discusses the measurement of performance of Couchbase and
MongoDB. Comparison between NoSQL Databases can be
seen in Table 1.
Paper AUTHORS Database
Benchmarking Top
NoSQL Databases
End Point
Corporation
(2013)
Cassandra,
Couchbase,
HBase,
MongoDB
Choosing the right
NoSQL database
for the job: a
quality attribute
evaluation
Joao Ricardo
Lourenc¸o,
Bruno Cabral,
Paulo Carreiro,
Marco ˜
Vieira, and Jorge
Bernardino
(2015)
Aerospike
Cassandra
Couchbase
CouchDB
HBase
MongoDB
Voldemort
Application of
NoSQL Database
in Web
Crawling
GU Yunhua,
SHEN Shu,
ZHENG
Guansheng
(2011)
MongoDB
II. METHOD
A. Benchmark Metrics
The performance metrics used in this benchmarking are
explained as follows:
a) Storage size (bytes): to find out how much storage space is
needed for each database (DBMS) for the same data type.
b) Query per second (Query/second): to determine the level
of query throughput that can be served by the database in
units of time. We run a set of queries repeatedly and
measure the average difference when running a single
query.
c) Response time (second): to find out the average time
needed to run a single query.
d) Volume data transfer (bytes): to determine the bandwidth
capacity that can be transferred to the related database.
B. Benchmark Database Configuration
There are several tables that are used on the Egovbench
service, i.e. result_sosmed, content, local government (pemda),
and list of website URLs (Daftar link). The database schema
can be seen in Figure 1.
The three databases tested have several different
characteristics of how to store data because there are differences
in structure and features. One of the differences can be seen in
Table 2. TABLE 2. DIFFERENCES IN TERMINOLOGY BETWEEN DATABASES
Terminologi MySQL MongoDB Couchbase
Database Database Database Bucket
Table Table Collection Bucket
Column Column Field Field
Row Row Document Document
In general, the data used consists of 4 parts, namely:
1. The social media result table has 26 data fields such as
date, regional ID, FB day count, FB content count, etc.
This data is used to store the results of local
government social media assessments conducted on
the Egovbench application
2. Pemda table has seven data fields such as URL, type,
FB id, etc. This table is used to keep a list of local
government names, local government web addresses,
local government types, and social media Facebook
Facebook,
3. The content table has 4 data fields, namely: regional
government id, criteria, documents, and URL. This
table is used to store crawling data from local
government web content based on predetermined
criteria
The Daftar link table has two data fields, namely: local
government id and URL link. This section is used to store a list
of URLs that have been successfully crawled from the local
government web
Fig. 1. Database Schema
C. Set of Evaluation Queries
The queries used in the benchmark are divided into two
operations:
1. Query Select data from the Egovbench database that
has been filled
2. Query Insert / Restore data from the database backup
Five queries were selected from the Egovbench application.

JOURNAL OF INFORMATION TECHNOLOGY AND ITS UTILIZATION, VOLUME 2, ISSUE 1, JUNE-2019:18-23 ISSN 2654-802X
21
The selected queries are queries that often appear in the
application. Moreover, we choose simple queries and complex
queries. The comparison of the five queries can be seen in Table
3. TABLE 3. COMPARISON OF THE FIVE QUERIES
Query Tabel Jumlah
Kolom Keywords Operator
1 pemda 2 - = (equal to)
2 result
sosmed 2
ROUND,
AS,
ORDER BY,
LIMIT
* (multiplication)
+ (addition)
= (equal to)
3 result
sosmed 2 ORDER BY
>(greater than)
= (equal to)
AND
4 konten 4 - = (equal to)
AND
5 daftar
link 2 ORDER BY = (equal to)
MySQL queries: 1. SELECT id_pemda, url FROM ‘pemda‘ WHERE id_pemda=275
2. SELECT id_pemda, ROUND( ((((nilai_fb_day
*52.7794746487477)+(nilai_fb_konten
*23.7018937080024)+(nilai_fb_fan*23.5186316432498)
)*0.35284139100933) +(((nilai_tw_day
*36.5019011406844)+(nilai_tw_konten
*16.3920574566962)+(nilai_tw_tweet
*30.8407266582172)+(nilai_tw_follower
*16.2653147444022))*0.33587786259542) +(((
nilai_yt_day*42.8571428571429)+(nilai_yt_konten
*19.2460317460317)+(nilai_yt_view
*18.7996031746032)+(nilai_yt_subscriber
*19.0972222222222))*0.31128074639525)) ,2) AS totalscore
FROM ‘result_sosmed‘ WHERE date =’2017-06-14’ ORDER
BY totalscore DESC LIMIT 10
3. SELECT id_pemda, tw_tweet_count FROM ‘result_sosmed‘
WHERE tw_tweet_count>0 AND date=’2017-06-14’ ORDER
BY tw_tweet_count DESC
4. SELECT id_pemda, kriteria, dokumen, url FROM ‘konten‘
WHERE id_pemda=170 AND kriteria=’sejarah’
5. SELECT id_pemda, link_url FROM ‘daftar_link‘ WHERE
id_pemda=162 ORDER BY link_url ASC
MongoDB Queries: 1. db.pemda.find({ "id_pemda": 275 }, { "id_pemda": 1, "
url": 1 })
2. db.result_sosmed.aggregate([ { $match: {"date": "2017-06-
14"} }, { $project: { "id_pemda": 1, " totalscore": { $add: [ {
$multiply: [{ $add: [{ $multiply: ["$nilai_fb_day",
52.7794746487477] }, { $multiply: ["$nilai_fb_konten",
23.7018937080024] }, { $multiply: ["$nilai_fb_fan ",
23.5186316432498] }] }, 0.35284139100933] }, { $multiply: [{
$add: [{ $multiply: ["$nilai_tw_day ", 36.5019011406844] }, {
$multiply: [" $nilai_tw_konten", 16.3920574566962] }, {
$multiply: ["$nilai_tw_tweet", 30.8407266582172] }, {
$multiply: ["$nilai_tw_follower", 16.2653147444022] }] },
0.33587786259542] }, { $multiply: [{ $add: [{ $multiply:
["$nilai_yt_day ", 42.8571428571429] }, { $multiply: ["
$nilai_yt_konten", 19.2460317460317] }, { $multiply:
["$nilai_yt_view", 18.7996031746032] }, { $multiply:
["$nilai_yt_subscriber", 19.0972222222222] }] },
0.31128074639525] }, ] } } }, { $sort: { "totalscore": -1 } }, {
$limit: 10 }, { $project: { "id_pemda": 1, "totalscore": {
$subtract: ["$totalscore", { $divide: [{ $mod: [{ $multiply:
["$totalscore", 100] }, 1] }, 100] }] } } } ])
3. db.result_sosmed.find({ "$and": [ { "tw_tweet_count": { "$gt":
0 } }, { "date": "2017-06-14" } ] } , { " _id": 0, "id_pemda": 1,
"tw_tweet_count": 1 }). sort({ "tw_tweet_count": -1 })
4. db.konten.find({ "$and": [ { "id_pemda": 170 }, { " kriteria":
"sejarah" } ] } , { "_id": 0, "id_pemda ": 1, "kriteria": 1,
"dokumen": 1, "url": 1 })
5. db.daftar_link.find({ "id_pemda": 162 } , { "_id": 0, "id_pemda":
1, "link_url": 1 }).sort({ "link_url": 1 })
Couchbase Query 1. SELECT id_pemda, url FROM ‘pemda‘ WHEREid_pemda=275
2. SELECT id_pemda, ROUND(((((nilai_fb_day
*52.7794746487477)+(nilai_fb_konten
*23.7018937080024)+(nilai_fb_fan*23.5186316432498)
)*0.35284139100933) +(((nilai_tw_day
*36.5019011406844)+(nilai_tw_konten
*16.3920574566962)+(nilai_tw_tweet
*30.8407266582172)+(nilai_tw_follower
*16.2653147444022))*0.33587786259542) +(((
nilai_yt_day*42.8571428571429)+(nilai_yt_konten
*19.2460317460317)+(nilai_yt_view
*18.7996031746032)+(nilai_yt_subscriber
*19.0972222222222))*0.31128074639525)) ,2) AS totalscore
FROM ‘result_sosmed‘ WHERE date=\"Jun 14, 2017\" ORDER
BY totalscore DESC LIMIT 10
3. SELECT id_pemda, tw_tweet_count FROM ‘result_sosmed‘
WHERE tw_tweet_count>0 AND date=’Jun 14, 2017’
ORDER BY tw_tweet_count DESC
4. SELECT id_pemda, kriteria, dokumen, url FROM ‘konten‘
WHERE id_pemda=170 AND kriteria=’sejarah’
5. SELECT id_pemda, link_url FROM ‘daftar_link‘ WHERE
id_pemda=162 ORDER BY link_url
D. Evaluation Scenario
The evaluation steps are as follows:
1. Backing up the database into a file
2. Measuring the size of the backup restore database file from
a file calculation of storage used in the database
3. Capturing data packets to calculate the volume of data used
by query transactions
4. Running the five queries that have been determined each -
100 times
For each query calculated the time needed to run the query
100 times, the average time needed to run 1 query, and the
average query per second.
III. RESULTS AND DISCUSSION
The results of testing the MySQL database, MongoDB,
Couchbase are divided into four metrics, including response
time, throughput, backup and storage, volume.
The smaller the value of response time, the better the
performance because a low response time means that the
database can respond to queries given faster. Table 4 shows a
comparison of the average response time queries
(milliseconds). Couchbase outperforms the other two databases
in query 1 and 5 but slower in query 2 and 3 compared to other
databases. Couchbase is superior because the nature of the
Couchbase database is more memory-centric and more memory

JOURNAL OF INFORMATION TECHNOLOGY AND ITS UTILIZATION, VOLUME 2, ISSUE 1, JUNE-2019:18-23 ISSN 2654-802X
22
additions greatly help Couchbase's performance, queries 1 and
5 have more simple characteristics than queries 2, 3 and 4.
MySQL and MongoDB have almost consistent results in every
query. MySQL outperforms MongoDB in each query. TABLE 4. COMPARISON OF THE AVERAGE RESPONSE TIME QUERY
(MILLISECONDS)
Query MySQL MongoDB Couchbase
1 23.99 57.10 22.73
2 27.27 73.93 896.57
3 24.86 74.06 910.41
4 26.17 73.00 32.00
5 24.67 58.10 20.12
The higher the value of query throughput, the better
performance because a massive throughput means the database
can handle many queries in one second. Table 5 shows a
comparison of the average query value per second. Again,
Couchbase outperforms the other two databases in query 1 and
5. TABLE 5. COMPARISON OF AVERAGE QUERY VALUES PER SECOND.
Query MySQL MongoDB Couchbase
1 41.68 17.51 43.99
2 36.67 13.53 1.16
3 40.23 13.50 1.10
4 38.21 13.70 31.25
5 40.53 17.21 49.69
The smaller the value of file size, the better the performance
because the small value means that the database can store more
data in the same size of storage. Table 6 shows a comparison of
the size of the backup and storage files (MB). MySQL
outperformed the other two databases in terms of backup files
and total database storage. MySQL storage can be smaller
because MySQL only converts all data into tabular text and in
the query form and stores it in one .sql file whose size is smaller.
MongoDB and Couchbase databases store in JSON or BSON
(Binary JSON). Moreover, they store for each collection or
bucket in different files and folders including metadata
information in a separate file. Therefore, the total size of the
used file is higher than MySQL. TABLE 6. COMPARISON OF BACKUP AND STORAGE FILE SIZE (MB).
MySQL MongoDB Couchbase
Backup
result file
44.77 186.57 96.84
Database
storage
size
89.75 310.24 167.48
Table 7 shows a comparison of the volume of TCP data
(MB). MongoDB has a slightly better value than MySQL
because the output queries of MongoDB are in JSON forms that
are shorter than tables generated by MySQL. The Couchbase
database uses the most significant volume of data compared to
the other two databases because the output generated by
Couchbase is JSON which is longer than MongoDB. Besides,
the output of the Couchbase contains more metadata. TABLE 7. TCP DATA VOLUME COMPARISON (MB)
MySQL MongoDB Couchbase
Volume data 4.39 4.27 6.12
IV. CONCLUSION
Based on the results of tests conducted on MySQL
databases, MongoDB and Couchbase which are divided into
four metrics, including response time, throughput, backup and
storage, volume, can be summarized in Table 8. The more star
(*) the more preferred database. TABLE 8. BENCHMARK RESULTS OF FOUR MYSQL, MONGODB, AND
COUCHBASE DATABASE PERFORMANCE METRICS ON THE EGOVBENCH WEB
Database Response Time Throughput Storage Size Volume
Data
MySQL *** *** *** **
MongoDB * * * ***
Couchbase ** ** ** *
MySQL database has advantages in query processing.
MySQL provides fast response time, the highest query per
second, and the smallest storage. MongoDB has advantages in
the size of the volume of data queries because it can use fewer
network resources in processing queries. Couchbase integrates
MySQL and MongoDB databases in terms of measuring
response time and throughput metrics in queries 1 and 5. Based
on the results of tests that have been carried out, the
recommended database for Egovbench is MySQL because it
has the best response time and query per second among other
databases which is more suitable for Egovbench's service needs.
This research has been attempted and carried out by
scientific procedures, but still has flaws, namely:
• This study consists of four metrics, namely response time,
throughput, backup and storage, volume. Therefore, it is
necessary to consider other metrics and more varied
configurations such as indexes on non-relational databases.
• This research is only done on queries 1 to query 5
V. ACKNOWLEDGMENT
We would like to thank the Departement of Information
Systems, Institut Teknologi Sepuluh Nopember who have
helped carry out this research in terms of funding
VI. REFERENCES
[1] B. Shaqiri, "Impact of Information Technology and
Internet in Businesses," Academic Journal of Business,
Administration, Law and Social Sciences, vol. 1, p. 1,
2015.
[2] Bughin et. al, "The impact of Internet technologies:
Search," McKinsey Company, 2011.
[3] APJII, "Asosiasi Penyelenggara Jasa Internet Indonesia.
Penetrasi & Perilaku Pengguna Internet Indonesia.
Asosiasi Penyelenggara Jasa Internet Indonesia (APJII),"
APJII, 2016.
[4] A. Almarabeh.T. , "A General Framework for E-
Government: Definition Maturity Challenges,
Opportunities, and Success," European Journal of
Scientific Research ISSN 1450-216X, vol. 39 No. 1, no. 29-
42, p. 1, 2010.
[5] J. Fang, J. Wu and W. Tian, "On the Relationship between
Internet and Traditional Communication Industry," pp. 1-6,
2017.
[6] Z. Fang, E-Government in Digital Era: Concept, Practice,
and Development, 2002.

JOURNAL OF INFORMATION TECHNOLOGY AND ITS UTILIZATION, VOLUME 2, ISSUE 1, JUNE-2019:18-23 ISSN 2654-802X
23
[7] L. A. ITS, "Egov Bench [Online]," [Online]. Available:
http://egovbench.addi.is.its.ac.id.
[8] Y. T. Z. J. L. C. H. C. S. C. H. C. H. C. W. …. C. Y. C.
Liao, "Data adapter for querying and transformation
between SQL and NoSQL database," Future Generation
Computer Systems, 2016, p. 111–121.
[9] M. T. Y. M. T. J. &. C. R. González-Aparicio, "Testing of
transactional services in NoSQL key-value databases.," 80,
384–399, Future Generation Computer Systems, 2018.
[10] R. G. G. P. A. O. C. Győrödi, "A comparative study:
MongoDB vs. MySQL"," in 13th International Conference
on Engineering of Modern Electric Systems (EMES), page.
1-6, ISBN 978-1-4799-7650-8, Oradea, Romania, 2015.
[11] O. d. N. Unidas., "E-Government Survey: e-Government
for the Future We Want.," https://doi.org/10.1016/S1369-
7021(02)00629-6, United Nations, 2014.
[12] S. S. a. G. Z. Yunhua Gu, "Application of NoSQL
database in web crawling," International Journal of
Digital Content Technology and its Applications, vol. 5,
no. 6, p. 261–266, 2011.
[13] Z. Majkic, "Intensional RDB Manifesto: a Unifying
NewSQL Model for Flexible Big Data," 2014. [Online].
Available: http://arxiv.org/abs/1403.0017.
[14] S. &. N. G. Gupta, "Efficient Query Analysis and
Performance Evaluation of the NoSQL Data Store for Big
Data. In Proceedings of the First International Conference
on Computational Intelligence and Informatics," in In
Proceedings of the First International Conference on
Computational Intelligence and Informatics (pp. 549-558),
Singapore, 2017.
[15] R. M. Fifer, "Cost benchmarking functions in the value
chain," Planning Review 17(3):18–19, 1989.
[16] P. E. I. F. S. G. P. H. A. H. A. …. a. C.-M. P. E. I. F. S. G.
P. H. A. H. A. …. a. M. W. (. W. (. Cudr´e-Mauroux1,
"NoSQL database for RDF: An Empirical Evaluation,
310–311.," Retrieved from
http://ribs.csres.utexas.edu/nosqlrdf/nosqlrdf_iswc2013.pdf
, 2013.
[17] J. R. C. B. C. P. V. M. &. B. J. Lourenço, "Choosing the
right NoSQL database for the job: a quality attribute
evaluation. Journal of Big Data, 2(1)," 2(1), 1–26.
https://doi.org/10.1186/s40537-015-0025-, 2015.

JOURNAL OF INFORMATION TECHNOLOGY AND ITS UTILIZATION, VOLUME 2, ISSUE 1, JUNE-2019:24-28 ISSN 2654-802X
24
SCHEDULING USING GENETIC ALGORITHM AND ROULETTE WHEEL
SELECTION METHOD CONSIDERING LECTURER TIME
Herman1, Lukman Syafie2, Irawati3, Lilis Nur hayati4, Harlinda5
Computer Science Dept. Universitas Muslim Indonesia, Indonesia
[email protected], [email protected], [email protected], [email protected],
Abstract—Scheduling lectures is not something easy,
considering many factors that must be considered. The
factors that must be considered are the courses that will be
held, the space available, the lecturers, the suitability of the
credits with the duration of courses, the availability of
lecturers' time, and so on. One algorithm in the field of
computer science that can be used in lecture scheduling
automation is Genetic Algorithms. Genetic Algorithms can
provide the best solution from several solutions in handling
scheduling problems and the selksi method used is roulette
wheel. This study produces a scheduling system that can
work automatically or independently which can produce
optimal lecture schedules by applying Genetic Algorithms.
Based on the results of testing, the resulting system can
schedule lectures correctly and consider the time of
lecturers. In this study, the roulette wheel selection method
was more effective in producing the best individuals than
the rank selection method.
Keywords: Scheduling; Genetic algorithms; Roulette wheel
I. INTRODUCTION
The scheduling process involves lecture, lecturers, time and
day slots, and lecture rooms. In addition to these factors, in the
scheduling of lectures it is also necessary to pay attention to the
suitability between course credits with the length of lecture time
and the availability of lecturers' time in teaching. Space
management or in this case is scheduling education institutions
more difficult compared to other institutions. Therefore the
management of space and facilities in an organization is
important and must be handled efficiently [1].
In a previous study conducted by [2], the factors that have
been written into consideration in the process of making a class
schedule. The application generated from the study scheduling
lectures automatically and producing class schedules according
to the factors under consideration. However, the resulting
schedule has not been efficient from the lecturer side because it
cannot make time requests. This certainly makes the lecturer a
difficulty, especially lecturers who have positions, given the
lecturers' busy life in addition to teaching time. The conclusions
from the study also showed that the selection method used was
ineffective which resulted in repeated scheduling processes. On
this basis, the authors conducted research scheduling lecture by
considering the lecturer time and making improvements to the
selection method.
In this study, the authors used Genetic Algorithms. This is
based on [3] which states that Genetic Algorithms have good
resistance, not only can solve scheduling problems but also can
provide satisfactory results. According to [3], Genetic
Algorithms have speed in carrying out calculations.
Regarding efficiency issues in scheduling, several
researchers have conducted research using Genetic Algorithms.
Kurniawan et al. [4] used Genetic Algorithms in scheduling the
use of parallel machines to minimize costs, one of which was
electricity costs. The resulting schedule was improved by a
mechanism of work delays that shifted work to other periods to
avoid high electricity costs. The same is done by [5], which uses
Genetic Algorithms to perform parallel machine scheduling
with the aim of optimizing energy consumption in iron and steel
mills. The same was done by [6], where in his research applied
Genetic Algorithms to solve the problem of scheduling bus
vehicles in urban areas.
In this study a selection method using roulette wheel was
used. This is based on research conducted by [4] which is able
to produce individuals or solutions to parallel machine
scheduling with electricity cost efficiency. The roulette wheel
method can retain individuals or the best solution when
selecting from several solutions.
II. METHOD
The system built in this study consisted of 2 parts of the
scheduling process, namely scheduling the theoretical subjects
and scheduling the lab lecture. The first step is to schedule a
theoretical lecture and then proceed with scheduling the lab
lecture. The description of the system, shown in Figure 1.
Separation of the scheduling process of the theoretical and lab
lecture is done to get the student's schedule in the lab course
which is not collision with the theoretical class schedule. Before
conducting the scheduling process, first the data collection
process or inputting the data needed in the lecture scheduling
process, where this has been discussed in previous research.
The last part of the system design is Output. After the
scheduling process is done, the best schedule generated from
the Genetic Algorithm is stored in the database. The best
schedules stored on the database can be displayed on the
monitor screen.

JOURNAL OF INFORMATION TECHNOLOGY AND ITS UTILIZATION, VOLUME 2, ISSUE 1, JUNE-2019:24-28 ISSN 2654-802X
26
Fig. 1. Flow of lecture scheduling system
The process of scheduling lectures on the system built consists
of several processes, namely: data retrieval process,
initialization process, fitness value evaluation process, selection
process based on fitness value, crossover process, mutation
process, and the last is storing scheduling results in the database
. To get the fitness value used equation (1).
𝑓𝑖𝑡𝑛𝑒𝑠𝑠(𝑖) =1
1+𝑛𝑜_𝑐𝑜𝑙𝑙𝑖𝑠𝑖𝑜𝑛𝑠 (1)
After the fitness value is obtained for each individual, then the
next is the selection process using the Roulette Wheel Selection
method. For example, suppose that in one population there are
5 individuals with each having a fitness value of f (1) = 0.4, f
(2) = 0.1, f (3) = 0.16, f (4) = 0.6, and f (5) = 0.5, so the total
fitness value is 1.76.
Individual probabilities obtained p [1] = 0.23, p [2] = 0.057, p
[3] = 0.091, p [4] = 0.34, and p [5] = 0.28. Next is to generate
random numbers [0,1] to get individuals as parents in the next
generation. Large probability values have a great opportunity to
be chosen as the parent of the next generation. An overview of
the opportunities of each individual is shown in Figure 2.
Fig. 2. Opportunities for each individual
For example random numbers generated are 0.81, 0.32, 0.01,
0.42 and 0.65. based on random values generated, the selected
individuals are individuals 5, 3, 1, 4, and individuals 4.
Illustrations of determining individuals based on random values
are shown in Figure 3.
Fig. 3. Illustration of individual selection
III. RESULT AND DISCUSSION
Testing of Genetic Algorithms in the lecture scheduling
system is done with 2 approaches. The approach in question is
testing of the results of scheduling by paying attention to the
lecturer, and the second is testing from the side of the selection
method used.
To streamline the lecture process, departments will usually
ask lecturers, especially lecturers who have busy activities such
as lecturers who have positions or are placed in certain units /
institutions to determine the days and hours that are not used for
teaching. In the system created, the menu / interface for the
availability of lecturers' time and choosing the name of the
lecturer and unwanted days and hours are provided. For
example, a lecturer named Herman could not teach on Thursday
and Tuesday from 10 to 12:00. Figure 4 shows the scheduling
results that did not provide teaching schedules to Herman's
lecturers on Thursday and Tuesday at 10 to 12.
Fig. 4. Schedule results for Thursday
Figure 5 displays the results of Tuesday's scheduling. The
schedule also displays the schedule of Herman's lecturers not
seen Tuesday at 10 to 12
When looking at Figures 4 and 5, it can be seen that the
scheduling process immediately schedules the theoretical
courses and practical subjects. This gives a good impact on
student class schedules because usually in the Departement, the
scheduling of theory and practicum lecture is carried out
separately which results in a schedule of theoretical and
practical collisions and this can harm students..
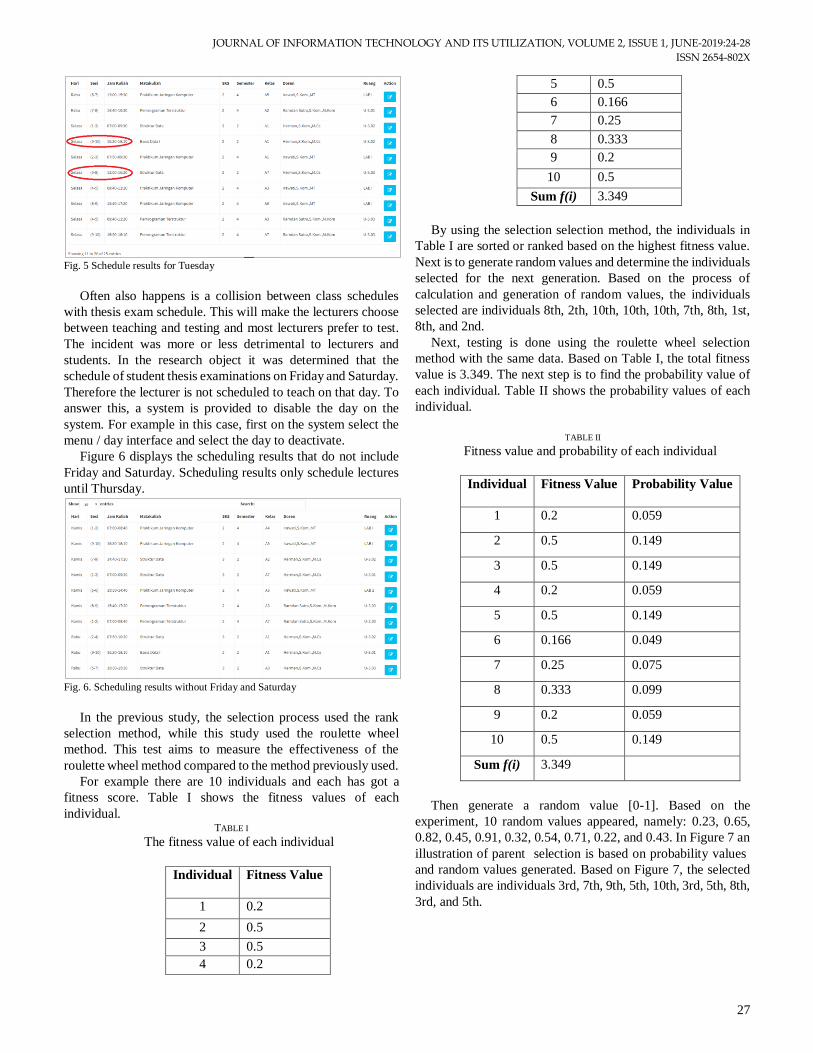
JOURNAL OF INFORMATION TECHNOLOGY AND ITS UTILIZATION, VOLUME 2, ISSUE 1, JUNE-2019:24-28 ISSN 2654-802X
27
Fig. 5 Schedule results for Tuesday
Often also happens is a collision between class schedules
with thesis exam schedule. This will make the lecturers choose
between teaching and testing and most lecturers prefer to test.
The incident was more or less detrimental to lecturers and
students. In the research object it was determined that the
schedule of student thesis examinations on Friday and Saturday.
Therefore the lecturer is not scheduled to teach on that day. To
answer this, a system is provided to disable the day on the
system. For example in this case, first on the system select the
menu / day interface and select the day to deactivate.
Figure 6 displays the scheduling results that do not include
Friday and Saturday. Scheduling results only schedule lectures
until Thursday.
Fig. 6. Scheduling results without Friday and Saturday
In the previous study, the selection process used the rank
selection method, while this study used the roulette wheel
method. This test aims to measure the effectiveness of the
roulette wheel method compared to the method previously used.
For example there are 10 individuals and each has got a
fitness score. Table I shows the fitness values of each
individual. TABLE I
The fitness value of each individual
Individual Fitness Value
1 0.2
2 0.5
3 0.5
4 0.2
5 0.5
6 0.166
7 0.25
8 0.333
9 0.2
10 0.5
Sum f(i) 3.349
By using the selection selection method, the individuals in
Table I are sorted or ranked based on the highest fitness value.
Next is to generate random values and determine the individuals
selected for the next generation. Based on the process of
calculation and generation of random values, the individuals
selected are individuals 8th, 2th, 10th, 10th, 10th, 7th, 8th, 1st,
8th, and 2nd.
Next, testing is done using the roulette wheel selection
method with the same data. Based on Table I, the total fitness
value is 3.349. The next step is to find the probability value of
each individual. Table II shows the probability values of each
individual.
TABLE II
Fitness value and probability of each individual
Individual Fitness Value Probability Value
1 0.2 0.059
2 0.5 0.149
3 0.5 0.149
4 0.2 0.059
5 0.5 0.149
6 0.166 0.049
7 0.25 0.075
8 0.333 0.099
9 0.2 0.059
10 0.5 0.149
Sum f(i) 3.349
Then generate a random value [0-1]. Based on the
experiment, 10 random values appeared, namely: 0.23, 0.65,
0.82, 0.45, 0.91, 0.32, 0.54, 0.71, 0.22, and 0.43. In Figure 7 an
illustration of parent selection is based on probability values
and random values generated. Based on Figure 7, the selected
individuals are individuals 3rd, 7th, 9th, 5th, 10th, 3rd, 5th, 8th,
3rd, and 5th.

JOURNAL OF INFORMATION TECHNOLOGY AND ITS UTILIZATION, VOLUME 2, ISSUE 1, JUNE-2019:24-28 ISSN 2654-802X
28
Fig. 7. Selection illustrations based on random values and probabilities
Based on the results of testing of the roulette wheel selection
method, it can be seen that this method can maintain the best
individuals compared to the selection method used previously.
This can be seen from more selected individuals who have the
highest fitness value.
IV. CONCLUSION
The lecture scheduling system using Genetic Algorithms can
solve problems when teaching lecturers. Based on the test
results, the method of selecting Roulette Wheels is more
effectively used in this study compared to the ranking method.
V. ACKNOWLEDGMENT
We would like to thank the Universitas Muslim Indonesia
who have helped carry out this research in terms of funding
VI. REFERENCES
[1] A. J. O. S. Soyemi J., "Electronic Lecture Time-table
Scheduler Using Genetic Algorithm.,," IEEE 3rd Intl
Conf on Big Data Intelligence and Computing and Cyber
Science and Technology Congress., pp. 710-715.
[2] L. S. D. L. Herman., "Lecture Scheduling Automation
Using Genetic Algorithm," in East Indonesia Conference
on Computer and Information Technology (EIConCIT),
pp: 23-27, Balikpapan, Indonesia, 2017.
[3] F. Y. L. P. Y. J. Peng C., "Analysis of Double-Resource
Flexible Job Shop Scheduling Problem Based on Genetic
Algorithm," in 15th International Conference on
Networking, Sensing and Control (ICNSC), pp:1-6,
Zhuhai, China., 2018..
[4] G. A. W. W. F. S. Kurniawan B., "A Genetic Algorithm
for Unrelated Parallel Machine Scheduling Minimizing
Makespan Cost and Electricity Cost Under Time-of-Use
(TOU) Tariffs with Job Delay Mechanism,," in IEEE
International Cenference on Industrial Engineering and
Engineering Management (IEEM), pp:583-587,
Singapore, 2017.
[5] L. H. a. Q. F., "An Improved Genetic Algorithm for a
Parallel Machine Shceduling Problem with Energy
Consideration," in 13th IEEE Conference on Automation
Science and Engineering (CASE), pp: 1487-1492., Xi’an,
China., 2017.
[6] Zuo X, " Vehicle Scheduling of an Urban Bus Line via an
Improved Multiobjective Genetic Algorithm.," IEEE
Transaction on Intelligent Transportation System, vol.
16, no. 2, pp. pp:1030-1041, 2015.