Journal of Financial Economics - Tsinghua University
19
China's secondary privatization: Perspectives from the Split-Share Structure Reform $ Li Liao a,n , Bibo Liu b,1 , Hao Wang c,2 a Tsinghua University, PBC School of Finance, 43 Chengfu Road, Haidian District, Beijing 100083, China b Tsinghua University and CITIC Securities, Equity Capital Markets Division, CITIC Securities Tower, 48 Liangmaqiao Road, Beijing 100125, China c Tsinghua University, School of Economics and Management, 318 Weilun Building, Beijing 100084, China article info Article history: Received 23 November 2012 Received in revised form 24 September 2013 Accepted 23 October 2013 Available online 27 May 2014 JEL classification: G18 G28 G30 L33 Keywords: The Split-Share Structure Reform Privatization State-owned enterprise Financial reform Market mechanism abstract The Split-Share Structure Reform granted legitimate trading rights to the state-owned shares of listed state-owned enterprises (SOEs), opening up the gate to China's secondary privatization. The expectation of privatization quickly boosted SOE output, profits, and employment, but did not change their operating efficiency and corporate governance. The improvements to SOE performance are positively correlated to government agents’ privatization-led incentive of increasing state-owned share value. In terms of privatization methodology, the reform adopted a market mechanism that played an effective informa- tion discovery role in aligning the interests of the government and public investors. & 2014 Elsevier B.V. All rights reserved. 1. Introduction The split-share structure was a legacy of China's initial share issue privatization (SIP), in which state-owned enterprises (SOEs) went public to issue minority tradable shares to institutional and individual investors. On the other hand, the Chinese government withheld control of these listed SOEs by owning majority non-tradable shares. 3 Although the split-share structure played a posi- tive role in facilitating the SIP, it jeopardized China's Contents lists available at ScienceDirect journal homepage: www.elsevier.com/locate/jfec Journal of Financial Economics http://dx.doi.org/10.1016/j.jfineco.2014.05.007 0304-405X/& 2014 Elsevier B.V. All rights reserved. ☆ We thank G. William Schwert (the editor), an anonymous referee, Charles Cao, Haitao Li, Qian Sun, Honglin Wang, Chu Zhang, Hao Zhou, Dongming Zhu, Ning Zhu, and seminar participants at Tsinghua University, Xiamen University, CICF 2012 and the HKIMR Conference 2013 for helpful discussions. The authors acknowledge funding support from the National Natural Science Foundation of China (Grant nos. 71232003 and 71272023). n Corresponding author. Tel.: þ86 10 62798215. E-mail addresses: [email protected] (L. Liao), [email protected] (B. Liu), [email protected] (H. Wang). 1 Tel.: þ86 10 60836222. 2 Tel.: þ86 10 62797482. 3 For almost all SOEs that went public before 2005, state-owned shares—together with shares issued to non-state legal persons, natural persons, and foreigners before initial public offerings (IPOs)—were prohibited from trading in the secondary market. Only new shares issued in IPOs and seasoned cash offerings and shares derived from tradable shares in rights offerings and stock splits were tradable. By the end of 2004, the total number of RMB-denominated domestic shares (A-shares) outstanding was 714.9 billion. There were 454.3 billion non-tradable shares, 74% of which were state-owned (China Securities Regulatory Commission, 2008). Journal of Financial Economics 113 (2014) 500–518
Transcript of Journal of Financial Economics - Tsinghua University

Contents lists available at ScienceDirect
Journal of Financial Economics
Journal of Financial Economics 113 (2014) 500–518
http://d0304-40
☆ WeCharlesDongmiUnivers2013 fofrom th712320
n CorrE-m
lbb@citi1 Te2 Te
journal homepage: www.elsevier.com/locate/jfec
China's secondary privatization: Perspectives from theSplit-Share Structure Reform$
Li Liao a,n, Bibo Liu b,1, Hao Wang c,2
a Tsinghua University, PBC School of Finance, 43 Chengfu Road, Haidian District, Beijing 100083, Chinab Tsinghua University and CITIC Securities, Equity Capital Markets Division, CITIC Securities Tower, 48 Liangmaqiao Road,Beijing 100125, Chinac Tsinghua University, School of Economics and Management, 318 Weilun Building, Beijing 100084, China
a r t i c l e i n f o
Article history:Received 23 November 2012Received in revised form24 September 2013Accepted 23 October 2013Available online 27 May 2014
JEL classification:G18G28G30L33
Keywords:The Split-Share Structure ReformPrivatizationState-owned enterpriseFinancial reformMarket mechanism
x.doi.org/10.1016/j.jfineco.2014.05.0075X/& 2014 Elsevier B.V. All rights reserved.
thank G. William Schwert (the editor), anCao, Haitao Li, Qian Sun, Honglin Wang, Chng Zhu, Ning Zhu, and seminar particity, Xiamen University, CICF 2012 and ther helpful discussions. The authors acknowlee National Natural Science Foundation o03 and 71272023).esponding author. Tel.: þ86 10 62798215.ail addresses: [email protected] (L.cs.com (B. Liu), [email protected].: þ86 10 60836222.l.: þ86 10 62797482.
a b s t r a c t
The Split-Share Structure Reform granted legitimate trading rights to the state-ownedshares of listed state-owned enterprises (SOEs), opening up the gate to China's secondaryprivatization. The expectation of privatization quickly boosted SOE output, profits, andemployment, but did not change their operating efficiency and corporate governance. Theimprovements to SOE performance are positively correlated to government agents’privatization-led incentive of increasing state-owned share value. In terms of privatizationmethodology, the reform adopted a market mechanism that played an effective informa-tion discovery role in aligning the interests of the government and public investors.
& 2014 Elsevier B.V. All rights reserved.
1. Introduction
The split-share structure was a legacy of China's initialshare issue privatization (SIP), in which state-owned
anonymous referee,u Zhang, Hao Zhou,ipants at TsinghuaHKIMR Conference
dge funding supportf China (Grant nos.
Liao),.cn (H. Wang).
enterprises (SOEs) went public to issue minority tradableshares to institutional and individual investors. On theother hand, the Chinese government withheld control ofthese listed SOEs by owning majority non-tradableshares.3 Although the split-share structure played a posi-tive role in facilitating the SIP, it jeopardized China's
3 For almost all SOEs that went public before 2005, state-ownedshares—together with shares issued to non-state legal persons, naturalpersons, and foreigners before initial public offerings (IPOs)—wereprohibited from trading in the secondary market. Only new shares issuedin IPOs and seasoned cash offerings and shares derived from tradableshares in rights offerings and stock splits were tradable. By the end of2004, the total number of RMB-denominated domestic shares (A-shares)outstanding was 714.9 billion. There were 454.3 billion non-tradableshares, 74% of which were state-owned (China Securities RegulatoryCommission, 2008).
L. Liao et al. / Journal of Financial Economics 113 (2014) 500–518 501
continued privatization efforts by restricting the tradabil-ity of state-owned shares in the secondary market.It caused serious corporate governance problems, encour-aged speculation in the stock market, and blocked mergersand acquisitions.4
In 2005, the Split-Share Structure Reform was initiatedto dismantle the dual share structure by converting non-tradable shares into tradable shares.5 The reform effec-tively removed the legal and technical obstacles of trans-ferring state-owned shares to public investors, opening upthe gate to China's secondary privatization, which, incontrast to the initial SIP, would further liberalize state-owned shares in full circulation. Although it had long beenpredicted that the Split-Share Structure Reform wouldsubstantially change China's corporate landscape (Inoue,2005), the privatization effect of the reform has not beenstudied. In contrast, China's initial SIP during the 1990sreceived extensive research attention (See, e.g., Bai, Li, andWang, 1997; Lin, Cai, and Li, 1998; Lin, 2000; Sun and Tong,2003). In this paper, we fill the research gap by reviewingand evaluating the Split-Share Structure Reform. Wemeasure and examine the privatization effect of thereform as the differences between the changes in thefundamental performance of SOEs and comparable non-SOEs before and after the reform.6 We explore the sourcesof the privatization effect, and provide policy implicationsfor future privatization.
The evidence shows that the output, profit, and employ-ment of listed Chinese firms substantially increased after thereform and much more so for SOEs. Such differences werereflected in higher SOE stock returns, consistent withMegginson, Nash, and Randenborgh (1994) in that firmswith better incentives to increase stock value boost outputand profits. After the reform, SOEs and non-SOEs experi-enced similar degrees of increase in operating efficiency,measured by accounts receivable turnover and expense-to-revenue ratio. However, evidence on change in corporategovernance, measured by agency activities of controllingshareholders, for SOEs and non-SOEs is mixed. It appearsthat the Split-Share Structure Reform had a privatizationeffect that quickly boosted SOE output and profits, butdid not change SOE corporate governance and operatingefficiency.
We look into the sources of the privatization effect. Afterthe reform, state-owned shares became market priced andcould be conveniently transferred to public investors in the
4 Section 2.2 presents in detail the corporate governance problemsand other issues caused by the split-share structure. See also Allen, Qian,and Qian (2005), Hwang, Zhang, and Zhu (2006), Deng, Gan, and He(2008), and Liao, Liu, and Wang (2011) for additional discussions.
5 The Split-Share Structure Reform remains an ongoing process as ofNovember 2013. Most listed firms, however, finished the reform between2005 and 2007. There are 1,260 firms that finished the reform by the endof 2007. As of November 2013, only three out the 1,315 listed firms withthe split-share structure did not reform.
6 A firm is classified in this paper as SOE if its ultimate controllingparty is the state. See Section 4.1.1 for more classification details. TheSplit-Share Structure Reform was simultaneously carried out on SOEs andcomparable non-SOEs with the split-share structure. For non-SOEs, thereform dismantled the split-share structure. For SOEs, the reform inaddition liberalized state-owned shares, which led to an expectation ofin-depth privatization.
secondary market. These changes led to an expectation ofin-depth privatization in the future. In preparing for priva-tization by increasing the market values of state-ownedshares, government agents who operate and control SOEswill be rewarded with more control power and favorablepromotion opportunities if they improve SOE performance.7
As a result, the interest of government agents became betteraligned with the interest of public investors. Evidence showsthat privatization-led improvements to post-reform SOEperformance are positively correlated to government agents’supportive activities to SOEs. Moreover, we find that post-reform state-owned share sales, which constitute a punitivemechanism to government agents, are negatively correlatedto privatization-led improvements to SOE performance.
Compared to privatization in other countries (Megginsonand Neffer, 2001; Stiglitz, 2002) and failed early privatizationattempts in China, the Split-Share Structure Reform adopteda market mechanism through which government agents andpublic investors negotiated the terms of SOE reform plansincluding consideration paid to the latter.8 The marketmechanism allowed government agents to communicatewith public investors their incentive of improving SOEperformance after the reform in exchange for the latter'sagreement to reform. We find that privatization-ledimprovements to post-reform SOE performance are posi-tively correlated to public investors’ reform plan approvalrates, and negatively correlated to the amount of considera-tion. The evidence suggests that market mechanism playedan effective information discovery role in facilitating privati-zation in the reform. It helped to align the interests of thegovernment and public investors, and to ensure a smoothimplementation of the reform.
Our finding adds new support to the notion that pri-vatization improves the performance of SOEs (Megginson,Nash, and Randenborgh, 1994; Dewenter and Malatesta,2001; Boubakri, Cosset, and Guedhami, 2005; Song,Storesletten, and Zilibotti, 2011). Moreover, expectationon privatization can stimulate managerial incentives andboost firm performance even before actual ownershiptransition takes place. The finding generates implicationsfor privatization policy, which is considered a complextask for global economies. Outcome of privatization isinfluenced by not only economic, political, legal, institu-tional and firm-specific factors (Megginson, Nash, Netter,and Poulsen, 2004), but also privatization methodology(Perotti, 1995; Biais and Perotti, 2002).9 We demonstrate
7 We use “government agents” to denote SOE executives and con-trolling shareholders. Almost all Chinese listed SOEs have state-ownedcontrolling shareholders, who hold majority non-tradable shares onbehalf of the Chinese government. Executives of listed SOEs areappointed and evaluated by their controlling shareholders, whose execu-tives are appointed and evaluated by the Chinese government.
8 Sections 2.3 and 2.4 present in detail China's failed privatizationattempts after the SIP and the market mechanism in the Split-ShareStructure Reform, respectively.
9 Megginson and Neffer (2001) and Sheshinski and Lopez-Calva(2003) provide excellent reviews of the empirical and theoreticalprivatization literature. Brada (1996) classifies privatization methods intofour categories: privatization through restitution, privatization throughthe sale of state property (direct sales and SIP), mass or voucherprivatization, and privatization from below. Different economies haveadopted different privatization methods and have experienced very

L. Liao et al. / Journal of Financial Economics 113 (2014) 500–518502
that market mechanism is more effective than crude top-down privatization orders when China enters into an in-depth reform era. These positive elements of the Split-Share Structure Reform provide policy implications forChina's continued economic reforms and privatization inthe other economies.
To the best of our knowledge, this study constitutes thefirst effort to review the Split-Share Structure Reform withprivatization perspectives, and evaluate its long-term effectson SOE performance and corporate governance.10 Thereform also provides a desirable experiment setting enablingus to overcome such methodology difficulties as samplebias, data unreliability, and changing environments thatplague the empirical privatization literature (Megginsonand Neffer, 2001; Sheshinski and Lopez-Calva, 2003). As apolicy event, the reform involved almost all listed Chinesefirms, both SOEs and non-SOEs, in the world's largesttransitional economy, providing a cross-sectional sample ofunprecedented scale. Publicly disclosed high-quality finan-cial, stock, and ownership data are available before and afterthe reform. These unique features allow us to measure theeffects of privatization in a clean and reliable manner.
The rest of the paper is organized as follows. Section 2reviews the Split-Share Structure Reform and its back-ground. Section 3 develops our hypotheses. Section 4describes our empirical strategy. Section 5 analyzes theempirical findings. Section 6 concludes.
2. Review of the Split-Share Structure Reform
This section presents the origin of the split-sharestructure and the problems it had caused. It then reviewsChina's failed in-depth privatization attempts before the
(footnote continued)different results. For example, Boubakri and Cosset (1998) evaluate thefinancial and operating performance of newly privatized firms in devel-oping countries, and find significant post-privatization improvements.Harper (2002) and Black, Kraakman, and Trassova (2000) find disap-pointing results from the Czech Republic and Russia—firm income,profitability, and employment significantly decreased after voucherprivatization. Martin and Parker (1995) show that most UK firms didnot improve their performance after privatization through asset salesafter adjusting for the business cycle effect. Boubakri and Cosset (2002)find that 79 SOEs in 21 African countries improved their output,operating efficiency, and profitability after SIP.
10 There is a growing literature studying the Split-Share StructureReform as a special event to examine various corporate finance andcapital market issues. Among them, the study of Li, Wang, Cheung, andJiang (2011) finds that consideration is significantly influenced byefficiency gain from better risk sharing. Liao, Liu, and Wang (2011)examine information discovery and information-based trading duringpost-reform lockups. Chen, Chen, Schipper, Xu, Xue (2012) investigate thechange in firm cash holdings around the reform. Among studies on short-term market reactions and the interaction between consideration andownership, that of Bortolotti and Beltratti (2006) reports a statisticallysignificant 8% positive abnormal return over the reform event windowafter adjusting for consideration requested by tradable shareholders. Lu,Balatbat, and Czernkowski (2008) find that the positive abnormal returnsafter the reform announcement are not related to consideration paid totradable shareholders. Firth, Lin, and Zou (2010) report the negativeeffects of state-ownership and mutual fund ownership on consideration.Liu, Uchinda, and Yang (2014) report a significant reduction in cashdividends after the reform, which is significantly related to the reductionin ownership of the largest shareholders.
Split-Share Structure Reform, followed by a description ofthe reform process.
2.1. Review of the Split-Share Structure Reform
A split-share structure involves two classes of domesticA-shares with otherwise identical rights, tradable andnon-tradable, coexisting in a listed firm in China.11 Beforethe Split-Share Structure Reform, the non-tradable shareswere prohibited from trading in the secondary market, andonly allowed to be transacted through negotiationsbetween designated parties. The transaction was alsosubject to the approval of relevant regulatory authorities.In contrast, the tradable shares were issued to publicinvestors and could be transacted in the secondary market.
The origin of this dual share ownership structure canbe traced back to the enterprise ownership structurereform in 1978. By then there were only two types ofenterprise ownership in China: SOEs, which contributed78% of China's industrial output, and collectives, whichwere small enterprises operated by rural municipalities orurban communities. In the early 1980s, the Chinese gov-ernment carried out a series of reforms to improve the lowproductivity and shrinking efficiency of financially plaguedSOEs. The early economic reform attempts achieved lim-ited success, because their goals of decentralizing decisionmaking and improving managerial incentives were unableto fundamentally resolve the complex ownership structureproblems inherited from the country's planned economy.12
The Chinese government started corporatizing a selec-tion of small and medium SOEs in the mid-1980s andexperimented by privatizing them as a core element of thesecond-stage economic reform started in 1988. The found-ing of the Shanghai Stock Exchange and Shenzhen StockExchange in 1990 marked the start of China's SIP. SOEswent public to issue exchange-listed tradable shares toinstitutional and individual investors. The SIP could bebest labeled as partial because it transferred only a smallportion of SOE ownership to public investors and did littleto lessen the state's dominant role in corporate decisionmaking.
The split-share structure was then formed during theSIP. State-owned shares, together with shares issued tolegal persons, natural persons, and foreigners before IPOs,were prohibited from trading in the secondary market.This restriction was explicitly written in public offeringprospectuses or publicly announced. Only new sharesissued in IPOs and seasoned cash offerings and thosederived from tradable shares in rights offerings and stocksplits were tradable on the stock exchanges. The TentativeMeasures for the Administration of the Issuance and Trading
11 A listed Chinese firm can issue several types of common shares.A-shares are common shares priced in RMB and traded on the Shanghaior Shenzhen Stock Exchanges. B-shares are listed on the Shanghai orShenzhen Stock Exchanges but priced in US dollars. H-shares are listed onthe Hong Kong Stock Exchange and priced in Hong Kong dollars. A firmcan also be cross-listed overseas. For example, N- and L-shares representshares listed on the New York Stock Exchange and London StockExchange, respectively.
12 See Sun and Tong (2003) for a detailed review of the goals andundesirable outcomes of these reform policies before SIP.

L. Liao et al. / Journal of Financial Economics 113 (2014) 500–518 503
of Stocks, issued by the State Council in April 1993,required transactions of state-owned shares to beapproved by the relevant authorities but provided noapplicable measures on implementation.
Indeed, the Chinese government chose to put the state-owned share transaction issue on hold indefinitely forseveral reasons. First, transaction of state-owned sharesappeared unnecessary within a centralized ownershipframework and the designated administrative system.13
Second, in the 1990s, the economic reform was stillfocused on the administration and management of SOEsthat went public mainly to raise capital and to experimentwith new government-controlled management mechan-ism. Third, the Chinese stock market was at an experi-mental stage and not ready to facilitate transactions ofstate-owned shares.
2.2. Problems caused by the split-share structure
The legacy split-share structure created serious pro-blems in the functioning and development of China'sfinancial markets in the recent years and caused tremen-dous concerns. Under the split-share structure, the inter-ests of tradable and dominant non-tradable shareholdersnaturally diverged due to different pricing mechanisms oftradable and non-tradable shares. The non-tradable shareswere priced according to the book value of firm assets.Controlling non-tradable shareholders, who on averagepossessed two-thirds of total shares outstanding, wereunable to benefit from capital gains. Hence, they had little,if not zero, incentive to improve firm share values.
In the absence of effective internal and external mon-itoring, controlling shareholders tend to let listed firms torelentlessly raise money through seasoned cash offer-ings.14 Controlling shareholders were not concerned overcontrol dilution and adverse market reactions becausethey had absolute control but did not benefit from capitalgains. After raising money, controlling shareholdersexploited minority shareholders through related-partytransactions, where controlling shareholders transferredwealth from listed firms to entities they owned through,e.g., asset sales and product purchases (29.7% of firms inour sample engaged in related-party transactions withcontrolling shareholders before the reform). Some listedfirms made loans to controlling shareholders (42.3% offirms in our sample made loans to their controlling
13 Socialism by then was ideologically interpreted as that citizenscollectively own assets. The state possesses assets on behalf of citizens atthe primitive stage of socialism. The central government represents thestate in exercising ultimate control and administration of state-ownedassets. State-owned asset-holders consisted of different levels anddepartments of the Chinese government and their affiliates, who repre-sented the central government to manage SOEs according to theiradministrative functions. Transfers of state-owned assets due to reorga-nization and industry restructure were almost all executed throughadministrative orders without monetary transactions.
14 Boards of directors nominated by dominant non-tradable share-holders did not function effectively in terms of monitoring managerialbehaviors in the best interest of minority tradable shareholders. Externalmonitoring through corporate takeovers was not feasible due to non-transferability of non-tradable shares.
shareholders before the reform). Some listed firms guar-anteed loans for their controlling shareholders.
As a result, investors speculated in the stock market forshort-term returns rather than invested for long-termcapital gains. Overtrading was rampant in the Chinesestock market. As of 2007, the average turnover ratios of theShanghai and Shenzhen Stock Exchanges were 927% and987%, respectively. In comparison, as of 2005, the averageturnover ratios of the stock markets in the US, UK, andJapan were 129%, 142%, and 119%, respectively (ChinaSecurities Regulatory Commission, 2008). Such high turn-over ratios cannot be justified by liquidity, since highliquidity should be accompanied by low volatility of stockreturns. Liao, Liu, and Zhang (2010) show that between1995 and 2008, the average monthly stock return volati-lities of the Shenzhen and Shanghai Stock Exchanges were10.7% and 8.9%, respectively. The volatilities are the highestin the world, and 19 and 16 times the average stock returnvolatility of the New York Stock Exchange. Highly volatilestock prices in the Chinese stock markets are likely drivenby speculative trading activities (Sun and Tong, 2003;Allen, Qian, and Qian, 2005; Xiong and Yu, 2011).
The lack of controlling shareholder incentive to financewith debt to avoid potential financial distress togetherwith corporate bond pricing difficulties introduced by thesplit-share structure fundamentally discouraged the devel-opment of domestic corporate debt and derivative mar-kets. As of 2007, the ratio of China's bond marketcapitalization to gross domestic product (GDP) was35.3%, far lower than 188.5% and 201.0% of the US andJapan, respectively. Corporate bonds amounted to only4.2% of China's bond market. The ratio of outstandingcorporate bonds to GDP was 1.5% for China, in comparisonto 125.7% and 38.9% for the US and Japan, respectively(China Securities Regulatory Commission, 2008).
2.3. Failed early privatization attempts
The Split-Share Structure Reform, as part of China'sin-depth privatization efforts, did not come in an easy way.This section presents China's failed privatization attemptsbefore the reform and the reasons of their failure.
In September 1999, the Fourth Plenum of the 15thCentral Committee of the Communist Party of Chinapassed the Decision of the Central Committee of theCommunist Party of China on Major Issues Concerningthe Reform and Development of State-Owned Enterprises.The decision aimed to privatize an unspecified number ofstate-owned shares to raise capital for the Social SecurityFund, which served to lessen the welfare burden of SOEs.The privatization, however, was conditional on that thestate secured absolute control of those SOEs to be furtherprivatized.
In December 1999, the CSRC hand-picked 10 listedcompanies to pilot the state-owned share sales. As inrights offerings, preferential subscription rights wereoffered to existing shareholders. Sale prices were crudelyset using firms’ average earnings per share in the pastthree years multiplied by a fixed price earnings ratio of 10.Sales were quickly suspended after two companies prac-ticed the decision, because the stock market negatively
16 Four companies, namely, Sany Heavy Industry, Tongfang Co.,Zijiang Enterprise Group, and Jinniu Energy Resources, comprised thefirst batch of pilot firms chosen by the CSRC. The second pilot batchincluded 42 companies.
L. Liao et al. / Journal of Financial Economics 113 (2014) 500–518504
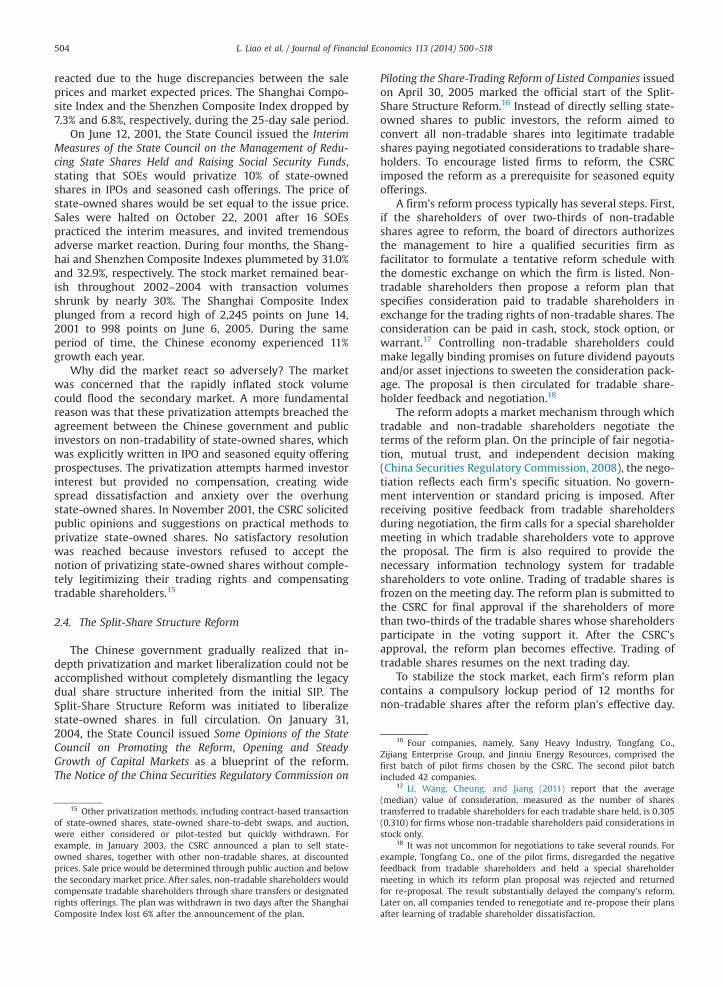
reacted due to the huge discrepancies between the saleprices and market expected prices. The Shanghai Compo-site Index and the Shenzhen Composite Index dropped by7.3% and 6.8%, respectively, during the 25-day sale period.
On June 12, 2001, the State Council issued the InterimMeasures of the State Council on the Management of Redu-cing State Shares Held and Raising Social Security Funds,stating that SOEs would privatize 10% of state-ownedshares in IPOs and seasoned cash offerings. The price ofstate-owned shares would be set equal to the issue price.Sales were halted on October 22, 2001 after 16 SOEspracticed the interim measures, and invited tremendousadverse market reaction. During four months, the Shang-hai and Shenzhen Composite Indexes plummeted by 31.0%and 32.9%, respectively. The stock market remained bear-ish throughout 2002–2004 with transaction volumesshrunk by nearly 30%. The Shanghai Composite Indexplunged from a record high of 2,245 points on June 14,2001 to 998 points on June 6, 2005. During the sameperiod of time, the Chinese economy experienced 11%growth each year.
Why did the market react so adversely? The marketwas concerned that the rapidly inflated stock volumecould flood the secondary market. A more fundamentalreason was that these privatization attempts breached theagreement between the Chinese government and publicinvestors on non-tradability of state-owned shares, whichwas explicitly written in IPO and seasoned equity offeringprospectuses. The privatization attempts harmed investorinterest but provided no compensation, creating widespread dissatisfaction and anxiety over the overhungstate-owned shares. In November 2001, the CSRC solicitedpublic opinions and suggestions on practical methods toprivatize state-owned shares. No satisfactory resolutionwas reached because investors refused to accept thenotion of privatizing state-owned shares without comple-tely legitimizing their trading rights and compensatingtradable shareholders.15
2.4. The Split-Share Structure Reform
The Chinese government gradually realized that in-depth privatization and market liberalization could not beaccomplished without completely dismantling the legacydual share structure inherited from the initial SIP. TheSplit-Share Structure Reform was initiated to liberalizestate-owned shares in full circulation. On January 31,2004, the State Council issued Some Opinions of the StateCouncil on Promoting the Reform, Opening and SteadyGrowth of Capital Markets as a blueprint of the reform.The Notice of the China Securities Regulatory Commission on
15 Other privatization methods, including contract-based transactionof state-owned shares, state-owned share-to-debt swaps, and auction,were either considered or pilot-tested but quickly withdrawn. Forexample, in January 2003, the CSRC announced a plan to sell state-owned shares, together with other non-tradable shares, at discountedprices. Sale price would be determined through public auction and belowthe secondary market price. After sales, non-tradable shareholders wouldcompensate tradable shareholders through share transfers or designatedrights offerings. The plan was withdrawn in two days after the ShanghaiComposite Index lost 6% after the announcement of the plan.
Piloting the Share-Trading Reform of Listed Companies issuedon April 30, 2005 marked the official start of the Split-Share Structure Reform.16 Instead of directly selling state-owned shares to public investors, the reform aimed toconvert all non-tradable shares into legitimate tradableshares paying negotiated considerations to tradable share-holders. To encourage listed firms to reform, the CSRCimposed the reform as a prerequisite for seasoned equityofferings.
A firm's reform process typically has several steps. First,if the shareholders of over two-thirds of non-tradableshares agree to reform, the board of directors authorizesthe management to hire a qualified securities firm asfacilitator to formulate a tentative reform schedule withthe domestic exchange on which the firm is listed. Non-tradable shareholders then propose a reform plan thatspecifies consideration paid to tradable shareholders inexchange for the trading rights of non-tradable shares. Theconsideration can be paid in cash, stock, stock option, orwarrant.17 Controlling non-tradable shareholders couldmake legally binding promises on future dividend payoutsand/or asset injections to sweeten the consideration pack-age. The proposal is then circulated for tradable share-holder feedback and negotiation.18
The reform adopts a market mechanism through whichtradable and non-tradable shareholders negotiate theterms of the reform plan. On the principle of fair negotia-tion, mutual trust, and independent decision making(China Securities Regulatory Commission, 2008), the nego-tiation reflects each firm's specific situation. No govern-ment intervention or standard pricing is imposed. Afterreceiving positive feedback from tradable shareholdersduring negotiation, the firm calls for a special shareholdermeeting in which tradable shareholders vote to approvethe proposal. The firm is also required to provide thenecessary information technology system for tradableshareholders to vote online. Trading of tradable shares isfrozen on the meeting day. The reform plan is submitted tothe CSRC for final approval if the shareholders of morethan two-thirds of the tradable shares whose shareholdersparticipate in the voting support it. After the CSRC'sapproval, the reform plan becomes effective. Trading oftradable shares resumes on the next trading day.
To stabilize the stock market, each firm's reform plancontains a compulsory lockup period of 12 months fornon-tradable shares after the reform plan's effective day.
17 Li, Wang, Cheung, and Jiang (2011) report that the average(median) value of consideration, measured as the number of sharestransferred to tradable shareholders for each tradable share held, is 0.305(0.310) for firms whose non-tradable shareholders paid considerations instock only.
18 It was not uncommon for negotiations to take several rounds. Forexample, Tongfang Co., one of the pilot firms, disregarded the negativefeedback from tradable shareholders and held a special shareholdermeeting in which its reform plan proposal was rejected and returnedfor re-proposal. The result substantially delayed the company's reform.Later on, all companies tended to renegotiate and re-propose their plansafter learning of tradable shareholder dissatisfaction.

L. Liao et al. / Journal of Financial Economics 113 (2014) 500–518 505
In addition, a non-tradable shareholder is prohibited fromselling more than 5% (10%) of total shares outstandingwithin 12 (24) months after the lockup. Transactions ofnon-tradable shares over 1% of total shares outstandingmust be publicly disclosed within two trading days. Uponcompletion of the Split-Share Structure Reform, theChinese stock market would no longer be fundamentallydifferent from international markets in terms of pricingand valuation.
19 As shown in the previous section, the Chinese government hadattempted but failed to privatize state-owned shares of listed SOEs toraise capital for economic reforms in the past. It remains unclear whenand how the Chinese government will privatize SOEs after the Split-ShareStructure Reform, which has nonetheless removed the legal and technicalobstacles. The reform also hinted the direction for future policies.Growing government liabilities and loss of SOE competitiveness afterfurther financial liberalization are potential triggers for large-scaleprivatization. The third plenum of the 18th Central Committee of theChinese Communist Party in November 2013 emphasized that China willallow private capital to play a more important role in developing a mixedownership economy.
20 On August 23, 2005, the CSRC, joined by the State-owned AssetsSupervision and Administration Commission of the State Council, theMinistry of Finance, the People's Bank of China (the central bank), and theMinistry of Commerce, announced The Guiding Opinions on the Split-ShareStructure Reform of Listed Companies stating that the governmentencourages enterprises with good performance to become group-listedthrough the listed SOEs under their control after the Split-Share StructureReform.
3. Hypothesis development
This section develops hypotheses to examine the pri-vatization effect embedded in the Split-Share StructureReform, and to discover the source of the privatizationeffect. Theory predicts that private ownership is moreefficient than government ownership because a competi-tive equilibrium is Pareto optimal (Megginson and Neffer,2001). Sheshinski and Lopez-Calva (2003) argue thatsignificant efficiency gain should be obtained for firmsbeing transferred from government to private ownershipin competitive industries. Empirical evidence shows thatin many economies and industries, firm performance isimproved after privatization (Megginson, Nash, andRandenborgh, 1994; LaPorta, Lopez-de-Silance, andShleifer, 1999; Boubakri, Cosset, and Guedhami, 2005).We first develop and test the following hypothesis onthe existence of a privatization effect in the Split-ShareStructure Reform:
H1. After the Split-Share Structure Reform, SOEs improvedperformance more than non-SOEs.
The next question is on the source of the privatizationeffect, if it exists. Megginson, Nash, and Randenborgh(1994) show that stronger managerial incentive of increas-ing share value leads to increases in SOE output and profit.Chinese SOEs have very different corporate structure thanwestern firms. Almost all listed SOEs in China have state-owned controlling shareholders, who own majority non-tradable shares on behalf of the Chinese government.Executives of listed SOEs are appointed and evaluated bytheir controlling shareholders, whose executives areappointed and evaluated by the Chinese government.Thus, the interest of the Chinese government and theincentive of the government agents operating SOEs playdecisive roles in shaping SOE performance and corporategovernance.
The split-share structure created a particular form ofagency problem within listed Chinese SOEs. Jensen andMeckling (1976) state that a form of agency probleminvolves the interest conflict between controlling share-holders and minority shareholders in a market with highownership concentration. Controlling shareholders haveincentive to divert firm resources for private interest atthe expense of minority shareholders (Grossman andHart, 1988; Shleifer and Vishny, 1997). Since public inves-tors held tradable shares of listed SOEs, the agencyproblems in SOEs were rooted in the interest conflictsbetween government agents and public investors, whichcaused serious governance problems (Allen, Qian, and
Qian, 2005; Deng, Gan, and He, 2008). Since the sales ofstate-owned shares are not possible, the governmentagents operating SOEs are evaluated according to the bookvalues of firm assets, revenues, or short-term profits ratherthan share prices. Thus, government agents are likely tomake decisions that increase book assets, revenues, orshort-term profits but decrease stock values.
The Split-Share Structure Reform generated an expec-tation of in-depth privatization.19 After the reform, state-owned shares became market priced and could be easilytransferred to public investors in the secondary market.Performance of government agents will be evaluated onthe market values of state-owned shares, instead of thebook values of SOE assets as before the reform. Hence, theinterests of government agents and public investorsbecome better aligned. In particular, government agentswill be rewarded with more control power and favorablepromotion opportunities if they improve SOE performanceand increase state-owned share values. For instance, strongperformance of an SOE could help its controlling shareholderbecome group-listed.20 Thus, the controlling shareholder iswilling to inject more assets into the listed SOE. On the otherhand, the government could divest in underperforming SOEsto discipline their management. Sales of state-owned sharesconstitute a punitive mechanism to government agents,diluting their control and jeopardizing their future promo-tion. Furthermore, SOEs with good performance could havebetter access to seasoned equity offerings, which are subjectto profitability requirements. They could also enjoy lowerfinancing costs, because higher firm value signals lowerinsolvency risk and better quality collateral. Assuming thatthe privatization-led incentive of government agents shouldbe duly reflected in their supportive activities to SOEs, wedevelop and test the following hypothesis:
H2. Privatization-led improvements to post-reform SOEperformance are positively correlated to governmentagents' supportive activities.
It should be noted that according to H2, it is theenhanced incentive of incumbent management, that is,the government agents, rather than the new managementbrought in after actual privatization takes place as in other

21 We manually trace the origins of the 146 private listed firms, andfind that nearly 43% of the firms have never been state-owned. Theirshares held by non-state legal persons, natural persons, and foreignersbefore IPOs were prohibited from trading in the secondary market beforethe Split-Share Structure Reform. About 53% of the firms had state-owned shares at IPOs. The state-owned shares were transferred to publicinvestors on an individual case base as China continued experimentingwith privatization methodology after the SIP. These privatized sharesremained untradable before the Split-Share Structure Reform.
22 For example, the Shapiro-Wilk test on operating revenue gener-ates W¼0.13 with po0.0001, rejecting the null hypothesis that thevariable is normally distributed.
L. Liao et al. / Journal of Financial Economics 113 (2014) 500–518506
privatization theories, that contributes to the improve-ments to SOE performance. Since the expectation ofprivatization changes the incentive, the privatization effectcould take shape before actual transfer of state to privateownership.
We further examine the information discovery role ofthe market mechanism adopted in the reform in facilitat-ing privatization, arguing that the market mechanismhelps to bridge the information exchange between gov-ernment agents and public investors at the reform nego-tiation stage. The notion is that government agents couldoffer either higher up-front consideration or convincibleoutlook of higher post-reform capital gain conditional onthe success of the reform in exchange for the latter'sagreement to reform. If the market mechanism is effectivein facilitating the information exchange, investors shouldbe able to form reasonable expectations on the post-reform performance of SOEs, which in turn affects theirapproval of reform plans and the amount of considerationdemanded. Therefore, we develop and test the followinghypothesis:
H3. Privatization-led improvements to post-reform SOEperformance are positively correlated to public investors'reform plan approval rate and negatively correlated toconsideration value.
4. Empirical strategy
This section presents our empirical strategy. It firstillustrates the methods used to identify the privatizationeffect, followed by introducing our data. It then introduceshow to relate the privatization effect to its potentialsource.
4.1. Identifying the privatization effect
Our greatest advantage in studying privatizationresides on the fact that the Split-Share Structure Reformwas simultaneously carried out on listed SOEs and com-parable listed non-SOEs. For non-SOEs, the reform dis-mantled the split-share structure. For SOEs, the reform notonly dismantled the split-share structure, but alsoremoved legal barriers of in-depth privatization. Thus,the reform has an additional privatization effect on SOEsthan non-SOEs.
4.1.1. Measuring state-ownershipFor robustness, we measure state-ownership in three
ways: (1) we classify a firm as SOE if its ultimate control-ling party is the state, non-SOE otherwise. Listed Chinesefirms disclose their ultimate controlling parties in annualfinancial reports. The state is the ultimate controlling partyof a firm if (i) the state controls directly or indirectly over50% of total shares outstanding, (ii) the state controlsdirectly or indirectly over 30% of total voting rights,(iii) the voting rights of the state allow it to elect over50% of board directors, or (iv) the state has significantinfluence on decisions made in shareholder meetings; (2)we use the ratio of number of state-owned shares tonumber of total shares outstanding as a proxy for state-
ownership in our regression analysis; and (3) we assignfirms by their state-ownership measured in (2) into fourgroups, where Group P contains private listed firms that donot have any state-owned shares. Group P constitutes asubsample of non-SOEs classified in (1).21 The rest of thefirms are ranked by their state-owned shares to totalshares outstanding ratios from low to high, and assignedto Groups SL, SM, and SH evenly.
4.1.2. Evaluating the reform and estimating the privatizationeffect
In evaluating the Split-Share Structure Reform andestimating the privatization effect, we contrast firm per-formance and corporate governance three years beforeand after the reform. Medians, instead of means, of a list ofperformance and corporate governance variables areexamined, because, as in Sun and Tong (2003), we notethat the distributions of the key variables of interest areheavily skewed and leptokurtic.22 As a result, we applyWilcoxon signed-rank tests to examine the significance ofthe median changes in the variables before and after thereform, and Wilcoxon Z-tests to examine the significanceof the differences in the median changes between groups.
We adopt a differences-in-differences approach to mea-sure the privatization effect. In doing so, we first dividenon-SOEs into 5�5 benchmark portfolios by size (mea-sured by market capitalization) and industry. For robust-ness, we construct another set of 5�5 non-SOEbenchmark portfolios by size and market-to-book ratio.We then assign each SOE to one of the 5�5 benchmarkportfolios by matching size and industry (size and market-to-book ratio). We compute the median changes in theperformance and corporate governance variables of thesebenchmark portfolios, ΔPerformBK, and the medianchanges in the variables of each SOE, ΔPerformSOE, respec-tively. We measure the privatization-led improvements toSOE performance as IMPPRW¼ΔPerformSOE�ΔPerformBK.Our approach allows removing the non-privatizationeffects of the reform and influence of unknown factors,such as economic shocks.
4.1.3. Fundamental performanceIn measuring firm fundamental performance, we con-
sider that China revised the Chinese Generally AcceptedAccounting Principles (GAAP) to embrace the InternationalFinancial Reporting Standards during our sample period.The new Chinese GAAP became effective in January 2007with revisions concentrating on how investment profitand other income are scoped and recorded. Assets and

24 The Chinese renminbi appreciated steadily against the US dollarduring our sample period. The annual average exchange rates of the US
L. Liao et al. / Journal of Financial Economics 113 (2014) 500–518 507
shareholder equity are affected by the changes in record-ing inventories and retained earnings (Ding and Su, 2008;Peng and Bewley, 2010). The revision leads to incompar-able earning- and asset-based financial variables, such asreturn on assets (ROA) and return on equity (ROE), beforeand after the reform.
As a result, we use the Consumer Price Index-adjustedoperating revenue and operating profit as proxies for firmoutput. We use the number of employees to measureemployment. Capital expenditure (measured as change ingross property, plant, and equipment plus change inintangible assets) normalized by operating revenue is usedas a proxy for investment. We use operating revenue peremployee and operating profit per employee as proxies forproductivity and profitability, respectively. We computethe accounts receivable turnover and the ratio of sellingand financial expenses to operating revenue to measureoperating efficiency.23 Since the commonly used debt-to-asset and current ratios are incomparable before and afterthe revision of the Chinese GAAP, we use the ratio of cashto total liabilities as a proxy of insolvency risk. Severalcommonly used but incomparable variables, such as ROA,ROE, and debt-to-asset ratio, are also reported only forreference nonetheless.
4.1.4. Stock performanceIn measuring firm market performance, we estimate
the Fama and French (1993) three-factor model-impliedstock returns with
r̂i ¼ βMi ðrM�rf ÞþβSMBi rSMBþβHML
i rHMLþrf ð1Þwhere rM, rf, rSMB, and rHML denote the market return(Shanghai Composite Index return), the risk-free rate (one-year Chinese Treasury rate), and the returns for the SMBand HML portfolios, respectively. The β coefficients areestimated using one-year pre-reform daily stock returns.We compute adjusted stock returns as radj ¼ ri� r̂i, where ridenotes raw stock return. Privatization-led SOE stockreturn is computed as rPRIVadj ¼ rSOEadj �rBKadj, where rPRIVadjdenotes an SOE's adjusted stock return, and rBKadj denotesthe median adjusted stock return of the non-SOE bench-mark portfolio, to which the SOE is assigned.
4.1.5. Corporate governanceTraditional corporate governance tools, such as internal
monitoring and external takeover, have been shown inef-fective for listed firms in China (Allen, Qian, and Qian,2005; Sun and Tong, 2003). We originate three measuresof corporate governance: (1) related-party transactions,(2) related-party transactions with controlling share-holders, and (3) listed firms lending to controlling share-holders. These activities represented notorious controllingshareholder agency problems before the reform (Xu, Cai,and Xu, 2005; Cheung, Rau, and Stouraitis, 2006). Related-party transactions, especially those involving controlling
23 General and administrative expenses are affected by the revisionof the Chinese GAAP due to changes in how inventories and assets arerecorded (Ding and Su, 2008; Peng and Bewley, 2010). We use selling andfinancial expenses, which are not affected by the revision, as a substitutefor the commonly used selling, general, and administrative expenses.
shareholders, were accused of being a commonly usedprofit tunneling strategy before the reform. Controllingshareholder borrowing at extremely low cost or eveninterest-free from listed firms has also been widely criti-cized. We examine whether the percentage of firmsengaged and the amount of money involved in theseagency activities change before and after the reform, inassessing the effect of the reform on listed firms’ corporategovernance.
4.2. Data
Data on the Split-Share Structure Reform and firmfinancial information are obtained from the CSMAR data-base and cross-checked against data in the WIND databaseto improve reliability. Firm operating revenues and oper-ating profits before the revision of the Chinese GAAP aremanually collected from annual financial reports, sincethey are not reported in the databases. There are 1,260firms that finished the Split-Share Structure Reform by theend of 2007. We exclude 228 firms that are delisted, in thefinancial industry, or with incomplete accounting informa-tion. Our final sample contains 1,032 firms, among which633 firms are SOEs and 399 firms are non-SOEs. GroupsP, SL, SM, and SH contain 146, 295, 296, and 295 firms,respectively.
Table 1 reports the medians of a selection of keyvariables one year before the reform. The medians of theratios of non-tradable shares to total shares outstandingfor non-SOEs and SOEs are similar, at 60.15% and 62.51%,respectively. SOEs, originating from capital-intensiveheavy industries, are larger than non-SOEs in terms ofassets, revenue, and employment. For example, the med-ians of non-SOE assets and annual revenue are RMB1,264.25 million and 592.31 million, respectively. In con-trast, the medians of SOE assets and annual revenue areRMB 2,069.67 million and 1,236.01 million, respectively.24
SOEs and non-SOEs have similar levels of profitability. Themedians of SOE (non-SOE) net margin rate, ROA, and ROEare 3.50% (3.66%), 2.50% (2.08%), and 5.26% (4.25%),respectively. SOEs and non-SOEs have comparable capitalstructure and short-term solvency measure. For example,the medians of SOE (non-SOE) debt-to-asset ratios andcurrent ratios are 0.51 (0.55) and 1.17(1.14), respectively.The market-to-book ratios for SOEs and non-SOEs are 1.70and 1.76, comparable to the average market-to-book ratioof US firms.25
Managerial ownership in general is low for listedChinese firms. The median managerial shareholding is0.004% for the full sample, that is, average firm manage-ment holds four out of 100,000 shares outstanding. Non-
dollar to the renminbi during 2004–2009 were 8.28, 8.29, 7.97, 7.60, 6.95,and 6.83, respectively. On average, US$1 was equivalent to RMB 7.64during our sample period.
25 Pontiff and Schall (1998) report an average book-to-market ratio of0.668 for US firms during 1926–1994, which translates into an averagemarket-to-book ratio of 1.50. Chen, Wang, and Zhou (2013) report anaverage market-to-book ratio of 2.13 for US firms during 1950–2010.
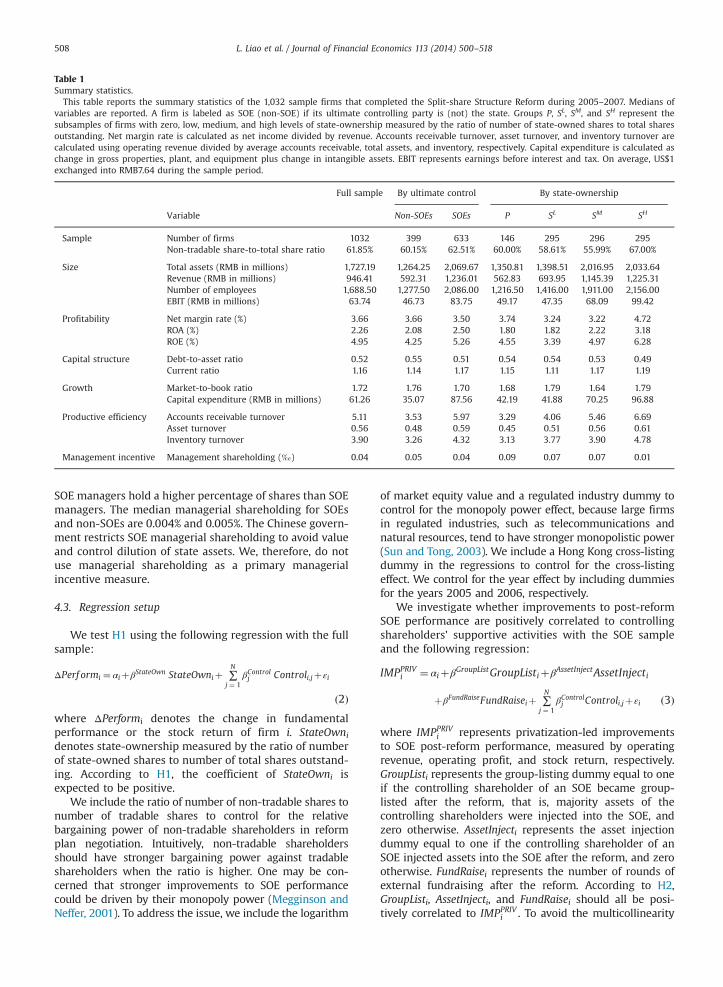
Table 1Summary statistics.
This table reports the summary statistics of the 1,032 sample firms that completed the Split-share Structure Reform during 2005–2007. Medians ofvariables are reported. A firm is labeled as SOE (non-SOE) if its ultimate controlling party is (not) the state. Groups P, SL, SM, and SH represent thesubsamples of firms with zero, low, medium, and high levels of state-ownership measured by the ratio of number of state-owned shares to total sharesoutstanding. Net margin rate is calculated as net income divided by revenue. Accounts receivable turnover, asset turnover, and inventory turnover arecalculated using operating revenue divided by average accounts receivable, total assets, and inventory, respectively. Capital expenditure is calculated aschange in gross properties, plant, and equipment plus change in intangible assets. EBIT represents earnings before interest and tax. On average, US$1exchanged into RMB7.64 during the sample period.
Full sample By ultimate control By state-ownership
Variable Non-SOEs SOEs P SL SM SH
Sample Number of firms 1032 399 633 146 295 296 295Non-tradable share-to-total share ratio 61.85% 60.15% 62.51% 60.00% 58.61% 55.99% 67.00%
Size Total assets (RMB in millions) 1,727.19 1,264.25 2,069.67 1,350.81 1,398.51 2,016.95 2,033.64Revenue (RMB in millions) 946.41 592.31 1,236.01 562.83 693.95 1,145.39 1,225.31Number of employees 1,688.50 1,277.50 2,086.00 1,216.50 1,416.00 1,911.00 2,156.00EBIT (RMB in millions) 63.74 46.73 83.75 49.17 47.35 68.09 99.42
Profitability Net margin rate (%) 3.66 3.66 3.50 3.74 3.24 3.22 4.72ROA (%) 2.26 2.08 2.50 1.80 1.82 2.22 3.18ROE (%) 4.95 4.25 5.26 4.55 3.39 4.97 6.28
Capital structure Debt-to-asset ratio 0.52 0.55 0.51 0.54 0.54 0.53 0.49Current ratio 1.16 1.14 1.17 1.15 1.11 1.17 1.19
Growth Market-to-book ratio 1.72 1.76 1.70 1.68 1.79 1.64 1.79Capital expenditure (RMB in millions) 61.26 35.07 87.56 42.19 41.88 70.25 96.88
Productive efficiency Accounts receivable turnover 5.11 3.53 5.97 3.29 4.06 5.46 6.69Asset turnover 0.56 0.48 0.59 0.45 0.51 0.56 0.61Inventory turnover 3.90 3.26 4.32 3.13 3.77 3.90 4.78
Management incentive Management shareholding (‰) 0.04 0.05 0.04 0.09 0.07 0.07 0.01
L. Liao et al. / Journal of Financial Economics 113 (2014) 500–518508
SOE managers hold a higher percentage of shares than SOEmanagers. The median managerial shareholding for SOEsand non-SOEs are 0.004% and 0.005%. The Chinese govern-ment restricts SOE managerial shareholding to avoid valueand control dilution of state assets. We, therefore, do notuse managerial shareholding as a primary managerialincentive measure.
4.3. Regression setup
We test H1 using the following regression with the fullsample:
ΔPerf ormi ¼ αiþβStateOwn StateOwniþ ∑N
j ¼ 1βControlj Controli;jþεi
ð2Þwhere ΔPerformi denotes the change in fundamentalperformance or the stock return of firm i. StateOwnidenotes state-ownership measured by the ratio of numberof state-owned shares to number of total shares outstand-ing. According to H1, the coefficient of StateOwni isexpected to be positive.
We include the ratio of number of non-tradable shares tonumber of tradable shares to control for the relativebargaining power of non-tradable shareholders in reformplan negotiation. Intuitively, non-tradable shareholdersshould have stronger bargaining power against tradableshareholders when the ratio is higher. One may be con-cerned that stronger improvements to SOE performancecould be driven by their monopoly power (Megginson andNeffer, 2001). To address the issue, we include the logarithm
of market equity value and a regulated industry dummy tocontrol for the monopoly power effect, because large firmsin regulated industries, such as telecommunications andnatural resources, tend to have stronger monopolistic power(Sun and Tong, 2003). We include a Hong Kong cross-listingdummy in the regressions to control for the cross-listingeffect. We control for the year effect by including dummiesfor the years 2005 and 2006, respectively.
We investigate whether improvements to post-reformSOE performance are positively correlated to controllingshareholders’ supportive activities with the SOE sampleand the following regression:
IMPPRIVi ¼ αiþβGroupListGroupListiþβAssetInjectAssetInjecti
þβFundRaiseFundRaiseiþ ∑N
j ¼ 1βControlj Controli;jþεi ð3Þ
where IMPPRIVi represents privatization-led improvements
to SOE post-reform performance, measured by operatingrevenue, operating profit, and stock return, respectively.GroupListi represents the group-listing dummy equal to oneif the controlling shareholder of an SOE became group-listed after the reform, that is, majority assets of thecontrolling shareholders were injected into the SOE, andzero otherwise. AssetInjecti represents the asset injectiondummy equal to one if the controlling shareholder of anSOE injected assets into the SOE after the reform, and zerootherwise. FundRaisei represents the number of rounds ofexternal fundraising after the reform. According to H2,GroupListi, AssetInjecti, and FundRaisei should all be posi-tively correlated to IMPPRIV
i . To avoid the multicollinearity

L. Liao et al. / Journal of Financial Economics 113 (2014) 500–518 509
problem, we include these supportive activities each indi-vidually as independent variables in the regressions.
To analyze whether the market mechanism played aneffective informational role in facilitating privatization, wecarry out cross-sectional regressions based on the follow-ing equation with the SOE sample to test H3:
IMPPRIVi ¼ αiþβConsider ConsideriþβApproval Approvali
þ ∑N
j ¼ 1βControlj Controli;jþεi ð4Þ
where Consideri and Approvali denote consideration paid totradable shareholders and tradable shareholder reformplan approval rate, respectively. Consideri is measured asthe ratio of number of shares transferred from non-tradable shareholders to tradable shareholders to numberof tradable shares outstanding (Li, Wang, Cheung, andJiang, 2011). Tradable shareholders’ reform plan approvalrate is computed as the ratio of number of tradable sharesvoted to approve the reform plan to number of tradableshares participated in the vote. According to H3, Consideriand Approvali should be negatively and positively corre-lated to IMPPRIV
i , respectively.The residuals in the above equations are not normally
distributed.26 In this situation, ordinary least square (OLS)regressions can lead to biased estimates and statisticalinferences. Thus, we apply quantile regressions in ourinvestigation (Koenker and Bassett, 1978). Quantile regres-sion imposes no restrictive prior on the distribution ofresiduals, and utilizes the least absolute distance estima-tion algorithm instead of the least-squares algorithm.It allows one to examine any arbitrary quantiles of selecteddependent variables, which enables the investigation onthe significance and stability of results all over quantilespectrum. We analyze the most representative 25%, 50%(median), and 75% quantiles, and illustrate the robustnessof results over the entire quantile range.
5. Result analysis
This section evaluates the Split-Share Structure Reformand its privatization effect looking into the post-reformchanges in SOE and non-SOE output, employment, produc-tivity, operating efficiency, and corporate governance. Wefind that the listed firms substantially increased output,profit, and employment after the reform, with SOEs sig-nificantly outperforming their counterparts. Such differ-ences are duly reflected in their higher stock returns.These differences could be sourced to the expectation ofprivatization and enhanced managerial incentives. There isno consistent evidence that the expectation of privatizationled to greater improvements in operating efficiency andcorporate governance for SOEs than non-SOEs. Improve-ments to SOE performance are positively correlated togovernment agents’ incentive of increasing state-owned
26 For example, the skewness and kurtosis of the residuals in theoperating revenue regression specified in Eq. (2) are 3.3 and 15.8,respectively. The Shapiro-Wilk test on the residuals reports W¼0.70with po0.0001, rejecting the null hypothesis that the residuals arenormally distributed.
share value. The market mechanism played a remarkableinformation discovery role in facilitating privatization.
5.1. Evaluating the reform and privatization effect
5.1.1. Output and productivityTable 2 reports the post-reform changes in firm output,
employment, and investment. It shows that firm operatingrevenue increases significantly after the reform. For the fullsample, the median increase is 73%, significant at the 1%level. The result is unlikely driven by outliers as column 1shows that 779 firms experienced a positive operatingrevenue change, whereas 253 firms experienced a down-ward change. The increases in median operating revenuefor non-SOEs and SOEs are 57% and 84%. Moreover, theincreases in the medians for groups P, SL, SM, and SH were47%, 60%, 74%, and 92%, respectively, significant at the 1%level. SOEs experienced greater output growth than non-SOEs, that is, the difference in median output growthbetween SOEs and non-SOEs (the highest state-ownershipgroup SH and the pure private group P) was 27% (44%),significant at the 1% level. Expectation of privatization canhave two opposite effects on output. On the one hand, thereis a positive effect due to better-aligned government agentincentive and more flexible financing (Megginson, Nash,and Randenborgh, 1994). On the other hand, output coulddecrease due to a reduction in government subsidy (Boycko,Sheleifer, and Vishny, 1996). The first effect appears todominate the second in our case.
The evidence indicates significant post-reform increasesin firm operating profit. The median increases for the fullsample, non-SOEs, and SOEs are 45%, 44%, and 50%, respec-tively, significant at the 1% level. The difference betweenSOEs and non-SOEs is, however, insignificant. Employmentincreased substantially after the reform with a medianchange for the full sample of 13%, significant at the 1% level.The difference in the changes of the median employmentgrowth rate between SOEs and non-SOEs (Group SH andGroup P) is 17% (16%), significant at the 1% level. Highergrowth in SOE employment after the reform cannot beentirely due to new positions created. Some employees couldhave been transferred from the SOE's controlling share-holders with asset injections. The reform nonetheless didnot cause mass reduction in employment, which is in starkcontrast to China's SIP that led to sizable unemployment inthe 1990s (Sun and Tong, 2003).
Post-reform growth in capital asset investment wasslower than operating revenue growth. The changes in themedian ratios of capital expenditure to operating revenuefor the full sample, non-SOEs, and SOEs are �2.76%,�3.87%, and �2.04%, respectively. SOEs experiencedlower decreases in capital expenditure relative to theiroperating revenues than non-SOEs. The difference in thechanges of the median ratios of capital expenditure tooperating revenue between SOEs and non-SOEs (Group SH
and Group P) is 1.83% (5.16%), significant at the 10% (1%)level. The result is consistent with H2 in that governmentagents had a stronger incentive to inject high-qualityassets into SOEs in boosting their performance andincreasing stock prices after the reform.

Table 2Post-reform changes in output, employment, and productivity.
This table reports changes in firm output, profitability, employment, and productivity three years before and after the reform. The sample consists of1,032 firms that completed the Split-share Structure Reform during 2005–2007. Wilcoxon signed-rank test is applied to examine the significance ofchanges in medians of variables. Wilcoxon Z-test is applied to examine the significance of difference in changes between groups. Proportion Z-test is usedto test whether increase (decrease) odds are greater than one. The p-values are reported in parentheses. The definitions of SOE and non-SOE (Groups P, SL,SM, and SH) are the same as in Table 1. A variable with ※ is associated with percentage change calculated as the difference between its post-reform and pre-reform values normalized by pre-reform value. Otherwise, the change is calculated as the level difference between post-reform and pre-reform values.Variables in italic are incomparable before and after the revision of the Chinese Generally Accepted Accounting Principles effective in 2007, and reportedonly for reference. Superscripts n, nn, and nnn denote the significance levels of 10%, 5%, and 1%, respectively.
Full sample By ultimate control By state-ownership
Increaseodds
Medianchange
Non-SOEs
SOEs SOEs�non-SOEs
P SL SM SH SH�P
Panel A: Output, employment, and capital expenditureOperating revenue※ 779/253nnn 0.73nnn 0.57nnn 0.84nnn 0.27nnn 0.47nnn 0.60nnn 0.74nnn 0.92nnn 0.44nnn
(0.000) (0.000) (0.000) (0.000) (0.000) (0.000) (0.000) (0.000) (0.000) (0.000)Operating profit※ 681/334nnn 0.45nnn 0.44nnn 0.50nnn 0.05 0.45nnn 0.34nnn 0.60nnn 0.51nnn 0.05
(0.000) (0.000) (0.000) (0.000) (0.176) (0.000) (0.000) (0.000) (0.000) (0.216)Total assets※ 850/182nnn 0.81nnn 0.62nnn 0.98nnn 0.35nnn 0.64nnn 0.61nnn 0.93nnn 1.13nnn 0.50nnn
(0.000) (0.000) (0.000) (0.000) (0.000) (0.000) (0.000) (0.000) (0.000) (0.000)No. of employees※ 606/424nnn 0.13nnn 0.02nnn 0.19nnn 0.17nnn 0.00nn 0.09nnn 0.17nnn 0.16nnn 0.16nnn
(0.000) (0.000) (0.001) (0.000) (0.000) (0.018) (0.000) (0.000) (0.000) (0.010)Capital expenditure (%) 317/556nnn �2.76nnn �3.87nnn �2.04nnn 1.83n �6.28nnn �2.76nnn �3.58nnn �1.12n 5.16nnn
(0.000) (0.000) (0.000) (0.000) (0.063) (0.000) (0.000) (0.000) (0.000) (0.002)
Panel B: ProductivityOperating revenue per
employee※703/327nnn 0.41nnn 0.41nnn 0.41nnn 0.01 0.38nnn 0.33nnn 0.39nnn 0.53nnn 0.14(0.000) (0.000) (0.000) (0.000) (0.968) (0.000) (0.000) (0.000) (0.000) (0.283)
Operating profit peremployee※
579/434nnn 0.17nnn 0.19nnn 0.15nnn �0.04 0.20nnn 0.14nnn 0.16nnn 0.18nnn �0.02(0.000) (0.000) (0.000) (0.000) (0.131) (0.000) (0.000) (0.000) (0.000) (0.331)
ROE(%) 538/465nn 0.67nnn 0.72nn 0.66nn �0.06 0.48 1.66nnn 0.67 0.10 �0.37(2.3) (25465) (4539) (8493) (0.7) (0.450) (0.004) (0.163) (0.679) (0.644)
ROA (%) 507/523 �0.06 0.27n �0.17 �0.44nn 0.26 0.32nn �0.07 �0.59n �0.85n
(0.309) (0.863) (0.060) (0.177) (0.023) (0.398) (0.029) (0.497) (0.073) (0.087)
L. Liao et al. / Journal of Financial Economics 113 (2014) 500–518510
Theory and empirical evidence show that a dual sharestructure misaligns the control and cashflow rights ofcontrolling shareholders, and negatively affects productiv-ity and profitability (Jensen and Meckling, 1976; Gompers,Ishii, and Metrick, 2008; Masulis, Wang, and Xie, 2009).Panel B of Table 2 reports the changes in operatingrevenue per employee and profit per employee as proxiesfor productivity. Operating revenue (profit) per employeeincreased significantly, by 41% (17%), 41% (19%), and 41%(15%) for the full sample, non-SOEs, and SOEs, respectively.However, there is no significant difference between SOEsand non-SOEs.
(footnote continued)
5.1.2. Operating efficiency and insolvency riskTable 3 reports the post-reform changes in firm oper-
ating efficiency and insolvency risk. For operating effi-ciency, the increases in the median accounts receivableturnover for all firms, non-SOEs, and SOEs are 4.51, 4.24,and 4.64 times, respectively, significant at the 1% level. Theincreases in the median accounts receivable turnover forgroups P, SL, SM, and SH are 3.78, 5.26, 4.46, and 4.60 times,respectively, significant at the 1% level. Firms on the onehand experienced efficiency gains, and on the other handbecame more discreet with credit sales, particularly duringthe global financial crisis in 2008–2009.27 The difference
27 The full-sample median accounts receivable turnover three yearsbefore the reform is 4.40. The full-sample median post-reform increase in
between SOEs and non-SOEs is, however, insignificant. Theratio of selling and financial expenses to operating revenueexhibits similar patterns for SOEs and non-SOEs with anincrease of 3%. We find mixed evidence on improvementsin operating efficiency with no significant differencebetween SOEs and non-SOEs. Panel B of Table 3 reportschanges in leverage and solvency proxies after the reform.The ratio of cash to total liabilities displays no significantchange in listed firms’ insolvency risk.
5.1.3. Corporate governancePanel A of Table 4 reports the percentage of firms
engaging in the three controlling shareholder agencyactivities discussed in Section 4.1.5. Before the reform,there were 43.4%, 29.7%, and 42.3% of firms in our sampleengaged in related-party transactions, related-party trans-actions with controlling shareholders, and lending tocontrolling shareholders. After the reform, the percentagesdropped to 35.7%, 24.0%, and 16.6%, respectively. Thepercentage of firms engaged in these agency activitiesmonotonically increases with state-ownership. After thereform, the percentage of SH firms engaged in related-party transactions decreased more than the private listed
operating revenue is 73%, while the median decrease in accountsreceivable is 13%. These results imply a median post-reform accountsreceivable turnover of 8.70, leading to a net change of 4.30, whichroughly matches the actual change of 4.51.

Table 3Post-reform changes in operating efficiency and insolvency risk.
This table reports changes in firm operating efficiency and insolvency risk three years before and after the reform. The sample consists of 1,032 firms thatcompleted the Split-share Structure Reform during 2005–2007. Wilcoxon signed-rank test is applied to examine the significance of changes in medians ofvariables. Wilcoxon Z-test is applied to examine the significance of difference in changes between groups. Proportion Z-test is used to test whether increase(decrease) odds are greater than one. The p-values are reported in parentheses. The definitions of SOE and non-SOE (Groups P, SL, SM, and SH) are the sameas in Table 1. The change is calculated as the level difference between post-reform and pre-reform values. Variables in italic are incomparable before andafter the revision of the Chinese Generally Accepted Accounting Principles effective in 2007, and reported only for reference. Superscripts n, nn, and nnn
denote the significance levels of 10%, 5%, and 1%, respectively.
Full sample By ultimate control By state-ownership
Increaseodds
Medianchange
Non-SOEs
SOEs SOEs�non-SOEs
P SL SM SH SH�P
Panel A: Operating efficiencyAccounts receivable
turnover806/209nnn 4.51nnn 4.24nnn 4.64nnn 0.39 3.78nnn 5.26nnn 4.46nnn 4.60nnn 0.82(0.000) (0.000) (0.000) (0.000) (0.464) (0.000) (0.000) (0.000) (0.000) (0.981)
Expense-to-sales ratio 714/280nnn 0.03nnn 0.03nnn 0.03nnn 0.00 0.03nnn 0.03nnn 0.03nnn 0.02nnn 0.00(0.000) (0.000) (0.000) (0.000) (0.715) (0.000) (0.000) (0.000) (0.000) (0.509)
Asset turnover 624/404nnn 0.08nnn 0.07nnn 0.09nnn 0.01 0.04 0.08nnn 0.10nnn 0.08nnn 0.05(0.000) (0.000) (0.000) (0.000) (0.302) (0.114) (0.000) (0.000) (0.000) (0.123)
Panel B: Insolvency riskCash-to-total liabilities ratio 547/485nn 0.01 0.01 0.02 0.01 �0.01 0.06nnn 0.03 �0.04nnn �0.03
(0.027) (0.857) (0.614) (0.866) (0.530) (0.625) (0.005) (0.510) (0.007) (0.242)Debt-to-asset ratio 696/336nnn 0.07nnn 0.05nnn 0.08nnn 0.03nnn 0.06nnn 0.03nnn 0.07nnn 0.11nnn 0.05nnn
(0.000) (0.000) (0.000) (0.000) (0.000) (0.000) (0.000) (0.000) (0.000) (0.010)Current ratio 388/644nnn �0.15nnn �0.07nnn �0.18nnn �0.11nnn �0.10n �0.08nnn �0.13nnn �0.25nnn �0.14n
(0.000) (0.000) (0.019) (0.000) (0.004) (0.076) (0.006) (0.000) (0.000) (0.082)
Table 4Post-reform change in corporate governance.
This table reports changes in corporate governance measures before and after the reform. The sample consists of 1,032 firms that completed the Split-share Structure Reform during 2005–2007. Panel A reports the percentage of firms engaged in agency activities. Panel B reports the median ratios of theamount of money involved in agency activities to operating revenue for firms engaged in these activities. Wilcoxon Z-test is applied to examine thesignificance of the difference between groups in Panel B. The p-values are reported in parentheses. The definitions of groups P, SL, SM, and SH are the same asin Table 1. Superscripts n, nn, and nnn denote the significance levels of 10%, 5%, and 1%, respectively.
Pre-reform Post-reform
Fullsample
P SL SM SH SH�P Fullsample
P SL SM SH SH�P
Panel A: Percentage of firms engaged in the agency activitiesRelated-party transaction 43.4% 39.7% 36.9% 45.9% 49.2% 9.4% 35.7% 29.9% 32.5% 39.0% 38.3% 8.4%Related-party trans. with controllingshareholders
29.7% 29.5% 22.7% 31.8% 34.9% 5.5% 24.0% 19.4% 20.0% 25.4% 28.8% 9.4%
Lending to controlling shareholders 42.3% 37.7% 40.0% 43.2% 46.1% 8.4% 16.6% 9.7% 11.5% 19.3% 22.4% 10.8%
Panel B: Median ratio of the amount of funds involved to operating revenueRelated-party transaction (%) 6.92 9.90 7.60 7.76 5.84 �4.06n 7.16 8.34 7.17 5.47 7.74 �0.58
(0.056) (0.660)Related-party trans. with controllingshareholders (%)
5.81 5.59 6.34 5.66 5.84 0.25 7.36 10.70 5.40 6.48 9.15 �1.55(0.725) (0.412)
Lending to controlling shareholders (%) 1.11 1.01 1.43 0.64 1.15 0.14 0.11 0.49 0.07 0.14 0.10 �0.39(0.645) (0.436)
L. Liao et al. / Journal of Financial Economics 113 (2014) 500–518 511
firms. However, the percentage of SH firms engaged inrelated-party transactions with controlling shareholdersand lending to controlling shareholders reduced lesscompared to firms in the private group. Panel B ofTable 4 shows that the results on the changes in therelative amount of funds involved in these agency activ-ities are also mixed. Overall, there is no consistent evi-dence that SOEs experienced greater improvements incorporate governance than non-SOEs, suggesting that theexpectation of privatization might quickly boost SOE out-put and profit, but did not change corporate governance.
5.1.4. The privatization effectTable 5 summarizes the privatization effect measured
by changes in SOE operating revenue and operating profit,and Fama-French model-adjusted stock returns, respec-tively. An average SOE's operating revenue and operatingprofit increased by 84% and 50%, respectively. Its adjustedstock return is 109%. The changes are statistically signifi-cant at the 1% level. SOEs exhibit 6% (3%) higher increase inoperating revenue, 2% (0%) higher increase in operatingprofit, and 6% (20%) higher stock return compared to theirbenchmark non-SOE portfolios, by size and industry (size

L. Liao et al. / Journal of Financial Economics 113 (2014) 500–518512
and market-to-book ratio), respectively. The results sug-gest that the Split-Share Structure Reform contains asignificant positive privatization effect, supporting H1.
Table 5The privatization effect.
This table reports the privatization effect measured by privatization-ledpost-reform changes in SOE operating revenue, operating profit, andstock return, respectively. The sample consists of 633 SOEs that com-pleted the Split-share Structure Reform during 2005–2007. Unadjustedchange in firm operating revenue (profit) is measured as the difference ofthe variable three years before and after the reform, normalized by pre-reform value. Unadjusted stock return is the three-year cumulative Fama-French model-adjusted return after the reform. In measuring the priva-tization effect, SOE operating revenue, operating profit, and stock returnare further adjusted by the median operating revenue, operating profit,and stock return of a matching non-SOE benchmark portfolio by size–industry and size–market-to-book ratio, respectively. The p-values ofWilcoxon signed-rank tests on the significance of changes in the mediansof variables are reported in parentheses. Superscripts n, nn, and nnn denotethe significance levels of 10%, 5%, and 1%, respectively.
Unadjusted Adj. by non-SOE size–industry portfolio
Adj. by non-SOEsize–M/B ratio
portfolio
Operatingrevenue
0.84nnn 0.06nnn 0.03nnn
(0.000) (0.000) (0.000)Operatingprofit
0.50nnn 0.02nnn 0.000nnn
(0.000) (0.000) (0.000)Stockreturn
1.09nnn 0.06 0.20nn
(0.000) (0.431) (0.019)
Table 6Post-reform changes in operational performance and state-ownership.
This table reports regression results of changes in firm operating revenue andcompleted the Split-share Structure Reform during 2005–2007. We follow Koenk50% (median), and 75% quantiles are reported. OLS regression results are reportt-Statistics are reported in parentheses. Superscripts n, nn, and nnn denote the si
Operating revenue
25%quantile
50%quantile
75%quantile
O
Intercept �94.92nnn �73.70nnn 27.69 24(4.9) (3.1) (0.5) (0
State�ownership (%) 0.46nnn 0.51nnn 0.83nn 0(2.7) (2.7) (2.3) (
Non-tradable-to-tradableratio
�0.08n �0.06 �0.19n �(1.8) (1.1) (1.7) (
Log of market cap. 34.64nnn 43.55nnn 51.19nnn 33.(7.5) (7.7) (4.3) (3
Regulated industry dummy �1.46 �4.27 7.69 16(0.1) (0.3) (0.2) (0
H-share dummy 35.07 15.68 �80.86 �1(0.9) (0.8) (1.5) (0
B-share dummy �27.59nn �51.49nnn �42.84 �3(2.0) (2.9) (0.9) (
Year 2005 dummy 97.16nnn 135.37nnn 183.85nnn 15(4.8) (5.9) (4.0) (4
Year 2006 dummy 30.57nn 34.99nn 6.79 11(2.3) (2.2) (0.2) (0
Wald test for state-ownership
7.37nnn 7.07nnn 5.06nn F-stat¼AdjR2¼
5.2. Sources of the privatization effect
This section analyzes the significance of the privatizationeffect and explores its source. The evidence shows thatprivatization-led improvements to post-reform SOE perfor-mance are positively correlated to the supportive activities ofgovernment agents, suggesting that their incentive plays animportant role in shaping the privatization effect. Post-reform sales of state-owned shares are negatively correlatedto the improvements to SOE performance, indicating thatcontrol dilution works as a punitive mechanism to govern-ment agents who fail to increase state-owned share valueafter the reform. Besides aligning the interests of thegovernment and public investors, the market mechanismplays an effective information discovery role in facilitatingprivatization embedded in the reform.
5.2.1. The existence of the privatization effectWe formally test H1, that is, SOEs experienced signifi-
cantly stronger post-reform improvement in performancethan non-SOEs, using the regressions specified in Eq. (2).In Table 6, the quantile regression results indicate thatpost-reform increase in operating revenue is positively andsignificantly correlated to state-ownership. The coeffi-cients of state-ownership are 0.46, 0.51, and 0.83 for the25%, 50% (median), and 75% quantiles, respectively. Thet-statistics show statistical significance at the 1%, 1%, and5% levels, respectively. Graph A in Fig. 1 illustrates theestimates of the coefficients of state-ownership for regres-sions over the quantile spectrum. The post-reform change
operating profit on state-ownership for the full sample of 1,032 firms thater and Bassett (1978) to apply quantile regressions. The results for the 25%,ed for reference. Data are winsorized at the 1% level for OLS regressions.gnificance levels of 10%, 5%, and 1%, respectively.
Operating profit
LS 25%quantile
50%quantile
75%quantile
OLS
.64 �45.11nn �20.04 96.27 144.87nnn
.5) (2.3) (0.7) (1.3) (2.7).52 0.07 0.34 1.05nn 0.511.5) (0.4) (1.5) (2.4) (1.3)0.11 �0.07 �0.04 �0.20 �0.101.0) (1.6) (0.6) (1.3) (0.8)92nnn 27.15nnn 30.93nnn 39.20nnn 27.50nnn
.6) (6.1) (4.8) (3.1) (2.5)
.41 �2.61 �16.94 �30.74 �35.93
.6) (0.1) (0.7) (0.8) (1.0)4.42 34.98 13.33 �77.80 �11.61.3) (0.9) (0.6) (0.6) (0.2)2.67 �8.82 �33.98nn �45.96 �74.95nn
1.0) (0.7) (2.1) (1.3) (2.1)0.20 57.13nnn 73.48nnn 99.63 52.87.4) (3.7) (2.8) (1.3) (1.3).45 14.20 16.62 �23.40 �28.90.4) (1.3) (0.9) (0.5) (0.9)
5.44nnn 0.15 2.35 5.87nn F-stat¼3.08nnn
usted5.45%
AdjustedR2¼2.68%

Fig. 1. Coefficients of state-ownership in quantile regressions. This figure depicts the estimates of the coefficients of state-ownership in the quantileregressions of changes in firm operating revenue and operating profit for the full sample of 1,032 firms that completed the Split-share Structure Reformduring 2005–2007. The quantile regression method follows that in Koenker and Bassett (1978). The solid line represents coefficient values within a 0–100%quantile range. The gray area represents 95% confidence interval. Graph A: Operating revenue, Graph B: Operating profit.
Table 7Post-reform stock return and state-ownership.
This table reports regression results of the Fama-French three-factor model adjusted stock return on state-ownership for the full sample of 1,032 firmsthat completed the Split-share Structure Reform during 2005–2007. We follow Koenker and Bassett (1978) to apply quantile regressions. The regressionresults for the 25%, 50% (median), and 75% quantiles are reported. OLS regression results are reported for reference. Data are winsorized at the 1% level forOLS regressions. t-Statistics are reported in parentheses. Superscripts n, nn, and nnn denote the significance levels of 10%, 5%, and 1%, respectively.
25% quantile 50% quantile 75% quantile OLS
Intercept138.69nnn 231.92nnn 321.67nnn 206.14nnn
(4.6) (8.0) (11.8) (7.0)
State-ownership (%)0.70nn 0.54nn �0.14 0.57nn
(2.4) (2.3) (0.4) (2.1)
Non-tradable-to-tradable ratio�0.42nnn �0.29nnn �0.33nnn �0.33nnn
(4.2) (3.6) (3.6) (3.9)
Change in operating revenue0.40 0.20 0.78 0.64(0.4) (0.2) (0.3) (1.3)
Change in operating profit0.15 0.21 0.25 0.20nn
(0.2) (0.3) (0.3) (2.0)
Log of market cap.�15.93nn �28.40nnn �28.31nnn �35.55nnn
(2.4) (3.8) (3.2) (4.6)
Regulated industry dummy�31.75 �45.65nn �43.10 �48.14nn
(1.5) (2.0) (1.6) (2.0)
H-share dummy�60.66 �69.08 9.01 �21.79(1.4) (1.6) (0.1) (0.5)
B-share dummy�122.59nn �133.74nnn �154.95nnn �130.49nnn
(4.7) (7.5) (6.2) (5.4)
Year 2005 dummy�43.65nnn �49.72nnn �2.43 �8.74
(2.6) (3.9) (0.1) (0.5)
Wald test for state-ownership 5.87nn 5.04nn 0.12F-stat¼5.21nnn
Adjusted R2¼6.81%
L. Liao et al. / Journal of Financial Economics 113 (2014) 500–518 513
in operating revenue is positively correlated to state-ownership for all quantiles.
Post-reform increase in operating profit is positively cor-related to state-ownership in the 25%, 50% (median), and 75%quantiles, respectively, significant at the 5% level for the 75%quantile. Graph B in Fig. 1 shows that the positive correlationbetween increase in operating profit and state-ownership ismore pronounced for firms with high profit growth.
Table 7 reports the regression results of stock performancemeasured by the Fama-French three-factor model-adjustedstock returns. The coefficients of state-ownership are positiveand significant for the 25% and 50% (median) quantiles. Both
the fundamental performance and stock return results sup-port H1 in that improvements to SOE performance werestronger than those to non-SOE performance, highlighting apositive and significant privatization effect.
5.2.2. Government agents' incentives and the privatizationeffect
We test H2, that is, privatization-led improvements toSOE performance are positively correlated to governmentagents' supportive activities, using the regressions speci-fied in Eq. (3). Table 8 reports the 50% quantile (median)regression results. It shows that privatization-led changes
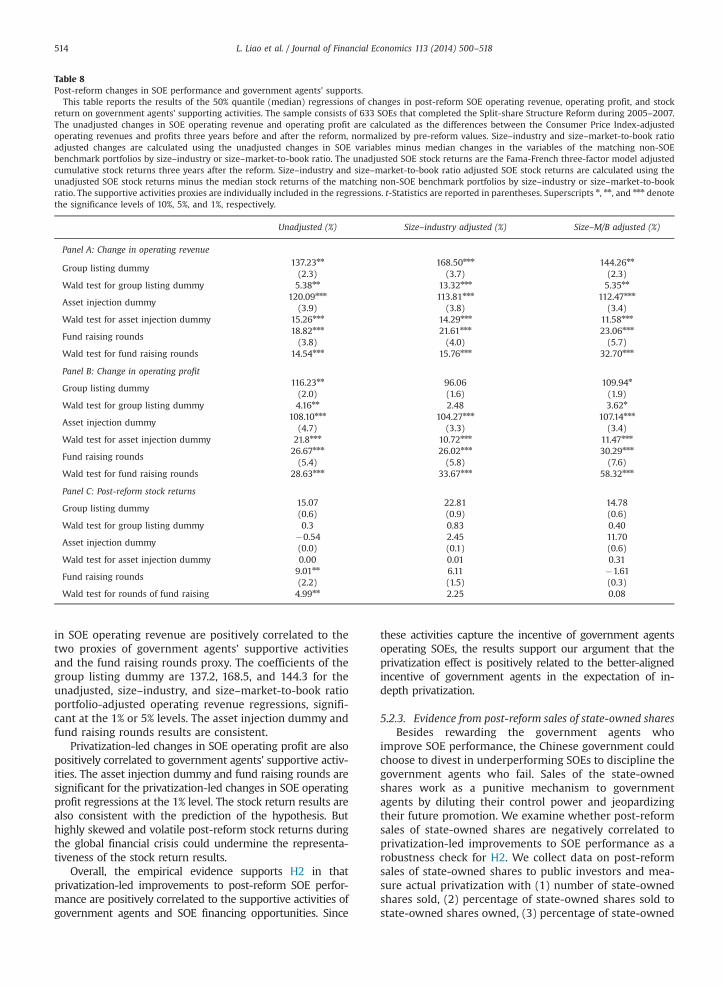
Table 8Post-reform changes in SOE performance and government agents' supports.
This table reports the results of the 50% quantile (median) regressions of changes in post-reform SOE operating revenue, operating profit, and stockreturn on government agents’ supporting activities. The sample consists of 633 SOEs that completed the Split-share Structure Reform during 2005–2007.The unadjusted changes in SOE operating revenue and operating profit are calculated as the differences between the Consumer Price Index-adjustedoperating revenues and profits three years before and after the reform, normalized by pre-reform values. Size–industry and size–market-to-book ratioadjusted changes are calculated using the unadjusted changes in SOE variables minus median changes in the variables of the matching non-SOEbenchmark portfolios by size–industry or size–market-to-book ratio. The unadjusted SOE stock returns are the Fama-French three-factor model adjustedcumulative stock returns three years after the reform. Size–industry and size–market-to-book ratio adjusted SOE stock returns are calculated using theunadjusted SOE stock returns minus the median stock returns of the matching non-SOE benchmark portfolios by size–industry or size–market-to-bookratio. The supportive activities proxies are individually included in the regressions. t-Statistics are reported in parentheses. Superscripts n, nn, and nnn denotethe significance levels of 10%, 5%, and 1%, respectively.
Unadjusted (%) Size–industry adjusted (%) Size–M/B adjusted (%)
Panel A: Change in operating revenue
Group listing dummy137.23nn 168.50nnn 144.26nn
(2.3) (3.7) (2.3)Wald test for group listing dummy 5.38nn 13.32nnn 5.35nn
Asset injection dummy120.09nnn 113.81nnn 112.47nnn
(3.9) (3.8) (3.4)Wald test for asset injection dummy 15.26nnn 14.29nnn 11.58nnn
Fund raising rounds18.82nnn 21.61nnn 23.06nnn
(3.8) (4.0) (5.7)Wald test for fund raising rounds 14.54nnn 15.76nnn 32.70nnn
Panel B: Change in operating profit
Group listing dummy116.23nn 96.06 109.94n
(2.0) (1.6) (1.9)Wald test for group listing dummy 4.16nn 2.48 3.62n
Asset injection dummy108.10nnn 104.27nnn 107.14nnn
(4.7) (3.3) (3.4)Wald test for asset injection dummy 21.8nnn 10.72nnn 11.47nnn
Fund raising rounds26.67nnn 26.02nnn 30.29nnn
(5.4) (5.8) (7.6)Wald test for fund raising rounds 28.63nnn 33.67nnn 58.32nnn
Panel C: Post-reform stock returns
Group listing dummy15.07 22.81 14.78(0.6) (0.9) (0.6)
Wald test for group listing dummy 0.3 0.83 0.40
Asset injection dummy�0.54 2.45 11.70(0.0) (0.1) (0.6)
Wald test for asset injection dummy 0.00 0.01 0.31
Fund raising rounds9.01nn 6.11 �1.61(2.2) (1.5) (0.3)
Wald test for rounds of fund raising 4.99nn 2.25 0.08
L. Liao et al. / Journal of Financial Economics 113 (2014) 500–518514
in SOE operating revenue are positively correlated to thetwo proxies of government agents’ supportive activitiesand the fund raising rounds proxy. The coefficients of thegroup listing dummy are 137.2, 168.5, and 144.3 for theunadjusted, size–industry, and size–market-to-book ratioportfolio-adjusted operating revenue regressions, signifi-cant at the 1% or 5% levels. The asset injection dummy andfund raising rounds results are consistent.
Privatization-led changes in SOE operating profit are alsopositively correlated to government agents' supportive activ-ities. The asset injection dummy and fund raising rounds aresignificant for the privatization-led changes in SOE operatingprofit regressions at the 1% level. The stock return results arealso consistent with the prediction of the hypothesis. Buthighly skewed and volatile post-reform stock returns duringthe global financial crisis could undermine the representa-tiveness of the stock return results.
Overall, the empirical evidence supports H2 in thatprivatization-led improvements to post-reform SOE perfor-mance are positively correlated to the supportive activities ofgovernment agents and SOE financing opportunities. Since
these activities capture the incentive of government agentsoperating SOEs, the results support our argument that theprivatization effect is positively related to the better-alignedincentive of government agents in the expectation of in-depth privatization.
5.2.3. Evidence from post-reform sales of state-owned sharesBesides rewarding the government agents who
improve SOE performance, the Chinese government couldchoose to divest in underperforming SOEs to discipline thegovernment agents who fail. Sales of the state-ownedshares work as a punitive mechanism to governmentagents by diluting their control power and jeopardizingtheir future promotion. We examine whether post-reformsales of state-owned shares are negatively correlated toprivatization-led improvements to SOE performance as arobustness check for H2. We collect data on post-reformsales of state-owned shares to public investors and mea-sure actual privatization with (1) number of state-ownedshares sold, (2) percentage of state-owned shares sold tostate-owned shares owned, (3) percentage of state-owned

Table 9Post-reform sales of state-owned shares and SOE performance.
This table reports the statistics of post-reform sales of state-owned shares as of October 2011. The sample consists of 633 SOEs that completed the Split-share Structure Reform during 2005–2007. Panel A reports the number of firms, number of state-owned shares sold, ratio of state-owned shares sold tototal shares outstanding, and percentage of state-shareholders involved in the sales. We apply two-tail t-test to examine the statistical significance of thesevariables. t-Statistics are reported in parentheses except for column 2. Panel B reports the Pearson correlations between post-reform sales of state-ownedshares and post-reform change in SOE operating revenue. Superscripts n, nn, and nnn denote the significance levels of 10%, 5%, and 1%, respectively.
Panel A: Post-reform sales of state-owned shares
Industry Obs. Number (% inparentheses) of SOEssold state-owned shares
Avg. number ofshares sold per SOE(in millions)
Avg. % of state-owned shares sold toowned per SOE
Avg. % of state-ownedshares sold tooutstanding per SOE
Avg. % of state-shareholdersinvolved in thesales
Full sample 633 160 5.13nnn 2.95nnn 0.44nnn 31nnn
(25.3%) (9.6) (5.8) (11.0) (12.7)Utilities 69 10 3.69nnn 2.66n 0.25nnn 20nnn
(14.5%) (2.7) (1.7) (2.5) (3.0)Real estate 31 8 4.72nn 1.24nn 0.59nn 26nnn
(25.8%) (2.4) (2.4) (2.1) (3.2)Comprehensive 87 25 4.87nnn 2.32nnn 0.47nnn 38nnn
(28.7%) (4.7) (3.2) (5.4) (4.9)Manufacturing 394 108 5.94nnn 3.01nnn 0.46nnn 33nnn
(27.4%) (7.7) (5.0) (9.3) (10.6)Commercial 52 9 1.53nnn 4.91 0.34nn 19nn
(17.3%) (2.6) (1.4) (2.3) (3.1)
Panel B: Correlations between sales of state-owned shares and changes in SOE operating revenue
Number ofsales of state-owned shares
Number of state-ownedshares sold (in millions)
% Of state-ownedshares sold to
owned
% Of state-ownedshares sold to shares
outstanding
% Of state-shareholdersinvolved in the sales
Unadjusted �0.08nn �0.08nn �0.02 �0.07n �0.09nn
Size–industryadjusted
�0.10nnn �0.11nnn 0.00 �0.09nn �0.11nnn
Size–M/B ratioadjusted
�0.09nn �0.11nnn 0.00 �0.08n �0.10nnn
L. Liao et al. / Journal of Financial Economics 113 (2014) 500–518 515
shares sold to total shares outstanding, and (4) percentageof state-shareholders involved in the sales.
Panel A of Table 9 shows that state-shareholders in 160out of 633 SOEs in our sample sold 2.95% of state-ownedshares to public investors as of October 2011.28 Thecomprehensive firms had the highest percentage of firmsthat sold state-owned shares, 28.7%, whereas the utilityfirms had the lowest 14.5%.29 An average firm sold 5.13million shares, comprising 0.44% of total shares outstand-ing, with 31% state-shareholders involved. The pattern issimilar across all five industries. Privatization appeared totake place only on a small scale after the reform.
Panel B of Table 9 reports the correlations betweenpost-reform sales of state-owned shares and privatization-led improvements to SOE operating performance. Numberof sales of state-owned shares, number of state-ownedshares sold, percentage of state-owned shares sold to totalshares outstanding, and percentage of state-shareholdersinvolved are all negatively and significantly correlated to
28 The statistics could slightly underestimate the actual sales of state-owned shares, because only sales of shares exceeding 1% of total sharesoutstanding are required to be publicly disclosed. Given that most sales ofstate-owned shares are in large quantity, our results provide imperfectbut reasonable estimates.
29 A listed firm is classified as comprehensive if it is not in the utility,real estate, manufacturing, or commercial industries.
changes in SOE performance. The results show that thegovernment indeed divested in underperforming SOEsafter the reform, supporting our prior that improvementsto post-reform SOE performance were driven by theincentive of government agents in increasing state-owned share value.
5.2.4. Information discovery role of the market mechanismWe examine whether the incentives of government
agents and expectation of privatization, and informationon firm quality were effectively communicated throughthe market mechanism adopted in the reform. Table 10reports the 50% quantile (median) regression results intesting H3. It shows that privatization-led improvementsto SOE operating revenue and operating profit are nega-tively and significantly correlated to consideration, andpositively correlated to public investors’ reform planapproval rate, supporting H3. Fig. 2 confirms the robust-ness of these findings.
The evidence implies that through the market mechan-ism, government agents communicate their privatization-led incentives of improving SOE performance and firmquality information with public investors in exchange fortheir support for the reform. Public investors trade offreceiving higher lump sum consideration at the reformstage versus benefiting from greater improvements topost-reform SOE performance. Moreover, they tend to

Table 10Post-reform changes in SOE performance and the market mechanism.
This table reports the results of the 50% quantile (median) regressions of changes in post-reform SOE operating revenue, operating profit, and stockreturn on consideration and public investor reform plan approval rate. The sample consists of 633 SOEs that completed the Split-share Structure Reformduring 2005–2007. The unadjusted changes in SOE operating revenue and operating profit are calculated as the differences between the CPI-adjustedrevenues and profits three years before and after the reform, normalized by pre-reform values. Size–industry and size–market-to-book ratio adjustedchanges are calculated using the unadjusted changes in SOE variables minus median changes in the variables of the matching non-SOE benchmarkportfolios by size–industry or size–market-to-book ratio. The unadjusted SOE stock returns are the Fama-French three-factor model-adjusted cumulativestock returns three years after the reform. Size–industry and size–market-to-book ratio adjusted SOE stock returns are calculated using the unadjusted SOEstock returns minus the median stock returns of the matching non-SOE benchmark portfolios by size–industry or size–market-to-book ratio. t-Statistics arereported in parentheses. Superscripts n, nn, and nnn denote the significance levels of 10%, 5%, and 1%, respectively.
Change in operating revenue Change in operating profit Post-reform stock return
Unadjusted(%)
Size–ind. adj.(%)
Size–M/B adj.(%)
Unadjusted(%)
Size–ind. adj.(%)
Size–M/B adj.(%)
Unadjusted(%)
Size–ind. adj.(%)
Size–M/Badj. (%)
Consideration �1.06nnn �0.84nnn �1.16nnn �0.81n �0.72n �1.10nnn 0.63 0.72 0.64(3.1) (2.5) (3.2) (1.9) (1.7) (2.4) (1.1) (1.6) (1.6)
Approval rate (%) 1.45n 1.73nn 1.97nn 2.02nn 1.61n 2.42nnn 0.04 �0.07 2.46nn
(1.8) (2.0) (2.3) (2.0) (1.7) (2.6) (0.1) (0.1) (2.2)State-ownership (%) 0.17 0.35 0.03 �0.22 0.08 �0.36 0.00 0.09 0.11
(0.6) (1.2) (0.1) (0.7) (0.2) (1.2) (0.0) (0.2) (0.3)Controls Yes Yes Yes Yes Yes Yes Yes Yes Yes
Wald test forconsideration
9.79nnn 6.10nnn 10.52nnn 3.57n 2.82n 5.97nnn 1.19 0.05 2.44
Wald test forapproval rate
3.15n 3.91nn 5.14nn 3.81nn 2.83n 6.57nnn 0.13 0.11 4.75nn
Fig. 2. Coefficients of consideration and reform plan approval rate in quantile regressions for privatization-led improvements to SOE performance. Thisfigure depicts the estimates of the coefficients of consideration and public investor reform plan approval rate in quantile regressions. The dependentvariables are changes in the size–industry adjusted SOE operating revenue and operating profit. The quantile regression method follows that in Koenkerand Bassett (1978). The solid line represents coefficient values within a 0–100% quantile range. The gray area represents 95% confidence interval. Graph A:Size–industry adjusted operating revenue, Graph B: Size–industry adjusted operating profit.
L. Liao et al. / Journal of Financial Economics 113 (2014) 500–518516

L. Liao et al. / Journal of Financial Economics 113 (2014) 500–518 517
approve reform plans with higher approval rates whenstronger SOE performance is expected. Besides balancingthe interests of the government and public investors, themarket mechanism plays an information discovery role infacilitating privatization in the reform. It is an importantelement for the success of the reform and privatization.
6. Conclusions
The Split-Share Structure Reform was a landmark eventin China's financial liberalization. It converted non-tradable state-owned shares into tradable shares, enablingin-depth privatization of listed SOEs. We find that SOEsexperienced remarkable increases in output and employ-ment without sacrificing operating efficiency. The expec-tation of privatization stimulated the incentive ofgovernment agents operating SOEs to take quick measuresto improve SOE performance. We do not find that thereform improved SOE corporate governance without fun-damentally changing their ownership structure. In con-trast to the evidence found in other transitional economiesthat new management helps improve post-privatizationfirm performance, our results show that stimulatingincumbent management's incentive with expectation ofprivatization also has positive effects. Market mechanismis more effective than crude top-down privatization ordersin making privatization happen when China enters into anin-depth reform era. It played an important role in aligningthe interests of government and public investors. Thesepositive elements of the Split-Share Structure Reformprovide useful policy implications for China's continuedeconomic reforms.
References
Allen, F., Qian, J., Qian, M., 2005. Law, finance, and economic growth inChina. Journal of Financial Economics 77, 57–116.
Bai, C., Li, D., Wang, Y., 1997. Enterprise productivity and efficiency: whenis up really down? Journal of Comparative Economics 24, 265–280.
Biais, B., Perotti, E., 2002. Machiavellian privatization. American EconomicReview 92, 240–258.
Black, B., Kraakman, R., Tarassova, A., 2000. Russian privatization andcorporate governance: What went wrong. Stanford Law Review 52,1731–1803.
Bortolotti, B., Beltratti, A., 2006. The nontradable share reform in theChinese stock market. Unpublished working paper. Università diTorino and Bocconi University.
Boubakri, N., Cosset, J.-C., 1998. The financial and operating performanceof newly privatized firms: evidence from developing countries.Journal of Finance 53, 1081–1110.
Boubakri, N., Cosset, J.-C., 2002. Does privatization meet the expecta-tions? Evidence from African countries. Journal of African Economics11, 111–140.
Boubakri, N., Cosset, J.-C., Guedhami, O., 2005. Postprivatization corporategovernance: the role of ownership structure and investor protection.Journal of Financial Economics 76, 369–399.
Boycko, M., Shleifer, A., Vishny, R., 1996. A theory of privatisation.Economic Journal 106, 309–319.
Brada, J., 1996. A privatization is transition—or is it? Journal of EconomicPerspectives 10, 67–86.
Chen, H., Wang, H., Zhou, H., 2013. Stock return volatility and capitalstructure decisions. Unpublished working paper. Massachusetts Insti-tute of Technology and Tsinghua University.
Chen, Q., Chen, X., Schipper, K., Xu, Y., Xue, J., 2012. The sensitivity ofcorporate cash holdings to corporate governance. Review of FinancialStudies 25, 3610–3644.
Cheung, Y.-L., Rau, R., Stouraitis, A., 2006. Tunneling, propping, andexpropriation: evidence from connected party transactions in HongKong. Journal of Financial Economics 82, 343–386.
China Securities Regulatory Commission, 2008. China capital marketsdevelopment report. China Financial Publishing House, Beijing.
Deng, J., Gan, J., He, J., 2008. The dark side of concentrated ownership inprivatization: Evidence from China. Unpublished working paper.Hong Kong University of Science and Technology.
Dewenter, K., Malatesta, P., 2001. State-owned and privately ownedfirms: an empirical analysis of profitability, leverage, and laborintensity. American Economic Review 91, 320–334.
Ding, Y., Su, X., 2008. Implementation of IFRS in a regulated market.Journal of Accounting and Public Policy 27, 474–479.
Fama, E., French, K., 1993. Common risk factors in the returns on stocksand bonds. Journal of Financial Economics 33, 3–56.
Firth, M., Lin, C., Zou, H., 2010. Friend or foe? The role of state and mutualfund ownership in the Split Share Structure Reform in China. Journalof Financial and Quantitative Analysis 45, 685–706.
Gompers, P., Ishii, J., Metrick, A., 2008. Extreme governance: an analysis ofdual-class companies in the United States. Review of Financial Studies23, 1051–1088.
Grossman, S., Hart, O., 1988. One share one vote and the market forcorporate control. Journal of Financial Economics 20, 323–336.
Harper, J., 2002. The performance of privatized firms in the CzechRepublic. Journal of Banking and Finance 26, 621–649.
Hwang, C., Zhang, S., Zhu, Y., 2006. Float liquidity, speculation, and stockprices: evidence from the Share Structure Reform in China. Unpub-lished working paper. Nanyang Technological University.
Inoue, T., 2005. Reform of China's split-share structure takes shape.Nomura Capital Market Review 8, 42–59.
Jensen, M., Meckling, W., 1976. Theory of the firm: managerial behavior,agency costs and ownership structure. Journal of Financial Economics3, 305–360.
Koenker, R., Bassett, G., 1978. Regression quantiles. Econometrica 46,33–50.
LaPorta, R., Lopez-de-Silance, F., Shleifer, A., 1999. Corporate ownershiparound the world. Journal of Finance 44, 471–517.
Li, K., Wang, T., Cheung, Y.-L., Jiang, P., 2011. Privatization and risk sharing:evidence from the Split Share Structure Reform in China. Review ofFinancial Studies 24, 2499–2525.
Liao, L., Liu, B., Wang, H., 2011. Information discovery in share lockups:evidence from the Split-Share Structure Reform in China. FinancialManagement 40, 1001–1027.
Liao, L., Liu, B., Zhang, W., 2010. Ten-year perspective of Chinese capitalmarkets. Unpublished working paper. Tsinghua University.
Lin, C., 2000. Corporate governance of state-owned enterprises in China.Unpublished working paper. World Bank.
Lin, Y., Cai, F., Li, Z., 1998. Competition, policy burdens, and state-ownedenterprise reform. American Economic Review 88, 422–427.
Liu, C., Uchinda, K., Yang, Y., 2014. Controlling shareholder, Split-shareStructure Reform and cash dividends payments in China. Interna-tional Review of Economics & Finance 29, 339–357.
Lu, F., Balatbat, M., Czernkowski, R., 2008. The role of consideration inChina's Split Share Structure Reform. Unpublished working paper.University of New South Wales.
Martin, S., Parker, D., 1995. Privatization and economic performancethroughout the UK business cycle. Managerial and Decision Econom-ics 16, 225–237.
Masulis, R., Wang, C., Xie, F., 2009. Agency problems at dual-classcompanies. Journal of Finance 64, 1697–1727.
Megginson, W., Nash, R., Netter, J., Poulsen, A., 2004. The choice betweenprivate and public markets: evidence from privatizations. Journal ofFinance 59, 2835–2870.
Megginson, W., Neffer, J., 2001. From state to market: a survey ofempirical studies on privatization. Journal of Economic Literature 39,321–389.
Megginson, W., Nash, R., Randenborgh, M., 1994. The financial andoperating performance of newly privatized firms: an internationalempirical analysis. Journal of Finance 49, 403–452.
Peng, S., Bewley, K., 2010. Adaptability to fair value accounting in anemerging economy: a case study of China's IFRS convergence.Accounting, Auditing and Accountability Journal 23, 982–1011.
Perotti, E., 1995. Credible privatization. American Economic Review 85,847–859.
Pontiff, J., Schall, L., 1998. Book-to-market ratios as predictors of marketreturns. Journal of Financial Economics 49, 141–160.
Sheshinski, E., Lopez-Calva, L., 2003. Privatization and its benefits: theoryand evidence. CESifo Economic Studies 49, 429–459.

L. Liao et al. / Journal of Financial Economics 113 (2014) 500–518518
Shleifer, A., Vishny, R., 1997. A survey of corporate governance. Journal ofFinance 42, 737–783.
Song, Z., Storesletten, K., Zilibotti, F., 2011. Growing like China. AmericanEconomic Review 101, 196–233.
Stiglitz, J., 2002. Globalization and Its Discontents. W.W. Norton &Company, New York.
Sun, Q., Tong, W., 2003. China share issue privatization: the extent of itssuccess. Journal of Financial Economics 70, 183–222.
Xiong, W., Yu, J., 2011. The Chinese warrants bubble. American EconomicReview 101, 2723–2753.
Xu, D., Cai, Y., Xu, M., 2005. Management shareholding and corporateperformance: evidence from MBOs of listed Chinese firms. Manage-ment Science, 40–47. (in Chinese).