Journal of Environmental Research, DOI 10.5755/j01.erem.75 ...
16
55 Environmental Research, Engineering and Management 2019/75/3 Flood Damage Assessment: A Preliminary Study EREM 75/3 Journal of Environmental Research, Engineering and Management Vol. 75 / No. 3 / 2019 pp. 55-70 DOI 10.5755/j01.erem.75.3.22433 Flood Damage Assessment: A Preliminary Study Received 2019/01 Accepted after revision 2019/11 http://dx.doi.org/10.5755/j01.erem.75.3.22433 *Corresponding author: [email protected] Siti Hajar Mohd Mushar Center for Advanced Computing Technology (C-ACT), Fakulti Teknologi Maklumat dan Komunikasi (FTMK), Universiti Teknikal Malaysia Melaka (UTeM), Hang Tuah Jaya, Durian Tunggal, 76100 Malacca, Malaysia Sharifah Sakinah Syed Ahmad* Center for Advanced Computing Technology (C-ACT), Fakulti Teknologi Maklumat dan Komunikasi (FTMK), Universiti Teknikal Malaysia Melaka (UTeM), Hang Tuah Jaya, Durian Tunggal, 76100 Malacca, Malaysia The importance of flood damage assessment has been highlighted by the government as well as by many researchers. Nevertheless, the effort in performing the damage studies is less to be found due to the lack of awareness and some other limitations related to the data and its methodologies. The flood damage data in fact is part of an essential ingredient in developing the flood mitigation policy as well as in evaluating the effectiveness of the current flood reduction measures. However, unlike other kinds of flood risk quantification studies, damage assessment is the one that is less addressed by researchers. This paper mainly provides a brief introduction towards the flood damage assessment, and certain essential element that need to be taken into consideration have been highlighted. An analysis of previous flood damage assessment studies and dis- cussion towards some critical issues are presented in this paper other than proposing a granular fuzzy system for enhancement in flood assessment for quality risk analysis. Keywords: flood damage assessment, review, types of damage, fuzzy approach, damage model. Fauziah Kasmin Center for Advanced Computing Technology (C-ACT), Fakulti Teknologi Maklumat dan Komunikasi (FTMK), Universiti Teknikal Malaysia Melaka (UTeM), Hang Tuah Jaya, Durian Tunggal, 76100 Malacca, Malaysia Emaliana Kasmuri Center for Advanced Computing Technology (C-ACT), Fakulti Teknologi Maklumat dan Komunikasi (FTMK), Universiti Teknikal Malaysia Melaka (UTeM), Hang Tuah Jaya, Durian Tunggal, 76100 Malacca, Malaysia Introduction Earth is one of the planets in our solar system and its surface is covered by water as well as continents and islands, which are represented by a composition of 71% and 29%, respectively (Hassan, 2013; U. S. Geological Survey, n.d.). Abundance sources of wa- ter make the earth become more vulnerable towards
Transcript of Journal of Environmental Research, DOI 10.5755/j01.erem.75 ...

55Environmental Research, Engineering and Management 2019/75/3
Flood Damage Assessment: A Preliminary Study
EREM 75/3Journal of Environmental Research, Engineering and ManagementVol. 75 / No. 3 / 2019pp. 55-70DOI 10.5755/j01.erem.75.3.22433
Flood Damage Assessment: A Preliminary Study
Received 2019/01 Accepted after revision 2019/11
http://dx.doi.org/10.5755/j01.erem.75.3.22433
*Corresponding author: [email protected]
Siti Hajar Mohd MusharCenter for Advanced Computing Technology (C-ACT), Fakulti Teknologi Maklumat dan Komunikasi (FTMK), Universiti Teknikal Malaysia Melaka (UTeM), Hang Tuah Jaya, Durian Tunggal, 76100 Malacca, Malaysia
Sharifah Sakinah Syed Ahmad*Center for Advanced Computing Technology (C-ACT), Fakulti Teknologi Maklumat dan Komunikasi (FTMK), Universiti Teknikal Malaysia Melaka (UTeM), Hang Tuah Jaya, Durian Tunggal, 76100 Malacca, Malaysia
The importance of flood damage assessment has been highlighted by the government as well as by many researchers. Nevertheless, the effort in performing the damage studies is less to be found due to the lack of awareness and some other limitations related to the data and its methodologies. The flood damage data in fact is part of an essential ingredient in developing the flood mitigation policy as well as in evaluating the effectiveness of the current flood reduction measures. However, unlike other kinds of flood risk quantification studies, damage assessment is the one that is less addressed by researchers. This paper mainly provides a brief introduction towards the flood damage assessment, and certain essential element that need to be taken into consideration have been highlighted. An analysis of previous flood damage assessment studies and dis-cussion towards some critical issues are presented in this paper other than proposing a granular fuzzy system for enhancement in flood assessment for quality risk analysis.
Keywords: flood damage assessment, review, types of damage, fuzzy approach, damage model.
Fauziah KasminCenter for Advanced Computing Technology (C-ACT), Fakulti Teknologi Maklumat dan Komunikasi (FTMK), Universiti Teknikal Malaysia Melaka (UTeM), Hang Tuah Jaya, Durian Tunggal, 76100 Malacca, Malaysia
Emaliana KasmuriCenter for Advanced Computing Technology (C-ACT), Fakulti Teknologi Maklumat dan Komunikasi (FTMK), Universiti Teknikal Malaysia Melaka (UTeM), Hang Tuah Jaya, Durian Tunggal, 76100 Malacca, Malaysia
IntroductionEarth is one of the planets in our solar system and its surface is covered by water as well as continents and islands, which are represented by a composition
of 71% and 29%, respectively (Hassan, 2013; U. S. Geological Survey, n.d.). Abundance sources of wa-ter make the earth become more vulnerable towards
Environmental Research, Engineering and Management 2019/75/356
natural catastrophes like flood and tsunami. General-ly, natural catastrophes such as flood, tsunami, earth-quake, storm and landslide are events that naturally occur, which is unpredictable, unavoidable and uncer-tain. The world natural catastrophes from the year 1980 until the year 2016 show that meteorological events maintain to be the main contributors towards world natural catastrophes, which are followed by hy-drological events (Geo Risk Research, n.d.).
This study focuses on one of the hydrological events, flood. Literally, flood is defined as any rise in the nor-mal water level due to natural or human-induced causes that result in water in the river or the stream to flow towards the land that is often not covered by water (Gasim et al., 2014; Jonkman, 2007; Maidin et al., 2014; Pamučar et al., 2014; Sulaiman et al., 2012; Yeganeh et al., 2014). There are several types of the flood that have been pronounced by Hammond et al. (2015), Opolot (2013) and Gasim et al. (2014), which are monsoon flood, coastal flood, pluvial flood, groundwater flood and flash flood. Flood can be con-sidered as the most devastating phenomenon that will affect the environment, economics, politics, so-cial and psychological conditions of the flood-affected region either in a direct or indirect way (Jonkman et al., 2008; Sulaiman et al., 2012; Yeganeh et al., 2014). This can be supported by the report released by Geo Risk Research (n.d.) where the flood is listed among top three of the costliest natural events between pe-riod 2005–2016 after an earthquake and a storm with a total damage of 342,703 million USD. Back in 2011, Thailand had the highest annual rainfall over the past 61 years, and approximately an area of 30,000 km² was flooded where its severity rate was ranked in the top fifth of the Thailand flood history since 1995 (Gale & Saunders, 2013). Meanwhile, for the worldwide view, the event has been reported by the Geo Risk Research (n.d.) to be in the top 10 of the world costli-est events since the past 35 years with an estimated damage of 43,000 million USD and 813 fatalities. The local government and public bodies must take the flood disaster issues as their main concerns by fram-ing various strategies on the flood risk management across regions, districts, municipalities and nationally for the sake of social security in the future. Generally, a good combination of flood management and flood
risk management will contribute towards an effective flood management.
Quantification of flood risk comprises hazard assess-ment and damage assessment. A study by Merz et al. (2010) found that there is an imbalance in the flood risk quantification where the damage assessment study is less frequently conducted as compared with the hazard assessment. This may be due to the limita-tion of data and a model for loss estimation. In recent years, the awareness towards loss assessment has increased especially in the European countries as it has become an essential ingredient in developing the flood mitigation policy or evaluating the effectiveness of the current flood reduction measures (Merz et al., 2010; Romali et al., 2015). The previous constraints related to the damage data have reduced as the ad-vancement in the technology has driven to the satel-lite-based data.
Numbers of flood damage assessment studies have been conducted either evaluating the post-flood dam-age or predicting the damage incurred in the next flood event based on the empirical data. However, none of them provide a detail guide for damage assessment. Deep knowledge about an essential ingredient for damage assessment study is crucial in order to de-velop effective flood management policies. Thus, this paper describes in detailed flood damage assessment and an essential element that should be included in quantifying the damage. The study contributes to our understanding of flood damage assessment and its impact towards economics sectors. At the end of this paper, the reader can distinguish different types of damage and identify the existing methodologies used in quantifying the flood damage as well as issues and challenges that may be involved in the study.
The existing flood damage assessment methodDuring the last decade, researchers have been focus-ing on outlining the flood defence framework as well as regulating the policies to ensure that the flood hazard is either scaling down or, at least, controllable. Howev-er, recently, there has been a dramatic increase in the awareness of conducting flood damage assessment

57Environmental Research, Engineering and Management 2019/75/3
studies as they are important factors affecting the de-cision making of flood risk management.
Damage assessment is a fundamental quantification of loss which results from any natural catastrophe (Federal Emergency Management Agency (FEMA), n.d.). Generally, damage caused by flood can occur either in a direct or an indirect way towards both the tangible and intangible asset.
A damage that occurs as a result of a direct contact between the flood water and the human, property or any other objects is considered as direct damage while indirect damage is defined as any damage that occurs
as a result of direct damage after a certain period of time or space (Hammond et al., 2015; Jongman et al., 2012; Jonkman et al., 2008; Kreibich et al., 2010; KTA Tenaga Sdn. Bhd, 2003; McGrath et al., 2015; Merz et al., 2010; Morrison et al., 2012; Nafari et al., 2016a, 2016b; Romali et al., 2015). Generally, tangible dam-age refers to damage that can be evaluated in mon-etary terms while intangible damage cannot because it is qualitative and untradeable (Brémond et al., 2013; Hammond et al., 2014; Hammond et al., 2015; KTA Tenaga Sdn. Bhd, 2003; Lekuthai et al., 2001; Merz et al., 2010; Romali et al., 2015).
Table 1. Categories of flood damage and their examples
CategoryTangible
Intangible Instantaneous InducedPrimary Secondary
Direct
Damage towards agricultural products,
buildings and its contents
Reconstruction cost incurred for the environment
and land
Trustworthy value and any
traumatophobia experience
Crop yield, livestock and equipment
used for agricultural activities
The reduction in added value which causes either
a decrease in the crop yield or effectivity rate of machines used for
production
IndirectDrops in the
business performance
Economic effects towards the regional and
national
Drops in the profit value
of a business operation
An increase in the time taken needed from supplying the
agricultural products or the traveling time
Reduction in the added value of anything which is located outside of the
flood-affected areas
Generally, there are four categories of damage which are direct tangible, indirect tangible, direct intangible and indirect intangible (Brémond et al., 2013; Ham-mond et al., 2015; Jongman et al., 2012; Jonkman et al., 2008; KTA Tenaga Sdn. Bhd, 2003; Merz et al., 2010; Morrison et al., 2012; Romali et al., 2015). In-direct intangible damage is indirect damage that is unable to be evaluated in monetary terms which is in contract with the indirect tangible one. A number of researchers have explored the direct and indirect tangible damage more deeply and divide them into two classes, which are primary and secondary dam-age (Dutta & Herath, 2001; Hammond et al., 2014; Messner et al., 2007; Romali et al., 2015; Van der Veen et al., 2003). Primary damage refers to the damage that has a direct linkage towards a flood event while secondary damage is the one causal step removed from the flood. Meanwhile, Brémond et al. (2013) and
Mao et al. (2016) classify damage related to the agri-cultural sector into four categories which are direct instantaneous, indirect instantaneous, direct induced and indirect induced. The exemplification for each of the category mentioned before is presented in Table 1.
Economic Commission for Latin America and the Caribbean (ECLAC) (1991) has proposed a list of the suitable methods of collecting the data that can be used in natural disaster studies. It has been identified that some of the proposed methods are commonly used for flood damage assessment studies. Previ-ously, questionnaire, interview, field survey and da-tabase released by the government, insurance com-pany or agencies related to flood were the common methods used in acquiring the data. However, the shift in technology led to a more advanced data col-lection technique around the 1990s, which is a satel-lite dependence database that will ease the damage

Environmental Research, Engineering and Management 2019/75/358
assessment process. For instance, the Geographic In-formation System (GIS) is a technology that has been used widely across Europe and Asia apart from the remote sensing technology. The findings show that the first hybrid model that uses the application of the GIS for flood damage assessment studies, which was introduced in 1996 by the Delft Hydraulic Institute, is marked to be the beginning of GIS application in flood studies (De Jonge et al., 1996).
Basically, the current flood damage assessment methodologies are developed on the basis of the unit loss approach where the assessment is based on the maximum damage per object and a damage function. Messner et al. (2007), Merz et al. (2010) and Hammond et al. (2014) emphasize that the selection of the meth-od used in developing the loss function or the damage model is closely related to the type of data available. In reference to the articles written by Dutta et al. (2003), Merz et al. (2004), Romali et al. (2015), Kreibich et al. (2010), Nafari et al. (2016b) and Hammond et al. (2015), there are two approaches that have been widely used: the empirical and the synthetic method. An empirical-ly-based model is developed based on the features of the flood analysed from the post-flood data collection. As an example of the flood loss estimation model for
the private sector (FLEMOps) (Thieken et al., 2008), flood losses in the commercial sector (FLEMOcs) (Kreibich et al., 2010), the flood loss function for Aus-tralian residential structures (FLFArs) (Nafari et al., 2016a), the flood loss function for Australian com-mercial structures (FLFAcs) (Nafari et al., 2016b) and ANUFLOOD (Smith, 1994) are part of the listed models that applyed an empirical method. On the contrary, a synthetic-based model is a model that combines land cover, land use patterns, types of objects and extracted data from the questionnaire in performing a deduction based on the hypothetical rules. This model was dis-covered and proposed by White (1964). This method has been adopted by Hoes et al. (2006) in framing a damage function of agricultural damage, and the sim-ilar method has been applied by Penning-Rowsell et al. (2005) and Nafari et al. (2017). Nevertheless, it has been discovered by Kreibich et al. (2010) that an appli-cation comprising a combination of both, the empiri-cal and the synthetic method, at one time exists and this has been demonstrated in the HAZUS-MH model (Federal Emergency Management Agency (FEMA), 2003) and the rapid appraisal method (RAM) (Gissing & Blong, 2004). The summary of these methods for model development is presented in Table 2.
Table 2. Type of method for the model development and their examples
Empirically-based model Empirical-synthetic model Synthetic-based model
_ FLEMOps (Thieken et al., 2008)
_ FLEMOcs (Kreibich et al., 2010)
_ FLFArs (Nafari et al., 2016a)
_ FLFAcs (Nafari et al., 2016b)
_ ANUFLOOD (Smith, 1994)
_ HAZUS-MH model (Federal Emergency
Management Agency (FEMA), 2003)
_ RAM (Gissing & Blong, 2004)
_ Hoes et al. (2006)
_ Model of multi-coloured manual (Pen-
ning-Rowsell et al., 2005)
_ Flood loss function for Italian residen-
tial structures (Nafari et al., 2017)
Natural disasters, like floods, will be a big blow to the economy where the economic activities post-flood are less rapid if compared with the pre-flood. The period for economic recovery would depend on the effectiveness of flood management plans especially in the develop-ment part. Results from damage assessment are very helpful not only for the development and the recovery phase but might as well be helpful for the prepara-tion phase. Therefore, the damage assessment study
towards various economic sectors is conducted in en-suring a stable growth domestic product (GDP) even right after the flooding.
Merz et al. (2010) state that there are four common sec-tors to be studied for damage assessment: residential, commercial, agricultural and industrial. Residential is defined as a place that is convenient for living, which surrounds accommodation. In the case of the HAZUS-MH flood model, Federal Emergency Management

59Environmental Research, Engineering and Management 2019/75/3
Agency (FEMA) (2003) classified one-family and mul-ti-family dwelling, mobile home, nursing home, tempo-rary lodging and institutional dormitory as a residential building. Meanwhile, there are three types of residen-tial buildings defined by Thieken et al. (2008) for loss estimation using the flood loss estimation model for the private sector (FLEMOps), i.e., one-family, mul-ti-family and duplexes dwelling. Morrison et al. (2012) claim that one family houses, apartment complexes, semi-detached houses and town houses are residential buildings for the case study at the Nepean River, New South Wales. By referring to the article written by Voji-novic et al. (2008), the residential building was classified according to its size and there are two classes of resi-dential buildings, which are small residential and large residential. Small residential refers to a building of an area less than 50 m² while large residential refers to an area greater than 50 m². A building that is being used for commercial purposes either for the use of retailing, professional, technical or personal services is consid-ered as a commercial building (Nafari et al., 2016b). As written in a technical manual of the HAZUS-MH flood model by the Federal Emergency Management Agency (FEMA) (2003), the building used for trading business, either a retail-based or a wholesale-based trading, amusement park, health service facility including hos-pital and clinics, bank, theater and parking lot services, is considered as the commercial sector. Meanwhile, in the development of a new model called flood losses in the commercial sector (FLEMOcs), Kreibich et al. (2010) classified the trading, corporate, public and private ser-vices as well as the production industry as a sub-sector of the commercial sector. In a case study by Vojinovic et al. (2008) towards damage during the urban floods in St Maarten Island, Netherlands, the commercial build-ings were classified according to the criterion of the size of buildings. Buildings of an area less than 100 m² and greater than 1,000 m² are referred to as small commer-cial buildings and large commercial buildings, respec-tively. Middle commercial classes refer to buildings of an area between 100 m² and 1,000 m². Furthermore, Dutta et al. (2003) outlined that crops, farmhouses and farm land as well as the infrastructure used for agricultural activity that has been damaged as a result of getting hit by the flood as part of agricultural sector quantification. On the contrary, soil is also taken into consideration
in a study done by Brémond et al. (2013) and Pivot et al. (2002) for agricultural assessment. In addition, an industrial sector is normally defined as any factory or company that operate in processing the raw material to produce the goods. As highlighted by Federal Emergen-cy Management Agency (FEMA) (2003), sub-sectors of the industrial sector included in the damage quantifica-tion of the HAZUS-MH flood damage are heavy and light industry, construction, food industry, metalworking as well as the chemical drugs industry. In the meantime, as reported in a study Vojinovic et al. (2008), industrial low refers to an industrial building of an area less than 100 m² while an area of more than 100 m² is labelled as industrial medium.
Influencing factors of the flood are elements that need a deep understanding in evaluating the severity of dam-age which results from the flood event. Factors taken into consideration are varied and depend on the ob-jectives of the study. Theoretically, impact factors and resistance factors are two categories of influencing factors that have been identified in a written work by Kreibich et al. (2010), Thieken et al. (2005), Merz et al. (2010), Kreibich et al. (2007), Hammond et al. (2015), Kreibich et al. (2016), Elmer et al. (2010) and Merz et al. (2013). Features of floodwater refer to the impact pa-rameter while the resistance parameter is associated with the features of the flood prone element such as physical structures of buildings, historical flood experi-ence and part of the flood risk management plan, which are precautionary and early alarming measures on flood occurrence. Furthermore, Freni et al. (2010) have outlined three types of data required in damage assess-ment: hydrological-hydraulic data, physical data and economic data. Hydrologic-hydraulic data is related to the features of the floodwater such as its depth, velocity and duration of inundation. The physical data refers to the land use and properties of the building structures involved in flood, and economic data is related to the social and economic patterns of that area.
Analysis on some of the previous damage assessmentA review towards some flood damage assessment studies across various spatial scales and economic

Environmental Research, Engineering and Management 2019/75/360
Table 3. Analysis on selected flood damage assessment studies
Elements Descriptions
Naf
ari e
t al.
(201
7)
Iman
et a
l. (2
016)
Naf
ari e
t al.
(201
6a)
Naf
ari e
t al.
(201
6b)
Kha
n et
al.
(201
4)
Tam
et a
l. (2
014)
Kou
rgia
las
et a
l. (2
013)
Mer
z et
al.
(201
3)
Fren
i et a
l. (2
010)
Aham
ad e
t al.
(201
1)
Kre
ibic
h et
al.
(201
0)
Thie
ken
et a
l. (2
008)
Jonk
man
et a
l. (2
008)
Jonk
man
(200
7)
Giss
ing
& B
long
(200
4)
KTA
Ten
aga
Sdn.
Bhd
(200
3)
Type of dam-age estima-
tion
Direct tangible
Indirect tangible
Direct intangible
Indirect intangible
Concentrated areas
Urban
Rural
Economic sectors
Residential
Commercial
Agricultural
Industrial
Data collec-tion tech-
nique
Interview
Questionnaire
Satellite
Field survey
Method for model devel-
opment
Empirical
Empirical-synthetic
Synthetic
Required data
Hydrologic-hydraulic
Physical
Economic
Loss damage functions
Absolute
Relative
sectors either focusing on evaluating the tangible or intangible damage is presented in Table 3.
A conducted analysis shows that most of the studies are focused on evaluating the direct tangible damage. It is supported by the article written by Merz et al.
(2004) where the direct tangible damage is the most common type of damage being evaluated as its quan-tification is much easier when there is less restriction in assessing the required data. As a matter of fact, the quantification of indirect damage is a time-consuming
61Environmental Research, Engineering and Management 2019/75/3
study as it is a long term effect that requires a period of time or space (Merz et al., 2010). Intangible losses show a high subjectivity rate in nature as the magni-tude varies and are determined by other factors such as economic resilience and the recovery rate (Lekuthai et al., 2001). In addition, the intangible damage quantifi-cation like the impact towards the economy and health require data from the insurance company and this limits the quantification process whereby the data of custom-ers are considered as private and confidential by some companies (Van der Veen et al., 2003). Alternatively, economic impacts can be quantified by using the eco-nomic modelling. Nevertheless, Merz et al. (2010) state that the traditional modelling tends to overestimate the impact. The importance of quantifying the intangible impact has been stressed in an article by Markantonis et al. (2012), where it can contribute towards a better life when the allocation of human, social and natural capital sources is sufficient. There are some attempts in quan-tifying damage other than the direct tangible damage, for instance, Jonkman (2007) introduced a model for assessing life loss, while Ahern et al. (2005) performed an epidemiology study.
In terms of economic sectors, it clearly shows that the residential sector is the most frequently studied for dam-age assessment, followed by the commercial sector. The residential sector becomes the main concern as it is one of the regulators in the national property growth and a positive growth will drive towards a financial stability of a country, as stated in the report released by Bank Ne-gara Malaysia (BNM) (2013). The house is a necessity and almost every married family will live separately from their family, either they rent a house or purchase it. Un-deniably, the price of a house will certainly be affected by the natural disaster, and the homeowner will receive an amount of equity loans less than the usual amount. The house pricing is directly proportional to the homeowner wealth where a decrease in the house pricing will also decrease the homeowner wealth. As a result, the decli-nation in the individual consumption will indirectly affect the economy in the long term because individual spending is said to contribute around 70% to the national economy in the case of the US by Ahmad (2010). Hence, this strong-ly supports that most frequently a damage assessment study was conducted towards the residential sector.
For the industrial sector, it goes to be the least eco-nomic sector, which has been studied for flood damage
assessment. On the other hand, it actually plays a sig-nificant role towards the economic growth. There is more compelling evidence, mentioned in a book by the United Nations (2007), that some countries such as China tend to show a positive economic growth due to the sustainable and rapid development in the industrial sector. In addition, there are some countries like South Korea and Taiwan that show a declining pattern in the inequality rates as a result of a positive performance in their economic growth and occurrence of rapid industri-alization. As a matter of fact, South Korea is a country with a high population rate as well as the high inequality rate among residents in rural and urban areas. Inten-sification of industrialization towards capital-based is going to increase the inequality rate as the develop-ment is focusing more towards urban areas, but the shift towards a labour-intensive method is said to have the ability to reduce the inequality rate. A good indus-trialization framework should balance the development towards both the urban and rural areas. The high em-ployment rate in the application of the labour-intensive industrialization method will reduce the poverty rate as well as the inequality rate; hence, this will result in a positive economic growth.
Another significant aspect of damage quantification is how the form of loss is expressed. The relative loss function is the most common technique adopted in a flood study as reported in Table 3. Regarding Messner et al. (2007) and Merz et al. (2010), a relative form is simpler than absolute as it does not require regular re-calibration and data related to the properties is easy to be obtained. Furthermore, its independent behaviour in nature causes it to be easily transferable in space and time (Krzysztofowicz et al., 1983; Merz et al., 2010).
In terms of the approaches used in developing the damage model, it shows that the empirical method is the most common method used by the researchers as compared with the synthetic and the empirical-syn-thetic method. There are several arguements on the benefits and weaknesses of the method. A previous case study by Gissing & Blong (2004) towards the 2001 real data of Kempsey, New South Wales, which was collected right after the city was hit by the flood acknowledges that the accuracy rate of implementing the real data is higher than the synthetic one. Adopt-ing the mitigation measures in the 2002 flood study at the Elbe river, Kreibich et al. (2005) found that the

Environmental Research, Engineering and Management 2019/75/362
element is significant in modelling the damage. Like-wise, Thieken et al. (2008) applied the same concept in developing the FLEMOps model. Whilst Soetanto et al. (2004) and Gissing & Blong (2004) criticized the quality of the synthetic-based model that is subjective in na-ture and will produce uncertainty in the quantification of damage. Besides, Smith (1994), Merz et al. (2010) and Hammond et al. (2015) claim that larger effort is needed to conduct a survey of a large sample size in detail in order to maintain the quality of the damage estimation.
However, from the point of data collection techniques, the analysis shows that there are some flood damage study that apply the primary data collection techniques like the one conducted by Khan et al. (2014) towards the case study at Kota Bharu, Kelantan. The Economic Com-mission for Latin America and the Caribbean (ECLAC) (1991) states that the primary data collection technique is costly and also requires a long period of time, espe-cially if the study involves the remote rural area. This technique is also less convincing when it comes to the duration and depth of flood inundation to be expressed in words. Thus, it is said to have a low accuracy rate by the Economic Commission for Latin America and the Caribbean (ECLAC) (1991). However, the shift in technol-ogy has led to the discovery of the satellite-dependence database through the use of remote sensing and GIS.
So far, however, there have been some issues and chal-lenges about the flood damage assessment. Previous research by Dutta et al. (2003) and Dutta and Herath et al. (2001) has identified that the current data collection techniques and the flood model are sharing the same lacking, which is the inability to cater real-time flood data. Interestingly, this issue has become a small con-cern after the application of remote sensing and the GIS were introduced in these fields as the combination of both is said to have the capability of providing the re-al-time data collection. Remote sensing is capable of receiving the physical data with the absence of any touch or contact with the object and the information re-ceived by the user is in the form of waves while the GIS will retrieve, capture and keep the information before it is presented (Opolot, 2013).
Remote sensing and the GIS have been widely used across countries for various purposes such as water level prediction (Adnan et al., 2012), flood risk assess-ment (Sulaiman et al., 2012), flood damage assessment (De Jonge et al., 1996; Jonkman et al., 2008; Morrison
et al., 2012), flood hazard mapping (Alaghmand et al., 2010) and in a flood vulnerability study (Sanyal et al., 2005). The use of remote sensing and the GIS in a flood study has its own advantages and drawbacks. A sig-nificant benefit is that the remote sensing will give a better representation of the flooded area where it has the capability of monitoring three different kinds of sit-uations, which are before, during and after the disaster in a 3D view with the aid of GIS technology (Hassan et al., 2006; Opolot, 2013; Sulaiman et al., 2012). Neverthe-less, Opolot (2013) and Sanyal et al. (2005) reported that its capability was less effective during the existence of the cloud.
Another challenge faced by researchers in these fields is the absence of a standard method that can be applied globally. From the literature review, it shows that the method used for estimating the flood damage varies depending on the country as well as researchers them-selves. This is supported by previous research which was written by Dutta et al. (2003), Dutta and Herath et al. (2001), Herath et al. (1999) and Dutta and Herath (2001) where Japan and United Kingdom (UK) are the only two countries that have established a standardized method that can be applied in any district within their country. Conversely, Olesen et al. (2017) has reported that up to now the UK is still updating the methodologies for the country and the latest publication is in the year 2013.
In the case of Japan, guidelines for the standard meth-od are mentioned in the “Outline of River Improvement Economic Research Investigation”, which was released by the Ministry of Construction (MOC) (Dutta & Herath, 2001; Dutta et al., 2001; Herath et al., 1999). There are two options in conducting the damage estimation, which is either by using the application of the depth-dam-age function or just a direct survey. The damage is categorized into three classes: general assets, crops and public infrastructure. The multi-coloured manual (MCM) is a manual that has been issued by the Middle-sex Polytechnic Flood Hazard Research Center (MPRC) around the mid-1970s to be widely used throughout the UK (Dutta et al., 2001). The three sub-manuals in the MCM comprise the Blue Manual, the Red Manual and the Yellow Manual, and each sub-manual describes the estimation procedure for different kind of damages. Meanwhile, the United States of America (USA) is still in the development process for a standardized method to be established in their country and several parties are
63Environmental Research, Engineering and Management 2019/75/3
Table 4. Categories of flood damage and their examples
Element Uncertainty Type Expected significance Included in analysis
Object dataQuantity Both
Depends on input data, expected to be often insignificant
No
Location BothDepends on area, often
insignificantNo
Maximum damage
Value of the object Mostly aleatory Varies Yes
Susceptible to flood damage Mostly epistemic Significant Yes
Damage function
Parameter representation Both Significant Yes
Epistemic Significant Yes
involved in this effort including the U.S. Army Corps of Engineers (USACE) and the U.S. National Science Foun-dation (NSF) (Dutta et al., 2001). The rest of the unmen-tioned countries above is determined by the researchers in estimating the damage, and surely it varies from one another.
The general approach in flood damage assessment is the unit loss approach where the assessment is calcu-lated based on the maximum damage per object and a damage function. A previous study by Merz et al. (2010) highlighted that there were three sources of uncertainty in damage assessment: uncertainty in object data, un-certainty in maximum damage figures and uncertainty in the damage function. A brief overview on the presence of these uncertainties is presented in Table 4. Mean-while, Apel et al. (2004) discussed the paucity related to the analysis in flood damage assessment and classified these uncertainties into two, i.e. aleatory uncertainty and epistemic uncertainty. Epistemic uncertainty refers to the uncertainty that occurs as a result of incomplete knowl-edge on the subject matter being studied. Aleatory un-certainty is discovered in average data where there is a variability within the population which can be expressed in the form of a statistical criterion such as mean, vari-ance, and skewness. The evidence reviewed here seems to propose that the damage value of an average resi-dence is predicted to be maximum even though the rate of severity varies depending on the factors affecting it. In the case of small flood events, the assessment of a few houses that declared damage due to the flood might dif-fer from the average house. Hence, the damage assess-ment for these houses is uncertain and this uncertainty is considered as aleatory uncertainty.
Fuzzy rule-based system for post-flood damage assessmentRegarding the previously highlighted issues and chal-lenges, specifically on the issues of uncertainties, a fuzzy approach is proposed herein in order to increase its precision level. This method combines the applica-tion of a fuzzy and probabilistic information concept in translating the information into a natural language which makes it capable to evaluate the damage even under the situation of incomplete and imprecise infor-mation (Alsawy & Hefny, 2013).
Traditionally, the damage model is developed on the basis of the unit loss approach. The fuzzy approach still remains unit loss-based on its model develop-ment by including the uncertainty in object data, in maximum damage figures and in damage functions. Meanwhile in the assessment part, it is based on the qualitative uncertainty analysis and the calculation is made based on the relationships between flood char-acteristics and damages to a unit. In short, the quan-tification of the uncertainty measure for flood damage assessment follows the forward uncertainty propaga-tion models that use Monte Carlo simulations (Merz et al., 2010). The basic idea about the granular fuzzy damage assessment engine specifically for uncertain flood damage assessment is illustrated in Fig. 1.
Each model receives many inputs from input indicators. The input indicators are input parameters of the designed fuzzy system. These parameters correspond to flood and damage affected house and household items in the house. The proposed fuzzy logic model is designed with

Environmental Research, Engineering and Management 2019/75/364
previously defined input parameters. Every subsystem gives an intermediate output variable. The output from each subsystem is defined as Intermediate Variable 1 “House Damage Factor”, Intermediate Variable 2 “Flood Damage Factor” and Intermediate Variable 3 “Applianc-es Damage Factor”. These intermediate output varia-bles will be processed by the Fuzzy Inference System (Fig. 2), which will produce the complex post flood dam-age assessment value. The value is a criterion for final decision-making about the degree of damage for a par-ticular area. The higher value corresponds to the more severe post flood damage.
Design of the fuzzy logic modelLinguistic variables are quantitative values that cor-respond to qualitative features (Zlateva et al., 2011). These variables are information and decision that are closely linked to make a decision from imperfect infor-mation using different methods. Possible types of cases and damage assessment on living property are defined by an expert that depends on quality and uncertainty of the available information from various sources.
In a fuzzy logic house condition subsystem, the input linguistic variables for Input 1 and Input 2 are repre-sented membership functions, which are {“Very Small”, “Small”, “Medium”, “Big”, “Very Big”} and {“Bad”, “Medi-um”, “Good”}. The input variables are assessed in the interval [0,1] and [0–100]. The fuzzy logic system output (house damage factor) is described as {“Good”, “Fair”, “Risky”, “Very Risky”}. The post-flood damage assess-ment is assessed in the interval [0,100] using triangular membership functions. The input and the output mem-bership functions are shown in Fig. 3, Fig. 4 and Fig. 5.
The membership functions for the fuzzy logic flood condition subsystem are {“Low”, “Medium”, “High”, “Very High”}, {“Short”, “Medium”, “Long”} and {“Low”, “Medium”, “High”} for Input 3, Input 4 and Input 5. These inputs are assessed at the interval of [0,5], [0,10] and [0–100] using trapezoid membership func-tions. The fuzzy logic system output (flood damage factor) is described as {“Good”, “Fair”, “Risky”, “Very Risky”}. The post-flood damage assessment is as-sessed at the interval [0,100] using triangular mem-bership functions. The inference surfaces in 3D for the three fuzzy logic subsystems are given in Fig. 6.
Fig. 3. The fuzzy inference system for the flood condition model
Fig. 2. Fuzzy models for post-flood damage assessment
Fig. 1. Framework for the fuzzy rule-based system for uncertain post-flood damage assessment

65Environmental Research, Engineering and Management 2019/75/3
Fig. 4. Membership functions of the input indicators for the fuzzy logic house condition subsystem
Fig. 5. Membership functions of the output indicators for the fuzzy logic house condition subsystem
Fig. 6. The 3D view of the interference surfaces of the fuzzy logic subsystems
Fuzzy rule-based model applicationIn this research, the intangible input variables are used to develop the knowledge base of the param-eter to evaluate the damage condition of the flood. The Mamdani fuzzy rules-based system type is used in the fuzzy model. Here, the Mamdani method has an advantage over the Takagi-Sugeno-Kang method of being easier to understand the consequents of the system. After evaluating each rule in the knowledge
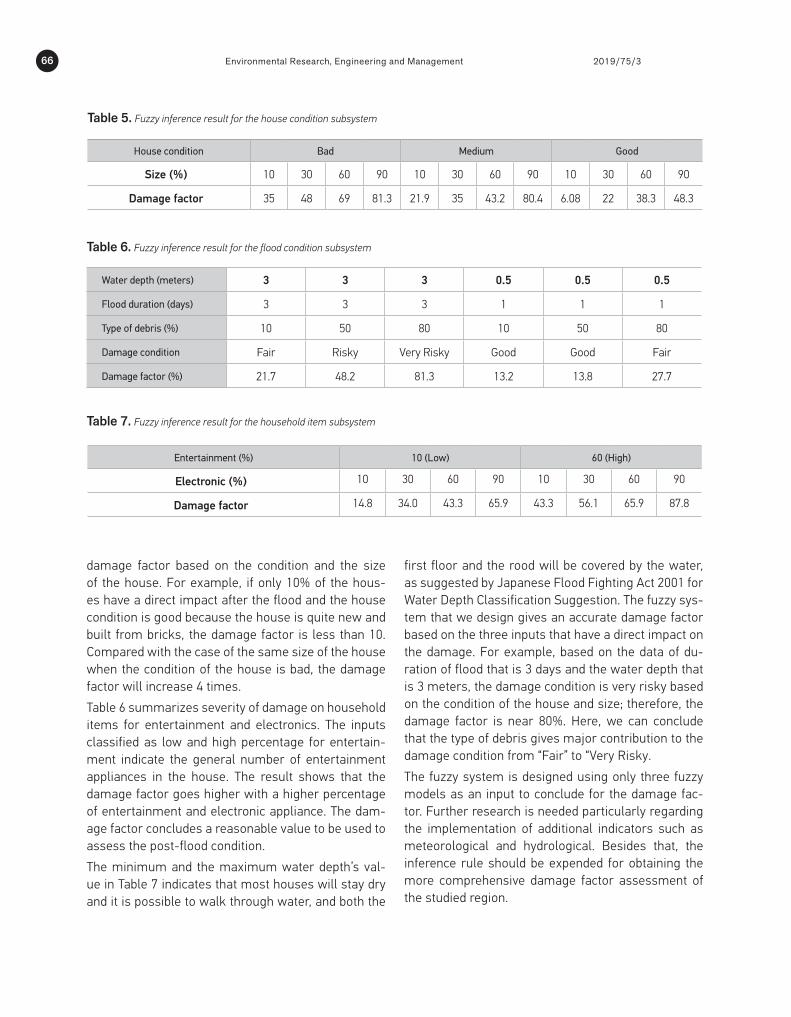
base, the membership value of each consequent membership is aggregated using the maximum oper-ation. Tables 5, 6 and 7 summarize the result of data set assessment using the proposed fuzzy logic model and the characteristics of the input.
In Table 5, it can be deduced that the house conditions “Bad” and “Medium” contribute most to the house damage factor. The result shows the reasonable
Environmental Research, Engineering and Management 2019/75/366
Table 5. Fuzzy inference result for the house condition subsystem
House condition Bad Medium Good
Size (%) 10 30 60 90 10 30 60 90 10 30 60 90
Damage factor 35 48 69 81.3 21.9 35 43.2 80.4 6.08 22 38.3 48.3
Table 6. Fuzzy inference result for the flood condition subsystem
Water depth (meters) 3 3 3 0.5 0.5 0.5
Flood duration (days) 3 3 3 1 1 1
Type of debris (%) 10 50 80 10 50 80
Damage condition Fair Risky Very Risky Good Good Fair
Damage factor (%) 21.7 48.2 81.3 13.2 13.8 27.7
Table 7. Fuzzy inference result for the household item subsystem
Entertainment (%) 10 (Low) 60 (High)
Electronic (%) 10 30 60 90 10 30 60 90
Damage factor 14.8 34.0 43.3 65.9 43.3 56.1 65.9 87.8
damage factor based on the condition and the size of the house. For example, if only 10% of the hous-es have a direct impact after the flood and the house condition is good because the house is quite new and built from bricks, the damage factor is less than 10. Compared with the case of the same size of the house when the condition of the house is bad, the damage factor will increase 4 times.
Table 6 summarizes severity of damage on household items for entertainment and electronics. The inputs classified as low and high percentage for entertain-ment indicate the general number of entertainment appliances in the house. The result shows that the damage factor goes higher with a higher percentage of entertainment and electronic appliance. The dam-age factor concludes a reasonable value to be used to assess the post-flood condition.
The minimum and the maximum water depth’s val-ue in Table 7 indicates that most houses will stay dry and it is possible to walk through water, and both the
first floor and the rood will be covered by the water, as suggested by Japanese Flood Fighting Act 2001 for Water Depth Classification Suggestion. The fuzzy sys-tem that we design gives an accurate damage factor based on the three inputs that have a direct impact on the damage. For example, based on the data of du-ration of flood that is 3 days and the water depth that is 3 meters, the damage condition is very risky based on the condition of the house and size; therefore, the damage factor is near 80%. Here, we can conclude that the type of debris gives major contribution to the damage condition from “Fair” to “Very Risky.
The fuzzy system is designed using only three fuzzy models as an input to conclude for the damage fac-tor. Further research is needed particularly regarding the implementation of additional indicators such as meteorological and hydrological. Besides that, the inference rule should be expended for obtaining the more comprehensive damage factor assessment of the studied region.

67Environmental Research, Engineering and Management 2019/75/3
Conclusions and RecommendationsThe insights gained from this study may be of assis-tance to the researchers in assessing the damage incurred resulting from the flood disaster. There is no any previous study that describes in detail the ele-ment needed for damage estimation of flood. Overall, this study briefly introduces the flood damage as-sessment and current methodologies used for flood damage assessment based on the analysis towards several previous flood damage assessment studies.
An analysis shows that direct tangible damage is the most frequent type of damage being quantified in most studies due to its process that is less time consuming and the related data for this estimation can be easily accessed. In terms of economic sectors, it clearly shows that most researchers focus on the residential sector as this sector plays an important role in the growth of national property and economy
as well as the national financial stability. In addition, empirical approaches are the most favourite choice among researchers and then the damage function is preferably to be presented in the relative form. The empirically-based model is proven to have a higher accuracy rate as compared with others through the case study in the Kempsey, New South Wales, while the relative damage function is simpler than an abso-lute one as it does not require regular recalibration. In the last part, a discussion of some critical issues is also demonstrated in this paper, which discuss the standard methodologies for flood damage assess-ment from a countrywide view, satellite-dependence database and existence of uncertainties in flood dam-age assessment other than proposing a granular fuzzy approach in the application of flood damage as-sessment for a better risk analysis in the future.
AcknowledgementsThe authors express their deepest gratitude to Universiti Teknikal Malaysia Melaka (UTeM) for supporting this research PJP/2019/FTMK(68)/S01678.
ReferencesAdnan, R., Ruslan, F. A., Samad, A. M., & Zain, Z. M. (2012). Flood water level modelling and prediction using artificial neu-ral network: Case study of Sungai Batu Pahat in Johor. Paper presented at the Control and System Graduate Research Col-loquium (ICSGRC), 2012 IEEE. https://doi.org/10.1109/ICS-GRC.2012.6287127
Ahamad, M. S. S., Ali, R., Zakaria, N., Ghani, A., & Chang, C. K. (2011). Flood loss assessment of the 2003 Muda river flood. Paper presented at the 3rd International Conference on Managing Rivers in the 21st Century: Sustainable Solutions for Global Crisis of Flooding, Pollution and Water Scarcity, Penang, Malaysia.
Ahern, M., Kovats, R. S., Wilkinson, P., Few, R., & Matthies, F. (2005). Global health impacts of floods: epidemiologic evidence. Epidemiologic reviews, 27(1), 36-46. https://doi.org/10.1093/epirev/mxi004
Alaghmand, S., Bin Abdullah, R., Abustan, I., & Vosoogh, B. (2010). GIS-based river flood hazard mapping in urban area
(a case study in Kayu Ara River Basin, Malaysia). International Journal of Engineering and Technology, 2(6), 488-500.
Alsawy, A. A., & Hefny, H. A. (2013). On uncertain granular num-bers. International Journal of Computer Applications, 62(18). https://doi.org/10.5120/10181-5018
Apel, H., Thieken, A. H., Merz, B., & Blöschl, G. (2004). Flood risk assessment and associated uncertainty. Natural Hazards and Earth System Science, 4(2), 295-308. https://doi.org/10.5194/nhess-4-295-2004
Bank Negara Malaysia (BNM). (2013). Laporan kestabilan ke-wangan dan sistem pembayaran 2012 Rencana: Perkemban-gan dalam Pasaran Perumahan dan Implikasinya Terhadap Kestabilan Kewangan (pp. 208): Bank Negara Malaysia.
Brémond, P., Grelot, F., & Agenais, A. (2013). Review Article: economic evaluation of flood damage to agriculture-review and analysis of existing methods. Natural Hazards and Earth System Sciences, 13, p. 2493-p. 2512. https://doi.org/10.5194/nhess-13-2493-2013

Environmental Research, Engineering and Management 2019/75/368
De Jonge, T., Kok, M., & Hogeweg, M. (1996). Modelling floods and damage assessment using GIS. IAHS PUBLICATION, 299-306.
Dutta, D., & Herath, S. (2001). GIS based flood loss estimation modeling in Japan. Paper presented at the Proceedings of the US-Japan 1st workshop on comparative study on urban disas-ter management.
Dutta, D., Herath, S., & Musiake, K. (2001). Direct flood dam-age modeling towards urban flood risk management. Paper presented at the Joint Workshop on Urban Safety Engineering.
Dutta, D., Herath, S., & Musiake, K. (2003). A mathematical model for flood loss estimation. Journal of hydrology, 277(1), 24-49. https://doi.org/10.1016/S0022-1694(03)00084-2
Economic Commission for Latin America and the Caribbean (ECLAC). (1991). Manual for estimating the socio-economic ef-fects of natural disasters. Santiago, Chile.
Elmer, F., Thieken, A. H., Pech, I., & Kreibich, H. (2010). Influence of flood frequency on residential building losses. Natural Haz-ards and Earth System Sciences, 10(10), 2145-2159. https://doi.org/10.5194/nhess-10-2145-2010
Federal Emergency Management Agency (FEMA). (2003). Mul-ti-hazard loss estimation methodology: Flood model. Washing-ton, D.C.
Federal Emergency Management Agency (FEMA). (n.d.). Les-son 1: Local Damage Assessment. Retrieved Apr 2, 2017, from https://emilms.fema.gov/IS559/lesson1/01_01_020print.htm
Freni, G., La Loggia, G., & Notaro, V. (2010). Uncertainty in urban flood damage assessment due to urban drainage modelling and depth-damage curve estimation. Water Science and Technolo-gy, 61(12), 2979-2993. https://doi.org/10.2166/wst.2010.177
Gale, E. L., & Saunders, M. A. (2013). The 2011 Thailand flood: climate causes and return periods. Weather, 68(9), 233-237. https://doi.org/10.1002/wea.2133
Gasim, M. B., Toriman, M. E., & Abdullahi, M. G. (2014). FLOODS IN MALAYSIA Historical Reviews, Causes, Effects and Mitiga-tions Approach. International Journal of Interdisciplinary Re-search and Innovations, 2(4), 59-65.
Geo Risk Research. (n.d.). World, Natural Catastrophe. Costliest Natural Catastrophes Since 1980. Retrieved Feb 23, 2017, from http://www.iii.org/fact-statistic/catastrophes-global
Gissing, A., & Blong, R. (2004). Accounting for variability in com-mercial flood damage estimation. Australian Geographer, 35(2), 209-222. https://doi.org/10.1080/0004918042000249511
Hammond, M., Djordjevic, S., Butler, D., & Chen, A. (2014). Flood Impact Assessment Literature Review (2 ed., pp. 73). United Kingdom: University of Exeter.
Hammond, M. J., Chen, A. S., Djordjević, S., Butler, D., & Mark, O. (2015). Urban flood impact assessment: A state-of-the-art review. Urban Water Journal, 12(1), 14-29. https://doi.org/10.1080/1573062X.2013.857421
Hassan, A., Ghani, A. A., & Abdullah, R. (2006). Development of flood risk map using GIS for Sg. Selangor Basin. Paper present-ed at the Proceeding of the Sixth International Conference on ASIA GIS, 9-10 Mar 2006, UTM Skudai, Johor, Malaysia.
Hassan, F. A. (2013). Analysis of Domestic Water Consumption in Malaysia. (Master of Engineering (Civil-Hydraulic & Hydrolo-gy)), Universiti Teknologi Malaysia.
Herath, S., Dutta, D., & Musiake, K. (1999). Flood damage esti-mation of an urban catchment using remote sensing and GIS. Paper presented at the Proc. the Eighth International Confer-ence on Urban Storm Drainage.
Hoes, O., & Schuurmans, W. (2006). Flood standards or risk analyses for polder management in the Netherlands. Irrigation and Drainage, 55(S1). https://doi.org/10.1002/ird.249
Iman, A. H. M., & Sathiamurthy, E. (2016). Rapid Assessment Method of Flood Damage Using Spatial-Statistical Mod-els. Journal of Geography and Geology, 8(4), 46. https://doi.org/10.5539/jgg.v8n4p46
Jongman, B., Kreibich, H., Apel, H., Barredo, J., Bates, P., Fey-en, L., Ward, P. (2012). Comparative flood damage model as-sessment: towards a European approach. Natural Hazards and Earth System Sciences, 12(12), 3733. https://doi.org/10.5194/nhess-12-3733-2012
Jonkman, S. N. (2007). Loss of life estimation in flood risk as-sessment. Delft University of Technology, TU Delft.
Jonkman, S. N., Bočkarjova, M., Kok, M., & Bernardini, P. (2008). Integrated hydrodynamic and economic modelling of flood damage in the Netherlands. Ecological economics, 66(1), 77-90. https://doi.org/10.1016/j.ecolecon.2007.12.022
Khan, M. M. A., Shaari, N. A. B., Bahar, A. M. A., Baten, M. A., & Nazaruddin, D. A. B. (2014). Flood impact assessment in Kota Bharu, Malaysia: a statistical analysis. World Applied Sciences Journal, 32(4), 626-634.
Kourgialas, N. N., & Karatzas, G. P. (2013). A hydro-economic modelling framework for flood damage estimation and the role of riparian vegetation. Hydrological Processes, 27(4), 515-531. https://doi.org/10.1002/hyp.9256
Kreibich, H., Botto, A., Merz, B., & Schröter, K. (2016). Proba-bilistic, Multivariable Flood Loss Modeling on the Mesoscale with BT-FLEMO. Risk Analysis, 37(4), 774-787. https://doi.org/10.1111/risa.12650

69Environmental Research, Engineering and Management 2019/75/3
Kreibich, H., Müller, M., Thieken, A. H., & Merz, B. (2007). Flood precaution of companies and their ability to cope with the flood in August 2002 in Saxony, Germany. Water resources research, 43(3). https://doi.org/10.1029/2005WR004691
Kreibich, H., Seifert, I., Merz, B., & Thieken, A. H. (2010). Devel-opment of FLEMOcs - a new model for the estimation of flood losses in the commercial sector. Hydrological Sciences Jour-nal-Journal des Sciences Hydrologiques, 55(8), 1302-1314. https://doi.org/10.1080/02626667.2010.529815
Kreibich, H., Thieken, A. H., Petrow, T., Müller, M., & Merz, B. (2005). Flood loss reduction of private households due to build-ing precautionary measures--lessons learned from the Elbe flood in August 2002. Natural Hazards and Earth System Sci-ence, 5(1), 117-126. https://doi.org/10.5194/nhess-5-117-2005
Krzysztofowicz, R., & Davis, D. R. (1983). Category-unit loss functions for flood forecast-response system evaluation. Water resources research, 19(6), 1476-1480. https://doi.org/10.1029/WR019i006p01476
KTA Tenaga Sdn. Bhd. (2003). Flood damage assessment of 26 April 2001 flooding affecting the Klang Valley and the prepara-tion of generalised procedures and guidelines for assessment of flood damages (Final report) Flood Damage Assessment of 26 April 2001 Flooding Affecting the Klang Valley (Vol. 1). Malaysia.
Lekuthai, A., & Vongvisessomjai, S. (2001). Intangible flood damage quantification. Water Resources Management, 15(5), 343-362. https://doi.org/10.1023/A:1014489329348
Maidin, S. S., Othman, M., Ahmad, M. N., & Arshad, N. H. (2014). Managing information and information-related technology: Ena-bling decision-making in flood management. International Journal of Digital Content Technology and its Applications, 8(2), 13-28.
Mao, G., Onfroy, T., Moncoulon, D., Quantin, A., & Robert, C. (2016). Comprehensive flood economic losses: review of the potential damage and implementation of an agricultural im-pact model. Paper presented at the E3S Web of Conferences. https://doi.org/10.1051/e3sconf/20160705003
Markantonis, V., Meyer, V., & Schwarze, R. (2012). Review Arti-cle" Valuating the intangible effects of natural hazards-review and analysis of the costing methods". Natural Hazards and Earth System Sciences, 12(5), 1633. https://doi.org/10.5194/nhess-12-1633-2012
McGrath, H., Stefanakis, E., & Nastev, M. (2015). Sensitivity anal-ysis of flood damage estimates: A case study in Fredericton, New Brunswick. International Journal of Disaster Risk Reduc-tion, 14, 379-387. https://doi.org/10.1016/j.ijdrr.2015.09.003
Merz, B., Kreibich, H., & Lall, U. (2013). Multi-variate flood dam-age assessment: a tree-based data-mining approach. Natural
Hazards and Earth System Sciences, 13(1), 53-64. https://doi.org/10.5194/nhess-13-53-2013
Merz, B., Kreibich, H., Schwarze, R., & Thieken, A. (2010). Re-view article "Assessment of economic flood damage". Natural Hazards and Earth System Sciences, 10(8), 1697-1724. https://doi.org/10.5194/nhess-10-1697-2010
Merz, B., Kreibich, H., Thieken, A., & Schmidtke, R. (2004). Es-timation uncertainty of direct monetary flood damage to build-ings. Natural Hazards and Earth System Science, 4(1), 153-163. https://doi.org/10.5194/nhess-4-153-2004
Messner, F., Penning-Rowsell , E., Green, C., Meyer, V., Tunstall, S., & van der Veen, A. (2007). Evaluating flood damages: guid-ance and recommendations on principles and methods: Helm-holz Unweltforschungszentrum (UFZ).
Morrison, T., & Molino, S. (2012). Hawkesbury-Nepean Flood Damages Assessment. Finał Report for Infrastructure NSW, Molino Stewart Pty Ltd, ACN, 67(774), 332.
Nafari, R. H., Amadio, M., Ngo, T., & Mysiak, J. (2017). Flood loss modelling with FLF-IT: a new flood loss function for Italian resi-dential structures. Natural Hazards and Earth System Sciences, 17(7), 1047. https://doi.org/10.5194/nhess-17-1047-2017
Nafari, R. H., Ngo, T., & Lehman, W. (2016a). Calibration and validation of FLFArs - a new flood loss function for Australian residential structures. Nat. Hazards Earth Syst. Sci, 16(1), 15-27. https://doi.org/10.5194/nhess-16-15-2016
Nafari, R. H., Ngo, T., & Lehman, W. (2016b). Development and evaluation of FLFAcs - A new Flood Loss Function for Australian commercial structures. International Journal of Disaster Risk Reduction, 17, 13-23. https://doi.org/10.1016/j.ijdrr.2016.03.007
Olesen, L., Löwe, R., & Arnbjerg-Nielsen, K. (2017). Flood dam-age assessment-Literature review and recommended proce-dure. Melbourne, Australia: Cooperative Research Centre for Water Sensitive Cities.
Opolot, E. (2013). Application of remote sensing and geograph-ical information systems in flood management: a review. Re-search Journal of Applied Sciences Engineering and Technol-ogy, 6(10), 1884-1894. https://doi.org/10.19026/rjaset.6.3920
Pamučar, D., Božanić, D., & Komazec, N. (2014). Flood Hazard Assessment by Application of Fuzzy Logic. Zbornik radova sa šeste ICT konferencije, 80-86.
Penning-Rowsell, E., Johnson, C., Tunstall, S., Tapsell, S., Mor-ris, J., Chatterton, J., & Green, C. (2005). The benefits of flood and coastal risk management: a handbook of assessment techniques: Middlesex University Press.

Environmental Research, Engineering and Management 2019/75/370
Pivot, J.-M., & Martin, P. (2002). Farms adaptation to changes in flood risk: a management approach. Journal of hydrology, 267(1), 12-25. https://doi.org/10.1016/S0022-1694(02)00136-1
Romali, N. S., Yusop, Z., & Ismail, Z. (2015). Flood dam-age assessment: A review of flood stage-damage function curve ISFRAM 2014 (pp. 147-159): Springer. https://doi.org/10.1007/978-981-287-365-1_13
Sanyal, J., & Lu, X. (2005). Remote sensing and GIS-based flood vulnerability assessment of human settlements: a case study of Gangetic West Bengal, India. Hydrological Processes, 19(18), 3699-3716. https://doi.org/10.1002/hyp.5852
Smith, D. I. (1994). Flood damage estimation- A review of ur-ban stage-damage curves and loss functions. Water S. A., 20(3), 231-238.
Soetanto, R., & Proverbs, D. G. (2004). Impact of flood charac-teristics on damage caused to UK domestic properties: the per-ceptions of building surveyors. Structural Survey, 22(2), 95-104. https://doi.org/10.1108/02630800410538622
Sulaiman, N. A., Husain, F., Hashim, K. A., & Samad, A. M. (2012). A study on flood risk assessment for Bandar Segamat sustainability using remote sensing and GIS approach. Pa-per presented at the Control and System Graduate Research Colloquium (ICSGRC), 2012 IEEE, UiTM Shah Alam, Malaysia. https://doi.org/10.1109/ICSGRC.2012.6287197
Tam, T., Ibrahim, A., Rahman, M., & Mazura, Z. (2014). Flood loss assessment in the Kota Tinggi. Paper presented at the IOP Con-ference Series: Earth and Environmental Science. https://doi.org/10.1088/1755-1315/18/1/012120
Thieken, A. H., Müller, M., Kreibich, H., & Merz, B. (2005). Flood damage and influencing factors: New insights from the Au-gust 2002 flood in Germany. Water resources research, 41(12). https://doi.org/10.1029/2005WR004177
Thieken, A. H., Olschewski, A., Kreibich, H., Kobsch, S., & Merz, B. (2008). Development and Evaluation of FLEMOps - A New Flood Loss Estimation MOdel for the private sector. WIT Trans-actions on Ecology and the Environment, 118, 315-324. https://doi.org/10.2495/FRIAR080301
U.S. Geological Survey. (n.d., Oct 27, 2016). How much water is there on, in, and above the Earth? Retrieved Oct 1, 2016, from http://water.usgs.gov/edu/earthhowmuch.html
United Nations. (2007). Industrial Development for the 21st Century: Sustainable Development Perspectives: United Na-tions Publications.
Van der Veen, A., Vetere Arellano, A., & Nordvik, J.-P. (2003, 23rd - 24th May 2003). In search of a common methodology on damage estimation: from the economist's perspective. Paper presented at the Joint NEDIES and University of Twente Work-shop, Report EUR, Delft, Netherlands.
Vojinovic, Z., Ediriweera, J., & Fikri, A. (2008). An approach to the model-based spatial assessment of damages caused by urban floods. Paper presented at the 11th International Conference on Urban Drainage.
White, G. F. (1964). Choice of Adjustment to Floods, Research paper no 93: Department of Geography, University of Chicago.
Yeganeh, N., & Sabri, S. (2014). Flood vulnerability assessment in Iskandar Malaysia using multi-criteria evaluation and fuzzy logic. Research Journal of Applied Sciences, Engineering and Technol-ogy, 8(16), 1794-1806. https://doi.org/10.19026/rjaset.8.1167
Zlateva, P., Pashova, L., Stoyanov, K., & Velev, D. (2011). Fuzzy logic model for natural risk assessment in SW Bulgaria. Paper presented at the 2nd International Conference on Education and Management Technology.