Journal of engineering and technology Performance of...
18
International Journal of Engineering and Technology Volume 5 No. 3,March, 2015 ISSN: 2049-3444 © 2015– IJET Publications UK. All rights reserved. 141 Performance of Coherent Optical OFDM in WDM System Based on QPSK and 16-QAM Modulation through Super channels Laith Ali Abdul-Rahaim 1 , Ibraheem Abdullah Murdas 1 and Mayasah Razzaq 1 Electrical Engineering Department, College of Engineering, Babylon University, Babylon, Iraq ABSTRACT In this paper, Polarization Division Multiplexing Coherent Optical Orthogonal Frequency-division Multiplexing (PDM CO-OFDM) system is designed with two modulation formats (QPSK and 16-QAM) at 40 and 100 Gb/s bit rates to show their linear and nonlinear behaver, and the maximum achievement reach at difference data rate. The system is first simulated with a single channel to analyze the performance. Then the system of 8-WDM channels is simulated at 50 GHz (0.4 nm) channel spacing. In order to evaluate the systems performance, spectrum result, electrical constellation diagrams, maximum reach versus the input power curves and BER verses OSNR curves are presented. A reference BER to evaluate the performance of the systems is taken as 1×10 -12 . PDM CO-OFDM QPSK is found to be the best performance for high capacity networks. In the case of single channel the optimal input power is found to be -2 dBm and 1dBm, which corresponding to the maximum reach of 4080 km and 2480 km at 40 Gb/s and 100 Gb/s respectively. For 8-WDM system the optimum input power was found to be -5 dBm and -2dBm, which corresponding to the maximum reach of 2320 km and 1440km at 40 Gb/s and 100 Gb/s respectively. The advantages of PDM CO-OFDM 16-QAM (improve spectral efficiency, decrease electrical bandwidth) come at the expense of reduced maximum reach and optimum input power. In the case of single channel the optimum input power was found to be -4 dBm and -1dBm, which corresponding to the maximum reach of 1760 km and 960km at 40 Gb/s and 100 Gb/s respectively. For 8-WDM system the optimum input power was determine to be -8 dBm and -4dBm, which give the maximum reach of 1040 km and 480km at 40 Gb/s and 100 Gb/s respectively. Simulation results are obtained using Optisystem (version 11.0) software package. KeyWords: Coherent Optical Ofdm, Qpsk And 16-Qam, Pdm, Wdm System. 1. INTRODUCTION Nowadays, with the advent of emerged multimedia applications, such as YouTube and Internet protocol TV (IPTV), those have again continued to drive the bandwidth demand. It does not that the growth of the internet traffic will slow in the foreseeable future [1]. The Cisco’s projection of Internet traffic to 2015[2], which shows bandwidth growth of a factor of 2 every 2 years. This phenomenal growth places tremendous pressure on the underlying information infrastructure at every level, from core to metro and access networks [2]. In the following section, several technologies are identified in optical communication networks arising from the rapid increase in IP traffic and merging applications. To cope with the tremendous growth of internet traffic and new services, the optical system that was dominated by a low- speed, point-to-point transmission a decade ago needs to be upgraded to support massive networking capabilities with a transmission speed approaching 100 Gb/s[1]. The most relevant technologies to increase the speed of optical transmission system are identified as using Wavelength Division Multiplexing (WDM), the transmission capacity can be easily increased by multiplexing the output of several transmitters for the existing fiber links without installation and alternation of the fiber link as shown in fig. (1).The multiplexed signal is fed into the optical fiber for transmission to the second end, where a demultiplexer sends each channel to it's belong receiver. When N channels at bit rates B1, B2 … BN are transmitted simultaneously over a fiber of length L, the total bit rate of the WDM link becomes as shown in the following eq. [3, 4]: = 1 + 2 +⋯ (1) If bit rates in channel were equal, the system capacity is improved by a factor of N. The most important parameters in the design of a WDM system are the number of channels N, the bit rate B at each channel operates, and the frequency spacing Δvch between two Successive channels. The product NB represents the WDM capacity and the product NΔvch denotes the total bandwidth for a WDM system. Such an approach can be considered as one of the most cost efficient ways to increase the optical link throughput [4, 5]. A different approach to realize a high speed optical transmission system is to use polarization division Fig.(1) Configuration for WDM transmission
Transcript of Journal of engineering and technology Performance of...

International Journal of Engineering and Technology Volume 5 No. 3,March, 2015
ISSN: 2049-3444 © 2015– IJET Publications UK. All rights reserved. 141
Performance of Coherent Optical OFDM in WDM System Based on QPSK
and 16-QAM Modulation through Super channels
Laith Ali Abdul-Rahaim1, Ibraheem Abdullah Murdas1 and Mayasah Razzaq1
Electrical Engineering Department, College of Engineering, Babylon University, Babylon, Iraq
ABSTRACT
In this paper, Polarization Division Multiplexing Coherent Optical Orthogonal Frequency-division Multiplexing (PDM CO-OFDM)
system is designed with two modulation formats (QPSK and 16-QAM) at 40 and 100 Gb/s bit rates to show their linear and
nonlinear behaver, and the maximum achievement reach at difference data rate. The system is first simulated with a single channel to
analyze the performance. Then the system of 8-WDM channels is simulated at 50 GHz (0.4 nm) channel spacing. In order to
evaluate the systems performance, spectrum result, electrical constellation diagrams, maximum reach versus the input power curves
and BER verses OSNR curves are presented. A reference BER to evaluate the performance of the systems is taken as 1×10-12. PDM
CO-OFDM QPSK is found to be the best performance for high capacity networks. In the case of single channel the optimal input
power is found to be -2 dBm and 1dBm, which corresponding to the maximum reach of 4080 km and 2480 km at 40 Gb/s and 100
Gb/s respectively. For 8-WDM system the optimum input power was found to be -5 dBm and -2dBm, which corresponding to the
maximum reach of 2320 km and 1440km at 40 Gb/s and 100 Gb/s respectively. The advantages of PDM CO-OFDM 16-QAM
(improve spectral efficiency, decrease electrical bandwidth) come at the expense of reduced maximum reach and optimum input
power. In the case of single channel the optimum input power was found to be -4 dBm and -1dBm, which corresponding to the
maximum reach of 1760 km and 960km at 40 Gb/s and 100 Gb/s respectively. For 8-WDM system the optimum input power was
determine to be -8 dBm and -4dBm, which give the maximum reach of 1040 km and 480km at 40 Gb/s and 100 Gb/s respectively.
Simulation results are obtained using Optisystem (version 11.0) software package.
KeyWords: Coherent Optical Ofdm, Qpsk And 16-Qam, Pdm, Wdm System.
1. INTRODUCTION
Nowadays, with the advent of emerged multimedia
applications, such as YouTube and Internet protocol TV
(IPTV), those have again continued to drive the bandwidth
demand. It does not that the growth of the internet traffic will
slow in the foreseeable future [1].
The Cisco’s projection of Internet traffic to 2015[2], which
shows bandwidth growth of a factor of 2 every 2 years. This
phenomenal growth places tremendous pressure on the
underlying information infrastructure at every level, from core
to metro and access networks [2]. In the following section,
several technologies are identified in optical communication
networks arising from the rapid increase in IP traffic and
merging applications.
To cope with the tremendous growth of internet traffic and
new services, the optical system that was dominated by a low-
speed, point-to-point transmission a decade ago needs to be
upgraded to support massive networking capabilities with a
transmission speed approaching 100 Gb/s[1]. The most
relevant technologies to increase the speed of optical
transmission system are identified as using Wavelength
Division Multiplexing (WDM), the transmission capacity can
be easily increased by multiplexing the output of several
transmitters for the existing fiber links without installation and
alternation of the fiber link as shown in fig. (1).The
multiplexed signal is fed into the optical fiber for transmission
to the second end, where a demultiplexer sends each channel
to it's belong receiver. When N channels at bit rates B1, B2 …
BN are transmitted simultaneously over a fiber of length L, the
total bit rate of the WDM link becomes as shown in the
following eq. [3, 4]:
𝐵𝑇 = 𝐵1 + 𝐵2 + ⋯ 𝐵𝑁 (1)
If bit rates in channel were equal, the system capacity is
improved by a factor of N. The most important parameters in
the design of a WDM system are the number of channels N,
the bit rate B at each channel operates, and the frequency
spacing Δvch between two Successive channels. The product
NB represents the WDM capacity and the product NΔvch
denotes the total bandwidth for a WDM system. Such an
approach can be considered as one of the most cost efficient
ways to increase the optical link throughput [4, 5].
A different approach to realize a high speed optical
transmission system is to use polarization division
Fig.(1) Configuration for WDM transmission
International Journal of Engineering and Technology (IJET) – Volume 5 No. 3, March, 2015
ISSN: 2049-3444 © 2015– IJET Publications UK. All rights reserved. 142
multiplexing (PDM). PDM is a way to increasing system
capacity or Spectral Efficiency (SE) by two. This done by
taking two independently channels with the same wavelength,
but orthogonal polarization states are transmitted
simultaneously in a same fiber. At the receiver end, the two
polarization channels are separated and detected independently
[5, 7]. The binary On/Off Keying (OOK) direct intensity
modulation format is the simplest modulation format and has
been the only modulation format used in the commercial
Dense WDM (DWDM) system until 10Gb/s per channel data
rate. For the 40Gb/s DWDM system, more advanced
modulation formats such as duobinary, Differential Binary
Phase Shift Keying (DBPSK), Quadrature Phase Shift Keying
(QPSK) as well as Differential Quadrature Phase Shift Keying
(DQPSK) have been introduced to enhance the Spectral
Efficiency SE [8]. An recent technology on the way to
100Gb/s line rates and to highest SE WDM networks are high-
order optical modulation formats, which encodes m = log2 M
data bits on M symbols. Transmission symbol rate, which is
reduced by M compared with the data rate. This method given
higher channel data rates by using existing equipment have
lower-speed and so we can increase the speed of present high-
speed electronics and Digital Signal Processing (DSP) [9].
By another words, when assuming a given data rate of a
channel, the transmission with lower symbol rates will reduce
the spectral width of a WDM channel and thus to improve the
SE. It can result in a reduced system reach through a higher
optical signal-to-noise ratio (OSNR) requirements coupled
with a reduced tolerance toward nonlinear impairments [10].
Orthogonal Frequency Division Multiplexing (OFDM) has
been preferably for physical-layer interface in wireless
communications recent decade. It has been widely studied in
mobile wireless communications to solve frequency-selective
fading problem and has been development to wireless network
standards and Digital Audio and Video Broadcastings (DAB
and DVB-T) in Europe, Asia, Australia, and other parts of the
world [11, 12]. The using of OFDM in optical
communications occurred recently, therefore a huge number of
papers on the theoretical and practical performance of OFDM
in many optical systems have published. Coherent Optical
Orthogonal Frequency Division Multiplexing (CO-OFDM)
combines the Characteristics of ‘coherent detection’ and
‘OFDM modulation’ for future high-data rate fiber
transmission systems [1, 13, and 14].
a. The Chromatic Dispersion (CD) and Polarization Mode
Dispersion (PMD) of the transmission system can be
effectively estimated and mitigated.
b. The spectra of OFDM subcarriers are partially overlapped,
resulting in high optical SE which is very suitable for the
future high speed optical transmission system [1].
c. OFDM takes advantage of digital signal processing of Fast
Fourier Transforms (FFTs) which suggests that the OFDM has
superior scalability over the channel dispersion and data rate
[1].
d. By using homodyne architecture, the electrical bandwidth
requirement can be greatly reduced for the CO-OFDM
transceiver, which is extremely attractive for the high-speed
circuit design, where electrical signal bandwidth dictates the
cost [1].
e. Migration towards higher order modulation in CO-OFDM
systems is enabled simply.
In contrast, this requires more complicated optical modulator
configuration in single-carrier systems [15]. Due to the
superior advantages offered by CO-OFDM, it has been
considered to be a promising technology for the high speed
optical transport system. All the mentioned technologies to
increase the speed of optical transmission system are used in
this paper and concentrates on the most promising version of
these technologies for future optical networks, the CO-OFDM
system. The Literature Survey that interest in the field of this
paper began with Shieh et al, [8] in 2007, which reported the
first experimental demonstration of CO-OFDM systems. 128
OFDM subcarriers with a nominal data-rate of 8 Gb/s were
successfully processed and recovered after 1000 km
transmission through standard-single-mode-fiber (SSMF)
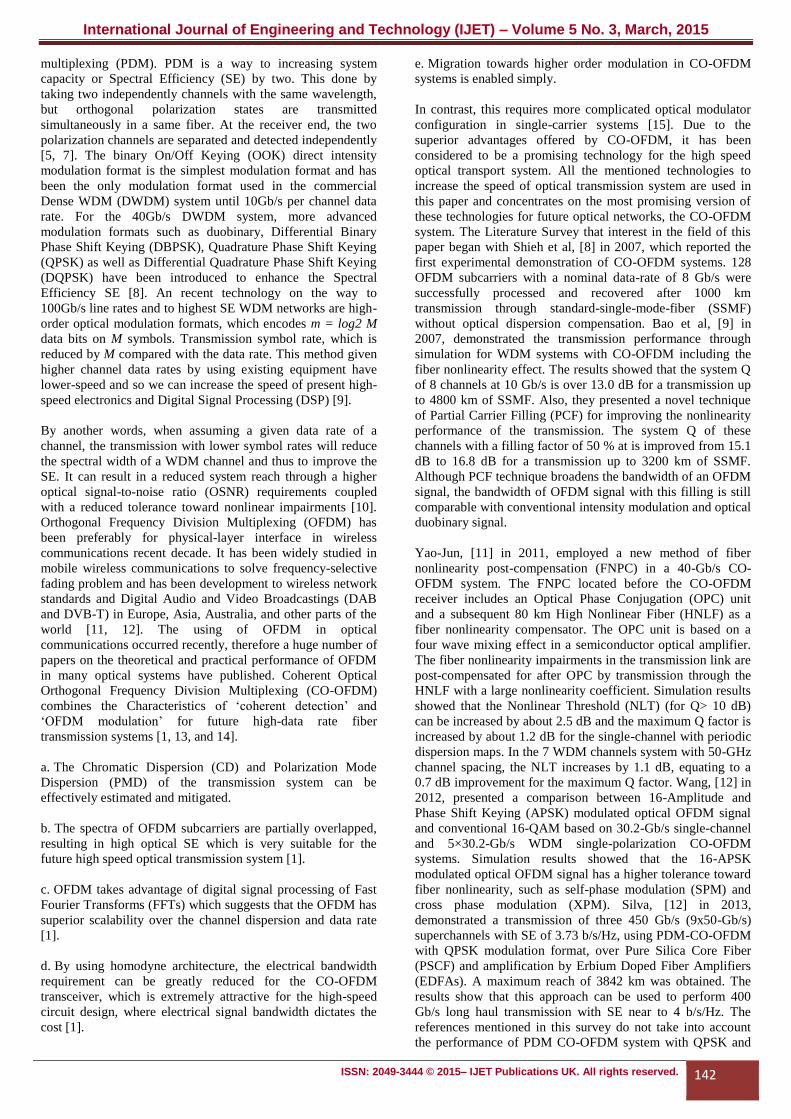
without optical dispersion compensation. Bao et al, [9] in
2007, demonstrated the transmission performance through
simulation for WDM systems with CO-OFDM including the
fiber nonlinearity effect. The results showed that the system Q
of 8 channels at 10 Gb/s is over 13.0 dB for a transmission up
to 4800 km of SSMF. Also, they presented a novel technique
of Partial Carrier Filling (PCF) for improving the nonlinearity
performance of the transmission. The system Q of these
channels with a filling factor of 50 % at is improved from 15.1
dB to 16.8 dB for a transmission up to 3200 km of SSMF.
Although PCF technique broadens the bandwidth of an OFDM
signal, the bandwidth of OFDM signal with this filling is still
comparable with conventional intensity modulation and optical
duobinary signal.
Yao-Jun, [11] in 2011, employed a new method of fiber
nonlinearity post-compensation (FNPC) in a 40-Gb/s CO-
OFDM system. The FNPC located before the CO-OFDM
receiver includes an Optical Phase Conjugation (OPC) unit
and a subsequent 80 km High Nonlinear Fiber (HNLF) as a
fiber nonlinearity compensator. The OPC unit is based on a
four wave mixing effect in a semiconductor optical amplifier.
The fiber nonlinearity impairments in the transmission link are
post-compensated for after OPC by transmission through the
HNLF with a large nonlinearity coefficient. Simulation results
showed that the Nonlinear Threshold (NLT) (for Q> 10 dB)
can be increased by about 2.5 dB and the maximum Q factor is
increased by about 1.2 dB for the single-channel with periodic
dispersion maps. In the 7 WDM channels system with 50-GHz
channel spacing, the NLT increases by 1.1 dB, equating to a
0.7 dB improvement for the maximum Q factor. Wang, [12] in
2012, presented a comparison between 16-Amplitude and
Phase Shift Keying (APSK) modulated optical OFDM signal
and conventional 16-QAM based on 30.2-Gb/s single-channel
and 5×30.2-Gb/s WDM single-polarization CO-OFDM
systems. Simulation results showed that the 16-APSK
modulated optical OFDM signal has a higher tolerance toward
fiber nonlinearity, such as self-phase modulation (SPM) and
cross phase modulation (XPM). Silva, [12] in 2013,
demonstrated a transmission of three 450 Gb/s (9x50-Gb/s)
superchannels with SE of 3.73 b/s/Hz, using PDM-CO-OFDM
with QPSK modulation format, over Pure Silica Core Fiber
(PSCF) and amplification by Erbium Doped Fiber Amplifiers
(EDFAs). A maximum reach of 3842 km was obtained. The
results show that this approach can be used to perform 400
Gb/s long haul transmission with SE near to 4 b/s/Hz. The
references mentioned in this survey do not take into account
the performance of PDM CO-OFDM system with QPSK and
International Journal of Engineering and Technology (IJET) – Volume 5 No. 3, March, 2015
ISSN: 2049-3444 © 2015– IJET Publications UK. All rights reserved. 143
16-QAM modulation formats for high speed application at
different bit rate. Also, the linear and nonlinear limits, and the
maximum reach for these systems are addressed in this paper
carefully. The aims of this paper are to investigate the
performance PDM CO-OFDM system with QPSK and 16-
QAM modulation formats for high speed applications. The
studied data rate at 40 and 100 Gb/s. The system is first
simulated with a single channel and then 8-WDM channels are
connected at 50 GHz channel spacing. And to investigate the
linear and nonlinear limits and the maximum reach for these
systems. The performance of the following systems is tested
using Optisystem (version 11.0) software package. This paper
is organized as follows: In Section 1, an introduction to the
subjects of the paper, literature survey, and the objective to the
paper are given. In Section 2, a description of channel
impairments, an OFDM principles and Optical-OFDM are
considered. In Section 3, a design of PDM CO-OFDM systems
with QPSK and 16 QAM modulation formats are given. In
Sections 4, the results and discussions of numerical results
derived from analysis of the simulated system are given. In
Section 8, conclusions for the work are summarized.
2. OPTICAL-OFDM
The radio frequency (RF) domain OFDM has been studied in
last forty years. OFDM has only recently been applied to
optical communications. In 2006, three groups independently
proposed optical OFDM for long-haul application. Two major
research directions appeared Direct Detection Optical-OFDM
(DDO-OFDM) and Coherent Optical-OFDM (CO-OFDM)
[26]. Both techniques have advantages. CO-OFDM has the
highest performance in power and spectral efficiency and
robustness against polarization dispersion. DDO-OFDM has
simpler optical receiver architecture, but a frequency guard
band is needed to prevent the interference from mixing
products which reduces the electrical and optical spectral
efficiency. Besides, as some power is allocated to the
transmitted carrier, DDO-OFDM also requires more
transmitted optical power. Currently, there is extensive
research into the performance of both systems and on
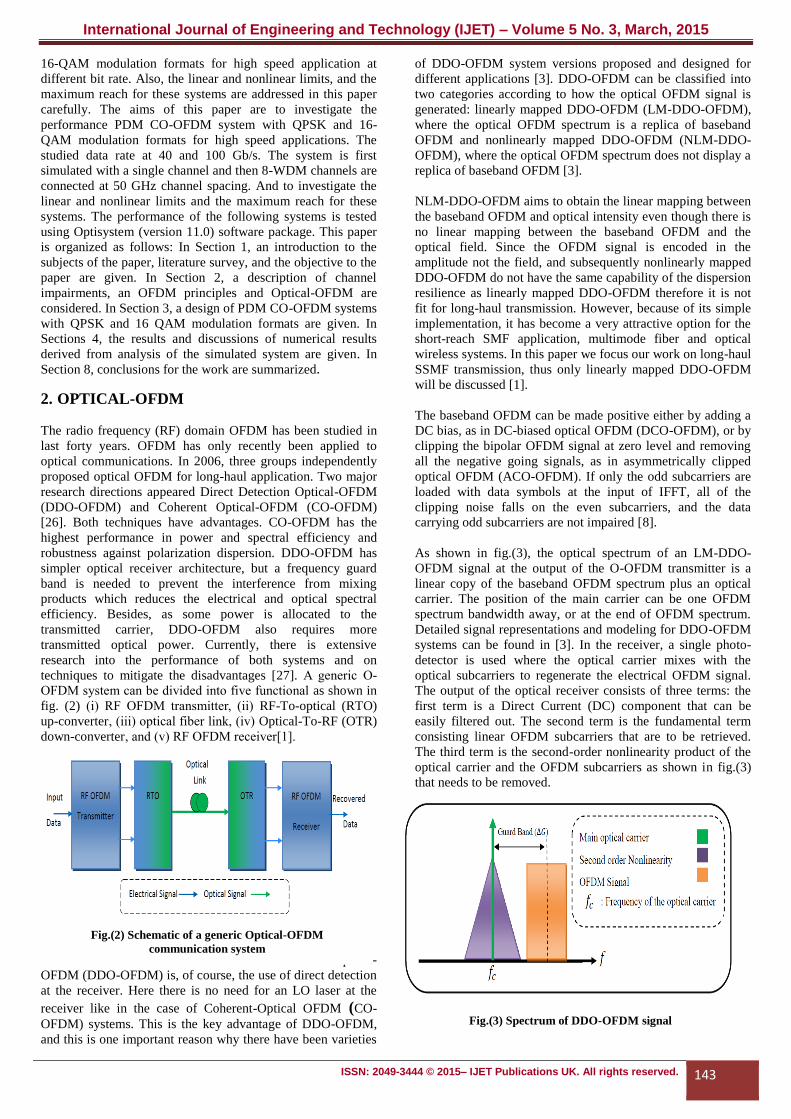
techniques to mitigate the disadvantages [27]. A generic O-
OFDM system can be divided into five functional as shown in
fig. (2) (i) RF OFDM transmitter, (ii) RF-To-optical (RTO)
up-converter, (iii) optical fiber link, (iv) Optical-To-RF (OTR)
down-converter, and (v) RF OFDM receiver[1].
The common feature for Direct Detection Optical-
OFDM (DDO-OFDM) is, of course, the use of direct detection
at the receiver. Here there is no need for an LO laser at the
receiver like in the case of Coherent-Optical OFDM (CO-
OFDM) systems. This is the key advantage of DDO-OFDM,
and this is one important reason why there have been varieties
of DDO-OFDM system versions proposed and designed for
different applications [3]. DDO-OFDM can be classified into
two categories according to how the optical OFDM signal is
generated: linearly mapped DDO-OFDM (LM-DDO-OFDM),
where the optical OFDM spectrum is a replica of baseband
OFDM and nonlinearly mapped DDO-OFDM (NLM-DDO-
OFDM), where the optical OFDM spectrum does not display a
replica of baseband OFDM [3].
NLM-DDO-OFDM aims to obtain the linear mapping between
the baseband OFDM and optical intensity even though there is
no linear mapping between the baseband OFDM and the
optical field. Since the OFDM signal is encoded in the
amplitude not the field, and subsequently nonlinearly mapped
DDO-OFDM do not have the same capability of the dispersion
resilience as linearly mapped DDO-OFDM therefore it is not
fit for long-haul transmission. However, because of its simple
implementation, it has become a very attractive option for the
short-reach SMF application, multimode fiber and optical
wireless systems. In this paper we focus our work on long-haul
SSMF transmission, thus only linearly mapped DDO-OFDM
will be discussed [1].
The baseband OFDM can be made positive either by adding a
DC bias, as in DC-biased optical OFDM (DCO-OFDM), or by
clipping the bipolar OFDM signal at zero level and removing
all the negative going signals, as in asymmetrically clipped
optical OFDM (ACO-OFDM). If only the odd subcarriers are
loaded with data symbols at the input of IFFT, all of the
clipping noise falls on the even subcarriers, and the data
carrying odd subcarriers are not impaired [8].
As shown in fig.(3), the optical spectrum of an LM-DDO-
OFDM signal at the output of the O-OFDM transmitter is a
linear copy of the baseband OFDM spectrum plus an optical
carrier. The position of the main carrier can be one OFDM
spectrum bandwidth away, or at the end of OFDM spectrum.
Detailed signal representations and modeling for DDO-OFDM
systems can be found in [3]. In the receiver, a single photo-
detector is used where the optical carrier mixes with the
optical subcarriers to regenerate the electrical OFDM signal.
The output of the optical receiver consists of three terms: the
first term is a Direct Current (DC) component that can be
easily filtered out. The second term is the fundamental term
consisting linear OFDM subcarriers that are to be retrieved.
The third term is the second-order nonlinearity product of the
optical carrier and the OFDM subcarriers as shown in fig.(3)
that needs to be removed.
The following approaches can be used to minimize the pena
Fig.(2) Schematic of a generic Optical-OFDM
communication system
Fig.(3) Spectrum of DDO-OFDM signal
International Journal of Engineering and Technology (IJET) – Volume 5 No. 3, March, 2015
ISSN: 2049-3444 © 2015– IJET Publications UK. All rights reserved. 144
due to the second-order nonlinearity term; the effect of the
unwanted nonlinearity term can be avoided by allocating a
sufficient guard band. This guard band is set by RF I/Q
modulator at the transmitter, as shown in fig. (4). Another way
to reduce the distortion of the nonlinearity term to an
acceptable level is by reducing the scaling coefficient that
describes the OFDM band strength related to the main carrier
as much as possible [1,3].
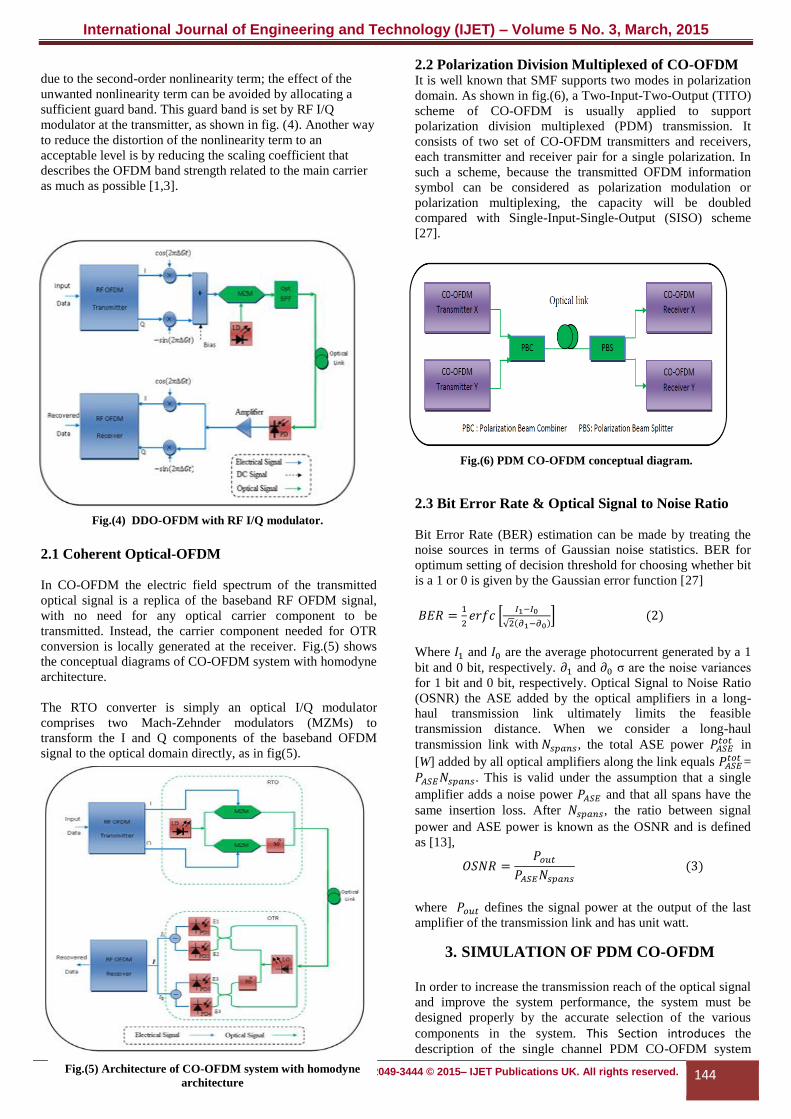
2.1 Coherent Optical-OFDM
In CO-OFDM the electric field spectrum of the transmitted
optical signal is a replica of the baseband RF OFDM signal,
with no need for any optical carrier component to be
transmitted. Instead, the carrier component needed for OTR
conversion is locally generated at the receiver. Fig.(5) shows
the conceptual diagrams of CO-OFDM system with homodyne
architecture.
The RTO converter is simply an optical I/Q modulator
comprises two Mach-Zehnder modulators (MZMs) to
transform the I and Q components of the baseband OFDM
signal to the optical domain directly, as in fig(5).
2.2 Polarization Division Multiplexed of CO-OFDM It is well known that SMF supports two modes in polarization
domain. As shown in fig.(6), a Two-Input-Two-Output (TITO)
scheme of CO-OFDM is usually applied to support
polarization division multiplexed (PDM) transmission. It
consists of two set of CO-OFDM transmitters and receivers,
each transmitter and receiver pair for a single polarization. In
such a scheme, because the transmitted OFDM information
symbol can be considered as polarization modulation or
polarization multiplexing, the capacity will be doubled
compared with Single-Input-Single-Output (SISO) scheme
[27].
2.3 Bit Error Rate & Optical Signal to Noise Ratio
Bit Error Rate (BER) estimation can be made by treating the
noise sources in terms of Gaussian noise statistics. BER for
optimum setting of decision threshold for choosing whether bit
is a 1 or 0 is given by the Gaussian error function [27]
𝐵𝐸𝑅 =1
2𝑒𝑟𝑓𝑐 [
𝐼1−𝐼0
√2(𝜕1−𝜕0)] (2)
Where 𝐼1 and 𝐼0 are the average photocurrent generated by a 1
bit and 0 bit, respectively. 𝜕1 and 𝜕0 σ are the noise variances
for 1 bit and 0 bit, respectively. Optical Signal to Noise Ratio
(OSNR) the ASE added by the optical amplifiers in a long-
haul transmission link ultimately limits the feasible
transmission distance. When we consider a long-haul
transmission link with 𝑁𝑠𝑝𝑎𝑛𝑠, the total ASE power 𝑃𝐴𝑆𝐸𝑡𝑜𝑡 in
[W] added by all optical amplifiers along the link equals 𝑃𝐴𝑆𝐸𝑡𝑜𝑡 =
𝑃𝐴𝑆𝐸𝑁𝑠𝑝𝑎𝑛𝑠. This is valid under the assumption that a single
amplifier adds a noise power 𝑃𝐴𝑆𝐸 and that all spans have the
same insertion loss. After 𝑁𝑠𝑝𝑎𝑛𝑠, the ratio between signal
power and ASE power is known as the OSNR and is defined
as [13],
𝑂𝑆𝑁𝑅 =𝑃𝑜𝑢𝑡
𝑃𝐴𝑆𝐸𝑁𝑠𝑝𝑎𝑛𝑠
(3)
where 𝑃𝑜𝑢𝑡 defines the signal power at the output of the last
amplifier of the transmission link and has unit watt.
3. SIMULATION OF PDM CO-OFDM In order to increase the transmission reach of the optical signal
and improve the system performance, the system must be
designed properly by the accurate selection of the various
components in the system. This Section introduces the
description of the single channel PDM CO-OFDM system
Fig.(6) PDM CO-OFDM conceptual diagram.
Fig.(5) Architecture of CO-OFDM system with homodyne
architecture
Fig.(4) DDO-OFDM with RF I/Q modulator.

International Journal of Engineering and Technology (IJET) – Volume 5 No. 3, March, 2015
ISSN: 2049-3444 © 2015– IJET Publications UK. All rights reserved. 145
with QPSK and 16-QAM modulation formats from the
transmitter to the receiver. Then, the 8-WDM channels system
is discussed considering all the system components.
a. Single Channel Description
In this section, a description of the single channel system is
presented. The simulation parameters of this system are shown
in table (1). A Pseudo Random Binary Sequence (PRBS)
generator is usually required to generate pseudo random binary
sequences. PRBS drives 20 and 50 Gb/s bit rate. Using
polarization division multiplexing, entire system bit rate will
be increased to 40 and 100 Gb/s. The simulated single
channel system is shown in fig. (7) with three main parts: PDM CO-OFDM Transmitter, Optical Fiber, and PDM CO-
OFDM Receiver. The description of each part of the system is
presented in the following subsections.
Table (1) Simulation Parameters
Parameter Value Units
Bit rate 20 and 50 Gb/s
Time window 0.8192e-06 for 20 Gb/s and
0.32768e-06 for 50 Gb/s s
Sequence length 16384 bit
Transmitter Structure
The transmitter section is shown in fig.(8):
In this case, polarization multiplexing is used, the laser output
is split into two orthogonal polarization components by
Polarization Beam Splitter (PBS), which are modulated
separately and then combined using a Polarization Beam
Combiner (PBC). The parameters of the simulated CW laser
are shown in table (2).
Table (2) Parameters of the CW laser
Parameter Value Units
Frequency 193.1 THz
power variable dBm
Linewidth 0.1 MHz
Initial phase 0 degree
The transmitter section of the simulated system for each
polarization is built with two parts: RF OFDM transmitter and
RTO Convertor.
RF OFDM transmitter is built up using Sequence Generator,
OFDM modulator and two low pass Roll off electrical filters
as shown in fig.(9). It starts with the Sequence Generator to
generate two parallel M-ary symbol sequences from binary
signals using two forms of sequence generator that is QPSK
and 16-QAM. After that, it passes through OFDM modulator
component. In it, the complex symbol streams converted from
serial to parallel, and then the digital time domain signal is
obtained using IFFT, which is subsequently converted into a
real-time waveform through a DAC. After that, each OFDM
signal component (I and Q) passes through low pass Roll off
filter to reduce the influence of the aliasing components on the
system performance. The parameters of the simulated RF
OFDM transmitter are shown in table (3).
Fig.(7) Single Channel PDM CO-OFDM System.
Fig.(9) Block diagram of the RF OFDM transmitter
Fig.(8) The transmitter section of single
channel system.

International Journal of Engineering and Technology (IJET) – Volume 5 No. 3, March, 2015
ISSN: 2049-3444 © 2015– IJET Publications UK. All rights reserved. 146
Table (3) Parameters of the RF OFDM Transmitter
and Receiver.
OFDM Modulator
Parameter Value Units
Sequence generator
type QPSK and 16-QAM
Bit/sysmbol 2 for QPSK and 4 for 16-QAM
Number of
Subcarriers 128
Position Array 64
Number of
IFFT/FFT points 256
FFT type Radix-2
Baud Rate for
50Gb/s
25 for QPSK and 12.5 for
16-QAM Gbaud/s
Baud Rate for
20Gb/s
10 for QPSK and 5 for 16-
QAM Gbaud/s
Sampling
Frequency for
50Gb/s
50 for QPSK and 25 for 16-
QAM GHz
Sampling
Frequency for
20Gb/s
20 for QPSK and 10 for 16-
QAM GHz
Spectral Efficiency 2 for QPSK and 4 for 16-
QAM b/s/Hz
Low Pass Cosine Role Off Filter
Cut off frequency 0.6 * Bit rate for QPSK and
0.3* Bit rate for 16-QAM GHz
Insertion Loss 0 dB
Depth 100 dB
Roll off factor 0.2
The RTO up-converter (the I/Q optical modulator) is built up
using an X-coupler, two Mach-Zehnder modulators, and an
optical combiner. The optical signal from the laser source is
applied to the first input port of the coupler to yield the I and Q
carrier components, at the output ports, which are fed to the
MZMs, as shown in fig.(10). Lithium Niubate MZM (LiNb-
MZM) with dual-drive type is used. Each MZM is driven by
the positive and negative signals of one of the components of
the baseband OFDM signal (I or Q) at the two inputs of
modulating signal of the MZM. The output signals from the
two MZMs are combined by the optical combiner to form the
CO-OFDM signal. The parameters of the simulated RTO
Converter are shown in table (4).
After that, an EDFA amplifier is used as a booster amplifier to
compensate the losses incurred in the transmitter and then
boosts the signal in the optical fiber channel. The EDFA is
operated in the power control mode with a gain of 10 dB and a
noise figure of 4 dB.
Table (4) Parameters of the RTO Converter.
Match Zehnder Modulator
Parameter Value Units
Electrical gain (1&2) -1
MZMs extinction ratio 60 dB
MZMs insertion loss 1 dB
MZMs switching RF voltage 4 V
MZMs switching bias voltage 4 V
Booster Amplifier
EDFA amplifier gain 10 dB
Noise Figure 4 dB
b. Optical Fiber Channel
The CO-OFDM signal is then lunched in the optical fiber
channel. The optical fiber channel as shown in fig.(11) is
composed of spans of 80 km of SMF. The fiber has a loss of
0.2 dB/km, a dispersion of 17 ps/nm/km, a dispersion slope
coefficient of 0.075 ps/(km.nm2), a nonlinearity coefficient of
2.6×e(-20) m2/W and an effective cross-section of 70 μm2. The
value of the PMD parameter is 0.001 ps/√𝑘𝑚 and it is
expected that CO-OFDM has high PMD tolerance. Fiber
dispersion is compensated by the Dispersion Compensation
Fiber (DCF) of 16 km. Its attenuation constant is 0.5 dB/km,
the dispersion coefficient value is -85 ps/(km.nm), the
dispersion slope coefficient is -0.3 ps/(km.nm2) and effective
area is 22 μm2. The attenuation of SMF and DCF are
compensated by EDFA in each span. The simulation
parameters of the optical fibers channel are listed in table (5).
Fig.(10) Block diagram of the RTO up-converter
Fig.(11) Block diagram of the of the optical fiber channel
International Journal of Engineering and Technology (IJET) – Volume 5 No. 3, March, 2015
ISSN: 2049-3444 © 2015– IJET Publications UK. All rights reserved. 147
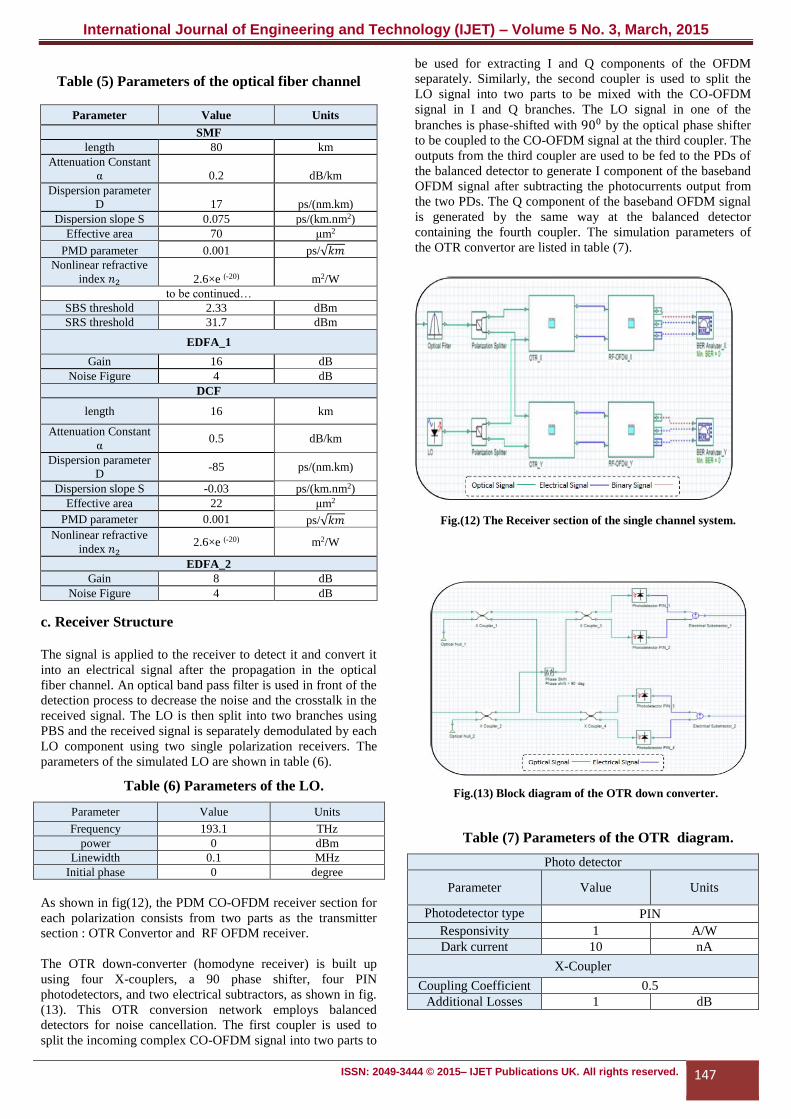
Table (5) Parameters of the optical fiber channel
Parameter Value Units
SMF
length 80 km
Attenuation Constant
α 0.2 dB/km
Dispersion parameter
D 17 ps/(nm.km)
Dispersion slope S 0.075 ps/(km.nm2)
Effective area 70 μm2
PMD parameter 0.001 ps/√𝑘𝑚
Nonlinear refractive
index 𝑛2 2.6×e (-20) m2/W
to be continued…
SBS threshold 2.33 dBm
SRS threshold 31.7 dBm
EDFA_1
Gain 16 dB
Noise Figure 4 dB
DCF
length 16 km
Attenuation Constant
α 0.5 dB/km
Dispersion parameter
D -85 ps/(nm.km)
Dispersion slope S -0.03 ps/(km.nm2)
Effective area 22 μm2
PMD parameter 0.001 ps/√𝑘𝑚
Nonlinear refractive
index 𝑛2 2.6×e (-20) m2/W
EDFA_2
Gain 8 dB
Noise Figure 4 dB
c. Receiver Structure
The signal is applied to the receiver to detect it and convert it
into an electrical signal after the propagation in the optical
fiber channel. An optical band pass filter is used in front of the
detection process to decrease the noise and the crosstalk in the
received signal. The LO is then split into two branches using
PBS and the received signal is separately demodulated by each
LO component using two single polarization receivers. The
parameters of the simulated LO are shown in table (6).
Table (6) Parameters of the LO.
Parameter Value Units
Frequency 193.1 THz
power 0 dBm
Linewidth 0.1 MHz
Initial phase 0 degree
As shown in fig(12), the PDM CO-OFDM receiver section for
each polarization consists from two parts as the transmitter
section : OTR Convertor and RF OFDM receiver.
The OTR down-converter (homodyne receiver) is built up
using four X-couplers, a 90 phase shifter, four PIN
photodetectors, and two electrical subtractors, as shown in fig.
(13). This OTR conversion network employs balanced
detectors for noise cancellation. The first coupler is used to
split the incoming complex CO-OFDM signal into two parts to
be used for extracting I and Q components of the OFDM
separately. Similarly, the second coupler is used to split the
LO signal into two parts to be mixed with the CO-OFDM
signal in I and Q branches. The LO signal in one of the
branches is phase-shifted with 900 by the optical phase shifter
to be coupled to the CO-OFDM signal at the third coupler. The
outputs from the third coupler are used to be fed to the PDs of
the balanced detector to generate I component of the baseband
OFDM signal after subtracting the photocurrents output from
the two PDs. The Q component of the baseband OFDM signal
is generated by the same way at the balanced detector
containing the fourth coupler. The simulation parameters of
the OTR convertor are listed in table (7).
Table (7) Parameters of the OTR diagram.
Photo detector
Parameter Value Units
Photodetector type PIN
Responsivity 1 A/W
Dark current 10 nA
X-Coupler
Coupling Coefficient 0.5
Additional Losses 1 dB
Fig.(12) The Receiver section of the single channel system.
Fig.(13) Block diagram of the OTR down converter.

International Journal of Engineering and Technology (IJET) – Volume 5 No. 3, March, 2015
ISSN: 2049-3444 © 2015– IJET Publications UK. All rights reserved. 148
The received electrical signals (I and Q) are then amplified
with two electrical amplifiers having a gain of 20dB as shown
in fig.(14). After amplification, the signals are passed through
Low Pass Roll off filters to eliminate the frequencies above
required band, usually, the same characteristics as the low-pass
filters used in the RF-OFDM transmitter.
Then these signals are fed to an OFDM demodulator
component. In it, the received baseband OFDM signal is
sampled by ADC, and then the FFT of each OFDM subcarrier
is taken to find the original transmitted symbol. After that
Sequence Decoder decodes two parallel M-ary symbol
sequences to binary signals. The decoding process is done by
QPSK and 16-QAM Sequence decoder. Then, the binary
signal passes through NRZ pulse generator to generate a Non
Return to Zero (NRZ) electrical signal. The 3R generator is
used to generate the original bit sequence, and the modulated
electrical signal to be used for BER analysis. The simulation
parameters of the RF OFDM Receiver are the same parameter
in table (3).
3.5 WDM System Description The description of the PDM CO-OFDM system with 8-WDM
channel can be divided into two parts:
3.5.1 Transmitter Structure
The block diagram of the transmitter side of the 8-WDM PDM
CO-OFDM is shown in fig. (15). The PDM CO-OFDM
channels are fed into a multiplexer. The simulation parameters
of the multiplexers and the demultiplexers used in the WDM
system are shown in table (8).
Table (8) Parameters of the optical multiplexers and
demultiplexers for WDM System.
Mux/Demux
Parameter Value Units
Frequency spacing 50 GHz GHz
Bandwidth 40 for QPSK and 20
for 16-QAM GHz
Insertion loss 2 dB
Filter type Gaussian
Filter order 4
As in the case of the single channel transmission, an optical
booster amplifier with the same parameters is used in the
WDM system to accommodate the losses incurred in the signal
at the transmitter.
3.5.2 Receiver Structure
Once the propagation of the signal passes through the optical
fiber channel, it is then received and detected in the receiver.
The receiver structure of the 8WDM channels PDM CO-
OFDM system is shown in fig.(16).The channels are
demultiplexed with same parameters used in table (8).
Fig.(14) Block diagram of the RF OFDM receiver
Fig.(15) The transmitter side of the simulated WDM system.

International Journal of Engineering and Technology (IJET) – Volume 5 No. 3, March, 2015
ISSN: 2049-3444 © 2015– IJET Publications UK. All rights reserved. 149
4. Simulation Results:
The simulation results in this paper showed the behaver of
PDM CO-OFDM QPSK and 16-QAM system at 40and
100Gbit/s to understand the linear and nonlinear limits, and the
maximum achievable reach at each data rate. The data rate of
100Gbit/s was chosen to match the speed of the next
generation optical networks.
4.1 Single Channel PDM CO-OFDM System with
QPSK modulation:-
The main results in this system are:
4.1.1 Spectrum Result
Fig.(17) shows the RF spectrum analyzer PDM CO-OFDM
QPSK signal before and after 1200 km transmission distance
at 100 Gb/s.
Fig.(18) shows the optical spectrum of PDM CO-OFDM
QPSK signal before and after 1200 km transmission distance
at 100 Gb/s. The 20 dB bandwidth of the signal is around 25
GHz.
4.1.2 Received Electrical Constellation Diagram
Fig. (19) shows the received constellation diagram after
removing the chromatic dispersion by DCF for 1200 km with
different input power. The constellation of each OFDM
symbols corresponding QPSK data points is recovered with
four distinct clusters of. The residual noises spreading
constellation point are mainly from ASE in transmission
system, nonlinearity of optical fibers and PMD. According to
the SPM formula, there is no doubt that a higher input power
would lead to a larger nonlinearity distortion. As shown in
fig(20), when the fiber transmission distance increases, the
distortion increases. This simulation result is consistent with
the discussions in section 2.2 that the phase shift caused by
Fig.(16) The receiver side of the simulated WDM
system.
Fig.(17) RF Spectrum of PDM CO-OFDM QPSK signal (a)
before (b) after 1200 km transmission distance.
Fig.(18) Optical spectrum of PDM CO-OFDM QPSK signal
(a) before and (b) after 1200 km transmission distance.

International Journal of Engineering and Technology (IJET) – Volume 5 No. 3, March, 2015
ISSN: 2049-3444 © 2015– IJET Publications UK. All rights reserved. 150
fiber nonlinearity is positively related with fiber transmission
length.
4.1.3 Measurements of Maximum reach
The maximum reach was measured as a function of input
power at 40 and 100 Gbit/s (Fig.(21)), to characterize the
linear and nonlinear limits for QPSK PDM CO-OFDM
transmission. This done by assuming the BER = 10-12. The
results are summarized in table (9).
For 100 Gbit/s QPSK PDM CO-OFDM transmission the input
power had to be increased by ~4dBm to get the same distances
in that been get in transmission at 40 Gbit/s. This is because
the in-band noise power scales linearly with the symbol rate
due to the associated broadening spectral.
Fig.(19) Received constellation diagram after 1200 km with
different input power. a) -2 dBm, b) 0 dBm, c) 2 dBm
(C)
Fig(20) Received constellation single channel system with 0dBm
input power after different transmission distances (a) 1520 km,
(b) 1840 km (c) 2160 km.
(C)

International Journal of Engineering and Technology (IJET) – Volume 5 No. 3, March, 2015
ISSN: 2049-3444 © 2015– IJET Publications UK. All rights reserved. 151
Table (9) Maximum reach and Optimum Input
Power of single channel PDM CO-OFDM QPSK
system at 40 and 100Gb/s.
Bit rate (Gb/s) Max. Reach (km) Optimum Input
Power (dBm)
Single channel CO-OFDM PDM QPSK system
40 4080 -2
100 2480 1
4.1.4 OSNR Measurement
To characterize the PDM CO-OFDM QPSK signal at 40
Gbit/s and 100 Gbit/s, the BER was determined as a function
of OSNR, and the results are shown in fig.(22). The required
OSNR for the 100 Gb/s is 8.32 dB at BER=10-12, which is 2.19
dB higher than that for 40 Gb/s. This can be attributed to
increase in symbol rate by a factor of more than two resulted
in additional 2.19 dB OSNR retribution due to the bandwidth
increasing.
4.2 Single Channel PDM CO-OFDM System with
16-QAM modulation format
The bit-rate of 100Gbit/s can be achieved using a QPSK PDM
CO-OFDM system operating at 25Gbaud. Indeed, such a
system can give ultra-long distances, potentially sufficient to
use in trans-oceanic routes. The QPSK CO-OFDM PDM
signal needed lower OSNR than higher-order modulation
formats for the equivalent data rates. It also advantage from
the single amplitude (constant modulus), that improve the
tolerance to nonlinearity compared to modulation of multi-
level formats. The advantage of generating 100Gbit/s PDM
CO-OFDM signals using 16-QAM, however, is has lower
symbol rate of 12.5Gbaud requires less by a factor of two
compared to QPSK. A lower symbol rate dangles the
requirements on the bandwidth of the electronics at the
transmitter and the receiver, reducing the cost of electronic and
electro-optical components used. 16-QAM can also increase
the spectral efficiency in WDM transmission, so can be
reduced the spacing between the WDM channels. Another
advantage of 16-QAM over QPSK signals is that at higher bit-
rates (e.g. 200Gbit/s), it becomes impractical to use since a
QPSK signal would require a symbol rate of 100Gbaud for
which electronics at the transmitter and receiver is not easily
available. Therefore, a 25Gbaud PDM CO-OFDM 16-QAM
could be better to obtain a 200Gbit/s. Similarly to the QPSK
this section shows the comprehensive study of PDM CO-
OFDM 16-QAM at 40 and 100 Gb/s in terms of maximum
reach. Similar to the QPSK experiments simulate in section
(4.1), the main results measured in the 16-QAM PDM CO-
OFDM single channel are:
4.2.1 Spectrum Result
Fig.(23) shows the RF spectrum analyzer PDM CO-OFDM
16-QAM signal before and after 560 km transmission distance
at 100 Gb/s.
Fig.(24) shows the optical spectrum of PDM CO-OFDM 16-
QAM signal at 100Gb/s before and after 560 transmission
distance. The 20 dB bandwidth of the signal is around 12.5
GHz.
Fig.(21) Measured maximum reach of single channel PDM
CO-OFDM QPSK transmission at 40Gbit/s and 100Gbit/s.
Fig.(22) Measured OSNR for 40 Gbit/s and 100 Gbit/s
single channel PDM CO-OFDM QPSK. Fig.(23) RF Spectrum of 100 Gb/s PDM CO-OFDM 16-
QAM signal (a) before (b) after 560 km transmission
distance

International Journal of Engineering and Technology (IJET) – Volume 5 No. 3, March, 2015
ISSN: 2049-3444 © 2015– IJET Publications UK. All rights reserved. 152
4.2.2 Received Electrical Constellation Diagrams
Fig.(25) shows the received constellation diagram after 560
km at different input power. Fig.(26) shows the received
constellation diagram with 0 dBm input power at different
distances.
4.2.3 Maximum reach measurements
The performance of transmission PDM CO-OFDM 16-QAM
signals are simulated in this section. The curves of maximum
reach were determined as a function of input power into the
fiber (at BER = 10-12) and are shown in fig.(27). In the case of
40Gbit/s the optimum input power was found to be -4dBm,
corresponding to the maximum reach of 1460km. At 111Gbit/s
PDM CO-OFDM 16-QAM transmission the optimum input
power was been -1dBm to given a maximum reach of 960km.
It is clear that 16-QAM modulation given (more spectral
efficiency and lower electrical bandwidth). This is at the
(C)
Fig.(25) Received constellation diagram after
560 km with different input power. a) -2 dBm,
b) 0 dBm, c) 2 dBm.
Fig.(27) Measured maximum reach of single channel PDM
CO-OFDM 16-QAM transmission at 40Gbit/s and
100Gbit/s
Fig(26) Received constellation single channel system with
0dBm input power after different transmission distances (a)
560 km, (b) 720 km(c) 900 km.
(C)
Fig.(24) RF Spectrum of 100 Gb/s PDM CO-OFDM 16-
QAM signal (a) before (b) after 560 transmission distance

International Journal of Engineering and Technology (IJET) – Volume 5 No. 3, March, 2015
ISSN: 2049-3444 © 2015– IJET Publications UK. All rights reserved. 153
expense of decreased maximum reach and optimum input
power. The results are summarized in table (10).
Table (10) Maximum reach and Optimum Input
Power of single channel PDM CO-OFDM 16-QAM
system at 40 Gb/s and 100Gb/s.
Bit rate (Gb/s) Max. Reach (km) Optimum Input
Power (dBm)
Single Channel CO-OFDM PDM 16-QAM System
40 1760 -4
100 061 -1
4.2.4 OSNR Measurement
To characterize the PDM CO-OFDM 16-QAM signal at 40
Gbit/s and 100 Gbit/s, the BER was determined as a function
of OSNR, and the results are shown in fig .(28). The required
OSNR for the 100 Gb/s is 15.83 dB at BER=10-12, which is 2.4
dB higher than that for 40 Gb/s.
4.3. 8-WDM Channels PDM CO-OFDM system
with QPSK modulation format
The single-channel systems described in section (4.1) were
used to establish the transmission performance of an upper-
bound for all practical optical fiber transport systems based on
WDM systems. WDM allows the optical infrastructure to be
shared amongst many channels, thus decreasing the cost of
transmitted data information in a fully loaded system. In these
operating systems, nonlinear effects become important sources
of weaknesses. Because of these additional weaknesses, it is
clear that single-channel transmission alone can underestimate
the performance of WDM systems with several tens of
wavelength channels [3]. The aim of this section is to
investigate the performance of PDM CO-OFDM QPSK and
16-QAM signals in the presence of adjacent WDM channels.
Similar to the single channel system carried out in section 4.1,
the main results measured in the 8-WDM channels PDM CO-
OFDM QPSK are:
4.3.1 Spectrum Result
Fig.(29) shows the RF spectrum analyzer for central channel
(channel 4) PDM CO-OFDM QPSK signal before and after
1200 km transmission distance at 100 Gb/s.
Fig.(30) shows the optical spectrum of 8-WDM channels
PDM CO-OFDM QPSK signal before and after 1200 km
transmission distance at 100 Gb/s.
4.3.2 Received Electrical Constellation Diagrams 4.3.3
Fig. (31) shows the received constellation diagrams for central
WDM channel after 1200km at different input power. The
constellation is worse with WDM system, which shows the
increasing of the nonlinear effects. Fig. (32) shows the
received constellation diagrams with -4 dBm input power after
different transmission distances.
Fig.(28) Measured OSNR for 40 Gbit/s and 100 Gbit/s single
channel PDM CO-OFDM 16-QAM
Fig.(29) RF Spectrum of PDM CO-OFDM QPSK signal for
the 4th channel (a) before (b) after 1200 km transmission
distance.
Fig.(30) Optical Spectrum of PDM CO-OFDM QPSK signal for
the 4th channel (a) before (b) after transmission.

International Journal of Engineering and Technology (IJET) – Volume 5 No. 3, March, 2015
ISSN: 2049-3444 © 2015– IJET Publications UK. All rights reserved. 154
4.3.4 Maximum reach measurements
To characterize the performance of transmission 8-WDM
PDM CO-OFDM QPSK signals at 40 Gb/s and 100Gbit/s, the
maximum transmission distance was measured (at BER = 10-
12) as a function of the input power per channel (Fig.(33)). The
transmission measurements were performed for a central
WDM channel (channel 4), because of the central channel
experiences the maximum amount of nonlinearity. This causes
the worst-case scenario and, hence, the lower bound in the
transmission performance. The optimal input power and
maximum reach is decreased in 8-WDM system compared
with the single channel system. The results are summarized in
table (11).
(C)
Fig.(31) Received constellation diagram after 1200 km with
different input power. a) -4 dBm, b) -2 dBm, c) 0 dBm.
(C)
Fig(32) Received constellation single channel system with -4
dBm input power after different transmission distances (a)
1200 km, (b) 1360 km (c)1520 km.
Fig. (33) Measured maximum reach of 8-WDM channels
PDM CO-OFDM QPSK system, measured at 40 and 100
Gbit/s.

International Journal of Engineering and Technology (IJET) – Volume 5 No. 3, March, 2015
ISSN: 2049-3444 © 2015– IJET Publications UK. All rights reserved. 155
Table (11) Maximum reach and Optimum Input
Power of 8-WDM channels PDM CO-OFDM QPSK
system at 40 Gb/s and 100Gb/s.
Bit rate (Gb/s) Max. Reach (km) Optimum Input Power
(dBm)
8 WDM channels PDM CO-OFDM QPSK System
40 2320 -5
100 1440 -2
4.3.5 OSNR Measurement
Fig.(34) shows the OSNR measurements, measured for the
central WDM channel, for both 40 and 100 Gb/s.
The required OSNR for the 100 Gb/s is 10.06 dB at BER=10-
12, which is 2.8 dB higher than that for 40 Gb/s , this compares
to 2.19 dB in a single-channel PDM CO-OFDM QPSK
system.
4.4. 8-WDM Channels PDM CO-OFDM system
with 16-QAM modulation format
Similar to the single channel system carried out in section 4.1,
the main results measured in the 8-WDM channels PDM CO-
OFDM 16-QAM are:
4.4.1 Spectrum Result
Fig.(35) shows the RF spectrum analyzer for central channel
PDM CO-OFDM 16-QAM signal before and after 560 km
transmission distance at 100 Gb/s.
Fig.(36) shows the optical spectrum of 8- WDM channels
PDM CO-OFDM 16-QAM signal before and after 560 km
transmission distance at 100Gb/s.
4.4.2 Received Electrical Constellation Diagrams
Fig. (37) shows the received constellation diagrams for central
WDM channel after 560 km at different input power. Fig. (38)
shows the received constellation diagrams with -4dBm input
power after different transmission distances.
Fig.(34)Measured OSNR for 8-WDM PDM CO-OFDM
QPSK at 40 and 100 Gbit/s.
Fig.(35) RF Spectrum of PDM CO-OFDM 16-QAM signal
for 4th channel (a) before (b) after 560 km transmission
distance.
Fig.(36) Optical Spectrum of PDM CO-OFDM 16-QAM
signal for 4th channel (a) before (b) after 560 km
transmission distance.

International Journal of Engineering and Technology (IJET) – Volume 5 No. 3, March, 2015
ISSN: 2049-3444 © 2015– IJET Publications UK. All rights reserved. 156
4.4.3 Maximum reach measurements
To characterize the linear and nonlinear transmission
performance of 8- WDM channels PDM CO-OFDM 16-QAM
system, the maximum reach was measured as a function of the
input power per channel (Fig. (39)). The results are
summarized in table (12).
Table (12) Maximum reach and Optimum Input
Power of 8-WDM channels CO-OFDM PDM 16-
QAM system at 40 Gb/s and 100Gb/s.
Bit rate (Gb/s) Max. Reach (km) Optimum Input
Power (dBm)
8-WDM channels CO-OFDM PDM 16-QAM System
40 1040 -8
100 480 -4
4.4.4 OSNR Measurement
Fig.(40) shows the OSNR measurements, measured for the
central WDM channel, for both 40 and 100 Gb/s.
The required OSNR for the 100 Gb/s is 17.5 dB at BER=10-12,
which is 3.4 dB higher than that for 40 Gb/s, this compares to
2.4 dB in a single-channel PDM CO-OFDM 16-QAM system.
The results in this Section represent the first investigation to
the performance of single channel and 8-WDM channels PDM
CO-OFDM QPSK and 16-QAM. Overall, it was clear that
maximum transmission distance in the case of WDM system
was lower than in single-channel system because of nonlinear
effects from the neighboring channels. The results for single-
channel and 8-WDM channels PDM CO-OFDM QPSK
system at 40 and 100Gbit/s are summarized in Table (13).
(C)
Fig.(37) Received constellation diagram after 480 km with
different input power. a) -4 dBm, b) -2 dBm, c) 0 dBm.
(C)
Fig(38) Received constellation single channel system
with -4 dBm input power after different transmission
distances (a) 560 km, (b) 640 km(c) 720 km.
Fig. (39) Maximum reach of 8-WDM channels PDM CO-
OFDM 16-QAM systems at 40 Gb/s and 100Gb/s.
Fig. (40) Measured OSNR for 40 Gbit/s and 100 Gbit/s 8-
WDM channels PDM CO-OFDM 16-QAM.

International Journal of Engineering and Technology (IJET) – Volume 5 No. 3, March, 2015
ISSN: 2049-3444 © 2015– IJET Publications UK. All rights reserved. 157
Table (13) Comparison of maximum reach and
optimum input power between single-channel and 8-
WDM channels PDM CO-OFDM QPSK system at 40
and 100Gbit/s.
Bit rate (Gb/s) Max. Reach (km) Optimum Input
Power (dBm)
Single channel CO-OFDM PDM QPSK System
40 4080 -2
100 2480 1
8-WDM channels PDM CO-OFDM QPSK System
40 2320 -5
100 1440 -2
At 111Gbit/s the existence of the additional 7-WDM channels
in the case of QPSK reduced the maximum achievable reach
from 1440 km to 2480 km, compared to the single-channel
experiment. Nevertheless, the maximum achievable
transmission distance of 1440 km in the case of WDM means
that 100Gbit/s QPSK solution can be potentially used for long-
haul transmission. Finally, the 8-WDM channel PDM CO-
OFDM 16-QAM transmission at 100Gbit/s was studied. The
presence of additional channels reduced the maximum reach
from 061km to 480 km compared to the single-channel
experiment. Still, 480km is long transmission distance for
100Gbit/s WDM PDM CO-OFDM 16-QAM. The results for
single-channel and 8-WDM channels PDM CO-OFDM 16-
QAM system at 40 and 100Gbit/s are summarized in Table
(14).
Table (14) Comparison of maximum reach and
Optimum input power between single-channel and 8-
WDM channels PDM CO-OFDM 16-QAM system at
40 and 100Gbit/s.
Bit rate (Gb/s) Max. Reach (km) Optimum Input
Power (dBm)
Single channel CO-OFDM PDM 16-QAM System
40 1760 -4
100 061 -1
8-WDM channels PDM CO-OFDM 16-QAM System
40 1040 -8
100 480 -4
5. Conclusions
The design of PDM CO-OFDM system operating with QPSK
and 16-QAM modulation formats has been investigated for
high speed optical transmission system. From the simulation
results, the following points can be concluded. For the PDM
CO-OFDM system operating with QPSK at 100 Gb/s, the
bandwidth of the optical signal is 25GHz. Whereas in the
system operating with 16-QAM the bandwidth is 12.5 GHz for
the same bit rate. This means that the optical signal of the
QPSK system occupies double the bandwidth of the 16-QAM
system for the same bit rate. The PDM CO-OFDM QPSK
signal also has a higher tolerance to nonlinearity compared to
CO-OFDM PDM 16-QAM. The advantages of 16-QAM
modulation (increased spectral efficiency, lower electrical
bandwidth) come at the expense of reduced maximum reach
and optimum input power. For example, in the case of
100Gbit/s PDM CO-OFDM 16-QAM the optimum input
power was found to be -1dBm, corresponding to the maximum
reach of 960km while for PDM CO-OFDM QPSK
transmission the optimum input power was found to be 1dBm,
corresponding to a maximum reach of 2480km. Increasing
system bit rate from 40 Gb/s to 100 Gb/s leads to increase
OSNR penalty. For example, the required OSNR for the 100
Gb/s PDM CO-OFDM QPSK is 8.32 dB at BER=10-12, which
is 2.19 dB higher than that for 40 Gb/s. Also, the required
OSNR for the 100 Gb/s PDM CO-OFDM 16-QAM is 15.83
dB at BER=10-12, which is 2.4 dB higher than that for 40 Gb/s.
This can be attributed to increase in symbol rate by a factor of
more than two resulted in an additional OSNR penalty due to
the doubling of the bandwidth. The PDM CO-OFDM QPSK
signal has a lower required OSNR than 16-QAM for the
equivalent bit rates. For example, the required OSNR for the
100 Gb/s PDM CO-OFDM QPSK is 8.32 dB at BER=10-12,
while for PDM CO-OFDM 16-QAM the required OSNR is
15.83 dB. Increasing the number of channels (increasing the
system capacity) leads to worsen the system performance due
to additional nonlinear effects from the neighboring channels.
For example, at 100Gbit/s the presence of the additional 7-
WDM channels in the case of PDM CO-OFDM QPSK
decreased the maximum achievable reach from 2480 km to
1440 km, compared to the single-channel experiment. Also,
the 8-WDM channel PDM CO-OFDM 16-QAM transmission
at 100Gbit/s was studied. The presence of additional channels
decreased the maximum reach from 960km to 480 km
compared to the single-channel experiment.
REFERENCES
[1] Y. Tang, “High-speed Optical Transmission System
Using Coherent Optical Orthogonal Frequency-
Division Multiplexing”, PhD. thesis, Department of
Electrical and Electronic Engineering, University of
Melbourne, Australia, June, 2010.
[2] W. Shieh and I. Djordjevic, “OFDM for optical
communications,” Elsevier, Amsterdam, 2010.
[3] A. Raheem, “Spectral Efficiency Improvement of the
Optical Communication Systems”, MSC. Thesis,
University of Technology, May, 2012.
[4] Z. Xiang and Y. Jianjun “Recent Progress in High-
speed and High Spectral Efficiency Optical
Transmission Technology” Optical Fiber
Communications, July, 2010.
[5] S. Jansen, D. van den Borne, M. Kuschnerov,
“Advances in Modulation Formats for Fiber-Optic
Transmission Systems”, CLEO, Laser Science to
Photonic Applications, 2011.
[6] A. Lowery, L. Du and J. Armstrong, "Performance of
optical OFDM in ultralong-haul WDM lightwave
systems ", Journal of Lightwave Technology Vol. 25,
No. 1, January, 2007.
[7] W. Shieh, X. Yi, Y. Ma, and Q. Yang, “Coherent
optical OFDM: has its time come [Invited],” Journal
of Optical Networking, Vol. 7, No. 3, March, 2008.

International Journal of Engineering and Technology (IJET) – Volume 5 No. 3, March, 2015
ISSN: 2049-3444 © 2015– IJET Publications UK. All rights reserved. 158
[8] M. Alaulddin, “Performance Simulation of Coherent
Optical OFDM Communication System”, MSC.
Thesis, Al-Nahrain University, 2011.
[9] A. Lowery, “Fiber nonlinearity pre- and post-
compensation for long-haul optical links using
OFDM,” Optics Express, Vol. 15, No. 20, October,
2007.
[10] H. Takahashi, A. Al Amin, S. Jansen, I. Morita and
H.Tanaka, “8x66.8-Gbit/s Coherent PDM-OFDM
Transmission over 640 km of SSMF at 5.6-bit/s/Hz
Spectral Efficiency,” ECOC 2008, Vol. 7, No.31,
September, 2008.
[11] Mamta and M. Bahrati, “Study of Nonlinearity in
CO-OFDM for Single Channel and WDM Channel”,
International Journal of Computational Engineering
& Management IJCEM, Vol. 15 No. 6, November,
2012.
[12] E. Silva, D. Pataca, S. Ranzini, L. Carvalho, AA.
Juriollo, M. Silva and J. Oliveira “450 Gb/s CO-
OFDM DP-QPSK Superchannels for Long-Haul
Transmission with High Spectral Efficiency”,
Microwave & Optoelectronics Conference, 2013.
[13] D. van den Borne, “Robust optical transmission
systems: modulation and equalization”, PhD. Thesis,
Technische Universiteit Eindhoven, 2008.
[14] R. Abbas, “Design and Performance Analysis of
Long-Haul, Ultra Wideband WDM System”, MSc.
Thesis, Electrical and Electronic Engineering,
University of Technology, Iraq, February, 2011.
[15] M. Jarajreh, “Coherent Optical OFDM Modem
Employing Artificial Neural Networks for Dispersion
and Nonlinearity Compensation in a Long-Haul
Transmission System”, PhD. thesis, University of
Northumbria at Newcastle, 2012.
[16] A. Souto, “Comparison of OFDM with Single Carrier
in high-data rate optical communication systems”,
Msc. Thesis, Universitat Politcnica de Catalunya
(UPC), Barcelona, December 2011.
[17] JDS Uniphase Corporation, “Testing Polarization
Mode Dispersion in the Field”, White Paper, January,
2006.
[18] M. Selmi, “Advanced Digital Signal Processing tools
for QAM-based optical fiber communications”, PhD.
thesis, Doctoral School of Computer Science,
Telecommunications and Electronics of Paris,
September, 2011.
[19] J. Senior, M. Jamro, “Optical Fiber Communications
Principles and Practice”, 3rd Edition, Prentice Hall,
2010.
[20] C. Browning, “Orthogonal Frequency Division
Multiplexing for Next Generation Optical Networks”,
PhD. Thesis, Dublin City University, Faculty of
Engineering and Computing, School of Electronic
Engineering, October, 2013.
[21] A. Stark, “16-QAM for next-generation transport
networks”, PhD. Thesis, Georgia Institute of
Technology, School of Electrical and Computer
Engineering, May, 2013.
[22] X. Zhang, “Digital Signal Processing for Optical
Coherent Communication Systems”, PhD. Thesis,
Department of Photonics Engineering Technical
University of Denmark, April, 2012.
[23] W. Shieh , “OFDM for Flexible High-Speed Optical
Networks”, Journal of Lightwave Technology, Vol.
29, No. 10, May, 2011.
[24] L. Abdul-Rahaim, “Design and Simulation of STBC-
(OFDM and CDMA) Transceivers based on Hybrid
Transforms”, PhD. thesis, Department of Electrical
and Electronic Engineering University of
Technology, October 2006.
[25] P. Benito,"Benito Transmission of OFDM-UWB
radio signals in FTTH networks using chirp-managed
lasers", M.S.C. Thesis, Electrical and Computer
Engineering, October, 2010.
[26] S. Jansen, I. Morita, T. Schenk, D. Borne and H.
Tanaka, "Optical OFDM - A Candidate for Future
Long-Haul Optical Transmission Systems," Optical
Fiber communication/National Fiber Optic Engineers
Conference, 2008.
[27] A. Li, “Investigation of Advanced Modulation and
Multiplexing Schemes for High-Capacity Optical
Transmission Systems”, PhD. thesis, University of
Melbourne, Department of Electrical and Electronic
Engineering, July, 2012.
[28] N. Antoniades, G. Ellinas, and I. Roudas, “WDM
Systems and Networks”, Springer, 2012.