Journal of Composite Materials - University at Buffalo of Composite Materials 2008; 42; 2003 Cemal...
24
http://jcm.sagepub.com Journal of Composite Materials DOI: 10.1177/0021998308094542 2008; 42; 2003 Journal of Composite Materials Cemal Basaran, Shihua Nie and Clyde S. Hutchins Temperatures Time Dependent Behavior of a Particle Filled Composite PMMA/ATH at Elevated http://jcm.sagepub.com/cgi/content/abstract/42/19/2003 The online version of this article can be found at: Published by: http://www.sagepublications.com On behalf of: American Society for Composites can be found at: Journal of Composite Materials Additional services and information for http://jcm.sagepub.com/cgi/alerts Email Alerts: http://jcm.sagepub.com/subscriptions Subscriptions: http://www.sagepub.com/journalsReprints.nav Reprints: http://www.sagepub.co.uk/journalsPermissions.nav Permissions: http://jcm.sagepub.com/cgi/content/refs/42/19/2003 Citations at SUNY AT BUFFALO on October 27, 2008 http://jcm.sagepub.com Downloaded from
-
Upload
truongcong -
Category
Documents
-
view
215 -
download
2
Transcript of Journal of Composite Materials - University at Buffalo of Composite Materials 2008; 42; 2003 Cemal...

http://jcm.sagepub.com
Journal of Composite Materials
DOI: 10.1177/0021998308094542 2008; 42; 2003 Journal of Composite Materials
Cemal Basaran, Shihua Nie and Clyde S. Hutchins Temperatures
Time Dependent Behavior of a Particle Filled Composite PMMA/ATH at Elevated
http://jcm.sagepub.com/cgi/content/abstract/42/19/2003 The online version of this article can be found at:
Published by:
http://www.sagepublications.com
On behalf of: American Society for Composites
can be found at:Journal of Composite Materials Additional services and information for
http://jcm.sagepub.com/cgi/alerts Email Alerts:
http://jcm.sagepub.com/subscriptions Subscriptions:
http://www.sagepub.com/journalsReprints.navReprints:
http://www.sagepub.co.uk/journalsPermissions.navPermissions:
http://jcm.sagepub.com/cgi/content/refs/42/19/2003 Citations
at SUNY AT BUFFALO on October 27, 2008 http://jcm.sagepub.comDownloaded from

Time Dependent Behavior of a ParticleFilled Composite PMMA/ATH
at Elevated Temperatures
CEMAL BASARAN* AND SHIHUA NIE
Department of Civil, Structural and Environmental Engineering
State University of New York at Buffalo, Buffalo, New York, USA
CLYDE S. HUTCHINS
DuPont Surfaces, Yerkes R&D Laboratory, Buffalo, New York, USA
ABSTRACT: Creep behavior of particle filled acrylic composite materials becomea major concern when they are used at elevated temperatures. Therefore, for elevatedtemperature finite element simulations any constitutive modeling requires time–temperature dependent material properties. Unfortunately, this type of data is verydifficult to come across in the literature, due to a very long time needed to conductcreep testing. In this study, the creep properties of acrylic casting dispersion PMMA/ATH were obtained experimentally and the observed characteristics of this materialare presented with the experimental data. The underlying deformation mechanismsand the steady-state creep response are also discussed.
KEY WORDS: particulate composite, acrylic, creep, PMMA, ATH, viscoplasticity.
INTRODUCTION
THE RAPID GROWTH of activities in the composites industry continues to create a needfor materials that meet the difficult demands for high performance at an economical
cost. When ductile matrix composite materials are reinforced by elastic inclusions ofvery high strength and very high modules, they lead to greater strength in shear andcompression. Although reinforcements could be continuous in the form of fibers ordiscontinuous in the form of particles or whiskers, the particle-reinforced ductile matrixcomposites are widely used as they exhibit nearly isotropic properties and are often easierto manufacture. Particulate composite consists of a physical mixture of particles anda matrix, and has various choices as its particles and matrix material. In general, theaddition of particles to polymer matrix can produce a number of desirable effects [1–8].Nielsen [9] summarized the practical reasons for the use of the fillers: (a) stiffen the matrix
*Author to whom correspondence should be addressed. E-mail: [email protected] 2, 5–18 and 21–24 appear in color online: http://jcm.sagepub.com
Journal of COMPOSITE MATERIALS, Vol. 42, No. 19/2008 2003
0021-9983/08/19 2003–23 $10.00/0 DOI: 10.1177/0021998308094542� SAGE Publications 2008
Los Angeles, London, New Delhi and Singapore
at SUNY AT BUFFALO on October 27, 2008 http://jcm.sagepub.comDownloaded from
and make it more rigid; (b) regulate the coefficient of thermal expansion and thermalshrinkage of the matrix material; (c) improve heat resistance; (d) reduce creep; (e) increasethe strength properties of the polymer matrix material; (f) modify the permeabilitybehavior to gases and liquids; (g) improve electrical properties; (h) modify rheologicalproperties; and (i) lower the cost of the material.
The acrylic casting dispersion PMMA/ATH stands for lightly cross-linked poly-methymethacrylate (PMMA) filled with about by a fine dispersion of alumina trihydrate(ATH). In this composite material the average size of ATH filler particles is 2–10 mm,which occur as agglomerates of 3 mm (average) and volume fraction of the ATH is 48%.The 7mm thick sheets are manufactured by continuous casting process with slow coolingto minimize warping and residual stresses [10].
PMMA/ATH is used as a substitute for many indoor ceramic applications. Because of itslower cost, the ease of molding, and wear resistance (largely due to reinforcement particlesof ATH), this composite material is preferred to natural marbles. Some examples arecounter-tops, kitchen sinks and bathroom vanities. PMMA is an amorphous glass below1108C and exhibits ductile fracture under normal conditions at room temperature. PMMA,because of its molecular chains viscoelastic/plastic properties, is very sensitive to strain rateand temperature. Creep phenomenon is particularly common in polymers. For polymers,the delayed response of polymer chains during deformations is the cause of creep behavior.Deformation stops when the initially folded chains reach a new equilibrium configuration.Part of this stretching of chains is recoverable after load is removed, but recovery takesplace slowly with the chains retracting by folding back to their initial state. It is a wellknown observation that as the temperature decreases, or loading rate increases, both yieldstress and Young’s modulus increase [11]. Since PMMA/ATH acrylic casting dispersion isbeing used increasingly for thermal load-bearing applications, understanding the creepprocess is essential if they are to be used in a safe and reliable fashion.
Presented in this study are the results of a series of experimental studies conducted atvarious temperatures and loading rates. This study was conducted because of a lack ofsuch published data in the literature which is needed for constitutive modeling [12].
EXPERIMENTAL PROCEDURE
Composite material properties are sensitive to the manufacturing process. Specimensmanufactured in the laboratory have different properties than industrial manufacturingline samples. Therefore, for this study specimens were cut from a sheet of 7mm thick platethat was manufactured on as industrial production line (shown in Figure 1). The uniaxialtension, uniaxial compression and creep tests were performed in a servo-hydraulic MTSmaterial characterization unit, type 858 Table Top System (10 kN capacity), controlled bya personal computer and fitted with an ATS 7510 thermal chamber for the control ofambient temperature. The test system has load, stroke, and strain control capacity. Theaccuracy of temperature control is about 18C and is monitored by using an ATS feedbackcontrol system and a thermocouple. Time-dependent testing requires hydraulic grips. Thetest system also includes an interchangeable 685.22 side-loading hydraulic wedge gripsystem with grip pressure up to 3000 psi. The hydraulically–actuated grip system isindependently activated and could maintain an adjustable grip force on the specimen gripface without a backlash. Grips are attached to the load frame via a fixed, but adjustable,alignment system. The MTS 634.25 axial extensometer (from þ50 to �10%), with a gauge
2004 C. BASARAN ET AL.
at SUNY AT BUFFALO on October 27, 2008 http://jcm.sagepub.comDownloaded from

length of 2 inches, is used to measure uniaxial strain in the testing. The experiments wereconducted as a function of strain rate and temperature for uniaxial tensile and compressivetests. The strain rate ranged over three decades from 1� 10�3 to 1� 10�7 s�1, and temp-eratures varied from room temperature to 908C. Because of space limitations not all dataobtained in this study is presented here, albeit a representative of the overall behavior.For complete data, readers are referred to Nie [13]. The details of the procedures used inthis work are described in ASTM D 638-98 [14].
The initial loading rate has an impact on the creep response observed. Thus it isnecessary to specify and control both the creep stress and initial loading rates in creepexperiments. In this work, the load rate of 0.5 kN/s is used for all experiments.At T¼ 228C, the ultimate tensile load for the test specimen is about 4.0 kN. Creep testswere performed under a constant force of 3.6 kN (90% of ultimate tensile load), 3.2 kN(80%), and 2.4 kN (60%) in tension. Creep tests were also performed under the force of3.2 kN (80% of ultimate tensile load) in compression. At T¼ 758C, the ultimate tensileload for the test specimen is 2.5 kN. Creep tests under 2.2 kN (88% of ultimate tensileload); 2.0 kN (80%), 1.5 kN (60%), 1.0 kN (40%), 0.5 kN (20%), and 0.25 kN (10%)were performed in tension. Creep tests under 2.2 kN (88% of ultimate tensile load) werealso performed in compression. (Ultimate compressive strength of this composite materialcould not be obtained because of testing system limitations, and unfortunately it is notavailable in the literature, to the best of our knowledge.)
RESULTS AND DISCUSSION
Uniaxial Tensile and Compressive Tests
The uniaxial extension experiment results for different temperatures is shown inFigure 2, indicating that, as expected, temperature has a significant influence on the
(b)
(a)
12.7
32 76
150
19
7
(c)
60mm 500X 20mm 1000X
Figure 1. (a) Specimen geometries (mm), (b) polished surface of Sample (gray regions are particles), (c) ATHFiller Particles Under SEM.
Time Dependent Behavior of a Particle Filled Composite PMMA/ATH 2005
at SUNY AT BUFFALO on October 27, 2008 http://jcm.sagepub.comDownloaded from

mechanical behavior of this composite material, in spite of the fact that the filler particles’melting temperature is about 35008C. At room temperature (228C) PMMA/ATH is brittleand fails under tension long before a major elongation or any plastic strain is achieved,(Figure 2). At temperatures over 758C, PMMA/ATH behaves like as a ductile material:first it reaches the peak load, and then the load capacity decreases with the increasingof strain until failure. This observed behavior indicates that viscoplasticity must beconsidered at high temperature finite element simulations.
Typical stress–strain curves obtained for different strain rates under uniaxial tensile testson PMMA/ATH at room temperature are shown in Figure 3. An important effect of thestrain rate on these stress–strain curves is observed. The material stiffness and ultimatestress increased as the strain rate increased. The stress–strain curve is initially linear elasticto a critical stress level (about 25MPa) then it starts to behave non-linearly. After the onsetof continuous non-linear behavior, the stress–strain curve reaches the peak point and thefailure of the specimen occurs suddenly before a significant plastic strain is achieved [13].The initial elastic region of the curve is controlled primarily by the inclusion concentration.
0
10
20
30
40
50
0.00 0.01 0.02 0.03 0.04 0.05
Strain
Str
ess
(MP
a)
T=22°C
T=50°C
T=75°C
T=90°C
Fails at strain 0.15
Figure 2. Uniaxial stress–strain curves of PMMA/ATH at different temperatures with strain rate of 1�10�4 s�1.
Strain
0.000 0.002 0.004 0.006 0.008
Str
ess
(MP
a)
0
10
20
30
40
50
Strain rate 1e-5
Strain rate 1e-4
Strain rate 1e-3
Figure 3. Uniaxial tension stress–strain behavior of at different strain rates and 228C.
2006 C. BASARAN ET AL.
at SUNY AT BUFFALO on October 27, 2008 http://jcm.sagepub.comDownloaded from

Elastic modulus of ATH is 70GPa compared to PMMAmatrix elastic modulus of 3.5GPa.Application of strain in the last region of the curve is only to stretch the binder and enlargeexisting cavities.
Monotonic stress–strain curves obtained from the compressive tests are shown inFigure 4 for several different strain rates. It is shown clearly that the composite materialexhibits markedly different behavior in compression than in tension. This is due to themicrostructure of particle-reinforced ductile matrix composites. In tension, the particlesact as stress concentrators, while in compression the particles serve to transmit stresses.The resulting material is brittle in tension, but in compression it is similar in behavior toductile matrix at room temperature. The compressive test was terminated at 0.008 straindue to maximum load carrying capacity of the load cell used in the system.
Creep Tests
Creep, time-dependent deformation, is generally viewed as a stress driven process that issignificantly influenced by temperature. In polymer matrix composites, creep is controlledby stretching of molecular chains rather than the diffusion process that dominates creep inpoly-crystalline materials. ATH is a poly-crystal structured material with a very highmelting temperature, about 35008C. Therefore time-dependent behavior is mainlycontrolled by PMMA, which has a very low glass transition temperature of about1108C. In standard uniaxial creep tests, the load is constant and the creep stress is definedas the applied load divided by the initial test specimen area. Mathematically andexperimentally, the creep strain is defined as the difference between the total measuredstrain and the calculated elastic strain. The most common representation of the creep datais a plot of creep strain as a function of time, where each curve represents the creep strainresponse for constant values of temperature and stress. The variation of creep strain as afunction of time for different stresses is given in Figures 5 and 6 at temperatures of 75and 228C, respectively. The variation of creep strain rate as a function of time withdifferent stresses is given in Figures 7 and 8 at temperatures of 75 and 228C, respectively.Here the creep strain and creep strain rate are measured in terms of micro strain and microstrain per second, respectively.
Strain
−0.010 −0.008 −0.006 −0.004 −0.002 0.000
Str
ess
(MP
a)
−80
−60
−40
−20
0
Strain rate 1e-5
Strain rate 1e-4
Strain rate 1e-3
Figure 4. Uniaxial compressive stress–strain behavior at different strain rates at 248C.
Time Dependent Behavior of a Particle Filled Composite PMMA/ATH 2007
at SUNY AT BUFFALO on October 27, 2008 http://jcm.sagepub.comDownloaded from

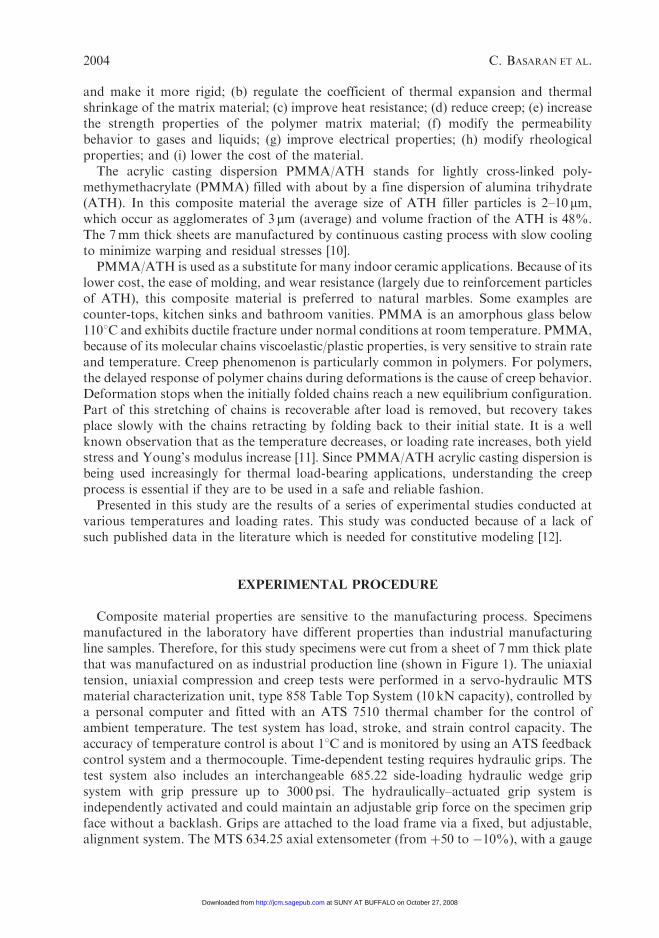
As shown in Figures 5–8, the initial creep strain rate (primary creep) can be relativelyhigh. Then the primary creep strain rate decreases to a steady-state rate. Eventually, thecreep rate increases from the steady-state value and unrestrained flow occurs (tertiarycreep) leading to rupture. As expected, the primary, secondary, and tertiary creep rates andthe time to rupture were strong functions of the creep stress and temperature. Increasingthe stress and temperature increased the creep rate and reduced the time to rupture.In Figure 7, we observe that at 758C for load 2 kN and higher tertiary creep is reached veryquickly.
The creep strength and rupture strength are frequently reported material properties.Creep strength is defined as the stress that produces the steady-state creep rate at aspecified temperature. For example for the creep rate of 1� 10�6 s�1, the creep strength
0
0.01
0.02
0.03
0.04(a)
(b)
1.E+00 1.E+01 1.E+02 1.E+03 1.E+04 1.E+05
Time (s)
Cre
ep s
trai
n
0
0.01
0.02
0.03
0.04
Cre
ep s
trai
n
0.25kN
0.50kN
1.0kN
1.5kN
2.0kN
2.2kN
0 10,000 20,000 30,000 40,000
Time (s)
0.25kN
0.50kN
1.0kN
1.5kN
2.0kN
2.2kN
Figure 5. Time dependent strain response at 758C for different values of load as plotted on (a) logarithmicscale, (b) linear scale.
2008 C. BASARAN ET AL.
at SUNY AT BUFFALO on October 27, 2008 http://jcm.sagepub.comDownloaded from
of PMMA/ATH at 758C is about 19MPa as shown in Figure 9. The creep strength canalso be defined as the stress to produce a specified creep strain for a specified time andtemperature.
The increase in primary creep strain as a function of temperature at the stress level of25MPa is shown in Figure 10.
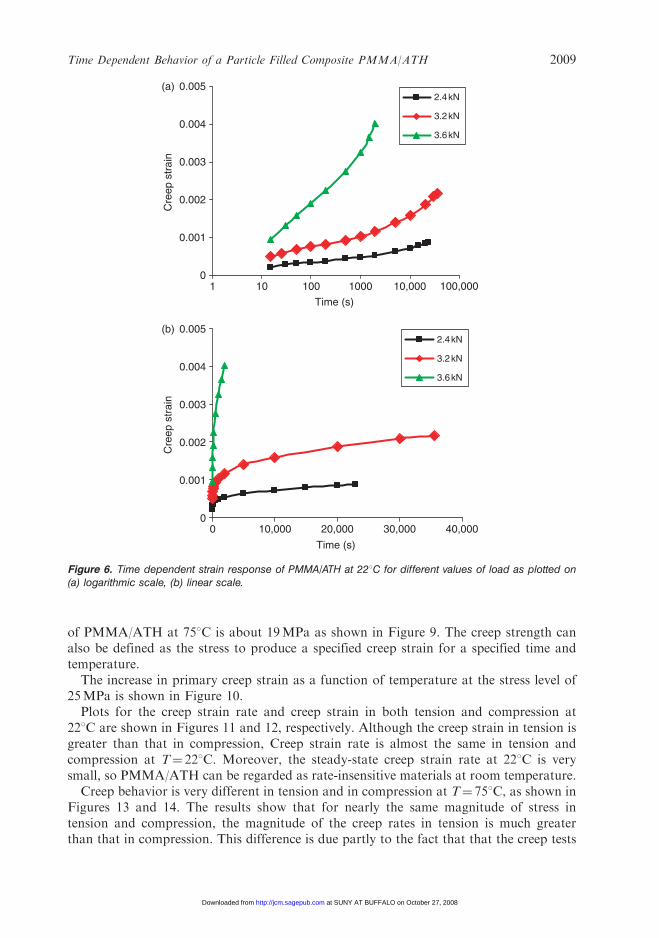
Plots for the creep strain rate and creep strain in both tension and compression at228C are shown in Figures 11 and 12, respectively. Although the creep strain in tension isgreater than that in compression, Creep strain rate is almost the same in tension andcompression at T¼ 228C. Moreover, the steady-state creep strain rate at 228C is verysmall, so PMMA/ATH can be regarded as rate-insensitive materials at room temperature.
Creep behavior is very different in tension and in compression at T¼ 758C, as shown inFigures 13 and 14. The results show that for nearly the same magnitude of stress intension and compression, the magnitude of the creep rates in tension is much greaterthan that in compression. This difference is due partly to the fact that that the creep tests
0
0.001
0.002
0.003
0.004
0.005(a)
(b)
1 10 100 1000 10,000 100,000
Time (s)
Cre
ep s
trai
n
0
0.001
0.002
0.003
0.004
0.005
Cre
ep s
trai
n
2.4kN
3.2kN
3.6kN
0 10,000 20,000 30,000 40,000
Time (s)
2.4kN
3.2kN
3.6kN
Figure 6. Time dependent strain response of PMMA/ATH at 228C for different values of load as plotted on(a) logarithmic scale, (b) linear scale.
Time Dependent Behavior of a Particle Filled Composite PMMA/ATH 2009
at SUNY AT BUFFALO on October 27, 2008 http://jcm.sagepub.comDownloaded from

are constant-load, not constant-stress tests. The creep stress is defined as the constantload divided by the initial specimen area. Therefore, in a tensile test the true stressincreases as the specimen area decreases, and in compression the true stress decreases asthe specimen area increases as a result of Poison ratio effects. We believe the mostimportant reason for different response in tension and compression is the de-tanglement ofmolecule chains, which is the dominant time-dependent deformation mechanism inPMMA matrix. Tensile stresses expand the chains and reduce the resistance tode-tanglement, whereas compressive stresses reduce the chain dimensions and increasethe resistance for de-tanglement.
0.001
0.01
0.1
1
10
100
1000(a)
(b)
1.E+00 1.E+01 1.E+02 1.E+03 1.E+04 1.E+05
Time (s)
Cre
ep s
trai
n ra
teC
reep
str
ain
rate
0.25kN
0.50kN
1.0kN
1.5kN
2.0kN
2.2kN
0
30
60
90
120
1.E+00 1.E+01 1.E+02 1.E+03 1.E+04 1.E+05
Time (s)
0.25kN
0.50kN
1.0kN
1.5kN
2.0kN
2.2kN
Figure 7. Time dependent strain rate response at 758C for different values of load (a) logarithmic scale,(b) linear scale.
2010 C. BASARAN ET AL.
at SUNY AT BUFFALO on October 27, 2008 http://jcm.sagepub.comDownloaded from

Constitutive Modeling
A micro-mechanics based constitutive model for particle filled composites has beendeveloped and published by Nie and Basaran [14] and Basaran and Nie [12]. In here wesummarize the main points of the model. The model characterizes the composite as a threedifferent constituents, matrix, filler particle and inter-phase (bonding agent between fillerand particle) (Figure 15). However, in the formulation filler particle and inter-phase arehomogenized to a single phase.
Viscoplastic Behavior of Two-phase Composites
Assuming a perfectly bonded two-phase composite consisting of a viscoplastic matrix(phase 0) with an elastic bulk modulus k0 and elastic shear modulus �0, and randomly
0.001
0.01
0.1
1
10
100(a)
(b)
1 10 100 1000 10,000 100,000
Time (s)
Cre
ep s
trai
n ra
teC
reep
str
ain
rate
2.4kN
3.2kN
3.6kN
0
10
20
30
40
50
1 10 100 1000 10,000 100,000
Time (s)
2.4kN
3.2kN
3.6kN
Figure 8. Steady-state creep strain rate as a function of time at 228C for different values of load (a) logarithmicscale, (b) linear scale.
Time Dependent Behavior of a Particle Filled Composite PMMA/ATH 2011
at SUNY AT BUFFALO on October 27, 2008 http://jcm.sagepub.comDownloaded from

dispersed elastic spherical particle–interphase assembly (Phase 1) with effective bulkmodulus k1 and effective shear modulus �1. The effective elastic moduli of the two-phasecomposite by neglecting the inter-particle interaction effects can be given as Ju andChen (1994a):
k ¼ k0 1þ3 1� v0ð Þ k1 � k0ð Þ�
3 1� v0ð Þk0 þ 1� �ð Þ 1þ v0ð Þ k1 � k0ð Þ
� �ð1Þ
� ¼ �0 1þ15 1� v0ð Þ �1 � �0ð Þ�
15 1� v0ð Þ�0 þ 1� �ð Þ 8� 10v0ð Þ �1 � �0ð Þ
� �ð2Þ
where � is the particle volume fraction and, �0 is Poisson’s ratio of the matrix.In the model it is assumed that viscoplastic yielding and flow occur only in the matrix,
and the matrix solely determines the viscoplastic behavior of the composite. The latterassumption is based on the fact that glass transition temperature for PMMA is
0.001
0.01
0.1
1
10
100(a)
(b)
0 5 10 15 20 25 30
Stress (MPa)
Ste
ady-
stat
e cr
eep
stra
in r
ate
10−6
S
tead
y-st
ate
cree
p st
rain
rat
e 10
−6
0
5
10
15
20
25
0 5 10 15 20 25 30
Stress (MPa)
Figure 9. Effects of stress on the nominal stationary creep strain rate of PMMA/ATH at 758C as plotted on(a) logarithmic scale, (b) linear scale.
2012 C. BASARAN ET AL.
at SUNY AT BUFFALO on October 27, 2008 http://jcm.sagepub.comDownloaded from

around 1108C, however, for ATH the melting temperature is around 35008C. Based onthese temperatures, the latter assumption is, we believe, valid. The magnitude of thecurrent equivalent stress norm of the matrix can be utilized to determine the possibleviscoplastic behavior in the composite. When the ensemble-volume averaged current stressnorm in the matrix reaches a certain level, the composite undergoes viscoplastic flow.The effective yield function for the composite in the presence of CTE mismatch inducedstresses can be written as:
f �p, ��ð Þ ¼
ffiffiffiffiffiffiffiffiffiffiffiffiffiffiffiffiffiffiffiffiffiffiffiffiffiffiffiffiffiffiffiffiffiffiffiffiffiffiffiffiffiffiffiffi�p� �pT
� �: �T : �p� �pT
� �q�
ffiffiffiffiffiffiffiffiffiffiffiffiffiffiffiffiffiffiffi�T1 þ 2 �T2
q��y ��ð Þ ð3Þ
where �� is the average stress in the composite, ��T is the stress caused by CTE mismatchbetween the ATH filler and the PMMA matrix. �T is a fourth order tensor, T1 and T2 arefactors given in Basaran and Nie [12], that account for influence of particles on the matrix
0
0.005
0.01
0.015
0.02
0.025(a)
(b)
1 10 100 1000 10,000 100,000
Time (s)
Cre
ep s
trai
n
0
0.005
0.01
0.015
0.02
0.025
Cre
ep s
trai
n
T=22°C
T=75°C
0 5000 10,000 15,000 20,000 25,000
Time (s)
T=22°C
T=75°C
Figure 10. Creep strain as a function of time at 25MPa for different temperatures (a) logarithmic scale,(b) linear scale.
Time Dependent Behavior of a Particle Filled Composite PMMA/ATH 2013
at SUNY AT BUFFALO on October 27, 2008 http://jcm.sagepub.comDownloaded from

yield stress, ��y ��ð Þ is the isotropic hardening function of the composite materials, �� is theequivalent viscoplastic strain that defines isotropic hardening of the yield surface of thecomposites, and:
_�� ¼
ffiffiffiffiffiffiffiffiffiffiffiffiffiffiffiffiffiffiffi�T1 þ 2 �T2
q ffiffiffiffiffiffiffiffiffiffiffiffiffiffiffiffiffiffiffiffiffiffiffiffiffiffiffi_�"vp: �T
�1: _�"
vpq
: ð4Þ
The factors in the effective yield and effective plastic strain increment equations are chosenso that the effective stress and effective plastic strain increments are equal to the uniaxialstress and uniaxial plastic strain increment in a tensile test. It should be noted that theeffective yield function is pressure dependent now (as a result of accounting for CTEmismatch) and no longer of the Von-Mises type. Therefore, the particles have significanteffect on the viscoplastic behavior of the matrix.
0.001
0.01
0.1
1
10
100(a)
(b)
1.E+00 1.E+01 1.E+02 1.E+03 1.E+04 1.E+05
Time (s)
Cre
ep s
trai
n ra
te 1
0−7C
reep
str
ain
rate
10−7
Compression (3.2kN)
Tension (3.2kN)
0
5
10
15
20
1.E+00 1.E+01 1.E+02 1.E+03 1.E+04 1.E+05
Time (s)
Compression (3.2kN)
Tension (3.2kN)
Figure 11. Creep strain rate in tension and compression at 228C as a function of time (a) logarithmic scale,(b) linear scale.
2014 C. BASARAN ET AL.
at SUNY AT BUFFALO on October 27, 2008 http://jcm.sagepub.comDownloaded from
In order to simulate damage evolution behavior of composite materials, there is a needfor introduction of a damage parameter in the above proposed constitutive model.Damage mechanics provide us with basic framework to develop damage evolution models.According to the strain equivalence principle, the effective damage coupled yield functionfor an isotropic damage parameter D can be written as:
f �p, ��ð Þ ¼
ffiffiffiffiffiffiffiffiffiffiffiffiffiffiffiffiffiffiffiffiffiffiffiffiffiffiffiffiffiffiffiffiffiffiffiffiffiffiffiffiffiffiffiffiffiffiffiffiffiffiffiffiffiffiffiffiffiffiffiffiffiffiffiffiffiffiffiffi�p
1�D� �pT
� �: �T :
�p
1�D� �pT
� �s�
ffiffiffiffiffiffiffiffiffiffiffiffiffiffiffiffiffiffiffi�T1 þ 2 �T2
q��y ��ð Þ ð5Þ
where D is the damage parameter. It is obvious that the damage increases the equivalentstress norm of the composite, which tends to amplify the viscoplastic flow of thecomposite.
0
0.0005
0.001
0.0015
0.002
0.0025(a)
(b)
1.E+00 1.E+01 1.E+02 1.E+03 1.E+04 1.E+05
Time (s)
Cre
ep s
trai
n
0
0.0005
0.001
0.0015
0.002
0.0025
Cre
ep s
trai
n
Compression (3.2kN)
Tension (3.2kN)
0 10,000 20,000 30,000 40,000
Time (s)
Compression (3.2kN)
Tension (3.2kN)
Figure 12. Creep strain in tension and compression for PMMA/ATH at 228C as plotted on (a) logarithmicscale, (b) linear scale.
Time Dependent Behavior of a Particle Filled Composite PMMA/ATH 2015
at SUNY AT BUFFALO on October 27, 2008 http://jcm.sagepub.comDownloaded from

A perzyna-type viscoplasticity flow model is employed to characterize the ratedependency (viscosity) behavior of the matrix. It is assumed that viscoplastic flow thattakes place in the matrix follows the Perzyna model, where creep strain rate is proportionalto over-stress and viscosity coefficient of the material. Therefore, the effective ensemble-volume averaged plastic strain rate for the composite can be expressed as:
_"vp ¼ �@f
@p¼
1
1�D�n ð6Þ
where _"vpis the creep strain rate:
n ¼�T ð �p=1�DÞ � �pT� �
ffiffiffiffiffiffiffiffiffiffiffiffiffiffiffiffiffiffiffiffiffiffiffiffiffiffiffiffiffiffiffiffiffiffiffiffiffiffiffiffiffiffiffiffiffiffiffiffiffiffiffiffiffiffiffiffiffiffiffiffiffiffiffiffiffiffiffiffiffiffiffiffiffiffiffiffiffiffiffið �p=1�DÞ � �pT� �
: �T : ð �p=1�DÞ � �pT� �q ð7Þ
1.E−02
1.E−01
1.E+00
1.E+01
1.E+02(a)
(b)
1.E+00 1.E+01 1.E+02 1.E+03 1.E+04 1.E+05
1.E+00 1.E+01 1.E+02 1.E+03 1.E+04 1.E+05
Time (s)
Cre
ep s
trai
n ra
teC
reep
str
ain
rate
Compression (2.0kN)
Tension (2.0kN)
Tension (1.5kN)
Tension (1.0kN)
0
20
40
60
80
100
Time (s)
Compression (2.0kN)
Tension (2.0kN)
Tension (1.5kN)
Tension (1.0kN)
Figure 13. Creep strain rate in tension and compression at 758C (a) logarithmic scale, (b) linear scale.
2016 C. BASARAN ET AL.
at SUNY AT BUFFALO on October 27, 2008 http://jcm.sagepub.comDownloaded from

and � denotes the plastic consistency parameter given by
� ¼f� �
¼f� 2��
: ð8Þ
� is viscosity coefficient, � is relaxation time, and the equivalent plastic strain is defined as:
_� ¼
ffiffiffiffiffiffiffiffiffiffiffiffiffiffiffiffiffiffiffi�T1 þ 2 �T2
q�
1�D: ð9Þ
Determination of Material Parameters from Test Data
In order to successfully simulate the damage coupled viscoplasticity of particulatecomposites, it is important to determine the appropriate material parameters for themodel. Experimental tests that simulate in-service loading conditions are required to
0
0.005
0.01
0.015
0.02
0.025
0.03
0.035(a)
(b)
1.E+00 1.E+01 1.E+02 1.E+03 1.E+04 1.E+05
Time (s)
Cre
ep s
trai
n
0
0.005
0.01
0.015
0.02
0.025
0.03
0.035
Cre
ep s
trai
n
Compression (2.0kN)
Tension (2.0kN)
Tension (1.5kN)
Tension (1.0kN)
0 10,000 20,000 30,000 40,000
Time (s)
Compression (2.0kN)
Tension (2.0kN)
Tension (1.5kN)
Tension (1.0kN)
Figure 14. Creep strain in tension and compression at 758C (a) logarithmic scale, (b) linear scale.
Time Dependent Behavior of a Particle Filled Composite PMMA/ATH 2017
at SUNY AT BUFFALO on October 27, 2008 http://jcm.sagepub.comDownloaded from

obtain reliable material parameters needed by the constitutive model. Due to the time andtemperature dependent mechanical properties of acrylic particulate composites, it isdesirable that tests are conducted under different loading rates and different temperatures.
The material parameters needed for the constitutive model can be obtained from the testdata presented in the previous section.
Viscosity Coefficient
Material properties for viscoplastic flow function can be obtained from strain rate vs.stress plots. In Equation (6) there are four terms: viscoplastic strain rate, yield function,stress, and plastic strain consistency parameter �. The strain rate, yield function, and stressvalue are known (see Figure 9(a)). We can calculate the � value for each point in the strainrate vs. stress curve, and fit an empirical curve to experimental data to obtain �.
Properties of ATH
In the model, ATH is regarded as an isotropic elastic material. The thermomechanicalproperties of ATH as provided by the manufacturer are as follows:
Poisson ratio of ATH : �f ¼ 0:24
Elastic modulus of ATH : Ef ¼ 70000 MPa
Coefficient of thermal expansion of ATH : �f ¼ 1:47� 10�6=�C
The average diameter of ATH is 35 �m:
Matrix
Interphase
δ
r
100mm 250X
Particle
Figure 15. Three-phase composite system.
2018 C. BASARAN ET AL.
at SUNY AT BUFFALO on October 27, 2008 http://jcm.sagepub.comDownloaded from
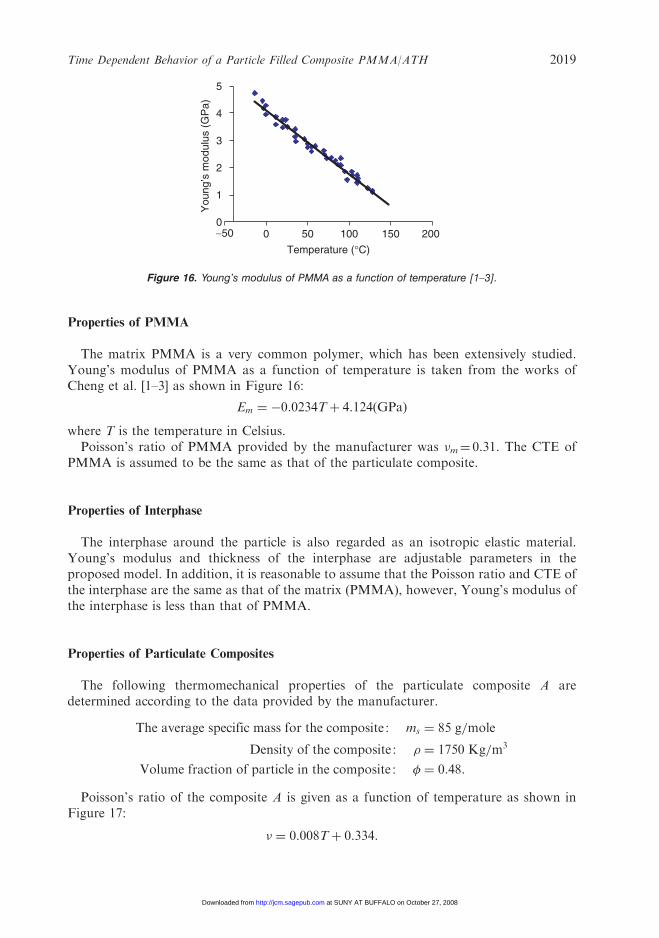
Properties of PMMA
The matrix PMMA is a very common polymer, which has been extensively studied.Young’s modulus of PMMA as a function of temperature is taken from the works ofCheng et al. [1–3] as shown in Figure 16:
Em ¼ �0:0234Tþ 4:124ðGPaÞ
where T is the temperature in Celsius.Poisson’s ratio of PMMA provided by the manufacturer was �m¼ 0.31. The CTE of
PMMA is assumed to be the same as that of the particulate composite.
Properties of Interphase
The interphase around the particle is also regarded as an isotropic elastic material.Young’s modulus and thickness of the interphase are adjustable parameters in theproposed model. In addition, it is reasonable to assume that the Poisson ratio and CTE ofthe interphase are the same as that of the matrix (PMMA), however, Young’s modulus ofthe interphase is less than that of PMMA.
Properties of Particulate Composites
The following thermomechanical properties of the particulate composite A aredetermined according to the data provided by the manufacturer.
The average specific mass for the composite : ms ¼ 85 g=mole
Density of the composite : ¼ 1750 Kg=m3
Volume fraction of particle in the composite : � ¼ 0:48:
Poisson’s ratio of the composite A is given as a function of temperature as shown inFigure 17:
� ¼ 0:008Tþ 0:334:
0
1
2
3
4
5
−50 500 100 150 200
Temperature (°C)
You
ng’s
mod
ulus
(G
Pa)
Figure 16. Young’s modulus of PMMA as a function of temperature [1–3].
Time Dependent Behavior of a Particle Filled Composite PMMA/ATH 2019
at SUNY AT BUFFALO on October 27, 2008 http://jcm.sagepub.comDownloaded from

The coefficient of thermal expansion of the composite A is given as function oftemperature as shown in Figure 18. When T� 908C:
� ¼ 3:035� 10�7Tþ 2:347� 10�5: ð10Þ
When T� 908C
� ¼ 1:0992� 10�6T� 5:012� 10�5: ð11Þ
The viscosity relaxation time � is defined as (Simo and Hughes, 1998)
� ¼�
2�
where � is the shear modulus and � is the viscosity. The viscosity relaxation time � isdetermined as shown in Figure 19. When T� 908C
� ¼ 1:12406� 10�6T 3 � 1:67823� 10�4T 2 þ 7:91134� 10�3Tþ 7:35� 10�3: ð12Þ
0.2
0.25
0.3
0.35
0.4
0 20 40 60 80 100
Temperature (°C)P
oiss
on r
atio
Figure 17. Poisson’s ratio of composite A as a function of temperature.
0.E+00
2.E−05
4.E−05
6.E−05
8.E−05
1.E−04
0 20 40 60 80 100 120 140
Temperature (°C)
CT
E
Figure 18. Coefficient of thermal expansion (CTE) of composite A as a function of temperature.
2020 C. BASARAN ET AL.
at SUNY AT BUFFALO on October 27, 2008 http://jcm.sagepub.comDownloaded from

When T� 908C:
� ¼ �2:6348� 10�6T 41:08452� 10�3T 3 � 1:64629� 10�1T 2 þ 10:9673T� 271:11: ð13Þ
The elastic modulus of composite A can be determined from the properties of the particle,the matrix and the interphase according to the proposed micromechanical model forparticulate composites. The elastic modulus of composite is also determined from ouruniaxial tensile tests with a different strain rate and temperature as shown in Figure 20:
Em ¼ �0:0005T 2 � 0:021Tþ 13:33þ 0:6 log _"ð Þ ðGPaÞ: ð14Þ
The gas constant is also needed for the damage evolution function, where its value is givenas follows: R ¼ 8:3145 J=mole=K.
Isotropic Hardening Parameters
The Ramberg–Osgood isotropic hardening model is used to model the monotonictensile yield stress, which is reasonably accurate for the uniaxial tensile behavior.
��y ¼ ��0 þ K ��n
0
0.4
0.8
1.2
1.6
0 20 40 60 80 100 120
Temperature (°C)
Rel
axat
ion
time
(s)
Figure 19. Relaxation time of composite A as a function of temperature.
0
2
4
6
8
10
12
0 50 100 150
Temperature (°C)
Ela
stic
mod
ulus
(G
Pa)
Strain rate=1E-3
Strain rate=1E-4
Strain rate=1E-5
Figure 20. Elastic modulus of composite A as a function of temperature.
Time Dependent Behavior of a Particle Filled Composite PMMA/ATH 2021
at SUNY AT BUFFALO on October 27, 2008 http://jcm.sagepub.comDownloaded from

where ��0 is the initial yield of stress for composite A and �� is the equivalent viscoplasticity,
_�� ¼
ffiffiffiffiffiffiffiffiffiffiffiffiffiffiffiffiffiffiffi�T1 þ 2 �T2
q ffiffiffiffiffiffiffiffiffiffiffiffiffiffiffiffiffiffiffiffiffiffiffiffiffiffiffi_�"vp: �T
�1: _�"
vpq
:
The temperature dependent constants K and n for the Ramberg–Osgood isotropichardening model can be easily determined from experimental data near the yield point,where the damage is believed to be negligible. Experimental data for the stress as afunction of the viscoplastic strain for the composite at various temperatures is shown inFigure 21.
The parameters for the Ramberg–Osgood isotropic hardening model are determinedfrom the monotonic uniaxial tensile tests at various temperatures, Figure 21. The resultsare shown in Figures 22–24.
��0 ¼ �0:1791Tþ 19:6, T � 100�C
K ¼ �8:5881� 10�4T 3 þ 9:1312� 10�2T 2 � 4:8155Tþ 424:9, T � 100�C
n ¼ 4:098� 10�7T 3 � 4:476� 10�5T 2 þ 2:33� 10�3Tþ 0:3542, T � 100�C
where T is the temperature in Celsius.
0
10
20
30
40
50
0 0.0005 0.001 0.0015 0.002 0.0025
Viscoplastic strain
Str
ess
(MP
a)
T=24T=50T=75T=90T=100
Figure 21. Stress as a function of viscoplastic strain for composite A at various temperatures.
0
5
10
15
20
0 20 40 60 80 100
Temperature (°C)
Initi
al y
ield
str
ess
(MP
a)
Figure 22. Initial yield stress of composite A as a function of temperature.
2022 C. BASARAN ET AL.
at SUNY AT BUFFALO on October 27, 2008 http://jcm.sagepub.comDownloaded from

Damage Parameter
The damage evolution under loading can be monitored by in situ stiffnessmeasurements. This is framed in the theory of continuum damage mechanics with thescalar damage parameter D defined as (Kachanov, 1986):
D ¼ 1�E
E0
where E is the instantaneous elastic modulus and E0 is the initial value of the elasticmodulus. This damage parameter was determined experimentally (Figures 25 and 26).
CONCLUSIONS
The mechanical properties of PMMA/ATH composite material are, as expected,functions of temperature and strain rate. At room temperature PMMA/ATH compositecan be regarded as a rate insensitive material. At high temperatures, the viscoplasticityproperties must be considered for any analysis. The data presented in this article shouldsuffice to obtain all material properties needed for most viscoplastic constitutive model forsimilar ATH/PMMA particle filled composites. It is also observed that as the strain rate
0
0.2
0.4
0.6
0 20 40 60 80 100
Temperature (°C)
Par
amet
er n
Figure 24. Parameter n of composite A as a function of temperature.
0 20 40 60 80 100 0
100
200
300
400
Temperature (°C)
Par
amet
er K
Figure 23. Parameter K of composite A as a function of temperature.
Time Dependent Behavior of a Particle Filled Composite PMMA/ATH 2023
at SUNY AT BUFFALO on October 27, 2008 http://jcm.sagepub.comDownloaded from

increases both the Young’s modulus and the tensile strength increase, while ductility(plastic deformation at rupture) is independent of strain rate.
An important observation of this study is the fact that creep tests conducted undercompressive load yielded the same creep strain rates as the ones conducted under tension,albeit creep strain experienced in compression is much smaller than tension creep tests.
Finite element simulation of the experimental data is the subject of another study.Readers interested in verification of the constitutive model can refer to Nie and Basaran [6]and Basaran and Nie [12].
ACKNOWLEDGMENT
Support received from DuPont Surfaces, Yerkes R&D Lab is greatly appreciated.
Dam
age
0.24
0.20
0.16
0.12
0.08
0.04
0.000.000 0.002 0.004
Strain
0.006 0.008
Experimental measurementSimulation
Figure 25. Elastic modulus degradation at 248C.
Dam
age
0.40
0.32
0.24
0.16
0.08
0.000.000 0.005 0.010
Strain
0.015
Experimental measurementSimulation
Figure 26. Elastic modulus degradation at 758C.
2024 C. BASARAN ET AL.
at SUNY AT BUFFALO on October 27, 2008 http://jcm.sagepub.comDownloaded from

REFERENCES
1. Cheng, W.-M., Miller, G.A., Manson, C., Hertzberg, R.W. and Sperling, L.H. (1990).Mechanical Behavior of Poly(methyl methacrylate) Part 1: Tensile Strength and FractureToughness, Journal of Materials Science, 25: 1917–1923.
2. Cheng, W.-M., Miller, G.A., Manson, C., Hertzberg, R.W. and Sperling, L.H. (1990).Mechanical Behavior of Poly(methyl methacrylate) Part 2: The Temperature and FrequencyEffects on the Fatigue Crack Propagation Behaviour, Journal of Materials Science, 25:1917–1923.
3. Cheng, W.-M., Miller, G.A., Manson, C., Hertzberg, R.W. and Sperling, L.H. (1990).Mechanical Behavior of Poly(methyl methacrylate). Part 3: Activation Processes for FractureMechanism, Journal of Materials Science, 25: 1917–1923.
4. Ferreira, J.M., Costa, J.D. and Capela, C. (1997). Fracture Assessment of PMMA/Si KitchenSinks Made from Acrylic Casting Dispersion, Theoretical and Applied Fracture Mechanics, 26:105–116.
5. Jones, R.M. (1999). Mechanics of Composite Materials. 2nd edn, Taylor & Francis,Philadelphia, PA.
6. Nie, S. and Basaran, C. (2005). A Micromechanical Model foe Effective Elastic Propertiesof Particulate Composites with Imperfect Interfacial Bonds, Int. J. Solids and Structures, 42:4179–4191.
7. Basaran, C., Nie, S., Hutchins, S. and Ergun, H. (2008). Influence of Interfacial Bond Strengthon Fatigue Life and Mechanical Behavior of a Particulate Composite: An Experimental Study,Int. J. Damage Mechanics, 17(2): 123–148.
8. Nie, S., Basaran, C., Hutchins, S. and Ergun, H. (2006). Failure Mechanisms in PMMA/ATHAcrylic Casting Dispersion, Journal of Mechanical Behavior of Materials, 17(2): 79–95.
9. Nielsen, L.E. (1967). Mechanical Properties of Particulate-Filled Systems, Journal of CompositeMaterials, 1: 100–119.
10. US Patent 3,847,865, Nov 12, 1974, Use of Aluminum Trihydrate in a Poly Methyl MethacrylateArticle.
11. Chawla, K.K. (1998). Composite Materials: Science and Engineering, 2nd edn, Spring-Verlag,New York.
12. Basaran, C. and Nie, S. (2007). A Thermodynamic Based Damage Mechanics Model forParticulate Composites, Int. J. Solids and Structures, 44: 1099–1114.
13. Nie, S. (2005). A Micromechanical Study of the Damage Mechanics of Acrylic ParticulateComposites Under Thermomechanical Loading, PhD Dissertation Submitted to Dept. of Civil,Structural and Environmental Engineering at the State University of New York at Buffalo.
14. American Society for Testing and Materials, Standard Test for Tensile Properties of Plastics,Annual Book of ASTM, Vol. 08.01, ASTM D 638-98 (1999).
15. Ju, J. W. and Chen (1994a). ‘‘Micromechanics and Effective Moduli of Elastic CompositesContaining Randomly Dispersed Ellipsoidal Inhomogeneities’’, Acta Mechanica, 103: 103–121.
16. Kachanov, L.M. (1986). Introduction to Continuum Damage Mechanics, Martinus NijhoffDordrecht, The Netherlands.
17. Simo, J.C. and Hughes, T.J.R. (1998). Interdisciplinary Applied Mathematics, Mechanics andMaterials, Computational Inelasticity, Springer-Verlag, New York.
Time Dependent Behavior of a Particle Filled Composite PMMA/ATH 2025
at SUNY AT BUFFALO on October 27, 2008 http://jcm.sagepub.comDownloaded from