Journal of Asian Earth Sciences - Southeast Asia …searg.rhul.ac.uk/pubs/cottam_etal_2013 Malay...
17
Late Cretaceous and Cenozoic tectonics of the Malay Peninsula constrained by thermochronology Michael A. Cottam a,b,⇑ , Robert Hall a , Azman A. Ghani c a SE Asia Research Group, Department of Earth Sciences, Royal Holloway University of London, Egham, Surrey TW20 0EX, United Kingdom b BP Exploration Operating Company Limited, Wellheads Avenue, Dyce, Aberdeen AB21 7PB, United Kingdom c Department of Geology, University of Malaya, Kuala Lumpur, Malaysia article info Article history: Available online 11 May 2013 Keywords: Thermochronology Malay Peninsula Tectonics SE Asia abstract New thermochronological analyses of granites from the Malay Peninsula record the region’s thermal his- tory during the Late Mesozoic and Cenozoic. 40 Ar/ 39 Ar and (U–Th–Sm)/He analyses are combined with existing fission track data to provide a comprehensive set of temperature and time data. Fully and par- tially reset K-feldspar and biotite mica 40 Ar/ 39 Ar analyses indicate a significant period of thermal pertur- bation between 100 and 90 Ma, and a second lesser perturbation between 51 and 43 Ma. Zircon (U–Th–Sm)/He analyses and existing fission track data indicate exhumation of the Malay Peninsula in the Cretaceous, and renewed, localised exhumation in the early Paleogene. Apatite (U–Th–Sm)/He and fission track data indicate rapid exhumation of the region in the Late Eocene and Oligocene. Late Creta- ceous tectonism is linked to the reversal of a regional dynamic topographic low following the cessation of subduction along the Sundaland margin in the Late Cretaceous, causing regional uplift and exhumation and the addition of significant heat into the crust via mantle upwelling. Early Paleogene exhumation may reflect the continuation of Cretaceous tectonism or a discrete phase of Paleocene exhumation linked to localised transpressional tectonics. Eocene tectonism is coincident with major subsidence offshore of the Malay Peninsula, interpreted to reflect regional block faulting in response to north–south compres- sion driven by the resumption of subduction along the southern margin of Sundaland in the Eocene. Ó 2013 Elsevier Ltd. All rights reserved. 1. Introduction Despite its proximity to several prolific hydrocarbon-producing basins, the Cenozoic tectonic history of the Malay Peninsula is still incompletely understood. The region is often suggested to have experienced significant uplift and erosion during the Cenozoic but the timing of exhumation, and the cause of uplift and erosion, are not known. The onshore sedimentary record of the region’s exhumation is almost entirely missing, having been long removed by erosion. Thermochronology – the study of temperature and time in rocks – is a valuable tool in reconstructing the thermal histories of rocks from a variety of tectonic settings (e.g. Gleadow et al., 2002; Batt et al., 2004; Clark et al., 2005; Kirstein et al., 2006; Spo- tila et al., 2007; Metcalf et al., 2009; Glorie et al., 2010). Thermo- chronological dates record the last time a rock cooled below a mineral specific closure temperature (Dodson, 1973, 1976), either as a consequence of post-intrusion cooling or following reheating above such temperatures. The variation of a single thermochro- nometer with elevation can be used to constrain the timing and rates of exhumation (e.g. Zeitler et al., 1982; House et al., 2001; Reiners et al., 2003). Previous studies of the Malay Peninsula have typically focused on the age of the region’s granitic rocks using traditional isotopic methods such as Rb–Sr and/or K–Ar dating (e.g. Bignell, 1972; Snelling, 1965; Bignell and Snelling, 1977; Cobbing et al., 1986). The study of Krähenbuhl (1991) also included a large number of thermochronological dates (both zircon and apatite fission track ages) from across the peninsula. The Mesozoic granitoids of the Malay Peninsula provide excellent targets for thermochronology, using a range of minerals covering a wide range of closure temper- atures that provide thermal histories and insights into the tectonic history of the peninsula. This study presents the results of 16 new thermochronological analyses (8 40 Ar/ 39 Ar; 3 zircon (U–Th–Sm)/He; 5 apatite (U–Th– Sm)/He) performed on 12 samples representative of the three gra- nitic belts of the Malay Peninsula (Fig. 1, Table 1). We combine two of the principal thermochronological methods – 40 Ar/ 39 Ar and (U– Th–Sm)/He analyses – to constrain the region’s high and low tem- perature thermal history during the Late Mesozoic and Cenozoic. We utilise the additional sensitivity of the 40 Ar/ 39 Ar method to investigate post-intrusion thermal perturbation of these granitic 1367-9120/$ - see front matter Ó 2013 Elsevier Ltd. All rights reserved. http://dx.doi.org/10.1016/j.jseaes.2013.04.029 ⇑ Corresponding author at: BP Exploration Operating Company Limited, Well- heads Avenue, Dyce, Aberdeen AB21 7PB, United Kingdom. E-mail address: [email protected] (M.A. Cottam). Journal of Asian Earth Sciences 76 (2013) 241–257 Contents lists available at SciVerse ScienceDirect Journal of Asian Earth Sciences journal homepage: www.elsevier.com/locate/jseaes
Transcript of Journal of Asian Earth Sciences - Southeast Asia …searg.rhul.ac.uk/pubs/cottam_etal_2013 Malay...

Journal of Asian Earth Sciences 76 (2013) 241–257
Contents lists available at SciVerse ScienceDirect
Journal of Asian Earth Sciences
journal homepage: www.elsevier .com/locate / jseaes
Late Cretaceous and Cenozoic tectonics of the Malay Peninsulaconstrained by thermochronology
Michael A. Cottam a,b,⇑, Robert Hall a, Azman A. Ghani c
a SE Asia Research Group, Department of Earth Sciences, Royal Holloway University of London, Egham, Surrey TW20 0EX, United Kingdomb BP Exploration Operating Company Limited, Wellheads Avenue, Dyce, Aberdeen AB21 7PB, United Kingdomc Department of Geology, University of Malaya, Kuala Lumpur, Malaysia
a r t i c l e i n f o
Article history:Available online 11 May 2013
Keywords:ThermochronologyMalay PeninsulaTectonicsSE Asia
a b s t r a c t
New thermochronological analyses of granites from the Malay Peninsula record the region’s thermal his-tory during the Late Mesozoic and Cenozoic. 40Ar/39Ar and (U–Th–Sm)/He analyses are combined withexisting fission track data to provide a comprehensive set of temperature and time data. Fully and par-tially reset K-feldspar and biotite mica 40Ar/39Ar analyses indicate a significant period of thermal pertur-bation between �100 and �90 Ma, and a second lesser perturbation between �51 and �43 Ma. Zircon(U–Th–Sm)/He analyses and existing fission track data indicate exhumation of the Malay Peninsula inthe Cretaceous, and renewed, localised exhumation in the early Paleogene. Apatite (U–Th–Sm)/He andfission track data indicate rapid exhumation of the region in the Late Eocene and Oligocene. Late Creta-ceous tectonism is linked to the reversal of a regional dynamic topographic low following the cessation ofsubduction along the Sundaland margin in the Late Cretaceous, causing regional uplift and exhumationand the addition of significant heat into the crust via mantle upwelling. Early Paleogene exhumationmay reflect the continuation of Cretaceous tectonism or a discrete phase of Paleocene exhumation linkedto localised transpressional tectonics. Eocene tectonism is coincident with major subsidence offshore ofthe Malay Peninsula, interpreted to reflect regional block faulting in response to north–south compres-sion driven by the resumption of subduction along the southern margin of Sundaland in the Eocene.
� 2013 Elsevier Ltd. All rights reserved.
1. Introduction
Despite its proximity to several prolific hydrocarbon-producingbasins, the Cenozoic tectonic history of the Malay Peninsula is stillincompletely understood. The region is often suggested to haveexperienced significant uplift and erosion during the Cenozoicbut the timing of exhumation, and the cause of uplift and erosion,are not known. The onshore sedimentary record of the region’sexhumation is almost entirely missing, having been long removedby erosion.
Thermochronology – the study of temperature and time inrocks – is a valuable tool in reconstructing the thermal historiesof rocks from a variety of tectonic settings (e.g. Gleadow et al.,2002; Batt et al., 2004; Clark et al., 2005; Kirstein et al., 2006; Spo-tila et al., 2007; Metcalf et al., 2009; Glorie et al., 2010). Thermo-chronological dates record the last time a rock cooled below amineral specific closure temperature (Dodson, 1973, 1976), eitheras a consequence of post-intrusion cooling or following reheatingabove such temperatures. The variation of a single thermochro-
nometer with elevation can be used to constrain the timing andrates of exhumation (e.g. Zeitler et al., 1982; House et al., 2001;Reiners et al., 2003).
Previous studies of the Malay Peninsula have typically focusedon the age of the region’s granitic rocks using traditional isotopicmethods such as Rb–Sr and/or K–Ar dating (e.g. Bignell, 1972;Snelling, 1965; Bignell and Snelling, 1977; Cobbing et al., 1986).The study of Krähenbuhl (1991) also included a large number ofthermochronological dates (both zircon and apatite fission trackages) from across the peninsula. The Mesozoic granitoids of theMalay Peninsula provide excellent targets for thermochronology,using a range of minerals covering a wide range of closure temper-atures that provide thermal histories and insights into the tectonichistory of the peninsula.
This study presents the results of 16 new thermochronologicalanalyses (8 40Ar/39Ar; 3 zircon (U–Th–Sm)/He; 5 apatite (U–Th–Sm)/He) performed on 12 samples representative of the three gra-nitic belts of the Malay Peninsula (Fig. 1, Table 1). We combine twoof the principal thermochronological methods – 40Ar/39Ar and (U–Th–Sm)/He analyses – to constrain the region’s high and low tem-perature thermal history during the Late Mesozoic and Cenozoic.We utilise the additional sensitivity of the 40Ar/39Ar method toinvestigate post-intrusion thermal perturbation of these granitic
⇑ Corresponding author at: BP Exploration Operating Company Limited, Well-heads Avenue, Dyce, Aberdeen AB21 7PB, United Kingdom.
E-mail address: [email protected] (M.A. Cottam).
1367-9120/$ - see front matter � 2013 Elsevier Ltd. All rights reserved.http://dx.doi.org/10.1016/j.jseaes.2013.04.029
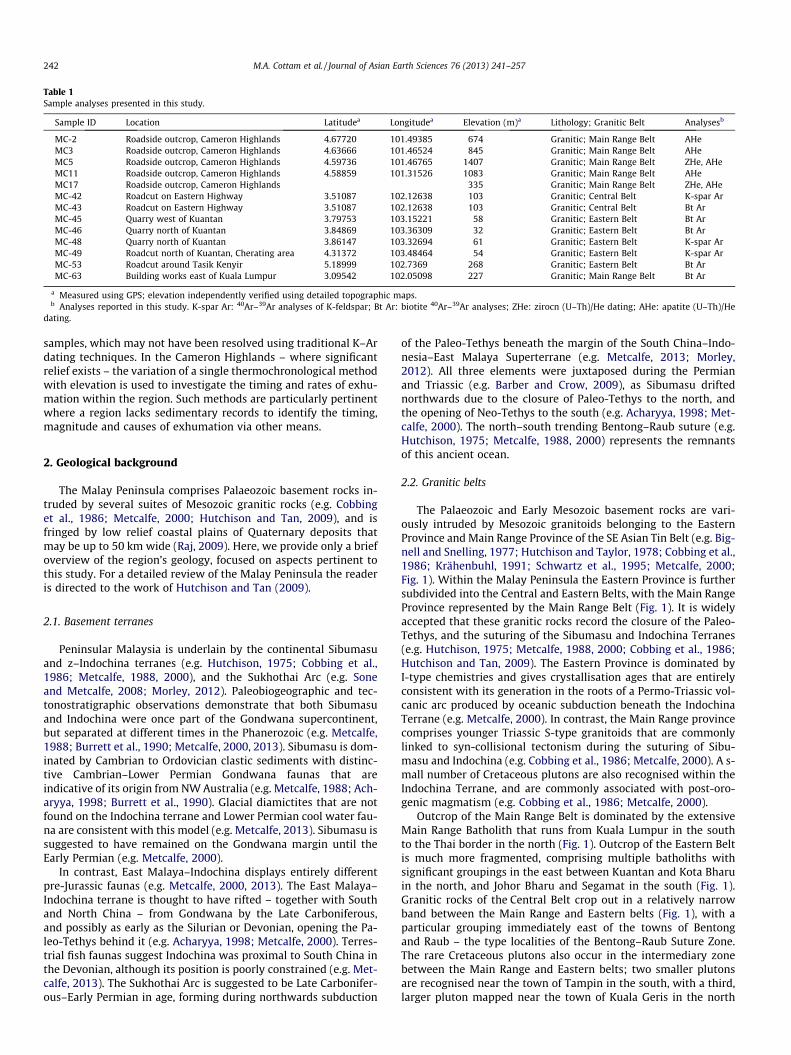
Table 1Sample analyses presented in this study.
Sample ID Location Latitudea Longitudea Elevation (m)a Lithology; Granitic Belt Analysesb
MC-2 Roadside outcrop, Cameron Highlands 4.67720 101.49385 674 Granitic; Main Range Belt AHeMC3 Roadside outcrop, Cameron Highlands 4.63666 101.46524 845 Granitic; Main Range Belt AHeMC5 Roadside outcrop, Cameron Highlands 4.59736 101.46765 1407 Granitic; Main Range Belt ZHe, AHeMC11 Roadside outcrop, Cameron Highlands 4.58859 101.31526 1083 Granitic; Main Range Belt AHeMC17 Roadside outcrop, Cameron Highlands 335 Granitic; Main Range Belt ZHe, AHeMC-42 Roadcut on Eastern Highway 3.51087 102.12638 103 Granitic; Central Belt K-spar ArMC-43 Roadcut on Eastern Highway 3.51087 102.12638 103 Granitic; Central Belt Bt ArMC-45 Quarry west of Kuantan 3.79753 103.15221 58 Granitic; Eastern Belt Bt ArMC-46 Quarry north of Kuantan 3.84869 103.36309 32 Granitic; Eastern Belt Bt ArMC-48 Quarry north of Kuantan 3.86147 103.32694 61 Granitic; Eastern Belt K-spar ArMC-49 Roadcut north of Kuantan, Cherating area 4.31372 103.48464 54 Granitic; Eastern Belt K-spar ArMC-53 Roadcut around Tasik Kenyir 5.18999 102.7369 268 Granitic; Eastern Belt Bt ArMC-63 Building works east of Kuala Lumpur 3.09542 102.05098 227 Granitic; Main Range Belt Bt Ar
a Measured using GPS; elevation independently verified using detailed topographic maps.b Analyses reported in this study. K-spar Ar: 40Ar–39Ar analyses of K-feldspar; Bt Ar: biotite 40Ar–39Ar analyses; ZHe: zirocn (U–Th)/He dating; AHe: apatite (U–Th)/He
242 M.A. Cottam et al. / Journal of Asian Earth Sciences 76 (2013) 241–257
samples, which may not have been resolved using traditional K–Ardating techniques. In the Cameron Highlands – where significantrelief exists – the variation of a single thermochronological methodwith elevation is used to investigate the timing and rates of exhu-mation within the region. Such methods are particularly pertinentwhere a region lacks sedimentary records to identify the timing,magnitude and causes of exhumation via other means.
2. Geological background
The Malay Peninsula comprises Palaeozoic basement rocks in-truded by several suites of Mesozoic granitic rocks (e.g. Cobbinget al., 1986; Metcalfe, 2000; Hutchison and Tan, 2009), and isfringed by low relief coastal plains of Quaternary deposits thatmay be up to 50 km wide (Raj, 2009). Here, we provide only a briefoverview of the region’s geology, focused on aspects pertinent tothis study. For a detailed review of the Malay Peninsula the readeris directed to the work of Hutchison and Tan (2009).
2.1. Basement terranes
Peninsular Malaysia is underlain by the continental Sibumasuand z–Indochina terranes (e.g. Hutchison, 1975; Cobbing et al.,1986; Metcalfe, 1988, 2000), and the Sukhothai Arc (e.g. Soneand Metcalfe, 2008; Morley, 2012). Paleobiogeographic and tec-tonostratigraphic observations demonstrate that both Sibumasuand Indochina were once part of the Gondwana supercontinent,but separated at different times in the Phanerozoic (e.g. Metcalfe,1988; Burrett et al., 1990; Metcalfe, 2000, 2013). Sibumasu is dom-inated by Cambrian to Ordovician clastic sediments with distinc-tive Cambrian–Lower Permian Gondwana faunas that areindicative of its origin from NW Australia (e.g. Metcalfe, 1988; Ach-aryya, 1998; Burrett et al., 1990). Glacial diamictites that are notfound on the Indochina terrane and Lower Permian cool water fau-na are consistent with this model (e.g. Metcalfe, 2013). Sibumasu issuggested to have remained on the Gondwana margin until theEarly Permian (e.g. Metcalfe, 2000).
In contrast, East Malaya–Indochina displays entirely differentpre-Jurassic faunas (e.g. Metcalfe, 2000, 2013). The East Malaya–Indochina terrane is thought to have rifted – together with Southand North China – from Gondwana by the Late Carboniferous,and possibly as early as the Silurian or Devonian, opening the Pa-leo-Tethys behind it (e.g. Acharyya, 1998; Metcalfe, 2000). Terres-trial fish faunas suggest Indochina was proximal to South China inthe Devonian, although its position is poorly constrained (e.g. Met-calfe, 2013). The Sukhothai Arc is suggested to be Late Carbonifer-ous–Early Permian in age, forming during northwards subduction
dating.
of the Paleo-Tethys beneath the margin of the South China–Indo-nesia–East Malaya Superterrane (e.g. Metcalfe, 2013; Morley,2012). All three elements were juxtaposed during the Permianand Triassic (e.g. Barber and Crow, 2009), as Sibumasu driftednorthwards due to the closure of Paleo-Tethys to the north, andthe opening of Neo-Tethys to the south (e.g. Acharyya, 1998; Met-calfe, 2000). The north–south trending Bentong–Raub suture (e.g.Hutchison, 1975; Metcalfe, 1988, 2000) represents the remnantsof this ancient ocean.
2.2. Granitic belts
The Palaeozoic and Early Mesozoic basement rocks are vari-ously intruded by Mesozoic granitoids belonging to the EasternProvince and Main Range Province of the SE Asian Tin Belt (e.g. Big-nell and Snelling, 1977; Hutchison and Taylor, 1978; Cobbing et al.,1986; Krähenbuhl, 1991; Schwartz et al., 1995; Metcalfe, 2000;Fig. 1). Within the Malay Peninsula the Eastern Province is furthersubdivided into the Central and Eastern Belts, with the Main RangeProvince represented by the Main Range Belt (Fig. 1). It is widelyaccepted that these granitic rocks record the closure of the Paleo-Tethys, and the suturing of the Sibumasu and Indochina Terranes(e.g. Hutchison, 1975; Metcalfe, 1988, 2000; Cobbing et al., 1986;Hutchison and Tan, 2009). The Eastern Province is dominated byI-type chemistries and gives crystallisation ages that are entirelyconsistent with its generation in the roots of a Permo-Triassic vol-canic arc produced by oceanic subduction beneath the IndochinaTerrane (e.g. Metcalfe, 2000). In contrast, the Main Range provincecomprises younger Triassic S-type granitoids that are commonlylinked to syn-collisional tectonism during the suturing of Sibu-masu and Indochina (e.g. Cobbing et al., 1986; Metcalfe, 2000). A s-mall number of Cretaceous plutons are also recognised within theIndochina Terrane, and are commonly associated with post-oro-genic magmatism (e.g. Cobbing et al., 1986; Metcalfe, 2000).
Outcrop of the Main Range Belt is dominated by the extensiveMain Range Batholith that runs from Kuala Lumpur in the southto the Thai border in the north (Fig. 1). Outcrop of the Eastern Beltis much more fragmented, comprising multiple batholiths withsignificant groupings in the east between Kuantan and Kota Bharuin the north, and Johor Bharu and Segamat in the south (Fig. 1).Granitic rocks of the Central Belt crop out in a relatively narrowband between the Main Range and Eastern belts (Fig. 1), with aparticular grouping immediately east of the towns of Bentongand Raub – the type localities of the Bentong–Raub Suture Zone.The rare Cretaceous plutons also occur in the intermediary zonebetween the Main Range and Eastern belts; two smaller plutonsare recognised near the town of Tampin in the south, with a third,larger pluton mapped near the town of Kuala Geris in the north
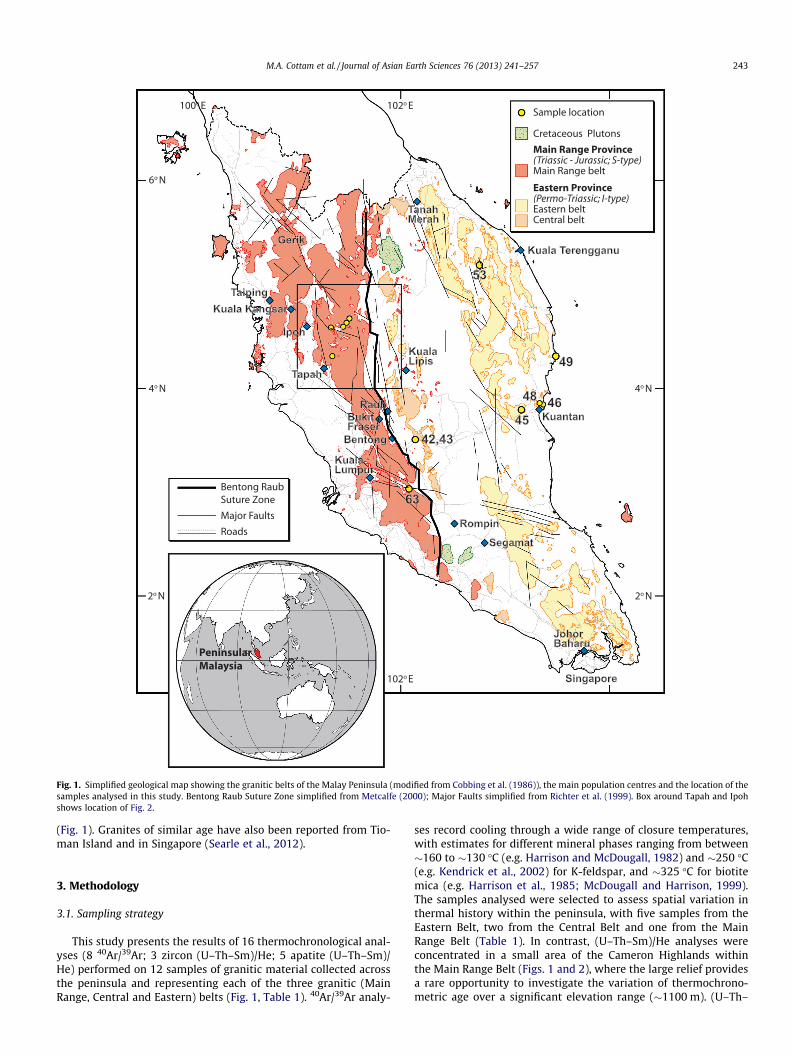
(Fig. 1). Granites of similar age have also been reported from Tio-man Island and in Singapore (Searle et al., 2012).
3. Methodology
3.1. Sampling strategy
This study presents the results of 16 thermochronological anal-yses (8 40Ar/39Ar; 3 zircon (U–Th–Sm)/He; 5 apatite (U–Th–Sm)/He) performed on 12 samples of granitic material collected acrossthe peninsula and representing each of the three granitic (MainRange, Central and Eastern) belts (Fig. 1, Table 1). 40Ar/39Ar analy-
ses record cooling through a wide range of closure temperatures,with estimates for different mineral phases ranging from between�160 to �130 �C (e.g. Harrison and McDougall, 1982) and �250 �C(e.g. Kendrick et al., 2002) for K-feldspar, and �325 �C for biotitemica (e.g. Harrison et al., 1985; McDougall and Harrison, 1999).The samples analysed were selected to assess spatial variation inthermal history within the peninsula, with five samples from theEastern Belt, two from the Central Belt and one from the MainRange Belt (Table 1). In contrast, (U–Th–Sm)/He analyses wereconcentrated in a small area of the Cameron Highlands withinthe Main Range Belt (Figs. 1 and 2), where the large relief providesa rare opportunity to investigate the variation of thermochrono-metric age over a significant elevation range (�1100 m). (U–Th–
Fig. 1. Simplified geological map showing the granitic belts of the Malay Peninsula (modified from Cobbing et al. (1986)), the main population centres and the location of thesamples analysed in this study. Bentong Raub Suture Zone simplified from Metcalfe (2000); Major Faults simplified from Richter et al. (1999). Box around Tapah and Ipohshows location of Fig. 2.
M.A. Cottam et al. / Journal of Asian Earth Sciences 76 (2013) 241–257 243

Sm)/He analyses record the low-temperature shallow crustal his-tory of rocks as they cooled below closure temperatures of�183 �C for zircon (e.g. Reiners, 2005) and �70 �C for apatite (e.g.Ehlers and Farley, 2003). Following common assumptions we re-late cooling to reflect exhumation (e.g. Zeitler et al., 1982; Reinersand Brandon, 2006; Metcalf et al., 2009; Glorie et al., 2010), andutilise the variation of thermochronometric data with elevationto estimate rates of exhumation (e.g. Zeitler et al., 1982; Houseet al., 2001; Reiners et al., 2003).
3.2. Sample collection
In the east around Kuantan (Fig. 1) road works provided accessto excellent fresh outcrops of Eastern Belt (Eastern Province) gra-nitic material that are heavily weathered elsewhere. The dominantmaterial is coarse-grained granite with K-feldspar phenocrysts andabundant biotite, often occurring in bands or enclaves, and in-truded by finer-grained granites – again with abundant biotite –and crosscut by dykes and late-stage epidote mineralisation. Sam-ples MC-46 and MC-48 were collected from the main granite attwo separate locations (Fig. 1). Sample MC-45 was collected froma location within the finer grained granite (Fig. 1). To the northof Kuantan granites contain phenocrysts of both K-feldspar andamphibole (sampled for MC-49). Further north new road cutsaround Tasik Kenyir provided access to coarse-grained biotite-richgranites (sampled for MC-53) of the Eastern Belt that lack pheno-crysts of K-feldspar or hornblende and are again cut by youngerdykes with mafic compositions. South of Kuala Lipis roadside out-crops expose fine-grained, leucocratic granites that belong to theCentral Belt (Eastern Province) that are crosscut by younger gra-nitic dykes. Samples MC-42 and MC-43 were collected from differ-ent areas of the same location within this granite; MC-42 from thefine-grained granites and MC-43 from the crosscutting dyke.
Southeast of Kuala Lumpur (Fig. 1), recent quarrying exposesextremely fresh coarse-grained granites of the Main Range Belt,with K-feldspar phenocrysts and abundant clots of biotite (MC-63). From Tapah the highway ascends into the Cameron Highlandsproviding excellent access into the Main Range Belt (Figs. 1 and 2)and road maintenance exposed fresh granites. Samples were also
collected along the descent from the Cameron Highlands towardsPos Selim and Sampang Pulai, within the area famous for tea plan-tations. Samples are predominantly coarse-grained porphyriticgranites with abundant K-feldspar phenocrysts and biotite, bothwithin the groundmass and enclaves of more mafic granites. Thelithologies exposed along the Pos Selim–Kampang Raja road havebeen described in detail by Ghani and Ghani (2003a,b).
Individual samples of around 5 kg each were collected, withweathered material removed in the field during collection. Sam-ples were accurately located using GPS, with elevations taken fromdetailed topographic maps. Samples were crushed, graded usingdisposable nylon cloth sieves in a brass collar and separated usingconventional electromagnetic and heavy liquid techniques. High-purity mineral separates were handpicked from the resulting250–100 lm fraction.
3.3. Analytical methods
40Ar/39Ar step-heating analyses were conducted at the Univer-sity of Melbourne generally following procedures described byMatchan and Phillips (2011). Samples were loaded into aluminiumfoil packets and placed in quartz tubes (UM#27) along with theflux monitor GA1550 biotite (98.8 ± 0.5 Ma; Renne et al., 1998)and irradiated in a cadmium-lined can (UM#27) in position 5c ofthe McMaster University reactor, Hamilton, Canada. Irradiatedsamples were placed into a vacuum sample chamber of a double-vacuum tantalum resistance furnace, linked to a VG3600 massspectrometer equipped with Daly and Faraday detectors. Theextraction line and contained samples were baked for 48 h at�200�. Samples were heated incrementally from an idle tempera-ture of 300 �C up to a maximum of 1450 �C. Heating to the desiredstep temperature was achieved over 3 min, with the temperaturesustained at each step for 20 min. Gas was admitted to the massspectrometer following purification by two Zr–Al getters. Extrac-tion line blanks were analysed prior to analysis of each sample,with further outgassing conducted at 1500 �C. Mass discriminationwas monitored by measuring air aliquots from a Doerflinger pip-ette over the analytical period.
Argon isotopic results are corrected for system blanks, mass dis-crimination, radioactive decay, reactor-induced interference reac-tions and atmospheric argon contamination. Decay constantsused are those reported by Steiger and Jäger (1977). Correctionfactors (±1 sigma) for interfering isotopes were (36Ar/37Ar)Ca =0.000289 ± 1.7%, (39Ar/37Ar)Ca = 0.000680 ± 2.79%, (40Ar/39Ar)K =0.000400 ± 100% and (38Ar/39Ar)K = 0.0130 ± 38.46%. System blanklevels were monitored between analyses and found to beessentially atmospheric (40Ar/36Ar atm = 295.5 ± 0.5 (Nier, 1950)).40Ar–39Ar ages were calculated relative to a GA1550 age of98.8 ± 0.5 Ma (Renne et al., 1998). Calculated uncertaintiesassociated with mean and plateau ages include uncertainties inthe J-values, but exclude errors associated with the age of the fluxmonitor and the decay constant.
(U–Th–Sm)/He analyses were also undertaken at the School ofEarth Sciences, University of Melbourne. Single grain ages wereroutinely analysed in triplicate, with additional analyses under-taken where intra-sample variation exceeded analytical error.Grains were selected following the routine described by Farley(2002) and mounted in platinum capsules. Gas extraction followedestablished laboratory routines (e.g. House et al., 2000) using a so-lid-state diode laser. Grains were dissolved in HNO3 and U–Th–Smwas measured using a second-generation Varian quadrupole ICP-MS. Analyses were calibrated against the reference materialBHVO-1, and Mud Tank apatite and international rock standardBCR-2. Routine analyses of Durango apatite (McDowell et al.,2005) with each batch of samples served as further check on accu-racy and precision. Ages were corrected for a-emission (FT correc-
Fig. 2. Simplified geological map of the Cameron Highlands region showing thegranitic belts (modified from Cobbing et al. (1986)), the main population centresand the location of the samples analysed in this study. Symbols and lines as in Fig. 1.
244 M.A. Cottam et al. / Journal of Asian Earth Sciences 76 (2013) 241–257

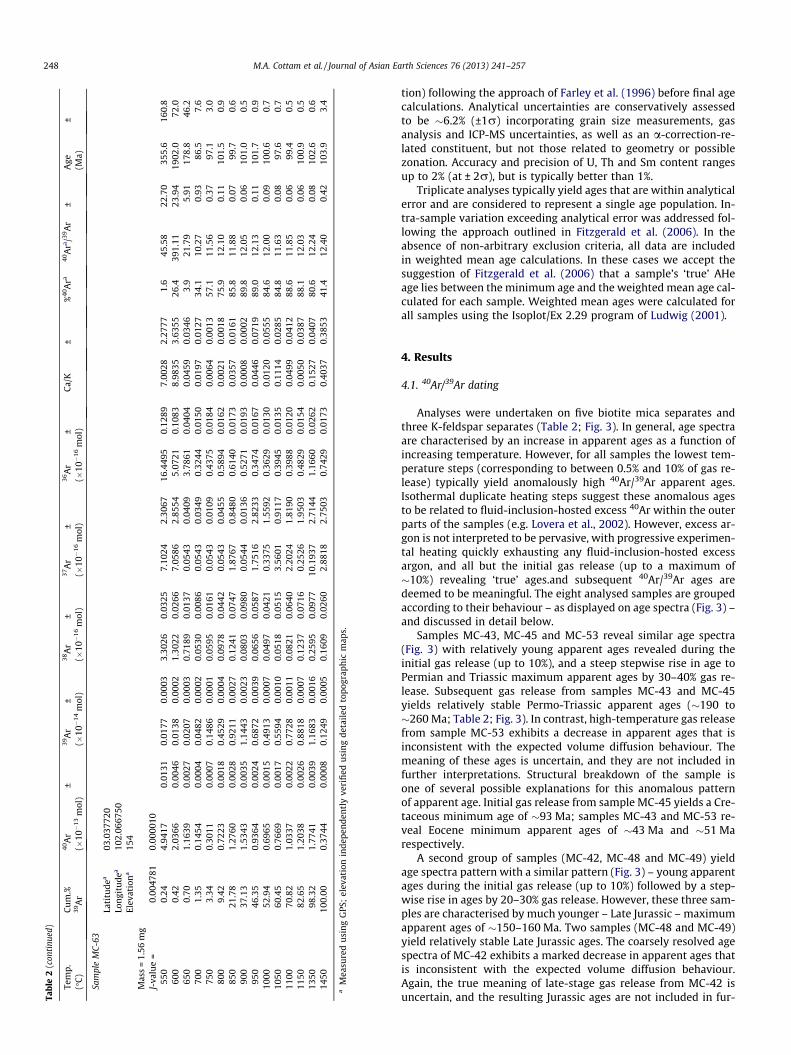
Table 240Ar/39Ar step-heating analytical results.
Temp. Cum.% 40Ar ± 39Ar ± 38Ar ± 37Ar ± 36Ar ± Ca/K ± %40Ara 40Ara/39Ar ± Age ±(�C) 39Ar (�10�13 mol) (�10�14 mol) (�10�16 mol) (�10�16 mol) (�10�16 mol) (Ma)
Sample MC-42: K-feldsparLatitudea 03.510870Longitudea 102.126380Elevationa 103
Mass = 0.80 mgJ-value = 0.004768 0.000006
600 1.67 6.265 0.013 0.022 0.000 4.138 0.048 27.096 2.907 20.665 0.132 21.149 2.295 2.5 70.67 18.37 523.90 118.2650 3.81 0.457 0.001 0.029 0.000 0.260 0.017 0.077 0.066 1.381 0.022 0.047 0.040 10.6 16.90 2.33 139.83 18.5700 7.33 0.238 0.001 0.047 0.000 0.113 0.017 0.078 0.375 0.641 0.011 0.029 0.139 20.5 10.37 0.69 87.07 5.7750 11.67 0.220 0.001 0.058 0.000 0.076 0.014 0.078 0.032 0.532 0.019 0.023 0.010 28.5 10.76 0.98 90.28 8.0800 15.82 0.270 0.001 0.056 0.000 0.124 0.011 0.078 0.084 0.701 0.015 0.024 0.026 23.2 11.25 0.78 94.27 6.4850 19.77 0.264 0.001 0.053 0.000 0.134 0.008 0.078 0.647 0.663 0.016 0.026 0.213 25.8 12.85 0.90 107.31 7.3900 24.34 0.255 0.001 0.061 0.000 0.063 0.018 0.078 0.505 0.565 0.012 0.022 0.145 34.6 14.44 0.57 120.11 4.6950 29.00 0.302 0.001 0.063 0.000 0.064 0.013 0.078 0.030 0.613 0.015 0.022 0.008 40.1 19.38 0.72 159.45 5.7
1000 34.18 0.395 0.001 0.069 0.000 0.197 0.021 5.266 3.055 0.878 0.026 1.328 0.770 34.4 19.58 1.11 161.04 8.71050 39.11 0.478 0.001 0.066 0.000 0.276 0.010 15.003 3.190 1.208 0.021 3.964 0.843 25.4 18.32 0.93 151.10 7.41100 43.01 0.393 0.001 0.052 0.000 0.237 0.018 3.631 2.952 1.076 0.016 1.215 0.987 19.1 14.32 0.92 119.13 7.41180 50.24 0.219 0.000 0.097 0.000 0.053 0.012 1.283 0.887 0.402 0.013 0.232 0.160 45.7 10.32 0.39 86.66 3.21210 59.45 0.215 0.000 0.124 0.000 0.026 0.016 0.078 0.061 0.315 0.005 0.011 0.009 56.8 9.89 0.13 83.16 1.11240 75.28 0.302 0.001 0.212 0.000 0.003 0.020 0.078 0.018 0.349 0.009 0.006 0.001 65.8 9.36 0.13 78.77 1.01260 87.65 0.257 0.001 0.166 0.001 0.029 0.022 0.078 0.048 0.301 0.020 0.008 0.005 65.4 10.13 0.36 85.12 2.91280 93.82 0.167 0.000 0.083 0.000 0.047 0.023 1.690 3.515 0.307 0.004 0.357 0.743 45.8 9.26 0.14 77.97 1.21300 96.33 0.121 0.000 0.034 0.000 0.048 0.005 1.145 2.082 0.328 0.008 0.596 1.083 19.7 7.07 0.73 59.81 6.11350 97.77 0.139 0.000 0.019 0.000 0.072 0.014 0.078 0.093 0.413 0.017 0.071 0.084 12.1 8.72 2.61 73.46 21.51450 98.50 0.251 0.001 0.010 0.000 0.151 0.021 0.078 0.136 0.799 0.014 0.140 0.243 5.9 15.22 4.13 126.40 33.11550 100.00 0.677 0.001 0.020 0.000 0.399 0.006 3.760 2.044 2.232 0.027 3.263 1.775 2.6 8.65 3.96 72.92 32.7
Sample MC-43: biotiteLatitudea 03.510870Longitudea 102.126380Elevationa 103
J-value = 0.004774 0.000009600 0.61 6.878 0.015 0.018 0.000 4.318 0.096 17.265 9.645 22.716 0.167 17.264 9.651 2.4 94.67 29.45 672.69 174.7650 1.05 1.918 0.004 0.013 0.000 1.240 0.043 5.394 1.368 6.367 0.048 7.473 1.910 1.9 29.11 11.75 234.73 88.8700 2.49 0.097 0.000 0.041 0.000 0.066 0.008 7.395 1.879 0.260 0.014 3.148 0.800 21.2 5.01 1.02 42.68 8.6750 5.70 0.125 0.000 0.092 0.000 0.004 0.021 13.030 1.811 0.127 0.022 2.489 0.346 69.9 9.52 0.70 80.15 5.7800 8.83 0.232 0.001 0.090 0.000 0.000 0.012 5.498 1.828 0.073 0.020 1.075 0.357 90.7 23.47 0.68 191.58 5.2850 13.67 0.365 0.001 0.138 0.001 0.000 0.014 0.060 0.921 0.068 0.022 0.008 0.116 94.5 24.91 0.48 202.72 3.7900 18.16 0.329 0.001 0.128 0.000 0.000 0.015 0.060 0.008 0.050 0.007 0.008 0.001 95.5 24.50 0.17 199.54 1.3950 21.99 0.297 0.001 0.110 0.000 0.000 0.019 0.060 0.018 0.052 0.011 0.010 0.003 94.8 25.72 0.31 208.89 2.4
1000 25.34 0.279 0.001 0.096 0.000 0.000 0.010 0.060 0.018 0.061 0.012 0.011 0.003 93.6 27.31 0.41 221.09 3.11050 29.87 0.391 0.001 0.130 0.001 0.035 0.059 2.579 10.605 0.075 0.037 0.348 1.433 94.3 28.45 0.86 229.76 6.51100 38.76 0.752 0.002 0.254 0.001 0.000 0.071 2.985 10.394 0.111 0.035 0.206 0.716 95.6 28.30 0.41 228.61 3.11150 52.82 1.142 0.002 0.402 0.001 0.000 0.068 0.060 0.051 0.000 0.001 0.003 0.002 100.0 28.40 0.07 229.36 0.51450 100.00 3.809 0.008 1.348 0.003 0.115 0.118 42.753 6.047 0.329 0.064 0.555 0.078 97.4 27.53 0.16 222.75 1.2
Sample MC-45: biotiteLatitudea 03.797530Longitudea 103.152210Elevationa 58
Mass = 1.22 mgJ-value = 0.004775 0.000010
550 0.43 4.8545 0.0106 0.0147 0.0006 3.1808 0.0729 9.7866 7.8854 16.0903 0.1260 11.6458 9.3970 2.1 67.87 26.49 506.38 172.3600 0.88 2.5123 0.0062 0.0155 0.0005 1.6378 0.0326 5.2973 4.4326 8.2959 0.0654 5.9945 5.0191 2.4 39.35 13.18 310.65 95.6650 3.70 1.8566 0.0048 0.0964 0.0007 1.2217 0.0271 2.5013 1.8763 5.9208 0.0665 0.4541 0.3406 5.8 11.10 2.10 93.14 17.2
(continued on next page)
M.A
.Cottamet
al./Journalof
Asian
EarthSciences
76(2013)
241–257
245

Table 2 (continued)
Temp. Cum.% 40Ar ± 39Ar ± 38Ar ± 37Ar ± 36Ar ± Ca/K ± %40Ara 40Ara/39Ar ± Age ±(�C) 39Ar (�10�13 mol) (�10�14 mol) (�10�16 mol) (�10�16 mol) (�10�16 mol) (Ma)
700 7.32 0.2671 0.0007 0.1240 0.0005 0.1674 0.0416 1.4109 1.5286 0.3437 0.0301 0.1991 0.2157 62.0 13.35 0.72 111.45 5.8750 10.45 0.3934 0.0008 0.1073 0.0004 0.1481 0.0326 5.5562 4.8841 0.3212 0.0297 0.9059 0.7963 75.9 27.81 0.83 224.93 6.3800 15.07 0.5154 0.0028 0.1583 0.0007 0.1255 0.0224 0.0532 0.0385 0.1922 0.0163 0.0059 0.0043 89.0 28.97 0.37 233.73 2.8850 23.26 0.8898 0.0020 0.2805 0.0008 0.2087 0.0240 0.0532 0.0918 0.1372 0.0213 0.0033 0.0057 95.4 30.27 0.25 243.58 1.9900 34.14 1.1697 0.0026 0.3724 0.0006 0.3393 0.0397 8.2772 4.1910 0.1005 0.0241 0.3890 0.1969 97.5 30.61 0.21 246.12 1.6950 43.69 1.0574 0.0031 0.3273 0.0011 0.1497 0.0471 0.0533 0.0456 0.1003 0.0147 0.0028 0.0024 97.2 31.40 0.19 252.06 1.5
1000 54.33 1.2470 0.0028 0.3644 0.0013 0.2970 0.0478 6.4731 1.5543 0.2010 0.0356 0.3109 0.0747 95.2 32.59 0.32 260.94 2.41050 71.64 1.9923 0.0051 0.5930 0.0011 0.5131 0.0547 9.6138 2.7118 0.3889 0.0224 0.2837 0.0800 94.2 31.66 0.15 253.98 1.11100 90.03 2.0455 0.0043 0.6298 0.0016 0.5430 0.0571 7.2359 2.6785 0.3557 0.0121 0.2011 0.0744 94.9 30.81 0.12 247.61 0.91150 97.74 0.8960 0.0020 0.2641 0.0007 0.2462 0.0324 0.0534 0.0952 0.3605 0.0151 0.0035 0.0063 88.1 29.90 0.20 240.73 1.51350 99.74 0.6973 0.0017 0.0685 0.0006 0.3391 0.0189 9.3862 0.8211 1.7297 0.0296 2.3991 0.2109 26.7 27.19 1.32 220.22 10.11450 100.00 0.2944 0.0007 0.0089 0.0002 0.1491 0.0089 0.0534 0.0569 0.8724 0.0137 0.1050 0.1119 12.4 41.12 4.67 323.39 33.6
Sample MC-46: biotiteLatitudea 03.848690Longitudea 103.363090Elevationa 32
Mass = 1.60 mgJ-value = 0.004776 0.000011
600 0.58 1.3950 0.0040 0.0330 0.0004 0.8825 0.0073 2.6154 1.1698 4.5912 0.0316 1.3857 0.6200 2.7 11.60 3.08 97.26 25.1650 1.82 0.8186 0.0017 0.0703 0.0001 0.5243 0.0165 5.7229 1.4152 2.6387 0.0435 1.4256 0.3525 4.7 5.52 1.85 46.98 15.5700 4.33 0.2622 0.0006 0.1426 0.0006 0.1487 0.0268 0.0587 0.0576 0.6006 0.0235 0.0072 0.0071 32.3 5.94 0.49 50.49 4.1750 8.39 0.5226 0.0011 0.2303 0.0013 0.1376 0.0190 0.5413 2.1935 0.8786 0.0172 0.0411 0.1667 50.3 11.42 0.23 95.80 1.9800 16.58 0.7269 0.0015 0.4646 0.0002 0.1178 0.0395 0.0587 0.0698 0.7161 0.0154 0.0022 0.0026 70.9 11.09 0.10 93.13 0.8850 30.11 1.0182 0.0029 0.7675 0.0014 0.1003 0.0665 4.6712 2.3971 0.6424 0.0200 0.1065 0.0547 81.4 10.79 0.09 90.68 0.7900 40.17 0.6920 0.0021 0.5703 0.0010 0.0329 0.0481 0.0588 0.0774 0.2897 0.0095 0.0018 0.0024 87.6 10.63 0.06 89.36 0.5950 46.44 0.4117 0.0009 0.3557 0.0003 0.0393 0.0367 0.0588 0.0636 0.1131 0.0117 0.0029 0.0031 91.9 10.64 0.10 89.39 0.8
1000 54.03 0.4977 0.0011 0.4307 0.0009 0.0003 0.0353 2.1762 1.6515 0.1383 0.0125 0.0884 0.0671 91.8 10.61 0.09 89.14 0.81050 67.90 0.8978 0.0022 0.7867 0.0004 0.0004 0.0692 0.0589 0.0496 0.2406 0.0224 0.0013 0.0011 92.1 10.51 0.09 88.34 0.71100 84.73 1.1372 0.0027 0.9552 0.0023 0.0284 0.0806 0.0589 0.0603 0.4097 0.0112 0.0011 0.0011 89.4 10.64 0.05 89.41 0.41150 95.58 0.8076 0.0018 0.6153 0.0017 0.0388 0.0527 0.0589 0.0306 0.3950 0.0150 0.0017 0.0009 85.5 11.23 0.08 94.24 0.71350 99.68 0.3873 0.0008 0.2325 0.0006 0.0466 0.0266 4.3727 2.5907 0.4249 0.0203 0.3292 0.1950 67.6 11.26 0.26 94.49 2.11450 100.00 0.1394 0.0004 0.0183 0.0005 0.0445 0.0052 0.0590 0.0221 0.3873 0.0168 0.0564 0.0212 17.9 13.62 2.75 113.67 22.3
Sample MC-48: K-feldsparLatitudea 03.861470Longitudea 103.326940Elevationa 61
Mass = 3.61 mgJ-value = 0.004770 0.000006
450 0.06 0.3246 0.0008 0.0063 0.0003 0.2100 0.0075 4.1696 1.3475 1.0012 0.0171 11.4932 3.7420 8.9 45.25 8.27 352.58 58.5450 0.15 0.3454 0.0007 0.0091 0.0003 0.1529 0.0226 0.0790 0.0312 1.0664 0.0181 0.1526 0.0605 8.8 33.46 6.04 267.12 44.8500 0.23 0.2429 0.0008 0.0078 0.0002 0.0923 0.0195 0.0790 0.0122 0.5271 0.0204 0.1783 0.0278 35.9 112.39 8.25 774.38 46.2500 0.38 0.3413 0.0007 0.0151 0.0002 0.2440 0.0110 2.7499 2.1571 1.0868 0.0121 3.1830 2.4971 5.9 13.32 2.42 111.13 19.6550 0.59 0.4975 0.0013 0.0204 0.0001 0.1683 0.0117 0.0791 0.0510 0.8653 0.0118 0.0678 0.0438 48.6 118.47 1.98 808.12 10.9550 1.07 0.6514 0.0014 0.0480 0.0005 0.3451 0.0199 0.0792 0.0333 1.9144 0.0191 0.0289 0.0121 13.2 17.86 1.22 147.46 9.7600 1.56 0.3941 0.0009 0.0486 0.0003 0.0962 0.0150 0.0792 0.0022 0.5703 0.0136 0.0285 0.0008 57.2 46.37 0.89 360.53 6.2600 2.67 0.3755 0.0008 0.1109 0.0002 0.1129 0.0204 0.0793 0.1563 0.8200 0.0087 0.0125 0.0247 35.5 12.01 0.24 100.52 2.0650 3.54 0.3315 0.0008 0.0863 0.0002 0.0525 0.0111 0.0793 0.6757 0.3684 0.0127 0.0161 0.1370 67.2 25.79 0.45 209.30 3.5650 5.02 0.3451 0.0008 0.1473 0.0005 0.0920 0.0147 1.7646 1.7264 0.6023 0.0220 0.2096 0.2050 48.4 11.34 0.45 95.04 3.7700 5.93 0.2625 0.0006 0.0905 0.0002 0.0376 0.0149 0.0794 0.0205 0.3082 0.0158 0.0154 0.0040 65.3 18.94 0.52 156.08 4.1750 7.76 0.4254 0.0009 0.1825 0.0008 0.0789 0.0186 1.3358 4.1473 0.4488 0.0071 0.1281 0.3976 68.8 16.04 0.14 133.00 1.2800 10.20 0.5267 0.0014 0.2425 0.0005 0.0914 0.0330 1.4807 3.6014 0.5166 0.0212 0.1068 0.2599 71.0 15.42 0.27 128.06 2.1850 12.39 0.4111 0.0010 0.2176 0.0009 0.0686 0.0218 0.0796 0.1462 0.4408 0.0156 0.0064 0.0118 68.3 12.91 0.22 107.78 1.8900 14.15 0.3319 0.0007 0.1756 0.0003 0.0146 0.0203 0.0796 0.0415 0.3551 0.0151 0.0079 0.0041 68.4 12.92 0.26 107.88 2.1950 15.64 0.3115 0.0007 0.1482 0.0003 0.0621 0.0149 0.0796 0.0321 0.4142 0.0237 0.0094 0.0038 60.7 12.76 0.48 106.58 3.9
246M
.A.Cottam
etal./Journal
ofA
sianEarth
Sciences76
(2013)241–
257

1000 17.23 0.3664 0.0008 0.1581 0.0005 0.0921 0.0142 0.4601 0.2004 0.5315 0.0100 0.0509 0.0222 57.1 13.24 0.20 110.51 1.61050 19.01 0.4321 0.0009 0.1773 0.0005 0.1646 0.0216 10.8878 0.3729 0.6594 0.0125 1.0748 0.0369 54.9 13.38 0.22 111.65 1.81100 21.63 0.6181 0.0013 0.2605 0.0004 0.1354 0.0233 0.0798 0.0442 0.6750 0.0116 0.0054 0.0030 67.7 16.07 0.14 133.27 1.11180 31.99 2.1917 0.0052 1.0320 0.0014 0.1328 0.0862 7.6579 2.7860 0.6370 0.0165 0.1299 0.0472 91.4 19.41 0.07 159.77 0.61210 43.17 2.4362 0.0052 1.1121 0.0010 0.1295 0.0919 6.9310 2.8174 0.4636 0.0185 0.1091 0.0443 94.4 20.67 0.07 169.68 0.51240 60.30 3.8027 0.0082 1.7059 0.0021 0.3384 0.1408 19.6657 4.8712 0.6754 0.0282 0.2017 0.0500 94.7 21.12 0.07 173.18 0.61260 77.35 3.7578 0.0113 1.6972 0.0029 0.1871 0.1448 15.4566 6.4242 0.6472 0.0279 0.1594 0.0662 94.9 21.01 0.09 172.34 0.71280 89.08 2.5534 0.0054 1.1673 0.0006 0.1319 0.1053 12.5314 4.0429 0.5534 0.0188 0.1879 0.0606 93.6 20.47 0.07 168.11 0.51300 94.97 1.3215 0.0027 0.5868 0.0004 0.0846 0.0477 1.8254 2.0664 0.4111 0.0157 0.0544 0.0616 90.8 20.45 0.09 167.91 0.71350 97.74 0.7049 0.0015 0.2751 0.0005 0.1069 0.0301 3.6520 1.7746 0.5057 0.0163 0.2323 0.1129 78.8 20.19 0.19 165.88 1.51450 99.17 0.5452 0.0011 0.1426 0.0005 0.1129 0.0182 0.0801 0.0411 0.6799 0.0143 0.0098 0.0050 63.1 24.13 0.32 196.58 2.41550 100.00 0.5315 0.0011 0.0825 0.0003 0.2157 0.0235 0.0802 0.0699 1.1262 0.0288 0.0170 0.0148 37.4 24.08 1.04 196.15 8.1
Sample MC-49Latitudea 04.313720Longitudea 103.484640Elevationa 54
Mass = 1.30 mgJ-value = 0.004771 0.000007
500 0.27 1.6483 0.0037 0.0075 0.0003 1.1255 0.0119 5.5755 1.8845 5.4760 0.0472 12.9524 4.4044 1.8 39.95 19.20 314.8 138.8550 0.69 1.7702 0.0038 0.0117 0.0003 1.1244 0.0200 2.9375 2.0098 5.8019 0.0475 4.3848 3.0019 3.1 47.50 12.46 368.6 87.4600 1.63 2.0312 0.0050 0.0259 0.0005 1.2796 0.0239 1.2576 1.9152 6.6285 0.0576 0.8504 1.2952 3.6 28.02 6.86 226.4 52.1650 3.67 0.4418 0.0010 0.0566 0.0001 0.1928 0.0133 0.0757 0.0728 1.2037 0.0216 0.0234 0.0225 19.5 15.20 1.14 126.3 9.1700 6.79 0.2858 0.0007 0.0865 0.0004 0.0778 0.0151 0.0757 0.0449 0.6002 0.0087 0.0153 0.0091 37.9 12.54 0.31 104.8 2.5750 10.01 0.2405 0.0006 0.0894 0.0005 0.0538 0.0196 0.0757 0.0242 0.4283 0.0163 0.0148 0.0047 47.4 12.75 0.55 106.5 4.4800 12.85 0.2489 0.0005 0.0787 0.0004 0.0776 0.0102 1.4887 1.6734 0.4621 0.0129 0.3311 0.3722 45.1 14.29 0.49 119.0 4.0850 15.67 0.2392 0.0005 0.0782 0.0005 0.0686 0.0162 0.0758 0.0469 0.3896 0.0135 0.0170 0.0105 51.9 15.86 0.53 131.6 4.2900 17.99 0.2030 0.0004 0.0644 0.0003 0.0292 0.0148 0.0759 0.0874 0.3007 0.0142 0.0206 0.0238 56.2 17.74 0.66 146.6 5.3950 19.91 0.2086 0.0004 0.0532 0.0003 0.0151 0.0132 0.0759 0.0632 0.3585 0.0181 0.0250 0.0208 49.2 19.29 1.02 158.9 8.0
1000 21.76 0.2433 0.0006 0.0512 0.0002 0.0973 0.0189 1.2622 2.7956 0.5313 0.0141 0.4317 0.9560 35.5 16.86 0.82 139.6 6.61050 23.64 0.2558 0.0005 0.0521 0.0005 0.1004 0.0117 0.5300 2.0355 0.5443 0.0113 0.1779 0.6830 37.1 18.20 0.67 150.2 5.31100 25.88 0.1978 0.0004 0.0621 0.0005 0.0553 0.0066 2.8313 1.6266 0.3295 0.0130 0.7978 0.4584 50.8 16.17 0.64 134.0 5.11150 29.44 0.2033 0.0004 0.0989 0.0003 0.0169 0.0197 2.4161 3.5141 0.1576 0.0124 0.4274 0.6216 77.1 15.84 0.38 131.4 3.01200 38.11 0.4733 0.0010 0.2404 0.0010 0.0653 0.0212 0.0761 0.0869 0.1860 0.0136 0.0055 0.0063 88.4 17.40 0.19 143.9 1.51250 57.22 1.0692 0.0022 0.5299 0.0006 0.0676 0.0460 6.6935 3.0707 0.3031 0.0122 0.2210 0.1014 91.6 18.49 0.08 152.5 0.71300 90.16 1.8154 0.0037 0.9135 0.0018 0.0907 0.0740 9.5390 2.6198 0.3602 0.0142 0.1827 0.0502 94.1 18.71 0.07 154.2 0.61350 96.00 0.3719 0.0009 0.1620 0.0007 0.0502 0.0201 0.0762 0.6428 0.2533 0.0108 0.0082 0.0695 79.9 18.34 0.22 151.3 1.71450 97.23 0.2225 0.0006 0.0341 0.0005 0.1001 0.0124 3.4979 2.3046 0.5732 0.0134 1.7968 1.1841 23.9 15.60 1.19 129.5 9.61550 100.00 0.9800 0.0020 0.0768 0.0013 0.6372 0.0097 21.4604 1.9515 3.1270 0.0309 4.8918 0.4529 5.7 7.29 1.23 61.7 10.2
Sample MC-53Latitudea 05.189990Longitudea 102.74657Elevationa 260
Mass = 1.43 mgJ-value = 0.004779 0.000011
600 0.50 1.0180 0.0022 0.0155 0.0001 0.6173 0.0095 0.0575 0.0037 3.3130 0.0301 0.0648 0.0042 3.8 25.13 5.89 204.6 45.4700 9.43 0.8838 0.0018 0.2759 0.0012 0.4599 0.0271 11.0852 1.0896 2.4335 0.0327 0.7030 0.0692 18.6 5.97 0.36 50.7 3.0750 12.74 0.2881 0.0007 0.1023 0.0002 0.0326 0.0243 0.0575 0.0497 0.1830 0.0153 0.0098 0.0085 81.2 22.87 0.45 187.2 3.5800 15.97 0.3332 0.0010 0.1001 0.0004 0.0476 0.0212 1.5475 2.0608 0.1483 0.0092 0.2706 0.3603 86.8 28.92 0.31 233.5 2.4850 20.80 0.4770 0.0010 0.1492 0.0004 0.0421 0.0181 1.3390 0.5939 0.1152 0.0079 0.1570 0.0696 92.9 29.68 0.19 239.3 1.4900 26.43 0.5665 0.0013 0.1740 0.0004 0.0269 0.0178 0.0576 0.0653 0.0787 0.0134 0.0058 0.0066 95.9 31.22 0.25 250.9 1.9950 32.05 0.5795 0.0012 0.1739 0.0004 0.0102 0.0171 0.0576 0.0123 0.0611 0.0139 0.0058 0.0012 96.9 32.28 0.26 258.8 1.9
1000 37.52 0.5896 0.0014 0.1691 0.0005 0.0302 0.0264 0.0577 0.0724 0.0599 0.0150 0.0060 0.0075 97.0 33.82 0.30 270.3 2.21050 46.72 1.0389 0.0022 0.2842 0.0006 0.0601 0.0278 0.5976 1.7534 0.1087 0.0185 0.0368 0.1080 96.9 35.42 0.22 282.1 1.61100 64.33 1.8314 0.0037 0.5447 0.0009 0.1428 0.0446 7.0604 1.8643 0.0920 0.0207 0.2268 0.0599 98.5 33.12 0.14 265.1 1.11150 85.63 2.0512 0.0043 0.6585 0.0013 0.1615 0.0541 8.3352 2.0597 0.1229 0.0105 0.2215 0.0547 98.2 30.60 0.10 246.2 0.81350 99.68 1.4397 0.0031 0.4342 0.0011 0.2020 0.0429 20.3815 3.5337 0.5232 0.0233 0.8215 0.1424 89.3 29.60 0.19 238.7 1.41450 100.00 0.1675 0.0004 0.0100 0.0003 0.0407 0.0123 0.0578 0.0224 0.4282 0.0193 0.1012 0.0393 24.5 40.94 5.82 322.4 41.9
(continued on next page)
M.A
.Cottamet
al./Journalof
Asian
EarthSciences
76(2013)
241–257
247
tion) following the approach of Farley et al. (1996) before final agecalculations. Analytical uncertainties are conservatively assessedto be �6.2% (±1r) incorporating grain size measurements, gasanalysis and ICP-MS uncertainties, as well as an a-correction-re-lated constituent, but not those related to geometry or possiblezonation. Accuracy and precision of U, Th and Sm content rangesup to 2% (at ± 2r), but is typically better than 1%.
Triplicate analyses typically yield ages that are within analyticalerror and are considered to represent a single age population. In-tra-sample variation exceeding analytical error was addressed fol-lowing the approach outlined in Fitzgerald et al. (2006). In theabsence of non-arbitrary exclusion criteria, all data are includedin weighted mean age calculations. In these cases we accept thesuggestion of Fitzgerald et al. (2006) that a sample’s ‘true’ AHeage lies between the minimum age and the weighted mean age cal-culated for each sample. Weighted mean ages were calculated forall samples using the Isoplot/Ex 2.29 program of Ludwig (2001).
4. Results
4.1. 40Ar/39Ar dating
Analyses were undertaken on five biotite mica separates andthree K-feldspar separates (Table 2; Fig. 3). In general, age spectraare characterised by an increase in apparent ages as a function ofincreasing temperature. However, for all samples the lowest tem-perature steps (corresponding to between 0.5% and 10% of gas re-lease) typically yield anomalously high 40Ar/39Ar apparent ages.Isothermal duplicate heating steps suggest these anomalous agesto be related to fluid-inclusion-hosted excess 40Ar within the outerparts of the samples (e.g. Lovera et al., 2002). However, excess ar-gon is not interpreted to be pervasive, with progressive experimen-tal heating quickly exhausting any fluid-inclusion-hosted excessargon, and all but the initial gas release (up to a maximum of�10%) revealing ‘true’ ages.and subsequent 40Ar/39Ar ages aredeemed to be meaningful. The eight analysed samples are groupedaccording to their behaviour – as displayed on age spectra (Fig. 3) –and discussed in detail below.
Samples MC-43, MC-45 and MC-53 reveal similar age spectra(Fig. 3) with relatively young apparent ages revealed during theinitial gas release (up to 10%), and a steep stepwise rise in age toPermian and Triassic maximum apparent ages by 30–40% gas re-lease. Subsequent gas release from samples MC-43 and MC-45yields relatively stable Permo-Triassic apparent ages (�190 to�260 Ma; Table 2; Fig. 3). In contrast, high-temperature gas releasefrom sample MC-53 exhibits a decrease in apparent ages that isinconsistent with the expected volume diffusion behaviour. Themeaning of these ages is uncertain, and they are not included infurther interpretations. Structural breakdown of the sample isone of several possible explanations for this anomalous patternof apparent age. Initial gas release from sample MC-45 yields a Cre-taceous minimum age of �93 Ma; samples MC-43 and MC-53 re-veal Eocene minimum apparent ages of �43 Ma and �51 Marespectively.
A second group of samples (MC-42, MC-48 and MC-49) yieldage spectra pattern with a similar pattern (Fig. 3) – young apparentages during the initial gas release (up to 10%) followed by a step-wise rise in ages by 20–30% gas release. However, these three sam-ples are characterised by much younger – Late Jurassic – maximumapparent ages of �150–160 Ma. Two samples (MC-48 and MC-49)yield relatively stable Late Jurassic ages. The coarsely resolved agespectra of MC-42 exhibits a marked decrease in apparent ages thatis inconsistent with the expected volume diffusion behaviour.Again, the true meaning of late-stage gas release from MC-42 isuncertain, and the resulting Jurassic ages are not included in fur-Ta
ble
2(c
onti
nued
)
Tem
p.C
um
.%4
0A
r±
39A
r±
38A
r±
37A
r±
36A
r±
Ca/
K±
%4
0A
ra4
0A
ra /39A
r±
Age
±(�
C)
39A
r(�
10�
13
mol
)(�
10�
14
mol
)(�
10�
16
mol
)(�
10�
16
mol
)(�
10�
16
mol
)(M
a)
Sam
ple
MC-
63La
titu
dea
03.0
3772
0Lo
ngi
tude
a10
2.06
6750
Elev
atio
na
154
Mas
s=
1.56
mg
J-va
lue
=0.
0047
810.
0000
1055
00.
244.
9417
0.01
310.
0177
0.00
033.
3026
0.03
257.
1024
2.30
6716
.449
50.
1289
7.00
282.
2777
1.6
45.5
822
.70
355.
616
0.8
600
0.42
2.03
660.
0046
0.01
380.
0002
1.30
220.
0266
7.05
862.
8554
5.07
210.
1083
8.98
353.
6355
26.4
391.
1123
.94
1902
.072
.065
00.
701.
1639
0.00
270.
0207
0.00
030.
7189
0.01
370.
0543
0.04
093.
7861
0.04
040.
0459
0.03
463.
921
.79
5.91
178.
846
.270
01.
350.
1454
0.00
040.
0482
0.00
020.
0530
0.00
860.
0543
0.03
490.
3244
0.01
500.
0197
0.01
2734
.110
.27
0.93
86.5
7.6
750
3.34
0.30
110.
0007
0.14
860.
0001
0.05
950.
0161
0.05
430.
0109
0.43
750.
0184
0.00
640.
0013
57.1
11.5
60.
3797
.13.
080
09.
420.
7223
0.00
180.
4529
0.00
040.
0978
0.04
420.
0543
0.04
550.
5894
0.01
620.
0021
0.00
1875
.912
.10
0.11
101.
50.
985
021
.78
1.27
600.
0028
0.92
110.
0027
0.12
410.
0747
1.87
670.
8480
0.61
400.
0173
0.03
570.
0161
85.8
11.8
80.
0799
.70.
690
037
.13
1.53
430.
0035
1.14
430.
0023
0.08
030.
0980
0.05
440.
0136
0.52
710.
0193
0.00
080.
0002
89.8
12.0
50.
0610
1.0
0.5
950
46.3
50.
9364
0.00
240.
6872
0.00
390.
0656
0.05
871.
7516
2.82
330.
3474
0.01
670.
0446
0.07
1989
.012
.13
0.11
101.
70.
910
0052
.94
0.69
650.
0015
0.49
130.
0007
0.04
970.
0421
0.33
751.
5592
0.36
290.
0130
0.01
200.
0555
84.6
12.0
00.
0910
0.6
0.7
1050
60.4
50.
7669
0.00
170.
5594
0.00
100.
0518
0.05
153.
5601
0.91
170.
3945
0.01
350.
1114
0.02
8584
.811
.63
0.08
97.6
0.7
1100
70.8
21.
0337
0.00
220.
7728
0.00
110.
0821
0.06
402.
2024
1.81
900.
3988
0.01
200.
0499
0.04
1288
.611
.85
0.06
99.4
0.5
1150
82.6
51.
2038
0.00
260.
8818
0.00
070.
1237
0.07
160.
2526
1.95
030.
4829
0.01
540.
0050
0.03
8788
.112
.03
0.06
100.
90.
513
5098
.32
1.77
410.
0039
1.16
830.
0016
0.25
950.
0977
10.1
937
2.71
441.
1660
0.02
620.
1527
0.04
0780
.612
.24
0.08
102.
60.
614
5010
0.00
0.37
440.
0008
0.12
490.
0005
0.16
090.
0260
2.88
182.
7503
0.74
290.
0173
0.40
370.
3853
41.4
12.4
00.
4210
3.9
3.4
aM
easu
red
usi
ng
GPS
;el
evat
ion
inde
pen
den
tly
veri
fied
usi
ng
deta
iled
topo
grap
hic
map
s.
248 M.A. Cottam et al. / Journal of Asian Earth Sciences 76 (2013) 241–257

Fig. 3. 40Ar/39Ar age spectra for the eight samples analysed in this study.
M.A. Cottam et al. / Journal of Asian Earth Sciences 76 (2013) 241–257 249

ther interpretations. All three samples (MC-42, MC-48 and MC-49)yield Cretaceous minimum ages of between �90 and �105 Ma(Fig. 3).
The two remaining samples (MC-46 and MC-63) yield markedlydifferent age spectra that are characterised by Late Cretaceousapparent ages of �90 Ma and �100 Ma respectively (Table 2;Fig. 3). Initial gas release from sample MC-46 yields an Eoceneminimum age of �47 Ma; initial gas release from sample MC-63yields a Late Cretaceous minimum age of �87 Ma.
4.2. (U–Th–Sm)/He dating
(U–Th–Sm)/He analyses were carried out on mineral separatesfrom five samples that form an elevation profile with a total rangeof �1100 m (Table 1). Zircon (U–Th–Sm)/He analyses (ZHe) wereperformed on samples from the highest and lowest elevations.Apatite (U–Th–Sm)/He analyses (AHe) were performed on all fivesamples. In all cases multiple analyses were performed on separatealiquots of the sample. ZHe analyses give Late Cretaceous to Eoceneages that range from �86 Ma to �49 Ma (Table 3). Analyses of thehigh elevation sample (MC5; 1407 m elevation) yield two mid-LateCretaceous ages that are within error (�86 Ma and �85 Ma) and alatest Cretaceous age (�66 Ma). The low elevation sample (MC17;335 m elevation) yields a single Paleocene (�62 Ma) and Early Eo-cene (�49 Ma) ZHe ages that are within two sigma. A third anom-alous Proterozoic age (�1202 Ma; Table 3) is older than thePalaeozoic age of the granite and is therefore disregarded.
AHe analyses give Eocene to Oligocene ages that range from�55 Ma to �29 Ma (Table 4). All AHe ages are either younger thanor within error of ZHe ages from the equivalent sample. AHeweighted mean ages (WMAs) were calculated for all samples usingthe Isoplot/Ex 2.29 program of Ludwig (2001). Repeat analyses ofsamples from the lowest and highest elevations yield ages thatare within analytical error (Table 4) and clearly represent singleage populations, yielding WMAs of 52.8 ± 3.7 Ma (MC17) and45.9 ± 5.3 Ma (MC5) respectively. Three samples exhibit intra-sam-ple variation that exceeds analytical error. However, in the absenceof non-arbitrary exclusion criteria (e.g. statistical tests or clearlyerroneous ages that are greater than those of the sampled lithol-ogy) all analyses are included in weighted mean age calculations(e.g. Fitzgerald et al., 2006) assuming that the sample’s ‘true’ AHeage lies between the minimum age and the calculated weightedmean age. Chauvenet’s Criterion provides an objective statisticaltest of whether outlier data points belong to a single population(e.g. Fitzgerald et al., 2006). Data are rejected where the probabilityof occurrence, multiplied by the number of data points in the pop-ulation, is not significant (less than 0.5). Based on Chauvenet’s Cri-terion an anomalous Cretaceous AHe age from sample MC3 –otherwise characterised by Eocene–Oligocene ages – is rejectedfrom WMA calculations, which yield an earliest Oligocene age of
32.1 ± 9.6 Ma. Five AHe analyses from sample MC5 yield a WMAof 45.9 ± 5.3 Ma. The large variation in AHe ages from sampleMC11 (Table 3) yield a WMA with a large error of 30.0 ± 20.0 Ma.
5. Interpretation
5.1. 40Ar/39Ar analyses
40Ar/39Ar analyses record the last time that samples cooledthrough closure temperatures of between �160 to �130 �C (e.g.Harrison and McDougall, 1982) and �250 �C (e.g. Kendrick et al.,2002) for K-feldspar, and �325 �C for biotite mica (e.g. Harrisonet al., 1985; McDougall and Harrison, 1999). Granitic rocks are typ-ically expected to yield age spectra dominated by a single 40Ar/39Arage, which reflects rapid cooling following emplacement and crys-tallisation. In contrast, our 40Ar/39Ar analyses reveal variously dis-turbed age spectra (Fig. 3) that display limited evidence – or insome cases no evidence – of the expected Permo-Triassic intrusionages of the Eastern (Central and Eastern Belts) and Main RangeProvinces (Main Range Belt) respectively (e.g. Hutchison, 1975;Metcalfe, 1988, 2000; Cobbing et al., 1986; Hutchison and Tan,2009). All eight samples are interpreted to have experienced signif-icant thermal perturbation since their emplacement and crystalli-sation, at temperatures above those of closure effecting total orpartial diffusive loss of radiogenic argon from the minerals.
In the case of samples MC-46 (Eastern Belt) and MC-63 (MainRange Belt), thermal perturbations are interpreted to have beensufficient to effect total loss of any radiogenic argon accumulatedsince emplacement, crystallisation and initial cooling below clo-sure temperatures – totally resetting the samples’ age spectra,and removing all traces of original intrusion age (Fig. 3). In thesecases, the age spectra solely reflect the accumulation of radiogenicargon since this event, dating the last such thermal perturbation tohave affected these samples at between �100 Ma and �90 Ma(Fig. 3).
In contrast, analyses of K-feldspar separates from MC-42, MC-48 and MC-49, from the Central and Eastern Belts of the EasternProvince, suggest only partial resetting during post-intrusion ther-mal perturbations. At high percentages of analytical gas release allthree samples display Jurassic ages (Fig. 3). We suggest that theseJurassic ages reflect the partial diffusive loss of the radiogenic ar-gon accumulated within the core of the mineral since emplace-ment, crystallisation and initial cooling beneath closuretemperatures. As a result, the Jurassic ages represent ‘mixed’ dates– part way between the original crystallisation ages and the age ofthermal perturbation – that have no significance. An alternativeinterpretation, based on the K-feldspar multi-diffusion domainmodel, is that these ages are meaningful, representing a period ofslow cooling in the Jurassic. However, if this were the case wemay expect to see a more complex age spectra characterised by
Table 3Zircon (U–Th–Sm)/He analyses for samples from the Cameron Highlands.
Sample ID Latitudea
Longitude aElevation a (m) Number grains Mass (mg) U (ppm) Th (ppm) He (ncc) Uncorrected age (Ma) FT
b Corrected age(Ma) ± 1s
MC-5 4.59736 1407 i 1 0.0076 688.5 178.1 33.613 67.36 0.78 86.3 5.3MC-5 101.46765 ii 1 0.0223 17.1 5.3 70.229 56.09 0.85 66.3 4.1MC-5 iii 1 0.0125 782.7 91.8 75.361 67.47 0.79 85.0 5.3
MC-17 335 i 1 0.0286 684.6 217.2 222.627 42.33 0.86 49.3 3.1MC-17 ii 1 0.0227 2372.5 378.5 453.226 1022.35 0.85 1202.3c 74.4MC-17 iii 1 0.0130 839.0 213.2 120.167 49.80 0.81 61.5 3.8
a Longitude and latitude data (decimal degrees); elevation data are based on position within a detailed digital elevation model (DEM).b FT is the a-ejection correction after Farley et al. (1996).c Outlier data point excluded from calculation of weighted mean age based on being older than the known age of the pluton (see text).
250 M.A. Cottam et al. / Journal of Asian Earth Sciences 76 (2013) 241–257

Table 4Apatite (U–Th–Sm)/He analyses for samples from the Cameron Highlands.
Sample ID Latitude a
Longitude aElevation a (m) Number grains Mass (mg) U (ppm) Th (ppm) Sm (ppm) He (ncc) Uncorrected age (Ma) FT
b Correctedage (Ma) ± 1s
Grain length Grain width Wt mean age(Ma) ± 1sc
MC-2 4.67720 674 i 1 0.0127 43.2 29.8 383.3 2.868 36.6 0.82 44.7 2.8 175.2 169.7 34.9 8.2101.49385 ii 1 0.0112 30.7 13.5 314.1 1.192 25.5 0.80 31.7 2.0 234.2 137.7
iii 1 0.0038 51.8 26.6 587.2 0.696 25.3 0.71 35.8 2.2 282.6 85.3iv 1 0.0097 62.7 35.4 550.3 2.231 26.4 0.81 32.5 2.0 239.8 157.6
MC3 4.63666 845 i 1 0.0042 36.0 25.6 385.6 0.482 22.0 0.77 28.7 1.8 151.2 139.3 32.1 9.6101.46524 ii 1 0.0057 26.3 16.3 321.2 0.873 41.1 0.76 54.2 3.4 184.4 111.0
iii 1 0.0089 32.6 22.3 361.0 1.249 30.1 0.80 37.5 2.3 261.6 141.1iv 1 0.0034 65.2 40.9 623.8 0.656 20.8 0.72 28.7 1.8 191.3 102.4v 1 0.0066 33.6 27.1 368.9 2.180 66.4 0.73 90.6 5.6d 293.6 104.3vi 1 0.0100 33.6 21.9 388.1 1.068 22.3 0.76 29.4 1.8 399.4 110.0
MC5 4.59736 1407 i 1 0.0086 111.4 59.6 652.9 5.141 38.7 0.81 47.8 3.0 344.2 116.6 45.9 5.3101.46765 ii 1 0.0112 111.4 52.2 576.1 7.120 41.9 0.78 53.7 3.3 314.6 142.2
iii 1 0.0182 54.0 12.1 296.8 4.807 37.8 0.83 45.3 2.8 330.3 148.2iv 1 0.0113 87.8 22.4 341.8 4.617 35.8 0.81 44.0 2.7 194.5 152.0v 1 0.0047 85.6 18.7 417.2 1.621 31.5 0.75 41.9 2.6 149.5 111.4
MC11 4.58859 1083 i 1 0.0016 54.9 117.9 132.0 0.244 15.4 0.60 25.7 1.3 139.5 67.0 30.0 20.0101.31526 ii 1 0.0047 9.5 20.0 372.7 0.207 24.9 0.75 33.0 2.0 186.7 124.1
iii 1 0.0186 6.8 17.2 129.8 0.950 38.0 0.84 45.4 2.8 223.2 182.1
MC17 335 i 1 0.0118 53.9 38.3 351.6 3.933 43.1 0.81 53.4 3.3 238.4 140.1 52.8 3.7ii 1 0.0127 46.8 30.8 363.0 3.457 40.9 0.81 50.7 3.1 289.5 131.9iii 1 0.0180 32.4 34.1 277.5 4.058 45.3 0.83 54.6 3.4 257.8 166.7
a Longitude and latitude data (decimal degrees); elevation data are based on position within a detailed digital elevation model (DEM).b FT is the a-ejection correction after Farley et al. (1996).c Calculated using ISOPLOT (Ludwig, 2001).d Outlier data point excluded from calculation of weighted mean age based on Chauvenet’s Criterion (see text).
M.A
.Cottamet
al./Journalof
Asian
EarthSciences
76(2013)
241–257
251

consecutive steps of Permo-Triassic and then Jurassic ages, whichwe do not. Cretaceous ages revealed (Fig. 3) during the samples’initial analytical gas release (up to 20%) are interpreted to reflecttotal loss of any accumulated radiogenic argon from the outer partsof the mineral, totally resetting the age spectra, and removing alltraces of its original intrusion age (Fig. 3). The Cretaceous ages re-cord the last thermal perturbation to have affected this sample atbetween �105 Ma and �90 Ma.
Samples MC-43, MC-45 and MC-53 – biotite mica mineral sep-arates from the Central and Eastern Belts of the Eastern Province –are interpreted to have experienced only minor resetting due topost-intrusion thermal perturbations, affecting argon loss andresetting ages in only the outermost parts of the crystal (Fig. 3).Permo-Triassic ages observed at high percentages of analyticalgas release are interpreted to reflect the original emplacementand crystallisation ages of the samples undisturbed by subsequentthermal events (Fig. 3). Cretaceous ages observed during the initial(<10%) gas release from MC-45 (Fig. 3) date the last thermal pertur-bation to have affected this sample at �93 Ma. The age of the initialgas release from samples MC-43 and MC-53 suggests the last ther-mal perturbations to have affected these samples were at �43 Maand �51 Ma respectively (Fig. 3). Although the effects of excess ar-gon are deemed to be minimal within the sample set, the potentialfor contamination – and thus the overestimation of apparent ages– means that these Eocene dates represent a maximum age for thisevent. The data do not reveal whether the younger events over-printed any Cretaceous thermal perturbations, or whether thesesamples did not experience thermal perturbations in theCretaceous.
5.2. (U–Th–Sm)/He analyses
ZHe ages record cooling to below closure temperatures of�183 �C (e.g. Reiners, 2005) in the Late Cretaceous to Late Paleo-cene (Fig. 4); AHe ages give Eocene to Oligocene ages (Fig. 4) mark-ing cooling to below closure temperatures of �70 �C (e.g. Ehlersand Farley, 2003). Following common assumptions (e.g. Zeitleret al., 1982; Reiners and Brandon, 2006; Metcalf et al., 2009; Glorieet al., 2010), we interpret this cooling to reflect progressive exhu-mation of the samples through the upper crust with uplift and ero-sion bringing the samples progressively closer to the Earth’ssurface accompanied by cooling.
Comparison of the two samples for which there are both zirconand apatite (U–Th–Sm)/He analyses (Fig. 4; Tables 3 and 4) sug-gests that they experienced quite different cooling – and by infer-ence exhumation – histories. The sample from the lowest elevation(MC-17; 335 m) yields overlapping ZHe WMAs (between �62 Maand �49 Ma) and AHe WMAs (�53 Ma) that record a single phaseof rapid cooling. We interpret these records to reflect geologicallyinstantaneous exhumation through both ZHe and AHe closure tem-peratures and depths during one event in the early Paleogene. Incontrast, the sample from the highest elevations (MC-5; 1407 m)is suggested to record two discrete phases of cooling (Fig. 4). ZHeages (between �85 Ma and �66 Ma) suggest that the sample wasexhumed through ZHe closure temperatures and depths in the lat-est Cretaceous. However, the sample appears to have remained attemperatures greater than AHe closure temperatures until it wasexhumed through AHe closure temperatures and depths in theearly Middle Eocene (�46 Ma).
Geographically, these two samples are also quite distinct – sam-ple MC-17 was collected several kilometres from MC-5 and thethree other analysed samples (Fig. 2). Based on the differences intheir geography and thermal history we suggest that samplesMC-17 and MC-5 lay within different crustal blocks, possibly sep-arated by a significant fault. Therefore the variation of thermochr-onometric data with elevation for these samples cannot be used to
define rates of exhumation, and such calculations are not under-taken. In contrast, we interpret the four closely spaced samplesto be part of a single crustal block. When errors are consideredAHe analyses from these samples (MC-2, MC-3, MC-5 and MC-11) yield overlapping Eocene to Oligocene WMAs that define asteep – essentially age invariant – positive age elevation plot(Fig. 4) that is indicative of extremely rapid exhumation duringthe Eocene and earliest Oligocene.
6. Discussion
6.1. Granitic intrusion ages
Where unaffected by younger thermal perturbations, 40Ar/39Aranalyses confirm reported granitic intrusion ages within the MalayPeninsula. Samples MC-43 and MC-45 and MC-53 yield Permo-Tri-assic ages that are entirely consistent with intrusion ages previ-ously determined for the Central and Eastern Belts of the EasternProvince respectively (e.g. Cobbing et al., 1986; Krähenbuhl,1991; Metcalfe, 2000; Hutchison and Tan, 2009). Jurassic ages ob-served at high percentages of analytical gas release from samplesMC-42, MC-48 and MC-49 are not intrusion ages, but instead areinterpreted as ‘mixed’ dates that have no significance.
6.2. Cretaceous thermal perturbation
40Ar–39Ar analyses indicate that the Malay Peninsula experi-enced a significant period of thermal perturbation between�105 Ma and �87 Ma. The thermal effects of this perturbationare seen in at least six of the eight analysed samples, reflecting ele-vated temperatures within the crust that caused partial or full lossof radiogenic argon (Fig. 3). There is no systematic variation withinthe Malay Peninsula; for example, fully reset samples are found in
Fig. 4. Age versus elevation plot of the seven (U–Th–Sm)/He analyses (two zirconand five apatite) undertaken in this study. Apatite (U–Th)/He weighted mean agesare plotted 50m above true sample elevations for clarity.
252 M.A. Cottam et al. / Journal of Asian Earth Sciences 76 (2013) 241–257

both the west (MC-63) and east (MC-46) of the peninsula (Fig. 1),and variably reset samples are found relatively close to one an-other (e.g. fully reset sample MC-46 and partially reset sampleMC-48; Fig. 1). The differing patterns of resetting are interpretedto reflect varied responses to a single regional thermal event ratherthan separate responses to multiple events. They are interpreted asa consequence of the susceptibility of minerals analysed, and local-ised variation in the temperatures due to fluid effects.
It is notable that all of the K-feldspar samples (MC42, MC-48and MC-49) showed partial resetting, whereas three of the biotitemica samples (MC45, MC-46, MC-63) showed only minor resetting.This apparently variable response to the same event offers insightinto the temperatures and duration of the thermal perturbation.For example, the partial resetting of ages within K-feldspar sampleMC-48, and the total loss of accumulated argon from the outerparts of the mineral, indicates that temperatures must have re-mained at or above closure temperatures for K-feldspar (between�130 to �160 �C and �250 �C (e.g. Harrison and McDougall,1982; Kendrick et al., 2002) for a significant period, fully ‘re-open-ing’ the crystal structure to diffusion.
However, biotite sample MC-45 – situated less than 20 kmaway (Fig. 1) – experienced only minor argon loss at this time.These observations suggest that temperatures either peaked justbelow that of closure for biotite (�325 �C; e.g. Harrison et al.,1985; McDougall and Harrison, 1999), or exceeded it for only ashort period, causing only minor diffusive loss. The respective clo-sure temperatures of the K-feldspar and biotite 40Ar–39Ar systemsplace the peak temperature of the thermal perturbation asapproaching, or just above �325 �C. Two biotite samples (MC-63and MC-46) clearly experienced peak temperatures sufficient tocause total loss of accumulated argon in the Late Cretaceous. How-ever, in the case of MC-46, these temperatures appear to have beenextremely localised, fully resetting biotite sample MC-46 but onlypartial resetting K-feldspar sample MC-48 just a few kilometresaway. Localised heating during the intrusion of dykes and/or asso-ciated fluid flow may explain this anomaly.
6.3. Cretaceous and Paleogene exhumation
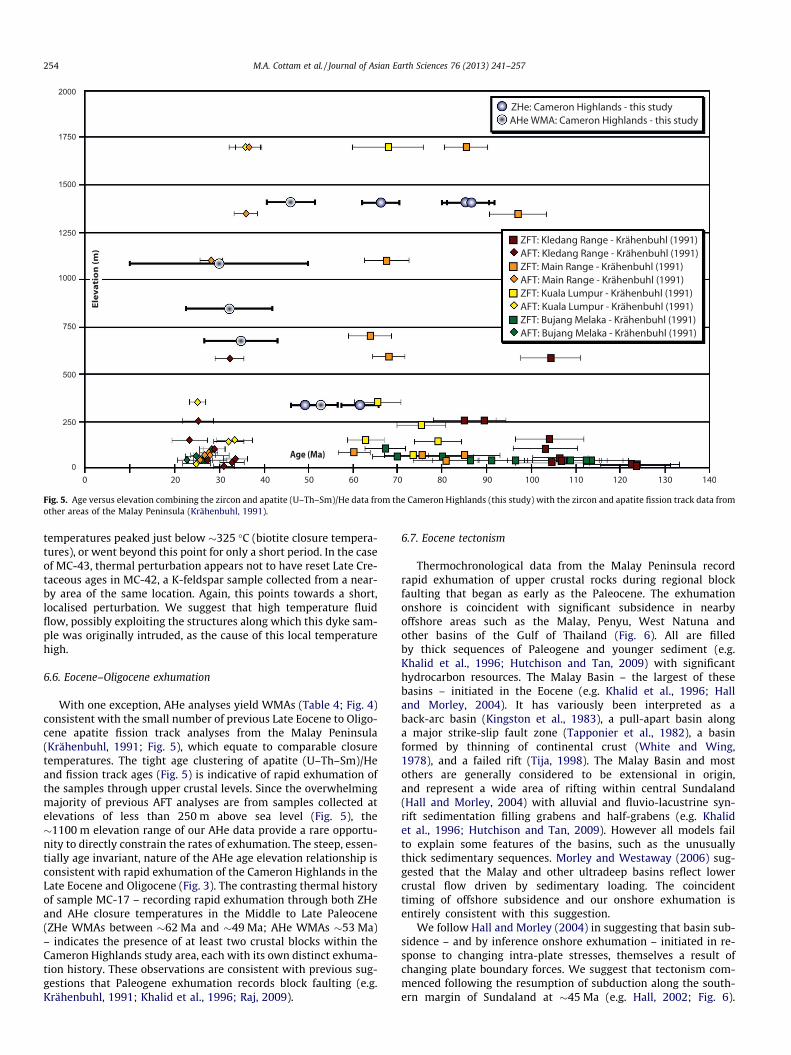
Our new ZHe ages record the exhumation of samples throughcrustal depths equivalent to closure temperatures of �183 �C(e.g. Reiners, 2005) in the Late Cretaceous (MC-5) and Early Paleo-gene (MC-17). Cretaceous ZHe ages are consistent with previouslate Early and Late Cretaceous zircon fission track (ZFT) ages fromthe Malay Peninsula (Krähenbuhl, 1991; Fig. 5), which equate tocomparable closure temperatures of around �205 �C (e.g. Bernet,2009). The broad distribution of zircon thermochronological datain age and elevation space (Fig. 5) is interpreted to record a rela-tively prolonged and poorly defined period of exhumation duringthe Late Cretaceous, rather than a single rapid exhumation event,which would produce a tight clustering of ages and an age invari-ant age-elevation trend. Direct calculation of exhumation rates isprecluded by the indications of multiple fault blocks within thepeninsula, based on both our data set and that of Krähenbuhl(1991). Taken at face value, sample MC-17 records a slightly youn-ger period of exhumation, with overlapping ZHe and AHe agesindicating relative rapid – and apparently localised – exhumationin the early Paleogene. Based on the current data set it is not pos-sible to differentiate whether this exhumation reflects the latterstages of Cretaceous activity or is itself a distinct phase of youngerexhumation.
6.4. Cretaceous and Paleogene tectonism
Variably reset 40Ar/39Ar analyses indicate that the MalayPeninsula experienced a period of significant heating of the crust
between �105 Ma and �87 Ma. Zircon thermochronological data– both ZFT (published) and ZHe (this study) – from across the Ma-lay Peninsula indicate prolonged, exhumation of the mid to uppercrust during the Cretaceous.
We interpret the heating and exhumation of the crust in theLate Cretaceous to result from a single significant event that af-fected the entire peninsula. We follow previous authors (e.g. Halland Morley, 2004; Smyth et al., 2007; Hall, 2009; Clements et al.,2011; Morley, 2012) in suggesting that these phenomena are con-sequences of a major continental collision in the Late Cretaceous,when Australian microcontinental fragment(s) collided with thesouthern margin of Sundaland, terminating long-lived subductionalong the margin (Fig. 6).
Contemporaneous crustal shortening is recorded by deforma-tion at the margins of Sundaland in the Late Cretaceous, but defor-mation did not extend significantly into Sundaland (e.g. Clementset al., 2011 and references therein). We follow Clements et al.(2011) in suggesting that thermal events within Sundaland (i.e.the Malay Peninsula) at this time may reflect a dynamic topo-graphic response (e.g. Gurnis, 1990, 1992, 1993; Lithgow-Bertollo-ni and Gurnis, 1997) to the termination of subduction along theSunda margin (Fig. 6). Subduction of a cold, dense slab along thismargin during the Mesozoic is suggested to have caused viscousmantle flow that drove regional subsidence during the Late Jurassicand Early Cretaceous, creating a dynamic topographic low (e.g. Cle-ments et al., 2011). The cessation of subduction in the Late Creta-ceous would have greatly reduced or removed the forcesmaintaining the dynamic topographic low causing regional upliftand exhumation, with the rising mantle adding significant heatinto the crust. The widespread intrusion of basaltic dykes in theMalay Peninsula during the Late Cretaceous (e.g. Haile et al.,1983; Hutchison and Tan, 2009) may reflect the addition of signif-icant heat into the crust at this time. The Cretaceous deformation,migmatisation and emplacement of granitoids within the StongComplex of northern Peninsular Malaysia (e.g. Hutchison andTan, 2009) may also reflect this period of deformation and heating.The thermal perturbations recorded in our new thermochronolog-ical data provide a direct record of the timing of this event at be-tween �105 Ma and �87 Ma.
It is unclear if the rapid exhumation of sample MC-17 in theearly Paleogene reflects the continuation of this Cretaceous tecto-nism or a distinct phase of younger activity. For example, a grow-ing body of evidence suggests that the Malay Peninsula, Thailandand Indochina were affected by numerous episodic deformationevents during the early Paleogene (Fig. 6), many of which havebeen associated with transpressional tectonics and relatively local-ised exhumation (Searle et al., 2007; Watkinson et al., 2011; Mor-ley, 2012; Palin et al., in press). It is not possible to distinguishbetween continuous (Cretaceous to Paleogene) tectonism or epi-sodic tectonism based on our current data set. However, the ab-sence of Upper Cretaceous and Paleocene rocks throughout theSundaland region indicates that the Cretaceous and Early Cenozoicwas a period of widespread regional uplift (e.g. Krähenbuhl, 1991;Ahrendt et al., 1993; Dunning et al., 1995; Upton, 1999), creating aprofound unconformity across the Malay Peninsula and Indochina(Clements et al., 2011).
6.5. Eocene thermal perturbation
Two of our 40Ar/39Ar analyses record a second period of thermalperturbation in the Eocene: initial gas release from biotite samplesMC-53 and MC-43 suggest thermal perturbations between �51 Maand �43 Ma. In both cases, thermal effects appear to be minor andlocalised, resetting only the outer regions of the biotite crystals(both samples retain ages consistent with their intrusion in thePermo-Triassic). These observations suggest that either Eocene
M.A. Cottam et al. / Journal of Asian Earth Sciences 76 (2013) 241–257 253
temperatures peaked just below �325 �C (biotite closure tempera-tures), or went beyond this point for only a short period. In the caseof MC-43, thermal perturbation appears not to have reset Late Cre-taceous ages in MC-42, a K-feldspar sample collected from a near-by area of the same location. Again, this points towards a short,localised perturbation. We suggest that high temperature fluidflow, possibly exploiting the structures along which this dyke sam-ple was originally intruded, as the cause of this local temperaturehigh.
6.6. Eocene–Oligocene exhumation
With one exception, AHe analyses yield WMAs (Table 4; Fig. 4)consistent with the small number of previous Late Eocene to Oligo-cene apatite fission track analyses from the Malay Peninsula(Krähenbuhl, 1991; Fig. 5), which equate to comparable closuretemperatures. The tight age clustering of apatite (U–Th–Sm)/Heand fission track ages (Fig. 5) is indicative of rapid exhumation ofthe samples through upper crustal levels. Since the overwhelmingmajority of previous AFT analyses are from samples collected atelevations of less than 250 m above sea level (Fig. 5), the�1100 m elevation range of our AHe data provide a rare opportu-nity to directly constrain the rates of exhumation. The steep, essen-tially age invariant, nature of the AHe age elevation relationship isconsistent with rapid exhumation of the Cameron Highlands in theLate Eocene and Oligocene (Fig. 3). The contrasting thermal historyof sample MC-17 – recording rapid exhumation through both ZHeand AHe closure temperatures in the Middle to Late Paleocene(ZHe WMAs between �62 Ma and �49 Ma; AHe WMAs �53 Ma)– indicates the presence of at least two crustal blocks within theCameron Highlands study area, each with its own distinct exhuma-tion history. These observations are consistent with previous sug-gestions that Paleogene exhumation records block faulting (e.g.Krähenbuhl, 1991; Khalid et al., 1996; Raj, 2009).
6.7. Eocene tectonism
Thermochronological data from the Malay Peninsula recordrapid exhumation of upper crustal rocks during regional blockfaulting that began as early as the Paleocene. The exhumationonshore is coincident with significant subsidence in nearbyoffshore areas such as the Malay, Penyu, West Natuna andother basins of the Gulf of Thailand (Fig. 6). All are filledby thick sequences of Paleogene and younger sediment (e.g.Khalid et al., 1996; Hutchison and Tan, 2009) with significanthydrocarbon resources. The Malay Basin – the largest of thesebasins – initiated in the Eocene (e.g. Khalid et al., 1996; Halland Morley, 2004). It has variously been interpreted as aback-arc basin (Kingston et al., 1983), a pull-apart basin alonga major strike-slip fault zone (Tapponier et al., 1982), a basinformed by thinning of continental crust (White and Wing,1978), and a failed rift (Tija, 1998). The Malay Basin and mostothers are generally considered to be extensional in origin,and represent a wide area of rifting within central Sundaland(Hall and Morley, 2004) with alluvial and fluvio-lacustrine syn-rift sedimentation filling grabens and half-grabens (e.g. Khalidet al., 1996; Hutchison and Tan, 2009). However all models failto explain some features of the basins, such as the unusuallythick sedimentary sequences. Morley and Westaway (2006) sug-gested that the Malay and other ultradeep basins reflect lowercrustal flow driven by sedimentary loading. The coincidenttiming of offshore subsidence and our onshore exhumation isentirely consistent with this suggestion.
We follow Hall and Morley (2004) in suggesting that basin sub-sidence – and by inference onshore exhumation – initiated in re-sponse to changing intra-plate stresses, themselves a result ofchanging plate boundary forces. We suggest that tectonism com-menced following the resumption of subduction along the south-ern margin of Sundaland at �45 Ma (e.g. Hall, 2002; Fig. 6).
Fig. 5. Age versus elevation combining the zircon and apatite (U–Th–Sm)/He data from the Cameron Highlands (this study) with the zircon and apatite fission track data fromother areas of the Malay Peninsula (Krähenbuhl, 1991).
254 M.A. Cottam et al. / Journal of Asian Earth Sciences 76 (2013) 241–257

Subduction brought the region into (broadly north–south trending)compression, causing deformation along large-scale northeast–southwest to north–south trending major structures, and drivingextensive block faulting that initiated both basin subsidence andthe onshore exhumation that our thermochronological data record.Complex dynamic topographic models related to subduction (e.g.Lithgow-Bertolloni and Gurnis, 1997; Clements et al., 2011) mayexplain some aspects of the unusual post-rift history of thesebasins.
7. Conclusions
Thermochronological analyses of granitic rocks from the MalayPeninsula constrain the region’s thermal history during the LateMesozoic and Cenozoic. 40Ar–39Ar and ZHe analyses record a sig-nificant period of tectonism in the Cretaceous. 40Ar–39Ar analysessuggest significant – but locally variable – heating of the mid toupper crust in the Late Cretaceous. Fully and partially reset analy-ses date this event at between �100 Ma and �90 Ma. ZHe analyses
Fig. 6. Summary of the Late Cretaceous and Cenozoic tectonics of the Malay Peninsula incorporating the new thermochronological data presented in this study and evidencefrom published studies.
M.A. Cottam et al. / Journal of Asian Earth Sciences 76 (2013) 241–257 255

(Krähenbuhl, 1991; this study) record penecontemporaneousexhumation through mid to upper crustal levels in the late EarlyCretaceous and Early Cenozoic. Tectonism at this time reflects a dy-namic topographic response to the termination of subductionalong the Sunda margin (e.g. Clements et al., 2011), following col-lision of an Australian Microcontinental fragment at the southernmargin of Sundaland (e.g. Hall, 2002; Hall and Morley, 2004;Smyth et al., 2007; Hall, 2009). The cessation of subduction re-versed the existing dynamic topographic low causing regional up-lift and exhumation, the rising mantle adding significant heat intothe crust.
ZHe and AHe ages from sample MC-17 record rapid exhumationin the early Paleogene. However, based on the current data set it isnot possible to differentiate whether this exhumation reflects thelatter stages of the Cretaceous activity or a distinct phase of youn-ger exhumation as recorded throughout the Thai–Malay–Indo-china region by a growing number of studies. Either way, theCretaceous and early Cenozoic was clearly a period of widespreaduplift across this entire region.
40Ar–39Ar, apatite fission track (Krähenbuhl, 1991) and apatite(U–Th–Sm)/He analyses (this study) all record a second period ofsignificant tectonism in the Eocene. Two 40Ar/39Ar analyses recordminor, localised thermal perturbation in the Eocene. Tightly clus-tered (U–Th–Sm)/He and fission track ages, and the age invariantnature of our AHe age elevation relationship are consistent with ra-pid exhumation in the Late Eocene and Oligocene, coincident withsignificant subsidence in nearby offshore areas. Exhumation andsubsidence occurred along large-scale north-east – south-west tonorth–south trending major structures, which initiated in responseto north–south compression driven by the resumption of subduc-tion along the southern margin of Sundaland at �45 Ma (e.g. Hall,2002).
Acknowledgements
The industrial companies of the SE Asia Research Group Consor-tium provided financial support for our work. We thank the Eco-nomic Planning Unit (EPU) of the Prime Minister’s Departmentfor permission to work and sample in the Malay Peninsula. The lateCharles Hutchison provided helpful discussions over many years.
References
Acharyya, S.K., 1998. Break-up of the greater Indo-Australian continent andaccretion of blocks framing South and East Asia. Journal of Geodynamics 26,149–170.
Ahrendt, H., Chonglakmani, C., Hansen, B.T., Helmcke, D., 1993. Geochronologicalcross-section through northern Thailand. Journal of Southeast Asian EarthSciences 8, 207–217.
Barber, A.J., Crow, M.J., 2009. Structure of Sumatra and its implications for thetectonic assembly of Southeast Asia and the destruction of Paleotethys. IslandArc 18, 3–20.
Batt, G.E., Baldwin, S.L., Cottam, M.A., Fitzgerald, P.G., Brandon, M.T., Spell, T.L.,2004. Cenozoic plate boundary evolution in South Island of New Zealand: newthermochronological constraints. Tectonics 23, TC4001. http://dx.doi.org/10.1029/2003TC001527.
Bernet, M., 2009. A field-based estimate of the zircon fission-track closuretemperature. Chemical Geology 259, 181–189.
Bignell, J.D., 1972. The Geochronology of Malayan Granites. Ph.D. Thesis, OxfordUniversity.
Bignell, J.D., Snelling, N.J., 1977. Geochronology of Malayan granites. OverseasGeology and Mineral Resources, 47. Institute of Geological Sciences, H.M.Stationary Office, London, 72pp.
Burrett, C.F., Long, J.A., Stait, B.A., 1990. Early-Middle Paleozoic biogeography ofAsian Terranes derived from Gondwana. Memoirs of the Geological Society 12,163–174.
Clark, M.K., House, M.A., Royden, L.H., Whipple, K.X., Burchfiel, B.C., Zhang, X., Tang,W., 2005. Late Cenozoic uplift of the southeastern Tibet. Geology 33, 525–528.
Clements, B., Burgess, P.M., Hall, R., Cottam, M.A., 2011. Subsidence and uplift byslab-related mantle dynamics, a driving mechanism for the Cretaceous andCenozoic evolution of continental SE Asia? In: Hall, R., Cottam, M.A., Wilson,M.E.J. (Eds.), The SE Asian Gateway: History and Tectonics of the Australia–AsiaCollision, vol. 355. Geological Society London Special Publications, pp. 37–51.
Cobbing, E.J., Mallick, D.I.J., Pitfiled, P.E.J., Teoh, L.H., 1986. The granites of theSoutheast Asian Tin Belt. Journal of the Geological Society, London 143, 537–550.
Dodson, M.H., 1973. Closure temperature in cooling geochronological andpetrological systems. Contributions to Mineralogy and Petrology 40, 259–274.
Dodson, M.H., 1976. Kinetic processes and thermal history of slowly cooling solids.Nature 259, 551–553.
Dunning, G.R., Macdonald, A.S., Barr, S.M., 1995. Zircon and monazite U–Pb dating ofthe Doi Inthanon core complex, northern Thailand: implications for extensionwithin the Indosinian orogen. Tectonophysics 251, 197–215.
Ehlers, T.A., Farley, K.A., 2003. Apatite (U–Th–Sm)/He thermochronometry:methods and applications to problems in tectonic and surface processes.Earth and Planetary Science Letters 206, 1–14.
Farley, K.A., 2002. (U–Th–Sm)/He dating: techniques, calibrations, and applications.Noble Gases in Geochemistry and Cosmochemistry 47, 819–844.
Farley, K.A., Wolf, R.A., Silver, L.T., 1996. The effects of long alpha-stopping distanceson (U–Th–Sm)/He ages. Geochimica et Cosmochimica Acta 60, 4223–4229.
Fitzgerald, P.G., Baldwin, S.L., Webb, L.E., O’Sullivan, P.B., 2006. Interpretation of (U–Th–Sm)/He single grain ages from slowly cooled crustal terranes: a case studyfrom the Transantarctic Mountains of southern Victoria Land. Chemical Geology225, 91–120.
Ghani, M.A.W.A., Ghani, A.A., 2003a. Petrology of granitic rocks along new Pos Selimto Kampung Raja highway (km 0 to km 22): identification of different graniticbodies, its field and petrographic characteristics. Geological Society of Malaysia46, 35–40.
Ghani, M.A.W.A., Ghani, A.A., 2003b. Granitic rocks from Pos Selim-Kampung Rajanew road: petrochemistry of the Selim granite (a preliminary study). GeologicalSociety of Malaysia 46, 377–381.
Gleadow, A.J.W., Belton, D.X., Kohn, B.P., Brown, R.W., 2002. Fission track dating ofphosphate minerals and the thermochronology of apatite. Reviews inMineralogy and Geochemistry 48, 579–630.
Glorie, S., De Grave, J., Buslov, M.M., Elburg, M.A., Stockli, D.F., Gerdes, A., Van denHaute, P., 2010. Multi-method chronometric constraints on the evolution of theNorthern Kyrgyz Tien Shan granitoids (Central Asian Orogenic Belt): fromemplacement to exhumation. Journal of Asian Earth Sciences 38, 131–146.
Gurnis, M., 1990. Ridge spreading, subduction, and sea level fluctuations. Science250, 970–972.
Gurnis, M., 1992. Rapid continental subsidence following the initiation andevolution of subduction. Science 255, 1556–1558.
Gurnis, M., 1993. Phanerozoic marine inundation of continents driven by dynamictopography above subducting slabs. Nature 364, 589–593.
Haile, N.S., Beckinsale, R.D., Chakraborty, K.R., Abdul, H.H., Hardjono, T., 1983.Paleomagnetism, geochronology and petrology of dolerite dykes and basalticlavas from Kuantan, West Malaysia. Bulletin of the Geological Society ofMalaysia 16, 71–85.
Hall, R., 2002. Cenozoic geological and plate tectonic evolution of SE Asia and theSW Pacific: computer-based reconstructions, model and animations. Journal ofAsian Earth Sciences 20, 353–434.
Hall, R., 2009. Hydrocarbon basins in SE Asia: understanding why they are there.Petroleum Geosciences 15, 131–146.
Hall, R., Morley, C.K., 2004. Sundaland Basins. In: Clift, P., Wang, P., Kuhnt, W.,Hayes, D.E. (Eds.), Continent-Ocean Interactions within the East Asian MarginalSeas, vol. 149. AGU Geophysical Monograph, Washington, DC, pp. 55–85.
Harrison, T.M., McDougall, I., 1982. The thermal significance of potassium feldsparK–Ar ages inferred from 40Ar/39Ar age spectrum results. Geochimica etCosmochimica Acta 46, 1811–1820.
Harrison, T.M., Duncan, I., McDougall, I., 1985. Diffusion of 40Ar in biotite:temperature, pressure and compositional effects. Geochimica etCosmochimica Acta 49, 2461–2468.
House, M., Farley, K.A., Stockli, D., 2000. Helium chronometry of apatite and titaniteusing Nd-YAG laser heating. Earth and Planetary Science Letters 183, 365–368.
House, M.A., Wernicke, B.P., Farley, K.A., 2001. Paleo-geomorphology of the SierraNevada, California, from (U–Th–Sm)/He ages in apatite. American Journal ofScience 301, 77–102.
Hutchison, C.S., 1975. Ophiolite in Southeast Asia. Geological Society of AmericaBulletin 86, 797–806.
Hutchison, C.S., Tan, D.N.K., 2009. Geology of Peninsular Malaysia. GeologicalSociety of Malaysia and The Universiti of Malaya, p. 479.
Hutchison, C.S., Taylor, D., 1978. Metallogenesis in S.E. Asia. Journal of theGeological Society, London 135, 407–428.
Kendrick, M.A., Burgess, R., Leach, D., Pattrick, R.A.D., 2002. Hydrothermal fluidorigins in Mississippi Valley-type ore districts: combined noble gas (He, Ar, Kr)and Halogen (Cl, Br, I) analysis of fluid inclusions from the Illinois-KentuckyFluorspar District, Viburnum Trend, and Tri-State Districts, MidcontinentUnited States. Economic Geology 97, 453–469.
Khalid, N., Mazlan, M., Tika, H.D., 1996. Role of pre-Tertiaty fractures in formationand development of the Malay and Penyu Basins. In: Hall, R., Blundell, D. (Eds.),Tectonic Evolution of Southeast Asia, vol. 355. Geological Society LondonSpecial Publications, pp. 37–51.
Kingston, D.R., Dishroon, C.P., Williams, P.A., 1983. Global basin classificationsystem. American Association of Petroleum Geologists Bulletin 67, 2175–2193.
Kirstein, L.A., Sinclair, H., Stuart, F.M., Dobson, K., 2006. Rapid early Mioceneexhumation of the Ladakh batholith, western Himalaya. Geology 34, 1049–1052.
Krähenbuhl, R., 1991. Magmatism, tin mineralization and tectonics of the MainRange, Malaysian Peninsula: consequences for the plate tectonic model of
256 M.A. Cottam et al. / Journal of Asian Earth Sciences 76 (2013) 241–257
Southeast Asia based on R–Sr, K–Ar and fission track data. Bulletin of theGeological Society of Malaysia 29, 1–100.
Lithgow-Bertolloni, C., Gurnis, M., 1997. Cenozoic subsidence and uplift ofcontinents from time varying dynamic topography. Geology 25, 735–738.
Lovera, O.M., Grove, M., Harrison, T.M., 2002. Systematic analysis of K-feldspar40Ar/39Ar step heating results II: relevance of laboratory argon diffusionproperties to nature. Geochimica et Cosmochimica Acta 66, 1237–1255.
Ludwig, K.R., 2001. Using Isoplot/EX, v2.49, A Geochronological Toolkit forMicrosoft Excel. Berkeley Geochronological Center Special Publication.
Matchan, E., Phillips, D., 2011. New 40Ar/39Ar ages for selected young (<1 Ma) basaltflows of the Newer Volcanic Province, southeastern Australia. QuaternaryGeochronology 6, 356–368.
McDougall, I., Harrison, T.M., 1999. Geochronology and Thermochronology by the40Ar/39Ar method. Oxford University Press, New York.
McDowell, F.W., McIntosh, W.C., Farley, K.A., 2005. A precise 40Ar/39Ar reference agefor the Durango apatite (U–Th–Sm)/He and fission track dating standard.Chemical Geology 214, 249–263.
Metcalf, J.R., Fitzgerald, P.G., Baldwin, S.L., Munoz, J.-A., 2009. Thermochronology ofa convergent orogen: constraints on the timing of thrust faulting andsubsequent exhumation of the Maladeta Pluton in the Central Pyrenean AxialZone. Earth and Planetary Science Letters 287, 488–503.
Metcalfe, I., 1988. Origin and assembly of South-East Asian continental terranes. In:Audley-Charles, M.G., Hallam, A. (Eds.), Gondwana and Tethys, vol. 37.Geological Society of London Special Publication, pp. 101–118.
Metcalfe, I., 2000. The Bentong–Raub Suture Zone. Journal of Asian Earth Sciences18, 691–712.
Metcalfe, I., 2013. Gondwana dispersion and Asian accretion: tectonic andpalaeogeographic evolution of eastern Tethys. Journal of Asian Earth Sciences66, 1–33.
Morley, C.K., 2012. Late Cretaceous–Early Palaeogene tectonic development of SEAsia. Earth Science Reviews 115, 37–75.
Morley, C.K., Westaway, R., 2006. Subsidence in the super-deep Pattani and Malaybasins of Southeast Asia: a coupled model incorporating lower-crustal flow inresponse to post-rift sediment loading. Basin Research 18, 51–84.
Nier, A.O., 1950. A redetermination of the relative abundances of the isotopes ofcarbon, nitrogen, oxygen, argon, and potassium. Physics Review 77, 789–793.
Palin, R.M., Searle, M.P., Morley, C.K., Charusin, P., Horstwood, M.S.A., Roberts,N.M.W., in press. Timing of metamorphism of the Lansang gneiss andimplications for left-lateral motion along the Mae Ping (Wang Chao) strike-slip fault, Thailand. Journal of Asian Earth Sciences.
Raj, J.K. 2009. Geomorphology. In Hutchison, C.S., Tan, D.N.K., 2009. Geology ofPeninsular Malaysia. Geological Society of Malaysia and The Universiti ofMalaya, pp. 5–29.
Reiners, P.W., 2005. Past, present, and future of thermochronology. In Reiners, P.W.,Ehlers, T.A. (Eds.), Reviews in Mineralogy and Geochemistry 58, 151–179.
Reiners, P.W., Brandon, M.T., 2006. Using thermochronology to understand orogenicerosion. Annual Review of Earth and Planetary Sciences 34, 419–466.
Reiners, P.W., Zhou, Z., Ehlers, T.A., Xu, C., Brandon, M.T., Donelick, R.A., Nicolescu, S.,2003. Post-orogenic evolution of the Dabie Shan, eastern China, from (U–Th–Sm)/He and fission-track thermochronology. American Journal of Science 303,489–518.
Renne, P.R., Swisher, C.C., Deino, A.L., Karner, D.B., Owens, T.L., DePaolo, D.J., 1998.Intercalibration of standards, absolute ages and uncertainties in 40Ar/39Ardating. Chemical Geology 145, 117–152.
Richter, B., Schmidtke, E., Fuller, M., Harbury, N., Samsudin, A.R., 1999.Paleomagnetism of Peninsular Malaysia. Journal of Asian Earth Sciences 17,477–519.
Schwartz, M.O., Rajah, S.S., Askury, A.K., Putthapiban, P., Djaswadi, S., 1995. TheSoutheast Asian Tin Belt. Earth Science Reviews 38, 95–293.
Searle, M.P., Noble, S.R., Cottle, J.M., Waters, D.J., Mitchell, A.H.G., Hlaing, T.,Horstwood, M.S.A., 2007. Tectonic evolution of the Mogok Metamorphic Belt,Myanmar (Burma), constrained by U–Th–Pb dating of metamorphic andmagmatic rocks. Tectonics 26, TC3014, doi: http://dx.doi.org/10.1029/2006TC002083.
Searle, M.P., Whitehouse, M.J., Robb, L.J., Ghani, A.A., Hutchison, C.S., Sone, M., Ng,S.W.-P., Roselee, M.H., Chung, S.-L., Oliver, G.J.H., 2012. Tectonic evolution of theSibumasu–Indochina terrane collision zone in Thailand and Malaysia:constraints from new U-Pb zircon chronology of SE Asian tin granitoids.Journal of the Geological Society, London 169, 89–500.
Smyth, H.R., Hamilton, P.J., Hall, R., Kinny, P.D., 2007. The deep crust beneath islandarcs: inherited zircons reveal a Gondwana continental fragment beneath EastJava. Earth and Planetary Science Letters 258, 269–282.
Snelling, N.J., 1965. Summary of the results from Malaysia. Overseas GeologicalSurvey London, Annual Report for 1964, 32–33.
Sone, M., Metcalfe, I., 2008. Parallel Tethyan sutures in mainland Southeast Asia:new insights for Palaeo-Tethys closure and implications for the Indosinianorogeny. Comptes Rendus Geosciences 340, 166–179.
Spotila, J.A., Niemi, N., Brady, R., House, M., Buscher, J., Oskin, M., 2007. Long-termcontinental deformation associated with transpressive plate motion: the SanAndreas fault. Geology 35, 967–970.
Steiger, R.H., Jäger, E., 1977. Subcommission on geochronology – convention on useof decay constants in geochronology and cosmochronology. Earth and PlanetaryScience Letters 36, 359–362.
Tapponier, P., Peltzer, G., Le Dain, A.Y., Armijo, R., Cobbold, P., 1982. Propagatingextrusion tectonics in Asia, new insights from simple experiments withplasticine. Geology 10, 611–616.
Tija, H.D., 1998. Origin and tectonic development of the Malay–Penyu–West Natunabasins of Sundaland. Bulletin of the Geological Society of Malaysia 42, 147–160.
Upton, D.A., 1999. Regional Fission track Study of Thailand: Implications forThermal History and Denudation. PhD Thesis, University of London, 500pp.
Watkinson, I., Elders, C., Batt, G., Jourdan, F., Hall, R., McNaughton, N.J., 2011. Thetiming of strike–slip shear along the Ranong and Khlong Marui faults, Thailand.Journal of Geophysical Research 116, B09403. http://dx.doi.org/10.1029/2011JB008379.
White, J.M.J., Wing, R.S., 1978. Structural development of the South China Sea withparticular reference to Indonesia. In: Indonesian Petroleum Association,Proceedings 7th Annual Convention, Jakarta, pp. 159–178.
Zeitler, P.K., Tahirkheli, R.A.K., Naeser, C.W., Johnson, N.M., 1982. Unroofing historyof a suture zone in the Himalaya of Pakistan by means of fission-track annealingages. Earth and Planetary Science Letters 57, 227–240.
M.A. Cottam et al. / Journal of Asian Earth Sciences 76 (2013) 241–257 257