Journal of Applicable ChemistryS. Srinivasa Rao et al Journal of Applicable Chemistry, 2013, 2...
7
96 Available online at www.joac.info ISSN: 2278-1862 Journal of Applicable Chemistry 2013, 2 (1): 96-102 (International Peer Reviewed Journal) Effect of Quality Parameters of Krishna River Water, Krishna District, Andhra Pradesh, India, on Corrosion Behaviour of Some Commercially Important Metals S. Srinivasa Rao *1 , A. Ratnakar 1 , A. Venu Gopala Krishna 2 , Ch. Kavitha 1 & M. Sri Lakshmi 1 1. Department of Chemistry, V. R. Siddhartha Engineering College (Autonomous), Vijayawada, Andhra Pradesh. 2. Department of Chemistry, Dhanekula Institute of Engineering & Technology, Vijayawada, Andhra Pradesh. Email: [email protected] Received on 13 th December and finalized on 28 th December 2012 __________________________________________________________________________ ABSTRACT Various water quality parameters of Krishna river water in Andhra Pradesh, India, were determined by using different analytical methods and the results were correlated to evaluate the corrosion rates of commercially important metals like carbon steel, copper and aluminium in the river water samples. The study was performed for the river water collected at seven different sites along the river. The analyzed parameters are chlorides, dissolved oxygen, conductivity, pH, total dissolved solids, total suspended solids, alkalinity and hardness. The trends of these physical and chemical parameters are analyzed. An attempt is made to evaluate corrosion rates of the metals, determined by gravimetric measurements, in terms of variations in the physical and chemical parameters. Keywords: Corrosion rate, Gravimetric studies, Water quality parameters, Krishna River and Commercially important metals ____________________________________________________________________________ INTRODUCTION Application of various commercially important metals and alloys in engineering and construction fields is mainly due to their better physical, mechanical and electrical properties. But, they have a major drawback of susceptibility to corrosion in environments in which they are expected to work. Metallic objects and structures in contact with natural waters can easily undergo corrosion due to presence of aggressive chemical species like chlorides in natural waters. Water quality parameters strongly influence rate of corrosion of metals. Hence, it is essential to determine water quality parameters in predicting the rate of corrosion of a particular metal in specific aqueous environment. These parameters include particularly pH, dissolved oxygen, conductivity, alkalinity, chlorides, total dissolved solids, etc. When rivers flow from one place to the other, they carry all types of impurities both suspended and dissolved, and hence the quality parameters of river water differ from place to place. In general, it is expected that the quantity of dissolved salts increases in water collected at different places along the river in the flow direction. Consequently, other quality parameters like conductivity, chlorides, hardness, etc. also follow the same trend. When river water comes in contact with metallic structures like underground pipelines, motors, metallic objects used in agricultural fields, industrial cooling water systems, heat exchangers, etc., they undergo corrosion and
Transcript of Journal of Applicable ChemistryS. Srinivasa Rao et al Journal of Applicable Chemistry, 2013, 2...
96
Available online at www.joac.info
ISSN: 2278-1862
Journal of Applicable Chemistry 2013, 2 (1): 96-102
(International Peer Reviewed Journal)
Effect of Quality Parameters of Krishna River Water, Krishna District,
Andhra Pradesh, India, on Corrosion Behaviour of Some Commercially
Important Metals
S. Srinivasa Rao*1
, A. Ratnakar1, A. Venu Gopala Krishna
2, Ch. Kavitha
1 &
M. Sri Lakshmi1
1. Department of Chemistry, V. R. Siddhartha Engineering College (Autonomous), Vijayawada, Andhra Pradesh.
2. Department of Chemistry, Dhanekula Institute of Engineering & Technology, Vijayawada, Andhra Pradesh.
Email: [email protected]
Received on 13th December and finalized on 28th December 2012
__________________________________________________________________________
ABSTRACT
Various water quality parameters of Krishna river water in Andhra Pradesh, India, were determined by
using different analytical methods and the results were correlated to evaluate the corrosion rates of
commercially important metals like carbon steel, copper and aluminium in the river water samples. The study was performed for the river water collected at seven different sites along the river. The analyzed
parameters are chlorides, dissolved oxygen, conductivity, pH, total dissolved solids, total suspended
solids, alkalinity and hardness. The trends of these physical and chemical parameters are analyzed. An
attempt is made to evaluate corrosion rates of the metals, determined by gravimetric measurements, in terms of variations in the physical and chemical parameters.
Keywords: Corrosion rate, Gravimetric studies, Water quality parameters, Krishna River and
Commercially important metals
____________________________________________________________________________
INTRODUCTION
Application of various commercially important metals and alloys in engineering and construction fields is
mainly due to their better physical, mechanical and electrical properties. But, they have a major drawback
of susceptibility to corrosion in environments in which they are expected to work. Metallic objects and structures in contact with natural waters can easily undergo corrosion due to presence of aggressive
chemical species like chlorides in natural waters. Water quality parameters strongly influence rate of
corrosion of metals. Hence, it is essential to determine water quality parameters in predicting the rate of
corrosion of a particular metal in specific aqueous environment. These parameters include particularly pH, dissolved oxygen, conductivity, alkalinity, chlorides, total dissolved solids, etc. When rivers flow from one
place to the other, they carry all types of impurities both suspended and dissolved, and hence the quality
parameters of river water differ from place to place. In general, it is expected that the quantity of dissolved salts increases in water collected at different places along the river in the flow direction. Consequently,
other quality parameters like conductivity, chlorides, hardness, etc. also follow the same trend. When river
water comes in contact with metallic structures like underground pipelines, motors, metallic objects used in agricultural fields, industrial cooling water systems, heat exchangers, etc., they undergo corrosion and
S. Srinivasa Rao et al Journal of Applicable Chemistry, 2013, 2 (1):96-102
97
www. joac.info
the rate of corrosion depends on water quality parameters. A few studies on corrosion behavior of metals in contact with natural waters are reported in literature [1-3].
Krishna (Krishnaveni) river is the third longest and famous river in India that flows in central-southern
India. It originates at Mahabaleswar near the Jor village in the extreme north of Wai Taluka, Satara district, Maharashtra state in the west and meets the Bay of Bengal at Hamsaladeevi near Avanigadda in Andhra
Pradesh on the east coast. It flows through Karnataka state before entering Andhra Pradesh. It covers a
total distance of about 1400 km in the three states. The main objective of the present study is to determine
water quality parameters of Krishna river at different sites, to determine corrosion rates of carbon steel, aluminium and copper in the collected samples and to correlate the corrosion rates with the results of water
quality parameters.
MATERIALS AND METHODS
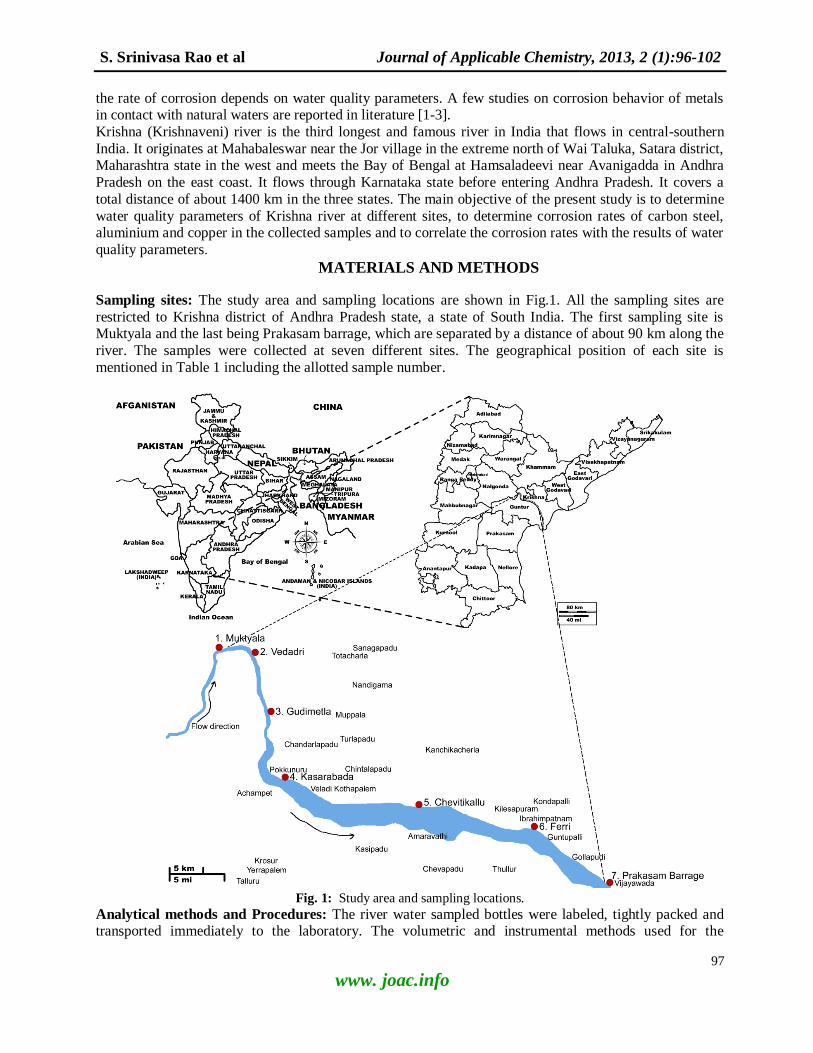
Sampling sites: The study area and sampling locations are shown in Fig.1. All the sampling sites are
restricted to Krishna district of Andhra Pradesh state, a state of South India. The first sampling site is Muktyala and the last being Prakasam barrage, which are separated by a distance of about 90 km along the
river. The samples were collected at seven different sites. The geographical position of each site is
mentioned in Table 1 including the allotted sample number.
Fig. 1: Study area and sampling locations.
Analytical methods and Procedures: The river water sampled bottles were labeled, tightly packed and transported immediately to the laboratory. The volumetric and instrumental methods used for the
S. Srinivasa Rao et al Journal of Applicable Chemistry, 2013, 2 (1):96-102
98
www. joac.info
determination of various water quality parameters are given in Table 2. The detailed procedures of these methods are not included here as they are very basic and well-known to the researchers in chemistry,
particularly in this field. The parameters, viz., pH and conductivity of all the samples were measured using
pH meter and conductometer respectively, immediately after collection of the samples at the sites. Total hardness, calcium hardness, dissolved oxygen, chlorides and alkalinity due to individual ions, viz.,
carbonate, bicarbonate and hydroxide ions were determined by conventional volumetric method. Total
suspended solids and total dissolved solids were determined by gravimetric method. Total hardness,
calcium hardness and alkalinity are expressed in terms of milligrams of CaCO3. Table 1: Names of the sampling sites, locations and the corresponding sample numbers.
Sampling site Location Sample
number
Muktyala Temple Mukteswarapuram, Jaggaiahpet Mandal, Andhra Pradesh (16°49'10" N
80°04'08" E)
1
Vedadri Temple Vedadri, Jaggaiahpet Mandal, Andhra Pradesh
(16°48'52" N 80°07'24" E)
2
Gudimetla Chandarlapadu Mandal, Andhra Pradesh
(16°45'45" N 80°08'11" E)
3
Kasarabada Near Pokkunuru, Chandarlapadu Mandal, Andhra Pradesh (16°39'08" N
80°09'31" E)
4
Chevitikallu Kanchikacherla Mandal, Andhra Pradesh
(16°36'42" N 80°21'34" E)
5
Ferri Ibrahimpatnam Mandal, Andhra Pradesh
(16°34'47" N 80°30'52" E)
6
Prakasam Barrage Vijayawada, Andhra Pradesh
(16°30'43" N 80°36'16" E)
7
For studies on corrosion, the specimens taken from single sheets of carbon steel, aluminium and copper
were used. Prior to the tests, the specimens of carbon steel and copper were polished to mirror finish with
1/0, 2/0, 3/0 and 4/0 emery polishing papers respectively, washed with distilled water, degreased with
acetone and dried. The polished specimens of the dimensions, 3.5 x 1.5 x 0.2 cm, were used. In all the gravimetric experiments, the polished specimens were weighed and immersed in duplicate, in 100 mL
water samples for a period of seven days. Then the specimens were reweighed after washing, degreasing
and drying. Accuracy in weighing up to 0.01 mg and in surface area measured up to 0.1 cm2, as
recommended by ASTM G31, was followed [4]. The immersion period of seven days was fixed in view of
the considerable magnitude of the corrosion rate obtained after this immersion period. The immersion
period was maintained accurately up to 0.1 h in view of the lengthy immersion time of 168 h. Under these conditions of accuracy, the relative standard error in corrosion rate determinations is of the order of 2 % or
less for an immersion time of 168 h [5]. Table 2: Volumetric and instrumental methods used for chemical analysis of river water in Krishna district,
Andhra Pradesh, India.
Chemical parameter Unit Method/Instrument
pH – pH meter (Elico Limited)
Electrolytic conductivity (EC) μS/cm Conductometer (Elico Limited)
Total hardness (TH) mg/L Volumetric method (EDTA method)
Calcium hardness (CaH) mg/L Volumetric method (EDTA method)
Carbonate alkalinity (CA) mg/L Volumetric method (Neutralization titration)
Bicarbonate alkalinity (BA) mg/L Volumetric method (Neutralization titration)
Chlorides (Cl–) mg/L Volumetric method (Argentometric titration)
Dissolved oxygen (DO) mg/L Volumetric method (Winkler’s method)
Total suspended solids (TSS) mg/L Gravimetric method
Total dissolved solids (TDS) mg/L Gravimetric method
S. Srinivasa Rao et al Journal of Applicable Chemistry, 2013, 2 (1):96-102
99
www. joac.info
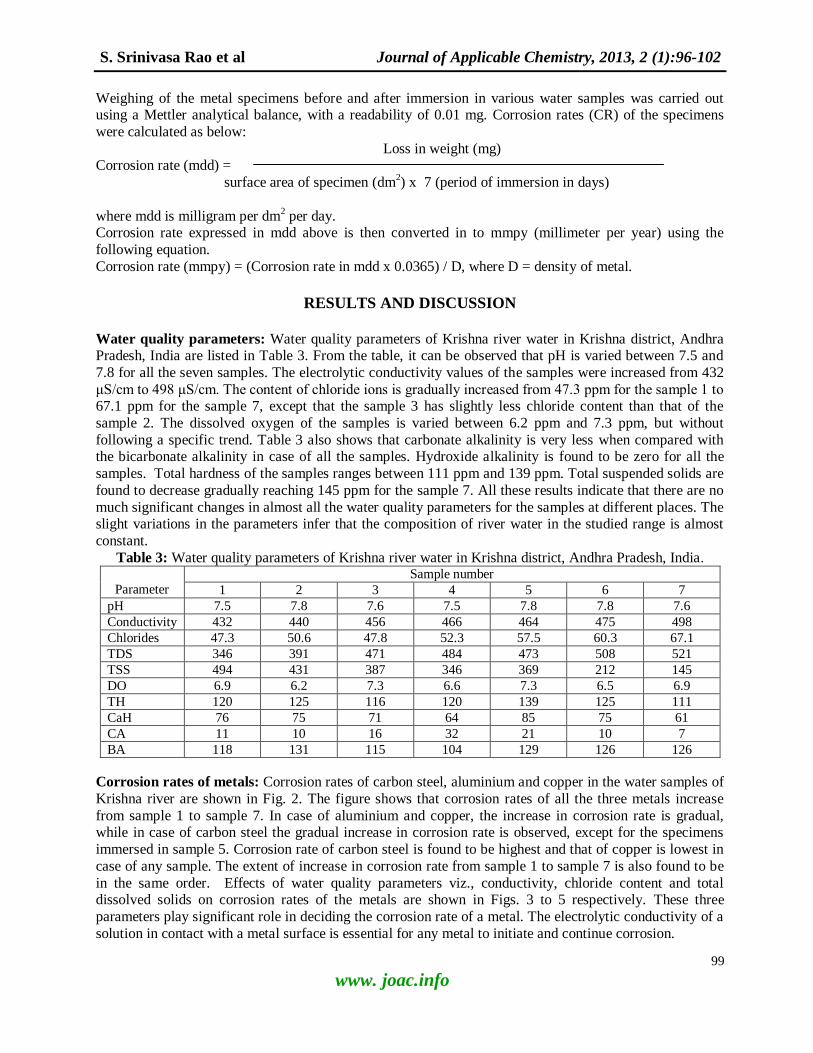
Weighing of the metal specimens before and after immersion in various water samples was carried out using a Mettler analytical balance, with a readability of 0.01 mg. Corrosion rates (CR) of the specimens
were calculated as below:
Loss in weight (mg) Corrosion rate (mdd) =
surface area of specimen (dm2) x 7 (period of immersion in days)
where mdd is milligram per dm2 per day.
Corrosion rate expressed in mdd above is then converted in to mmpy (millimeter per year) using the
following equation.
Corrosion rate (mmpy) = (Corrosion rate in mdd x 0.0365) / D, where D = density of metal.
RESULTS AND DISCUSSION
Water quality parameters: Water quality parameters of Krishna river water in Krishna district, Andhra Pradesh, India are listed in Table 3. From the table, it can be observed that pH is varied between 7.5 and
7.8 for all the seven samples. The electrolytic conductivity values of the samples were increased from 432
μS/cm to 498 μS/cm. The content of chloride ions is gradually increased from 47.3 ppm for the sample 1 to 67.1 ppm for the sample 7, except that the sample 3 has slightly less chloride content than that of the
sample 2. The dissolved oxygen of the samples is varied between 6.2 ppm and 7.3 ppm, but without
following a specific trend. Table 3 also shows that carbonate alkalinity is very less when compared with the bicarbonate alkalinity in case of all the samples. Hydroxide alkalinity is found to be zero for all the
samples. Total hardness of the samples ranges between 111 ppm and 139 ppm. Total suspended solids are
found to decrease gradually reaching 145 ppm for the sample 7. All these results indicate that there are no
much significant changes in almost all the water quality parameters for the samples at different places. The slight variations in the parameters infer that the composition of river water in the studied range is almost
constant.
Table 3: Water quality parameters of Krishna river water in Krishna district, Andhra Pradesh, India.
Parameter
Sample number
1 2 3 4 5 6 7
pH 7.5 7.8 7.6 7.5 7.8 7.8 7.6
Conductivity 432 440 456 466 464 475 498
Chlorides 47.3 50.6 47.8 52.3 57.5 60.3 67.1
TDS 346 391 471 484 473 508 521
TSS 494 431 387 346 369 212 145
DO 6.9 6.2 7.3 6.6 7.3 6.5 6.9
TH 120 125 116 120 139 125 111
CaH 76 75 71 64 85 75 61
CA 11 10 16 32 21 10 7
BA 118 131 115 104 129 126 126
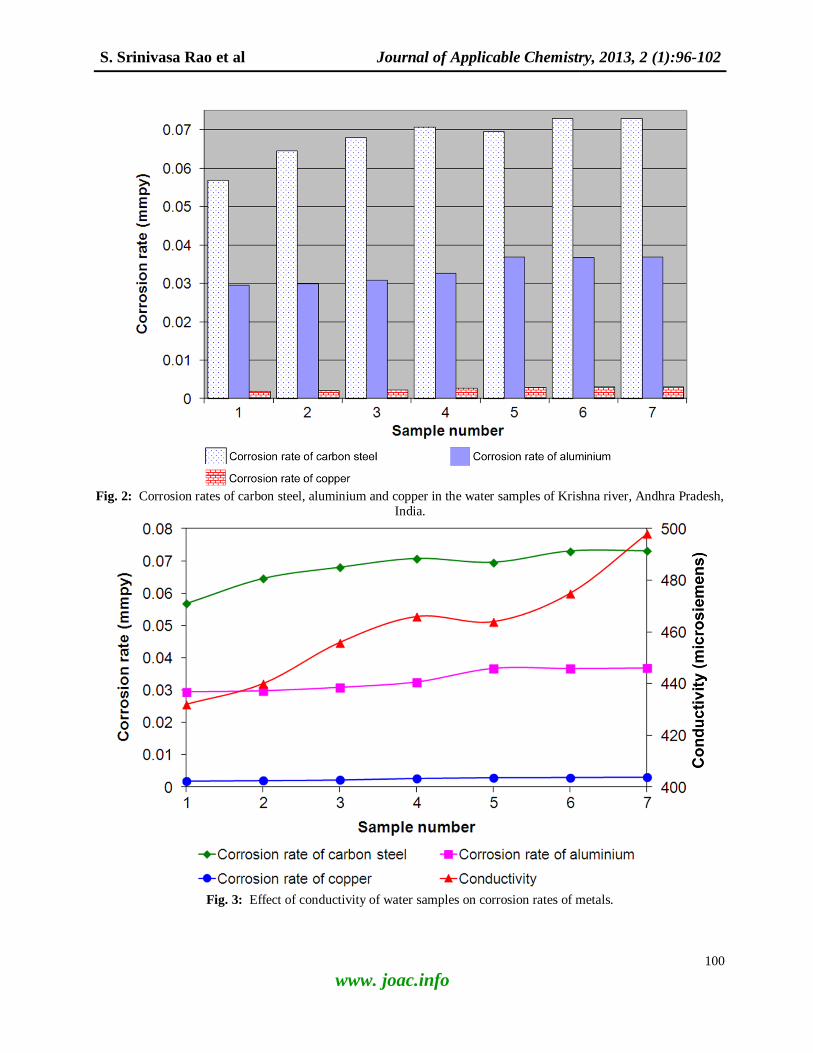
Corrosion rates of metals: Corrosion rates of carbon steel, aluminium and copper in the water samples of
Krishna river are shown in Fig. 2. The figure shows that corrosion rates of all the three metals increase
from sample 1 to sample 7. In case of aluminium and copper, the increase in corrosion rate is gradual, while in case of carbon steel the gradual increase in corrosion rate is observed, except for the specimens
immersed in sample 5. Corrosion rate of carbon steel is found to be highest and that of copper is lowest in
case of any sample. The extent of increase in corrosion rate from sample 1 to sample 7 is also found to be
in the same order. Effects of water quality parameters viz., conductivity, chloride content and total dissolved solids on corrosion rates of the metals are shown in Figs. 3 to 5 respectively. These three
parameters play significant role in deciding the corrosion rate of a metal. The electrolytic conductivity of a
solution in contact with a metal surface is essential for any metal to initiate and continue corrosion.
S. Srinivasa Rao et al Journal of Applicable Chemistry, 2013, 2 (1):96-102
100
www. joac.info
Fig. 2: Corrosion rates of carbon steel, aluminium and copper in the water samples of Krishna river, Andhra Pradesh,
India.
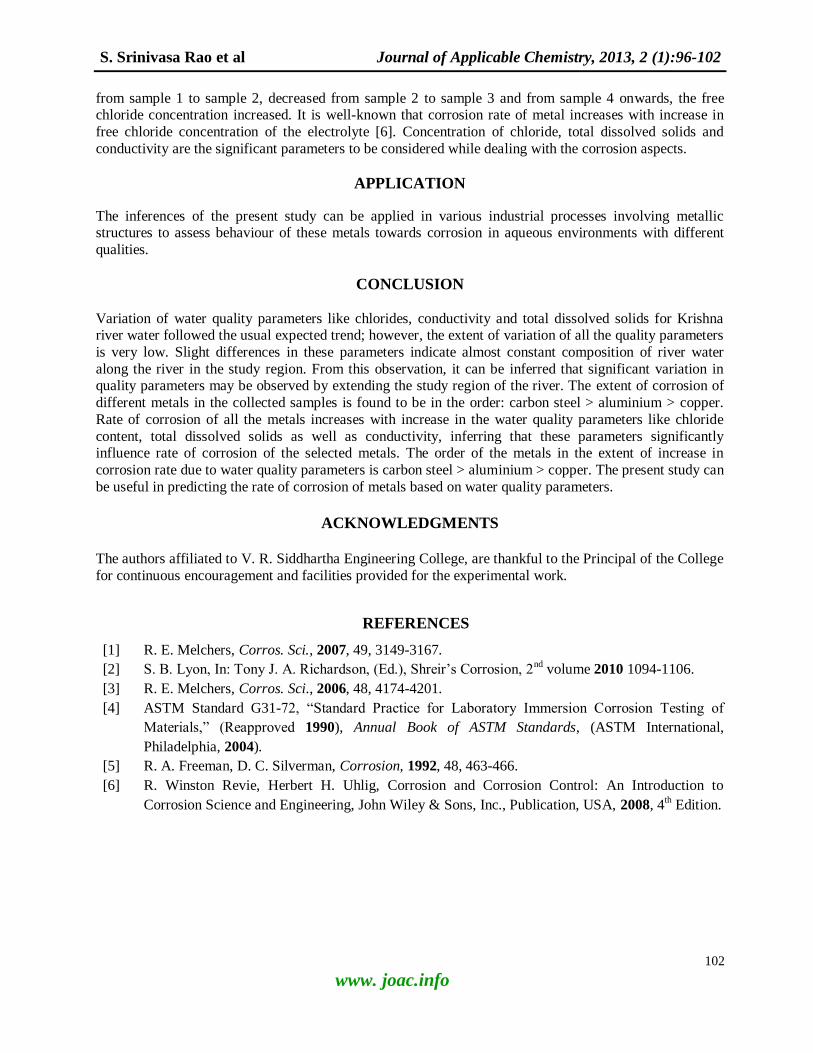
Fig. 3: Effect of conductivity of water samples on corrosion rates of metals.

S. Srinivasa Rao et al Journal of Applicable Chemistry, 2013, 2 (1):96-102
101
www. joac.info
Fig. 4: Effect of chloride content present in water samples on corrosion rates of metals..
Fig. 5: Effect of total dissolved salts present in water samples on corrosion rates of metals
Figure 3 shows that electrolytic conductivity of water samples 1 to 4 increased, slightly decreased for
sample 5 and then rapidly increased for samples 6 and 7. It is interesting to note that the corrosion rate of
carbon steel also followed the same trend of conductivity. Fig. 4 shows the effect of chloride concentration on corrosion rates of metals in contact with different water samples. Concentration of chloride increased
S. Srinivasa Rao et al Journal of Applicable Chemistry, 2013, 2 (1):96-102
102
www. joac.info
from sample 1 to sample 2, decreased from sample 2 to sample 3 and from sample 4 onwards, the free chloride concentration increased. It is well-known that corrosion rate of metal increases with increase in
free chloride concentration of the electrolyte [6]. Concentration of chloride, total dissolved solids and
conductivity are the significant parameters to be considered while dealing with the corrosion aspects.
APPLICATION
The inferences of the present study can be applied in various industrial processes involving metallic structures to assess behaviour of these metals towards corrosion in aqueous environments with different
qualities.
CONCLUSION
Variation of water quality parameters like chlorides, conductivity and total dissolved solids for Krishna river water followed the usual expected trend; however, the extent of variation of all the quality parameters
is very low. Slight differences in these parameters indicate almost constant composition of river water
along the river in the study region. From this observation, it can be inferred that significant variation in quality parameters may be observed by extending the study region of the river. The extent of corrosion of
different metals in the collected samples is found to be in the order: carbon steel > aluminium > copper.
Rate of corrosion of all the metals increases with increase in the water quality parameters like chloride
content, total dissolved solids as well as conductivity, inferring that these parameters significantly influence rate of corrosion of the selected metals. The order of the metals in the extent of increase in
corrosion rate due to water quality parameters is carbon steel > aluminium > copper. The present study can
be useful in predicting the rate of corrosion of metals based on water quality parameters.
ACKNOWLEDGMENTS
The authors affiliated to V. R. Siddhartha Engineering College, are thankful to the Principal of the College
for continuous encouragement and facilities provided for the experimental work.
REFERENCES
[1] R. E. Melchers, Corros. Sci., 2007, 49, 3149-3167.
[2] S. B. Lyon, In: Tony J. A. Richardson, (Ed.), Shreir’s Corrosion, 2nd
volume 2010 1094-1106.
[3] R. E. Melchers, Corros. Sci., 2006, 48, 4174-4201.
[4] ASTM Standard G31-72, “Standard Practice for Laboratory Immersion Corrosion Testing of
Materials,” (Reapproved 1990), Annual Book of ASTM Standards, (ASTM International,
Philadelphia, 2004).
[5] R. A. Freeman, D. C. Silverman, Corrosion, 1992, 48, 463-466.
[6] R. Winston Revie, Herbert H. Uhlig, Corrosion and Corrosion Control: An Introduction to
Corrosion Science and Engineering, John Wiley & Sons, Inc., Publication, USA, 2008, 4th Edition.