
Journal of - acrs.org.au · active warning system ... Journal of the Australian College of Road...
80
Vol 28 No 3, 2017 Journal of the Australasian College of Road Safety Formerly RoadWise – Australia’s First Road Safety Journal Peer-reviewed papers Original Road Safety Research • The signs they are a-changin’: Development and evaluation of New Zealand’s rural intersection active warning system • Superstitious beliefs and practices in Pakistan: Implications for road safety • Investigating perceived control over negative road outcomes: Implications for theory and risk communication • Understanding parental beliefs relating to child restraint system (CRS) use and child vehicle occupant safety Contributed articles Road Safety Policy & Practice • Safe-Street Neighbourhoods: the role of lower speed limits Road Safety Case Studies • SARSAI: Low Cost Speed Management Interventions around Schools – Dar es Salaam, Tanzania Perspective on Road Safety • Promoting “Safe Speeds” behaviour by changing the conversation around speed and speeding
Transcript of Journal of - acrs.org.au · active warning system ... Journal of the Australian College of Road...
Proudly sponsored byLB Australia
New South Wales Governmentand ANCAP
Australasian College of Road Safety Inc.
ACRS,POBox198,MawsonACT2607AustraliaTel0262902509Fax0262900914
PearceCentre,CollettPlace,PearceACTAustralia
Visit the College website at www.acrs.org.au
Vol 28 No 3, 2017
Journal ofthe Australasian College of Road Safety
Formerly RoadWise – Australia’s First Road Safety Journal
Peer-reviewed papersOriginal Road Safety Research
• The signs they are a-changin’: Development and evaluation of New Zealand’s rural intersection active warning system • Superstitious beliefs and practices in Pakistan: Implications for road safety• Investigating perceived control over negative road outcomes: Implications for theory and risk communication• Understanding parental beliefs relating to child restraint system (CRS) use and child vehicle occupant safety
Contributed articlesRoad Safety Policy & Practice
• Safe-Street Neighbourhoods: the role of lower speed limitsRoad Safety Case Studies
• SARSAI: Low Cost Speed Management Interventions around Schools – Dar es Salaam, TanzaniaPerspective on Road Safety
• Promoting “Safe Speeds” behaviour by changing the conversation around speed and speeding
Proudly sponsored byLB Australia
New South Wales Governmentand ANCAP
Australasian College of Road Safety Inc.
ACRS,POBox198,MawsonACT2607AustraliaTel0262902509Fax0262900914
PearceCentre,CollettPlace,PearceACTAustralia
Visit the College website at www.acrs.org.au
Proudly sponsored byLB Australia
NSW Transport Centre for Road Safety, and New Zealand Transport Agency
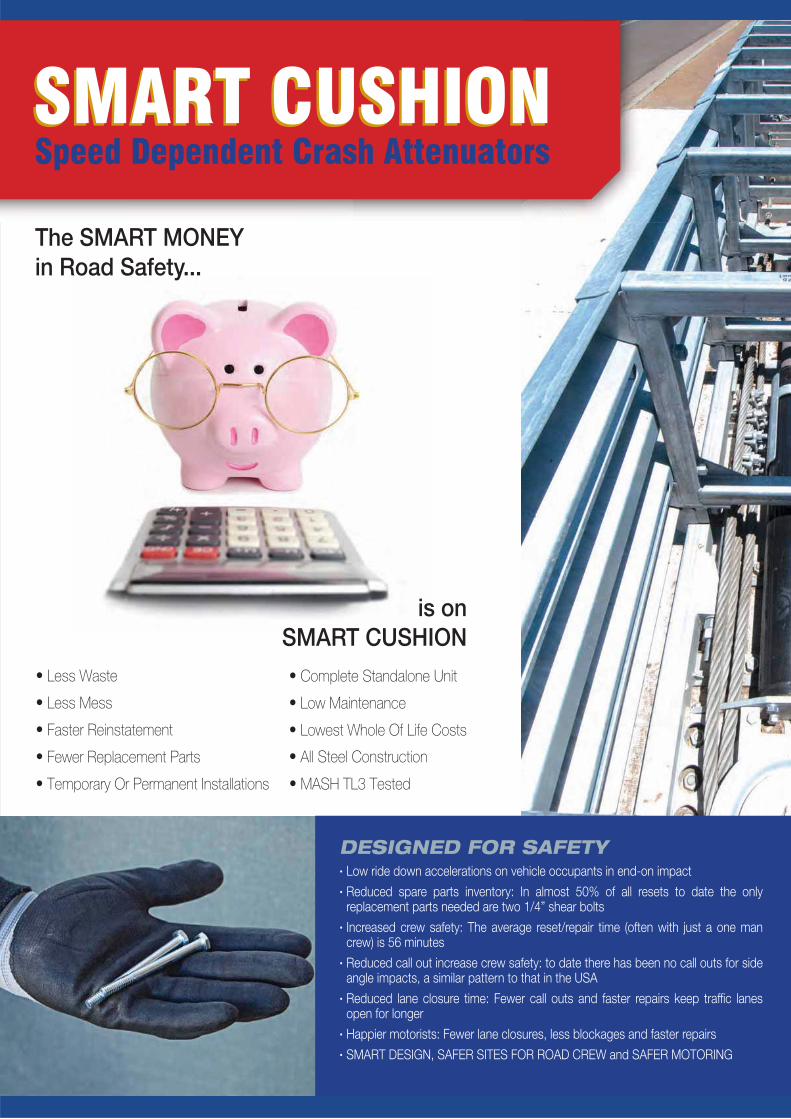
Less Waste
Less Mess
Faster Reinstatement
Fewer Replacement Parts
Temporary Or Permanent Installations
Complete Standalone Unit
Low Maintenance
Lowest Whole Of Life Costs
•
•
•
•
• MASH TL3 Tested•
•
•
All Steel Construction•
•
The SMART CUSHION Spare parts detailed record to date for the �rst 47 resets.
To date 26 Smart Cushions have been impacted, one of these has been impacted 11 times. The total cost of all Spare Parts used in 47 resets is $7,338.00 at an average of $160.00 per reset.
sci-01 07/15 sci-02 07/15 sci-03 09/15 sci-04 10/15 sci-05 10/15 sci-06 11/15 sci-07 11/15
1st SP 1st SP 1st SP 1st SP 1st SP 1st SP 1st SP
11/15 11/15 12/15 04/16 05/16 05/16 06/16
1st SP+DP 1st SP 1st SP 1st SP 1st SP 1st SP+DP 1st SP+DP
07/16 07/16 10/16 10/16 11/16 11/16 11/16
1st SP+DP 1st SP+DP 1st SP 1st SP+DP 1st SP 1st SP 1st SP+DP
11/16 02/17 02/17 02/17 02/17 09/15 02/17
1st SP 1st SP 1st SP 1st SP+Sd 1st SP+Sd 2nd SP+DP 2nd SP
11/15 07/16 12/15 12/15 07/16 11/16 11/15
2nd SP+DP 2nd SP+DP 2nd SP 2nd SP+DP 2nd SP 2nd SP+DP 3rd SP
11/15 05/16 12/15 09/16 12/16
3rd SP 3rd SP 4th SP 4th SP+DP 4th SP
12/15 01/16 01/16 05/16 06/16 06/16 08/16
5th SP+DP 6th SP 7th SP 8th SP+Sd 9th SP+DP 10th SP 11th SP
Code for Unit number / date / sequence Reset/Repair required
sci-XX unique Smart Cushion number SP only Shear Pins were required
MM/YY Month reset/repaired SP+DP Delinator panel also replaced
1st / etc Reset sequence per unit SP+Sd Sled panel also replaced
sci-08 sci-09 sci-10 sci-11 sci-12 sci-13 sci-14
sci-15 sci-16 sci-17 sci-18 sci-19 sci-20 sci-21
sci-22 sci-23 sci-24 sci-25 sci-26 sci-01 sci-02
sci-06 sci-07 sci-08 sci-09 sci-14 sci-25 sci-01
sci-06 sci-09 sci-01 sci-06 sci-09
sci-01 sci-01 sci-01 sci-01 sci-01 sci-01 sci-01a
ROAD SAFETY DESIGN AT ITS BEST
distributed exclusively by
www.lbaustralia.com.auPh: 02 9631 8833
For further information, please contact:
Paul Hansen, LB Australia Pty Ltd
DESIGNED FOR SAFETYLow ride down accelerations on vehicle occupants in end-on impact
Reduced spare parts inventory: In almost 50% of all resets to date the only replacement parts needed are two 1/4” shear bolts
Increased crew safety: The average reset/repair time (often with just a one man crew) is 56 minutes
Reduced call out increase crew safety: to date there has been no call outs for side angle impacts, a similar pattern to that in the USA
Reduced lane closure time: Fewer call outs and faster repairs keep traf�c lanes open for longer
Happier motorists: Fewer lane closures, less blockages and faster repairs
SMART DESIGN, SAFER SITES FOR ROAD CREW and SAFER MOTORING
The SMART MONEY in Road Safety...
is onSMART CUSHION
GAME CHANGER
·
·
·
·
·
·
·
C
M
Y
CM
MY
CY
CMY
K
LB_SMART_CUSHION_420x275_PRESS.pdf 1 17/03/2017 9:34:27 AM
Lives lost on NSW roads. Our goal is zero.
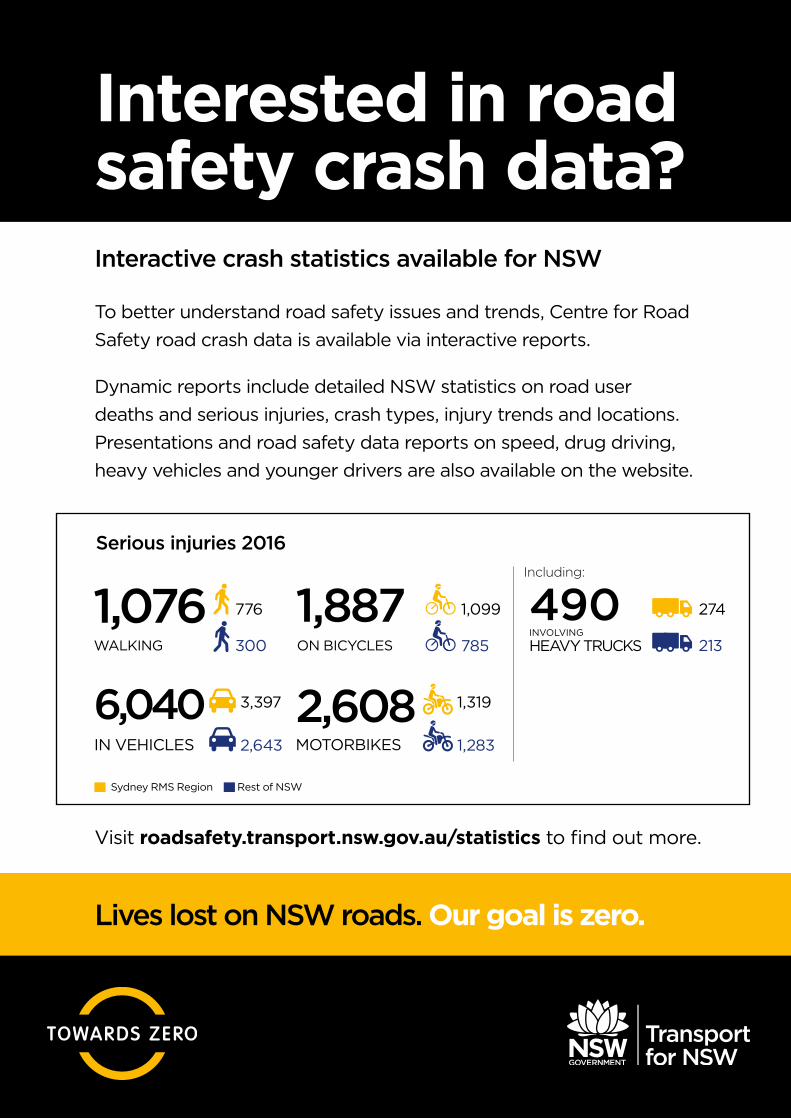
To better understand road safety issues and trends, Centre for Road Safety road crash data is available via interactive reports.
Dynamic reports include detailed NSW statistics on road user deaths and serious injuries, crash types, injury trends and locations. Presentations and road safety data reports on speed, drug driving, heavy vehicles and younger drivers are also available on the website.
Interactive crash statistics available for NSW
Interested in road safety crash data?
Serious injuries 2016Including:
Visit roadsafety.transport.nsw.gov.au/statistics to find out more.
Sydney RMS Region Rest of NSW
Journal of the Australian College of Road Safety – Volume 28 No. 3, 2017
i
Journal of the Australian College of Road Safety – Volume 28 No. 3, 2017
74
Less Waste
Less Mess
Faster Reinstatement
Fewer Replacement Parts
Temporary Or Permanent Installations
Complete Standalone Unit
Low Maintenance
Lowest Whole Of Life Costs
•
•
•
•
• MASH TL3 Tested•
•
•
All Steel Construction•
•
DESIGNED FOR SAFETYLow ride down accelerations on vehicle occupants in end-on impact
Reduced spare parts inventory: In almost 50% of all resets to date the only replacement parts needed are two 1/4” shear bolts
Increased crew safety: The average reset/repair time (often with just a one man crew) is 56 minutes
Reduced call out increase crew safety: to date there has been no call outs for side angle impacts, a similar pattern to that in the USA
Reduced lane closure time: Fewer call outs and faster repairs keep traffic lanes open for longer
Happier motorists: Fewer lane closures, less blockages and faster repairs
SMART DESIGN, SAFER SITES FOR ROAD CREW and SAFER MOTORING
The SMART MONEY
in Road Safety...
is on
SMART CUSHION
·
·
·
·
·
·
·

Journal of the Australian College of Road Safety – Volume 28 No. 3, 2017
1
ContentsFrom the President ........................................................................................................................................................... ........ 3
ACRS Chapter reports ...................................................................................................................................................... ........ 3ACRS News ............................................................................................................................................................................. 6Diary ..................................................................................................................................................................................... 10
Peer-reviewed papersOriginal Road Safety ResearchThe signs they are a-changin’: Development and evaluation of New Zealand’s rural intersection active warning system - Hamish Mackie, Colin Brodie, Richard Scott, Lily Hirsch, Fergus Tate, Murray Russell and Ken Holst ........................ 11
Superstitious beliefs and practices in Pakistan: Implications for road safety- Ahsan Kayani, Judy Fleiter and Mark King ....................................................................................................................... 22
Investigating perceived control over negative road outcomes: Implications for theory and risk communication- Rebecca Pedruzzi, Anne Swinbourne and Frances Quirk .................................................................................................. 30
Understanding parental beliefs relating to child restraint system (CRS) use and child vehicle occupant safety - Suzanne L. Cross, Judith L. Charlton and Sjaan Koppel .....................................................................................................43
Contributed articlesRoad Safety Policy & PracticeSafe-Street Neighbourhoods: the role of lower speed limits- Dick van den Dool, Paul Tranter and Adrian Boss ............................................................................................................. 55
Road Safety Case StudiesSARSAI: Low Cost Speed Management Interventions around Schools – Dar es Salaam, Tanzania- Ayikai Poswayo, Jeffrey Witte and Simon Kalolo .............................................................................................................. 63
Perspective/Commentary on Road SafetyPromoting “Safe Speeds” behaviour by changing the conversation around speed and speeding - Ian Johnston and Eric Howard ............................................................................................................................................ 69
Cover imageSpeed reductions can be achieved via low cost interventions such as dirt humps built by the community residents in Ethiopia (top picture) and as part of a low cost speed management programme around schools in Tanzania (bottom picture) as demonstrated in an evaluation study in the Road Safety Case Studies article – Poswayo, A., Witte, J. and Kalolo, S. (2017). SARSAI: Low Cost Speed Management Interventions around Schools – Dar es Salaam, Tanzania. Journal of the Australasian College of Road Safety, 28(3), 63-69.
DisclaimerMaterials (papers, contributed articles, letters, advertisements and editorial) in this journal may not necessarily reflect the opinions of peer reviewers or the Australasian College of Road Safety, who disclaim all liability for any damages that may result from publication of any material and from persons acting on it.Win a trip to the USA
for your road safety efforts!
These awards include the following presentations:
• The prestigious Australasian College of Road Safety Fellowship Award in recognition of exemplary contribution being made by an individual to road safety in Australasia.
• Australasia’s premier road safety award recognising projects that exhibit exemplary innovation and effectiveness to save lives and injuries on roads – the 3M-ACRS Diamond Road Safety Award. This award is entering its 7th year and is recognised as Australasia’s premier road safety award recognising an outstanding road trauma reduction project.
• ARSC Conference Awards (presented in the closing session of the Australasian Road Safety Conference)
• Other awards as deemed appropriate by the joint hosts for the ARSC Conference: ACRS, Austroads, C-MARC and ARRB
Austroads, ARRB, C-MARC and the ACRS look forward to your participation in ARSC2017 which aligns with international, Australasian and national road safety efforts, and is a significant step forward in Australasia’s road safety strategy. Most importantly we encourage your participation at this important event, which recognises our outstanding individuals, organisations and projects as we all strive to reduce road trauma.
More information is available at:www.theaustralasianroadsafetyawards.com.au
Crown Ballroom, Crown PerthWednesday 11th October 2017
The Australasian College of Road Safety Awards continue the tradition of the original Australasian road safety awards and conferences by recognising and celebrating exemplary projects and people working hard across our region to save lives and reduce injuries on our roads.
ACRS.3756.ARCS 2017 A4 ad for Awards.indd 2 21/7/17 2:22 pm

Journal of the Australian College of Road Safety – Volume 28 No. 3, 2017
2
The Journal of the Australasian College of Road Safety (formerly RoadWise between 1988 and 2004) ISSN 1832-9497. Published quarterly by the Australasian College of Road Safety.
Managing Editor: Dr Chika Sakashita Australasian College of Road Safety & Global Road Safety Solutions 1080 Wisconsin Ave NW #3009, Washington DC, 20007, USA [email protected]
Peer-Review Editor: Prof Raphael Grzebieta (FACRS) Transport and Road Safety (TARS) Research, University of NSW (UNSW) West Wing, 1st Floor, Old Main Building (K15), Sydney NSW 2052 Phone +61 (0)2 9385 4479 [email protected]
Editorial Board Dr Soames Job Global Lead Road Safety & (FACRS) Head of Global Road Safety Facility, World Bank, Washington DC, USA Dr Nadine Levick Objective Safety LLC, New York, USA Dr Andrew McIntosh Director McIntosh Consultancy and Research Adjunct Professor, ACRSIP FedUni Adjunct Associate Professor, MUARC Dr George Rechnitzer Adjunct Associate Professor, TARS, UNSW Dr Michael Regan Chief Scientist, Human Factors Safe Systems ARRB A/Prof Richard Tay VC Senior Research Fellow, RMIT University Prof Barry Watson Adjunct Professor, CARRS-Q, (FACRS) Queensland University of Technology
Subscriptions All issues of this Journal are mailed to personal members or corporate delegates of the Australasian College of Road Safety. Organisations and persons who are not members of the College may subscribe to the Journal on payment of an annual subscription.
Advertising and sponsorship Advertising rates and, specifications are on the College website at http://acrs.org.au/publications/journals/advertising/ or available by email from [email protected]. Discounts are available for prepaid advertising booked to run for more than one issue. The College also welcomes sponsorship of the Journal. For more information about becoming a Journal sponsor, please contact the Managing Editor.
Editorial Policy The Journal of the Australasian College of Road Safety aims to publish high quality papers and provides a means of communication for the considerable amount of evidence being built for the delivery of road safety, to inform researchers, policymakers, advocates, government and non-government organisations, post-crash carers, engineers, economists, educators, psychologists/behavioural scientists, communication experts, insurance agencies, private companies, funding agencies, and interested members of the public. The Journal accepts papers from any country or region and has an international readership.
All papers submitted for publication undergo a peer-review process, unless the paper is submitted as a Perspective/Commentary on Road Safety or Correspondence or the authors specifically request the paper not to be peer-reviewed at the time of original submission. Submissions under the peer-review stream are refereed on the basis of quality and importance for advancing road safety, and decisions on the publication of the paper are based on the value of the contribution the paper makes in road safety. Papers that pass the initial screening process by the Managing Editor and Peer-Review Editor will be sent out to peer reviewers selected on the basis of expertise and prior work in the area. The names of the reviewers are not disclosed to the authors. Based on the recommendations from the reviewers, authors are informed of the decision on the suitability of the manuscript for publication.
When papers are submitted and the authors specifically request the paper not to be peer-reviewed at the time of original submission, the papers will be published under the non peer-review stream. Submissions under the non peer-review stream, Perspective/Commentary on Road Safety and
Correspondence are reviewed initially by the Managing Editor, who makes a decision, in consultation with the Peer-Review Editor and/or Editorial Board when needed, to accept or reject a manuscript, or to request revisions from the author/s in response to the comments from the editor/s.
As a rule of thumb, all manuscripts can undergo only one major revision. Any editorial decisions regarding manuscript acceptance by the Managing Editor and Peer-Review Editor are final and further discussions or communications will not be entered into in the case of a submission being rejected.
For all articles which make claims that refute established scientific facts and/or established research findings, the paper will have to undergo peer-review. The Editor will notify the author if peer-review is required and at the same time the author will be given the opportunity to either withdraw the submission or proceed with peer-review. The Journal is not in the business of preventing the advancement or refinement of our current knowledge in regards to road safety. A paper that provides scientific evidence that refutes prevailing knowledge is of course acceptable. This provision is to protect the Journal from publishing papers that present opinions or claims without substantive evidence.
All article types must be submitted online via the Editorial Manager: http://www.editorialmanager.com/jacrs/default.aspx. Online submission instructions can be downloaded from: http://acrs.org.au/contact-us/em-journal-conference-contacts/.
Important information for authors It is essential that authors writing for the Journal obtain and follow the Instructions for authors. These are updated regularly and can be downloaded from the College website at http://acrs.org.au/contact-us/em-journal-conference-contacts/
Authors are responsible for complying with all the requirements (including Article types, Article structure, References, Ethics in publishing, Originality & plagiarism, Author declaration) before submitting their papers. The College has adopted guidelines developed by the Committee on Publication Ethics, which are available at http://acrs.org.au/publications/journals/ethics-and-malpractice-statement/.
Authors retain the copyright in their papers. However, by submitting a paper, authors give their permission to the College to make minor editorial changes to conform to the College in-house style manual; to print the paper in the Journal of the Australasian College of Road Safety; to send it for indexing to Ebsco, SafetyLit, Informit and other relevant databases; to make the full text of the paper available online through the ACRS website and Informit; and to promote the paper through media releases or by giving permission to re-print it in full or part in other hard copy or online resources that promote road safety. All photographs and diagrams for which the author or the author’s employing organisation does not hold copyright must be accompanied by permission from the copyright holder to be used as indicated above.
ACRS office contact details Ms Claire Howe, Executive Officer, [email protected]: For inquiries regarding membership and College activities.
Dr Chika Sakashita, Managing Editor, [email protected]: For inquiries regarding submissions, current and back issues, advertising and sponsorship for the Journal.
Ms Kim Day, Office Manager, [email protected]: For inquiries regarding Journal subscriptions and changes of postal address.
Mailing address: PO Box 198, Mawson, ACT 2607 Australia Phone: (02) 6290 2509 Head office: Pearce Centre, Collett Place, Pearce ACT Australia
Journal of the Australian College of Road Safety – Volume 28 No. 3, 2017
3
From the PresidentDear ACRS members,
This Aug 2017 Issue of the Journal has a mix of papers on a range of issues, including some following on the theme of speed management from the May 2017 Special Issue and the UN Global Road Safety Week in May.
Of particular interest are papers which review our communication
of the risks in speed and road safety generally. The need to ensure that the images often created to change behaviour achieve the positive outcome sought rather than be ignored or be negative, the recognition of the sensitive cultural issues which often underlie driver’s perception of risk, and the potential to use the message processes in preventative medicine for road safety, are three examples. There is potential for us to use the wrong messages, or not to ensure we are looking to refresh and review our messages with new research and understanding. Publishing these papers is important for the authors, communicating the results and the messages we all need to adopt.
I believe that we need to spend as much effort (not necessarily in monetary terms) in explaining research results as we do in obtaining those results and we need to be committed to a continuous process of explanation.
That process must apply equally across the five-pillar approach to improving road safety (management, infrastructure, vehicles, users and trauma care); and equally to all involved, not only road users, but road and vehicle designers, builders and maintainers, (including the funders) as well as consumers, insurers, community leaders and the trauma support needs, both short and long term.
The ACRS made a detailed submission to the 226 Federal Parliamentarians in March this year, and due to the high demand – the full document has been downloaded over 6,000 times to date and is still actively being searched and referenced – we have made the submission available on our ACRS website. One of our aims in that submission is to “change the conversation” along the lines of the concept recommended in a contributed paper by Ian Johnston and Eric Howard. To be successful, we all need to refresh and review the way we communicate the results of our research and experiences.
Lauchlan McIntosh AM FACRS FAICDACRS President
ACRS Chapter reportsChapter reports were sought from all Chapter Representatives. We greatly appreciate the reports we received from ACT, NSW, Victoria, and Qld.
Australian Capital Territory (ACT) and Region Reducing the risks - Cyclists, Pedestrians and Buses/Heavy VehiclesConcerns have existed among ACT bus and heavy vehicle drivers, cyclists and pedestrians about situations in which they believe the risks to vulnerable road users are inadvertently but unnecessarily increased. All parties had expressed a desire to identify these situations and work harmoniously to address and agree on meaningful ways to eliminate or reduce the risks.
A Workshop was designed to bring representatives together to identify specific areas of risk and to propose solutions that might reduce the risks. A wide range of interested parties
was invited to participate. They included representatives and spokespersons for the various bodies directly involved but also transport planners, traffic engineers from ACT government responsible for short and long term provision of infrastructure, legal practices with interests in transport law, transport associations and surrounding local government road safety officers with similar interests and issues. It was held on 21 February 2017 at the Transport Industries Skills Centre at Sutton Road ACT. Around 50 people attended. ACRS National Vice President, David Healy, facilitated the workshop.
The day was structured around a limited number of presentations, but focused more on practical demonstrations and sessions for inclusive discussion where the participants could personally and collectively attempt to find common ground.
Overall the objectives were achieved and significant goodwill was engendered. A high degree of agreement was reached on the areas of risk and the solutions which might best reduce these risks.
Journal of the Australian College of Road Safety – Volume 28 No. 3, 2017
4
All parties were able to outline their areas of concern and express their views on actions aimed at addressing them. The main issues discussed were:
• Education and training should form the central element of a program aimed at changing attitudes and behaviours of commercial and private drivers, pedestrians and cyclists. It would include changes to licensing requirements to include in all licence testing theoretical and practical modules relating to vulnerable road users. Bus and heavy vehicle driver training and WHS programs could include updates on these issues and use the latest education tools available.
• Ongoing education of cyclists and pedestrians and road users as a whole should re-emphasise the rights and obligations of the different categories. A concern existed among workshop participants that important road rules relating to cyclists and pedestrians were not front of mind for many road users.
• The means of transmitting messages to various sections of the community differs and a “one approach fits all” does not apply these days. Messages can be transmitted to wide targeted audiences through existing structures.
• Areas where safety can be improved by means of voluntary rather than mandatory action should be openly discussed and where they are found to have merit, they should be publicly supported. Voluntary programs such as ANCAP have made significant advances in the safety of the Australian car fleet. The voluntary use of daytime running lights has also safety advantages for motor cyclists.
• All effort should be made to ensure the future design and construction of infrastructure meets best international practice in terms of the safety of vulnerable road users and value for money. In vehicle technology and vehicle design will continue to assist in minimising the risks of crashes involving heavy vehicles and vulnerable road users.
The Demonstrations were very helpful and provided a practical means of articulating some of the real on road difficulties faced by cyclists and drivers alike. They allowed participants to appreciate each other’s concerns and to discuss them frankly. A number of buses and articulated s vehicles were provided for the day by operators, and attendees were able to participate actively in the demonstrations. Some had their first drive of a bus under supervision. Others sat on bikes as buses drove past at varying speeds and distances from the bikes (1 or 1.5 metres). People climbed into the buses and articulated vehicles to get a better appreciation of what drivers can and cannot see from their driving positions.
Since the Workshop, a number of participants have commenced discussions aimed at developing programs that will enable joint action to be taken aimed at reducing the incidence of crashes between heavy vehicles and vulnerable road users in the ACT and surrounding areas.
Drug drivingThe Chapter continues to participate in the ACT review of drug driving. Following receipt and consideration of the report prepared as a result of the forum managed by the Chapter last year, focus is being placed on the areas of: education and communications; research and data; and drug driving regulation (including penalties and an impairment based approaches to regulation). A Communications and Education Group report is being finalised, and the Terms of Reference for its review of drug driving regulations, research and data are about to be drafted.
Final round of financial support from the NRMA-ACT Road Safety TrustThe Trustees of the NRMA-ACT Road Safety Trust have decided, and the ACT Government and NRMA Insurance have agreed, that the distribution of the residual funds of the Trust should be should be distributed to organisations within the ACT, and the rest to universities and research organisations that have done outstanding work in road safety in the interests of the road users of the ACT.
The Chapter is very grateful for gifts totalling $30,370m from this final distribution. It also acknowledges and thanks the Trust, its members and staff for the ongoing support provided to the Chapter over the years.
Future ActivitiesAt the Chapter’s Annual General Meeting in May 2017, it was agreed that we will focus on four issues during the next twelve months. They are:
Dementia and driving - Q3 2017 Develop a program for disseminating research undertaken by Professor Kaarin Anstey and her team at ANU Centre for Research and Aging for the NRMA-ACT Road Safety Trust;
The Annual ACT Road Safety Forum - Q4 2017 Organise and manage the Forum in conjunction with ACT Justice and Community Safety Directorate.
ACT Aboriginal & Torres Islander Driver Licensing Pilot Project Forum - Q1 2018 This Forum will be organised and conducted in conjunction with The Aboriginal Legal Services NSW/ACT. It will bring together representative of organisations active in the field and those with a strong interest in the subject to assist in the development of an ACT Program; and
Wildlife Crash Program Forum – Q2 2018 This project will be undertaken in conjunction with ACT Health and the ACT Branch of the Royal Australasian College of Surgeons. The Forum will focus on achieving a better understanding of the extent of injuries to drivers and passengers involved in wildlife crashes. It will be used to develop a study that will examine retrospective data which in turn will be used for estimating future crash rates and developing future countermeasures.
ACT Chapter Chair and Secretary Mr Eric Chalmers & Mr Keith Wheatley

Journal of the Australian College of Road Safety – Volume 28 No. 3, 2017
5
New South Wales (NSW) During 2017 the NSW Chapter has been in a process of consolidating its annual strategy and building on activities delivered to NSW members.
The Chapter AGM in May saw two members leave the Committee – Soufiane Boufous and Alexandra Hall. We thank both for their time and effort to preparing presentations and input to discussions about the Chapter business. The AGM also saw three new members join the Committee for 2017 – Bianca Albanese, Steve Northey and Robyn Preece. The Committee now has nine members, who meet on the fourth Tuesday of each month to discuss current road safety issues and plan how the Chapter can reach out to members to improve awareness and delivery of road safety across the State.
In addition to regular Committee meetings, Committee representatives have made submissions to the NSW Staysafe Committee and contributed to the National Executive of the College, and represented the Chapter at the launch of the UN Road Safety Week launch, which was held at the Sydney Opera House and involved lighting of the Harbour Bridge.
2016/17 has also seen the Committee facilitate seminars covering topics such as learner drivers, and the impact of digital billboard advertising on road safety and engaging with overseas experts. For the remainder of this year the Committee is planning seminars on motorcycle safety, learner driver research and industry networking to bring together practitioners who deliver road safety on the state’s road network. Where possible the Chapter will broadcast these seminars using the web-based meeting platform GoToMeeting, thus permitting members who are regionally based or simply unable to attend a seminar to participate via the internet. Keep an eye out for Chapter news via the ACRS website. Any NSW member who may be seeking information about upcoming seminars can contact the Committee members. If members have a suggestion for a seminar topic they believe other NSW members might be interested, then please do not hesitate to let the Committee know.
Next year, the NSW Chapter will be hosting the 2018 Australasian Road Safety Conference, in Sydney. Planning is already underway for this Conference, which will mark the 30th anniversary of the existence of the College. Details will be announced at the conclusion of the 2017 Conference, in Perth, but in the meantime members should keep their diaries open for early October, 2018.
NSW Chapter Representative Mr David McTiernan
Victoria (VIC) The Victorian Chapter conducted a very successful seminar in April on the issues of distraction and fatigue - two road safety problems that collectively contribute significantly to road trauma but for which a set of effective evidence-based solutions is yet to be realised. Representatives from
academia and government presented with Skype being used for the first time to beam in a presentation from a senior researcher, Dr Chris Watling of CARRS-Q. All presentations were filmed in order to ensure the knowledge they generate reaches the widest possible audience.
The Chapter was also a co-sponsor of a further seminar held on 17 May on the issues of Driver Distraction and the Human-Machine Interface. The seminar was co-sponsored by VicRoads, Monash University and the ARRB. Professor Strayer and Associate Professor Cooper from the University of Utah presented an overview of their pioneering research in conjunction with the AAA Foundation of Traffic Safety. The seminar attracted over 100 attendees as was fully subscribed.
The Chapter is now commencing planning its program of activities for 2017/18 with the issue of Speed and Speeding to be one of the first issues to be addressed.
VIC Chapter Chair Mr David Healy
Queensland (QLD) ACRS Queensland Chapter AGM was held on 6th June 2017. The Executive for the Qld Chapter duly elected at the AGM:
Chair – Dr Mark King Deputy Chair – Dr Kerry Armstrong Secretary/Treasurer Ms – Veronica Baldwin Committee members – Professor Narelle Haworth, Mr Joel Tucker, Ms Claire Irvine, Dr Jason Edwards, Mr Simon Kirkpatrick, Vanessa Cattermole, Matthew Waugh, Ioni Lewis
SEMINARS 2016 / 20176 December 2016 – Two speakers presented at the December meeting:
• Clare Murray, Principal Advisor (Communications), Queensland Department of Transport and Main Roads reported on the Safety 2016 Conference held in Finland, September 2016; and
• Emeritus Professor Mary Sheehan from CARRS-Q gave a report on T2016- the 21st International Council on Alcohol, Drugs and Traffic Safety (ICADTS) Conference held in Brazil October 2016.
7 March 2017 – Seminar titled “Unique road safety challenges applicable to a tunnel environment” was presented by Mr Brett Simpson, Brisbane Motorways Services.
6 June 2017 - In lieu of a speaker, Dr Mark King presented the main aspects of the 2017 ACRS Submission to Federal Parliamentarians – “The way forward to reduce road trauma” and led a discussion on how it can be translated into the Queensland setting, and what role the Chapter can contribute.

Journal of the Australian College of Road Safety – Volume 28 No. 3, 2017
6
OTHERThe Chapter supported CARRS-Q in its UN Road Safety Week (and Yellow Ribbon National Road Safety Week) launch of a Queensland-wide initiative “Watch your Pace when Sharing Space” on Friday 12 May 2017. The event took place in Samford Village, a semi-rural town on the outskirts of Brisbane. Samford has demonstrated its interest in the need for safer roads over the years, and has a mix of road users, both locals and visitors, particularly at peak times, who need to share space safely. RACQ and Kidsafe QLD have partnered with CARRS-Q for this event, and guest speakers included Peter Frazer, President of Safer Australian Roads and Highways (SARAH) who participated as part of Yellow Ribbon Road Safety Week.
The campaign aims to educate people about the vulnerability of pedestrians and cyclists in collisions with cars at relatively low speeds, in the context of a shift in lifestyles towards urban areas where different road users are more likely to be sharing space, and where conflicts between VRUs and vehicles will become more common. It addresses similar themes to the presentation Is 40 the New 50?” which was promoted at the Australasian Road Safety Conference in 2016.
QLD Chapter Chair Dr Mark King
ACRS NewsNEW CORPORATE MEMBERSAltus Traffic Bronze ANZ Policing Advisory Agency Bronze Blue Datto Foundation Ltd Bronze Johnson & Johnson Pacific Pty Ltd Bronze Learn 2 Drive Properly Bronze Mackie Research Bronze Moonee Valley City Council Bronze Queensland Police, PCYC Bronze Road Safety Education Limited Bronze Smart Start Interlocks Bronze Fit to Drive Foundation Bronze Transurban Group Silver
2017 UNITED NATIONS GLOBAL ROAD SAFETY WEEK MAY 2017 The Fourth UN Global Road Safety Week, which was celebrated worldwide, highlighted how to Save Lives: #SlowDown. The ACRS released a Special Issue of the Journal of the Australasian College of Road Safety on Speed Management in support of UN Global Road Safety Week.
The World Health Organization report that the efforts of the United Nations Road Safety Collaboration (of which ACRS is an official member) and the many, many associated road safety stakeholders are yielding success with well over 400 events across 100 countries having taken place worldwide. Among many others, these included regional launches of the week, Slow Down Days, campaigns around schools, activities involving Federal, State & Local Parliamentarians and Heads of State, symposia, stakeholder and expert forums, and vigils for road traffic victims. These events engaged a wide range of partners from government
including transport and health, international agencies, civil society, academia, foundations, and the private sector.
Events importantly recognised and involved the many members of our communities who are directly impacted by road trauma through death and serious injury, as well as those who will continue to be affected by the ripple effects from this trauma for many years to come. These impacts involve friends and extended families, workplaces, emergency services & police personnel, crash investigators, community liaison officers, surgeons, rehab therapists and many others.
Western Pacific regional launch of UN Road Safety Week hosted by Federal Minister for Infrastructure & Transport Darren Chester & organised by the Department of Infrastructure & Transport. Speakers included Australia’s Governor-General Sir Peter Cosgrove, ACRS President Lauchlan McIntosh AM, Peter Frazer, President of the SARAH Foundation, Jon Passmore - World Health Organization, Rob McInerney - iRAP & many more. This event included the lighting of Sydney Harbour Bridge in yellow, staying lit for the duration of the week.
In conjunction with the Western Pacific regional launch, the World Health Organization and The George Institute for Global Health co-hosted 3-day fellowship program for journalists from Low and Middle Income Countries. The reporters from Cambodia, Laos, China, Vietnam, Samoa, and the Philippines were in Sydney as part of United Nations Global Road Safety Wee . The objective of the fellowship program was to increase and improve the quality of reporting on road safety in the Western Pacific Region where 900 people are killed each day.
Initiating and implementing road safety reform is the global road safety challenge of our times according to ACRS Associate Fellow and member of the Australasian Executive Martin Small, who was the lead presenter at the
Journal of the Australian College of Road Safety – Volume 28 No. 3, 2017
7
Multi-sectoral Workshop on Road Safety on 8-9 May in Naypyidaw, Myanmar. The workshop was organised by the World Health Organization Country Office in collaboration with the National Road Safety Council and was the lead event to mark the United Nations Road Safety Week. Martin presented on Sustainable Mobility for All, and the Draft Road Safety Investment Plan 2018-2022 which his company has prepared for the Government of Myanmar. While illustrating the comprehensive suite of speed management reforms he implemented in South Australia, Martin emphasised the universality of the speed management problem. “Whether in low, middle or high-income countries, we are all suffering the legacy of poor decision making in relation to speed, and the UN road safety week is a good reminder of the need for us all to initiate and implement reform on this issue which dominates every aspect of our work.”
Other events included:
Western Australia – The WA Road Safety Commission’s ‘Shine a Light on Road Safety’ week was jam packed with events: a full day stakeholder forum on Thursday 11 May, with our ACRS President providing a keynote address together with Dr Paul Roberts (ARRB) our WA Chapter Chair and ACRS Member Ray Cook from Cardno.
Australian Capital Territory – Lighting of national buildings including Old Parliament House; Yellow ribbon campaign; Display of large yellow floral wreaths; ACTION bus back advertising.
Victoria – Shine a Light on Road Safety events and illuminations.
Queensland – CARRS-Q launched a Queensland-wide initiative titled “Watch your Pace when Sharing Space” in Samford Village on Friday May 12, 2017. This event provided the opportunity to remind the community about sharing the road to improve interaction between all road users. As part of the event, there was face painting, a sausage sizzle and cupcakes, together with interactive displays by RACQ, Kidsafe, Queensland Ambulance Service and Queensland Police.
New Zealand – Many events planned including those organised by Brake, the Yellow Ribbon Road Safety Alliance, Plunket.org, Southland DC + much more.
Global – Release of the Manifesto for Road Safety - Presenting priorities for road safety policy and legislation to 2020 and beyond.
Thank you to the 200+ authors who have submitted an abstract for ARSC2017We sincerely appreciate your efforts to reduce road trauma. In tandem with your participation at ARSC2017, we are delighted to invite you to join us for the premier networking opportunities planned during the event:
1. Conference Cocktail Welcome Reception to be held in the Exhibition Gallery at Perth Crown Resort, and the
2. Conference Gala Dinner & Awards Ceremony in the Crown Ballroom, Perth Crown Resort
The ARSC2017 Scientific Committee are pleased to present the ARSC2017 Draft Program - including the Full Conference Program, the Symposium Program and the Poster Program - to all stakeholders, showcasing invited Keynote Speakers, Plenary Panellists, 10+ Symposia (90-minutes each), 35+ Concurrent Sessions consisting of 150 presentations, and many Poster presentations. The 3-day conference Program covers the 5 major topic areas aligned to the United Nation’s 5 Pillars of Road Safety:
1. Road Safety Management2. Road Infrastructure (Safer Roads)3. Safer Vehicles4. Road User Behaviour5. Post-Crash Care, Data and Crash AnalysisWe are delighted to announce that the Federal Minister responsible for road safety, Hon Darren Chester MP, will be joining us for the Conference Gala Dinner and Awards Ceremony on Wednesday 11 October 2017 to be held in the Grand Ballroom, Perth Crown Resort.
We look forward to the Minister meeting many ARSC2017 delegates during this social function, presenting the Awards of ACRS Fellowship and the 3M-ACRS Diamond Road Safety Award, and presenting a Keynote address.
The ARSC2017 Organising Committee is also delighted to announce our first 10 high-profile invited speakers for ARSC2017, and look forward to announcing further speakers shortly!
• Dr Mark Rosekind – Chief Safety Innovation Officer, Zoox
• Professor Len Collard – Australian Research Council Chief Investigator, School of Indigenous Studies, University of Western Australia
• Mr David Bobbermen – Program Manager Safety, Austroads
• The Hon Michelle Roberts MLA – WA Minister for Police, Road Safety
• Mr Kim Papalia – Commissioner, WA Road Safety Commission
• Dr Sudhakar Rao – State Director of Trauma, Royal Perth Hospital
• Mr James Goodwin – CEO, Australasian New Car Assessment Program
• Mr Stuart Ballingall – Program Director, Connected and Automated Vehicles, Austroads
• Mr Terry Agnew – Group CEO, Royal Automobile Club of Western Australia

Journal of the Australian College of Road Safety – Volume 28 No. 3, 2017
8
• Ms Rita Excell – Executive Director, Australian Driverless Vehicle Initiative (ARRB)
• Mr Antonio Piscitelli – Business Development Specialist – IOT and M2M – Telstra & Steering Committee, Australian Driverless Vehicle Initiative (ARRB)
ARSC2017 Awards: Be rewarded for your expertise and efforts to reduce road trauma! The 2017 Australasian Road Safety Conference is expected to attract over 500 delegates and will bring you the best of the best road safety research and practitioner papers from experts across our region. We will be rewarding our outstanding individuals and groups for their efforts through a wide variety of awards to be presented at the ARSC2017 Gala Dinner and during the closing plenary session of the conference:
• A Trip to USA for the Grand Prize winner of the 2017 3M-ACRS Diamond Road Safety Award;
• The Prestigious ACRS Fellowship award for 2017;• $7,000 to be awarded for outstanding papers &
presentations throughout ARSC2017.The announcement of the 2017 3M-ACRS Diamond Road Safety Award will be made during the ARSC2017 Conference Gala Dinner & Awards Ceremony on Wednesday 11 October 2017, in the Crown Ballroom, Perth Crown Resort, in front of 500 of our most eminent road safety professionals.
The 3M-ACRS Diamond Road Safety Award calls for any road safety practitioner from the public or private sector to submit highly innovative, cost-effective road safety initiatives/programmes which they have recently developed that stand out from the standard, everyday practice and deliver significant improvements in road safety for the community.
The winner will RECEIVE a trip to the USA to attend the 48th ATSSA Annual Convention & Traffic Expo in 2018, and will also visit 3M Global Headquarters in Minnesota. The winner will also present their winning entry and USA trip at the next Australasian Road Safety Conference, and may also be eligible to present at the ATSSA Convention.
The announcement of the 2017 ACRS Fellowship will be made during the ARSC2017 Conference Gala Dinner & Awards Ceremony on Wednesday 11 October 2017, in the Grand Ballroom, Perth Crown Resort, in front of 500 of our most eminent road safety professionals.
The prestigious ACRS Fellowship is recognised as the Australasian road safety community’s highest honour, recognising an individual for their outstanding commitment and effectiveness in their efforts to reduce road trauma. The Australasian College of Road Safety first instituted the
award of College Fellow in 1991. The list of Fellows since the inception of the award is a record of significant achievement by these outstanding individuals.
Fellows must be acknowledged by colleagues and co-workers as outstanding, by virtue of contributions to road safety rather than their position. The contributions must be of such a nature that they have led to substantial growth and improvement in an important institution or organisation, body of knowledge or aspect of thought and practice associated with road safety.
Authors are in the running for the following 8 conference awards:
1. 2017 Peter Vulcan Award for Best Researcher $1000 prize plus certificate Awarded to the first author of the researcher paper presented at the conference which is ranked best against the following criteria in order of priority:
- Scientific/technical merit of the work - Potential contribution to road safety - Originality of approach
2. 2017 Road Safety Practitioners (non-Researcher) Award $1,000 prize plus certificate Awarded to the paper that reflects a road safety issue, completed road safety program or campaign that is ranked best against the following criteria in order of priority:
- Potential contribution to road safety - Originality in development and delivery/design - Demonstrated links between the need for the
program/campaign/work and its results3. 2017 Best Paper by a New Practitioner (non-
Researcher) Award $1,000 prize plus certificate Awarded to the first author and presenter of the paper by a new practitioner which is ranked best against the following criteria (in order of priority):
- Scientific/technical merit of the work - Potential contribution to road safety - Clarity of presentation - Originality of approach
4. 2017 Best Paper by a New Researcher Award $1,000 prize plus certificate Awarded to the first author and presenter of the research paper by a new researcher which is ranked best against the following criteria (in order of priority):
- Scientific/technical merit of the work - Potential contribution to road safety - Clarity of presentation - Originality of approach
5. 2017 Road Safety Paper Award $500 prize plus certificate Awarded to recognise the poster that reflects a completed road safety program, campaign or research
Journal of the Australian College of Road Safety – Volume 28 No. 3, 2017
9
project that is ranked best against the following criteria in order of priority:
- Potential contribution to road safety - Originality in development and delivery - Demonstrated links between the need for the
program, campaign or research project and its results
6. 2017 Conference Theme Award $500 prize plus certificate Awarded to the first author of the paper that best fits the 2017 conference theme of “Expanding our Horizons!”.All conference papers are eligible for this awardWe greatly appreciate the generosity of the Transport Accident Commission for sponsoring these awards.
7. 2017 Best Paper with Implications for Improving Workplace Road Safety $1000 plus certificate Awarded to the first author and presenter of the bestpaper with implications for improving workplace road safety. The paper will be converted to an NRSPP Thought Leadership Piece which will feature on the NRSPP Website and be supported by a webinar. We thank the NRSPP for sponsoring this award.2017 Policing Practitioner’s Paper Award (to be confirmed) $1000 plus certificate Awarded to the paper that reflects a road safety policing issue, completed enforcement program, or campaign that is ranked best against the following criteria in order of priority:
- Contribution to road safety - Originality in development and delivery/design - Clearly demonstrated evidence base links
between the need for the policing/enforcement program/campaign/work and resulting reduction in road trauma
(Note: A Policing Practitioner is defined as anyone who is a non-researcher involved in policing and/or enforcement)
Warm welcome to our many sponsors & supporters of ARSC2017Thank you to all of our conference partners who are getting in early to showcase their generous support! Without you the conference would not be shaping up to be such a successful event, able to save more lives and injuries on our roads:
Platinum Sponsor - WA Road Safety CommissionGold Sponsor - RAC WAGold & LMIC Scholarship Sponsors - Federal Department of Infrastructure and TransportWelcome Reception Sponsor - Toll GroupCoffee Cart Sponsors - AAMCNetworking Lounge Sponsor - VitronicSilver Sponsor & Notepad Sponsor - Main Roads Western Australia
Conference App Sponsor - AustroadsScientific Awards Sponsor - TACSatchel Sponsor - C-MARCBronze Sponsor - SuncorpUSB Sponsor - Monash UniversityExhibitor - Smart Start InterlocksExhibitor - PathtechExhibitor - CARRS-QExhibitor - Guardian InterlockExhibitor - DragerExhibitor - TextStopperExhibitor - Alcolizer TechnologyExhibitor - Monash University Accident Research CentreExhibitor - Road Trauma Support WAExhibitor - Andatech SafetyExhibitor - Black MothExhibitor - RoadWise WalgaExhibitor - KSI Global AustraliaExhibitor - AlereSupporter – TARS at the University of NSWSupporter - ElsevierSupporter - Safety - Open Access JournalSupporter - Centre for Automotive Safety Research Supporter - Serco Supporter - Roads & Civil Works AustraliaSupporter - Institute of Automotive Mechanical EngineersSupporter - Infrastructure MagazineARSC2017 co-Hosts - ARRB and Curtin Monash Accident Research Centre (C-MARC)3M-ACRS Diamond Road Safety Award Partners - 3M & ACRSFounding Partners - Austroads & ACRS
Conference Managers & Sponsorship / Exhibition Enquiries: Lynne Greenaway - Encanta Phone: 08 9389 1488 Email: [email protected]
Conference Abstract / Symposium Submissions: ARSC Submission Managers Email: [email protected] Phone: (02) 9385 4452
Conference Website: AustralasianRoadSafetyConference.com.au
Awards Website: TheAustralasianRoadSafetyAwards.com.au
ARSC2017 - Approved by RACS as a Certified Professional Development activity We are delighted to announce that ARSC2017 has been given the tick of approval by the Royal Australasian College of Surgeons (RACS) as a certified Continuing Professional Development (CPD) activity. This means that all RACS
Journal of the Australian College of Road Safety – Volume 28 No. 3, 2017
10
Fellows earn points towards their annual CPD requirement through participation at ARSC2017. In turn this elevates the conference to a new level, with surgeons joining with the many other sectors of road safety participating at ARSC2017 to work together to expedite road trauma reductions.
The fifth and final pillar of the United Nations Decade of Action for Road Safety (2010-2020) focuses on Post-Crash Response and the gains that can be made through collaborative work that includes all those working across this sector. The importance of post-crash response sector, and in particular that of trauma surgeons, was emphasised by the ACRS Patron, Sir Peter Cosgrove, during the ACRS awards ceremony in November 2014. Sir Peter remarked that the greatest similarity he has seen to road trauma victim injuries has been with tsunami victims - hence the reason we mobilise emergency support from trauma surgeons to assist post-tsunami emergencies.
Sir Peter likened road trauma to ‘an innocent war on our roads’. Surgeons are at the front end of this ‘war’. ACRS aims to build wider acknowledgement of this important sector and its ability to contribute to meaningful improvements towards improved road trauma outcomes. RACS participation and inclusion in ARSC2017 is therefore an extremely important step in this direction.
There are currently around 7,000 RACS Fellows across Australasia who hold medical registration and are required to participate in Continuing Professional Development (CPD) through RACS approved activities, so with ARSC2017 now earning CPD accreditation we are very much looking forward to welcoming many of these dedicated medical professionals to the conference.
With road trauma across Australia alone resulting in over 1,000 deaths and 30,000 serious injuries every year, surgeons are called on to bear the brunt of these road trauma outcomes - from receiving patients 24-7-365, to performing surgeries, dealing with distraught family members, and providing ongoing follow-up care to road trauma victims. Our surgeons are an extremely important sector dealing with the ripple effects from road trauma, and therefore RACS continue to have an important role as an expert representative body seeking and attaining road trauma reductions on behalf of the entire community.
Participation of RACS Fellows at ARSC2017 significantly strengthens the effectiveness of all ARSC2017 outcomes, and we look forward to highlighting the work of this important sector at ARSC2017.
Diary2017
September 12Euro NCAP’s 20th Anniversary CelebrationAntwerp, Belgium
October 3-4TISPOL Road Safety Conference 2017Radisson Blu Manchester Airporthttps://www.tispol.org/theconference2017
October 10-12Australasian Road Safety Conference 2017Crown Perth, Australiawww.australasianroadsafetyconference.com.au
October 11-126th IRTAD Conference 2017Marrakech, Moroccohttps://www.itf-oecd.org/6th-irtad-conference-better-road-safety-data-better-safety-outcomes
October 17-19Road Safety & Simulation International Conference 2017The Hague, Netherlandshttp://rss2017.org/
October 25European Traffic Education Seminar 2017Mechelen, Belgiumwww.etsc.eu
October 29-315th IRF Middle East Regional Congress & ExhibitionDubai, United Arab Emirateshttps://merc.irf.global/
November 2-4International Seminar on Road Safety AuditTunis, Tunisiahttps://www.piarc.org/en/2017-03-20,International-Seminar-on-Road-Safety-Audit-2017.htm
November 9-1011th Uruguayan Winter Road CongressMontevideo, Uruguayhttp://www.auc.com.uy/index.php?option=com_content&view=article&id=266&Itemid=122
November 14-15The National Road Safety Conference 2017Radisson Blu Manchester Airporthttp://nationalroadsafetyconference.org.uk/
November 14-1718th IRF World MeetingNew Delhi, Indiahttps://wrm2017.org/message/
November 15-17Intertraffic Mexico Mexico City, Mexicohttp://www.intertraffic.com/en/mexico/

Journal of the Australian College of Road Safety – Volume 28 No. 3, 2017
11
November 19World Day of Remembrance for Road Traffic Victimshttp://worlddayofremembrance.org/
November 25-27International seminar “Safe System Approach to Enhance Traffic Safety in Iran: Recent Activities and Future Directions”Tehran, Iranhttps://www.piarc.org/ressources/documents/INTERNATIONALS-SEMINARS-PROCEEDINGS/
December 24-25ICTTP 2017: 19th International Conference on Traffic and Transportation PsychologyDubai, UAEhttps://www.waset.org/conference/2017/12/dubai/ICTTP
ErratumThere was an error in Figure 4 on p.54 in the print version of the article: Blackwell, R., Zanker, S. and Davidson, J. (2017). Understanding low level speeders to increase speed compliance via road safety campaigns. Journal of the
Australasian College of Road Safety, 28(2), 47-55. The error has since been corrected in the PDF version that is available on http://acrs.org.au/publications/journals/current-and-back-issues/
Peer-reviewed PapersOriginal Road Safety Research
The signs they are a-changin’: Development and evaluation of New Zealand’s rural intersection active warning systemHamish Mackie1, Colin Brodie2, Richard Scott1, Lily Hirsch1, Fergus Tate2, Murray Russell3, and Ken Holst2
1Mackie Research, Auckland, New Zealand2NZ Transport Agency, Wellington, New Zealand3Armitage Group, New Zealand
Corresponding Author: Hamish Mackie, Level 2, 2 Princes Street, Auckland Central, Auckland, 1010, New Zealand. E: [email protected] Ph: 64 09 3947 040
Key Findings• RIAWS was developed and tested at ten rural high-risk intersections;• The RIAWS was well received by the motoring public;• VSL signs were effective at slowing motorists when a collision risk was present;• The smallest 10% of chosen gaps by side-road traffic increased when RIAWS was active;• Fatal and serious crashes reduced more at RIAWS sites compared with control sites.
AbstractIn New Zealand, high-risk rural intersections are an important area of focus for reducing deaths and serious injuries. Accordingly, the Rural Intersection Active Warning System (RIAWS) was developed to reduce traffic speed on major road intersection approaches when the potential for a collision exists. Electronic variable speed limit (VSL) or ‘Slow Down’ signs on the intersection approaches are triggered by the presence of side-road and right-turning traffic, and when traffic clears the signs turn off. This paper reports on an evaluation of ten RIAWS sites, some of which have been active for four years. We found that the RIAWS was effective in reducing traffic speed when potentially colliding vehicles were present. However, the ‘Slow Down’ sign was significantly less effective than a 60 or 70 km/h VSL, and was subsequently discontinued. In the three-
Journal of the Australian College of Road Safety – Volume 28 No. 3, 2017
12
year period since implementation, fatal and serious crashes have almost been eliminated at the ten RIAWS intersection sites. The active nature of the system increases driver state awareness, better prepares motorists for a possible event, and increases the gaps between potentially colliding vehicles. Generally, it seems that RIAWS has lasting, rather than short-term speed reducing effects, and this may underpin the emerging safety benefits. Overall, RIAWS is feasible, operates well, tangibly reduces travel speed when a crash risk is present, is perceived positively by the motoring public, and has shown tangible safety benefits.
KeywordsRural intersection; warning; road safety; crash minimization; vehicle activated sign; variable speed limit
GlossaryDSI – deaths and serious injuriesITS – intelligent transport systemsRIAWS – rural intersection active warning systemPET – post encroachment timePTC – projected time to collisionVAS – vehicle activated signVSL – variable speed limit
IntroductionBackgroundIn 2010, the New Zealand Government implemented the Safer Journeys Road Safety Strategy 2010-2020. The Strategy takes a ‘Safe System’ approach which emphasises, among other concepts that: the road environment needs to be more accommodating of human error; people are vulnerable to crash factors; and unsafe road user behaviour should be minimised (Ministry of Transport, 2010).
High-risk intersections are an important area of focus for Safer Journeys. Between 2008–2012, the five year period before the Rural Intersection Active Warning System (RIAWS) project commenced, intersection crashes accounted for 30% of all deaths and serious injuries (DSI) on New Zealand’s roads (NZ Transport Agency, 2013, p.10). Furthermore, during the same time period, 17% of all DSIs on rural roads were at intersections (NZ Transport Agency, 2013). While only 5% of all DSIs happen at rural intersections, the social costs are likely to be proportionately higher because rural crashes are more likely to have higher threat to life serious injury crashes (Mackie et al., In Press).
A ‘Safe System’ response to high-risk intersections may include significant physical work such as a rural roundabout, often costing millions of dollars. While this approach should not be discouraged, a ‘smart’ system that responds to periods of actual crash potential (e.g. when intersecting vehicles are within proximity of each other) may be a cost-effective solution, especially for high-risk intersections that do not qualify for rural roundabout construction.
This paper describes a trial that was conducted at ten high-risk rural intersections across New Zealand from January 2013 until December 2016. The aims of the trial were twofold: 1) to compare the effectiveness of two electronic sign configurations at four high-risk rural intersections; 2)
to analyse the effectiveness of a variable speed limit (VSL) sign at ten sites for up to a three-year period.
Our long-term goals are to improve the safety of New Zealand’s high-risk rural intersections by significantly reducing the likelihood of crashes occurring, and to minimise the consequences of those crashes that do occur.
Review of LiteratureVehicle speed magnitude is highly related to crash risk and severity (Fildes & Lee, 1993; Nilsson, 2004; Richards & Cuerden, 2009; Wramborg, 2005), as is the distribution of speed (Aarts & van Schagen, 2006; Archer et al., 2008; Garber & Gadiraju, 1989). Therefore, an evidence-based approach to road safety would address speed, especially at higher risk locations. Accordingly, many countries are now focussing on speed management measures to improve road safety. In New Zealand, a project based on speed management to mitigate collision forces at high-risk rural intersections was initiated. The RIAWS development began with a scoping study (Mackie, 2010) to understand intersection Intelligent Transport Systems (ITS) based safety systems developed elsewhere.
The most compelling of the overseas examples was a trial by the Swedish Road Administration (SRA) between 2003 and 2007 of variable speed limit (VSL) signs placed at 19 locations. Many of the sites were located at intersections where the VSL was triggered by the presence of a side-road vehicle that may have the potential for a collision. At locations where a permanent 90km/h speed limit existed, a variable 70km/h speed limit was installed. At these sites, vehicle speeds reduced by 14km/h on average, accepted gap time increased by 1-2 seconds, and the system was perceived very positively by the motoring public (Lind, 2009). It is not clear whether these positive outcomes have translated into this solution being adopted more widely.

Journal of the Australian College of Road Safety – Volume 28 No. 3, 2017
13
In 1998 in Virginia, USA a pilot Intersection Collision Warning System (ICWS) was installed to enhance driver awareness of the traffic situation at an intersection with a restricted sight distance and a ‘Stop’ control on the minor leg (Penney, 1999). In the five years prior to the ICWS installation there were 13 reported injury accidents (Hanscom 2001, cited in Tate, 2003). Following the installation there were statistically significant reductions in approach speeds (5%, mean) of vehicles on the main road of up to 5km/h, and an increased Projected Time to Collision (PTC) for the lowest 10% of PTC’s (Penney, 1999). Similarly, a trial of active warning signs triggered by the presence of a vehicle at the intersection in Minnesota, USA resulted in speed reductions of 6.3km/h (Kwon & Ismail, 2014).
In Queensland, Australia, the Department of Transport and Main Roads have evaluated vehicle activated signs (VAS) on intersection approaches as part of a wider study of various VAS applications (Burbridge, Eveleigh, & Van Eysden, 2010). Preliminary results showed that mean and 85th
percentile speeds reduced by 2-4km/h. However, the authors noted that the study’s ability to assess speed reduction was limited by the presence of only one radar. In another Australian trial, VAS (‘Slow Down’) were installed at six intersections (Bradshaw, Bui, & Jurewicz, 2013). Although there were statistically significant speed reductions of 0.8 to 6.9km/h at four of the sites, there was an increase in mean speed of 0.5 to 3.4km/h at the remaining two sites. Bradshaw et al. (2013) identified that having two intersections with signs 300 meters apart may have reduced the effectiveness for the second sign, or that traffic completing a dog-leg manoeuvre between the two intersections may have confounded the data. The VAS signs used did not include speed limits which, like the slow down signs, are likely to be less effective than warning signs that incorporate a speed limit.
As part of a large-scale evaluation of VAS, Winnett and Wheeler (2002) studied the effects of vehicle-activated junction warning signs at four sites in the UK. The signs were activated by vehicle speeds on the major road approaches. At all sites, there was a large reduction in the proportion of vehicles travelling higher than the speed limit. Mean speeds fell, with the reductions ranging between 1.3 and 14.8km/h. Across the four sites the reduction in mean speed was 5.5km/h.
Reviews of VAS have consistently found that use of a speed limit in conjunction with a relevant warning or reason to slow down are most effective and that warning signs or speed limits alone are less credible and less effective (Baas et al., 2010; Nygårdhs & Helmers, 2007; Winnett et al., 2002). Therefore, it may be that a temporary, highly credible, and highly conspicuous change in speed limit is likely to be most effective at locations where a defined crash risk or road user vulnerability exists.
In New Zealand, VSLs have been widely used at urban schools during the morning and afternoon pick-up and drop-off times and have been successfully trialled at rural schools in higher speed environments (Mackie et al.,
2013). However, VSLs, or any other VAS, have not been tested as part of a rural intersection safety system in New Zealand. There is therefore a need to more systematically and objectively evaluate the effectiveness of a VSL based intersection safety system, and this was the focus of the present study.
MethodThis paper reports on a methodology in three parts:
• System development and site selection;• Motorist behavioural and perceptual responses to
RIAWS; and• Cross-over evaluation.
System development and site selectionTo ensure rigorous development of the RIAWS, a structured method was followed. Initially, the opinions of road safety experts were sought to develop the preliminary ideas. This was followed by a Delphi method, involving an iterative improvement process through an expert group. Finally, six focus groups with a total of 60 road safety experts were run to help refine the sign design.
Initially it was proposed that a full electronic sign should be designed specifically for the RIAWS. It was considered that, in addition to any instruction (speed limit or ‘Slow Down’), there should be a clear and obvious explanatory message. This included giving an indication of the specific risk that was present (e.g. a symbol including a vehicle on a side road). However, as the design process progressed, it was determined that using existing sign designs would provide a more cost-effective, recognisable, and understandable system. Thus, the explanatory component of the sign system was static (based on the intersection’s geometry), and was supplemented by the electronic instructional component of the system (see Figure 1).
Site selection criteria (Table 1) were determined to maximise the effectiveness of RIAWS and assist regional decision making, and Figure 2 shows the location of each site. For more detail about the individual sites, see an earlier technical report (Mackie, Scott, & Hawley, 2015).
Consistent with the site selection criteria, all of the sites had a history of injury crashes compatible with the objectives of RIAWS. Traffic volumes on the major road typically ranged between 5-10000 vehicles per day although one road had 15,000 vehicles per day. Traffic volumes on the minor road approaches ranged from 800-4,000 vehicles per day. All sites had 100km/h speed limits although a few had lower operating speeds due to curving approach geometry.
The RIAWS consists of the following elements:
• Side road high-definition radar sensors to detect approaching side road traffic approximately 150m from the intersection which then activate the main road electronic signs;

Journal of the Australian College of Road Safety – Volume 28 No. 3, 2017
14
• Side road limit line sensors (cut loops) to detect waiting traffic and trigger the end of sign activation following a delay;
• Right turn bay sensors (where right turn bays exist) 50-66m from limit line, to activate signs, plus limit line sensors to detect queuing traffic and terminate sign activation following a delay;
• VSL signs, or ‘Slow Down’ signs placed in each direction on the main road approximately 150m from the intersection;
• A central control system to manage the RIAWS and accommodate data collection equipment; and
• A Graphical User Interface (GUI) to remotely monitor the once-operational system in real-time.
Motorist behavioural and perceptual responses to RIAWSA suite of measures was used to assess and evaluate the effectiveness of the 70km/h or 60km/h VSL on through-road vehicle speed. These measures were informed by previous
studies (Charlton, 2003; Charlton & Baas, 2006; Lind, 2009; Tate, 2003; Yamanaka & Mitani, 2005) and are presented in Table 2.
All of these measures were carried out at all of the sites except for the perceptions survey and the gap analysis, which were only carried out at Himatangi due to project cost limitations.
Cross-over evaluationTwo cross-over studies using VSL and ‘Slow Down’ signs were undertaken in Northland (Puketona and Pakaraka), and in Canterbury (Kaiapoi and Burnham). Each sign was trialled at the same site over different time periods, with the alternative sign being trialled at a nearby similar site at the same time. The study design ensured that any order and
Figure 1. Examples of sign designs used in the RIAWS trial
1. Use High-Risk Intersection Guide (HRIG) identification procedures (NZ Transport Agency, 2013)2. Evidence of crash codes compatible with objectives of RIAWS, as per Montella (2010).3. Preferably higher volume major road, with side-road traffic volume lower4. Existing 100km/h major road speed limit5. Possible intersection approach visibility issues6. Relatively simple geometry (T or X)7. No planned works in short-to-medium term. Longer-term may be OK as RIAWS may provide an interim solution
(e.g. before a rural roundabout)
Table 1. RIAWS site selection criteria
6
Table 1. RIAWS site selection criteria 1. Use High-Risk Intersection Guide (HRIG) identification procedures (NZ Transport
Agency, 2013) 2. Evidence of crash codes compatible with objectives of RIAWS, as per Montella
(2010). 3. Preferably higher volume major road, with side-road traffic volume lower 4. Existing 100km/h major road speed limit 5. Possible intersection approach visibility issues 6. Relatively simple geometry (T or X) 7. No planned works in short-to-medium term. Longer-term may be OK as RIAWS
may provide an interim solution (e.g. before a rural roundabout)
Figure 2. Map of RIAWS sites
Consistent with the site selection criteria, all of the sites had a history of injury crashes compatible with the objectives of RIAWS. Traffic volumes on the major road typically ranged between 5-10000 vehicles per day although one road had 15,000 vehicles per day. Traffic volumes on the minor road
Figure 2. Map of RIAWS sites
Journal of the Australian College of Road Safety – Volume 28 No. 3, 2017
15
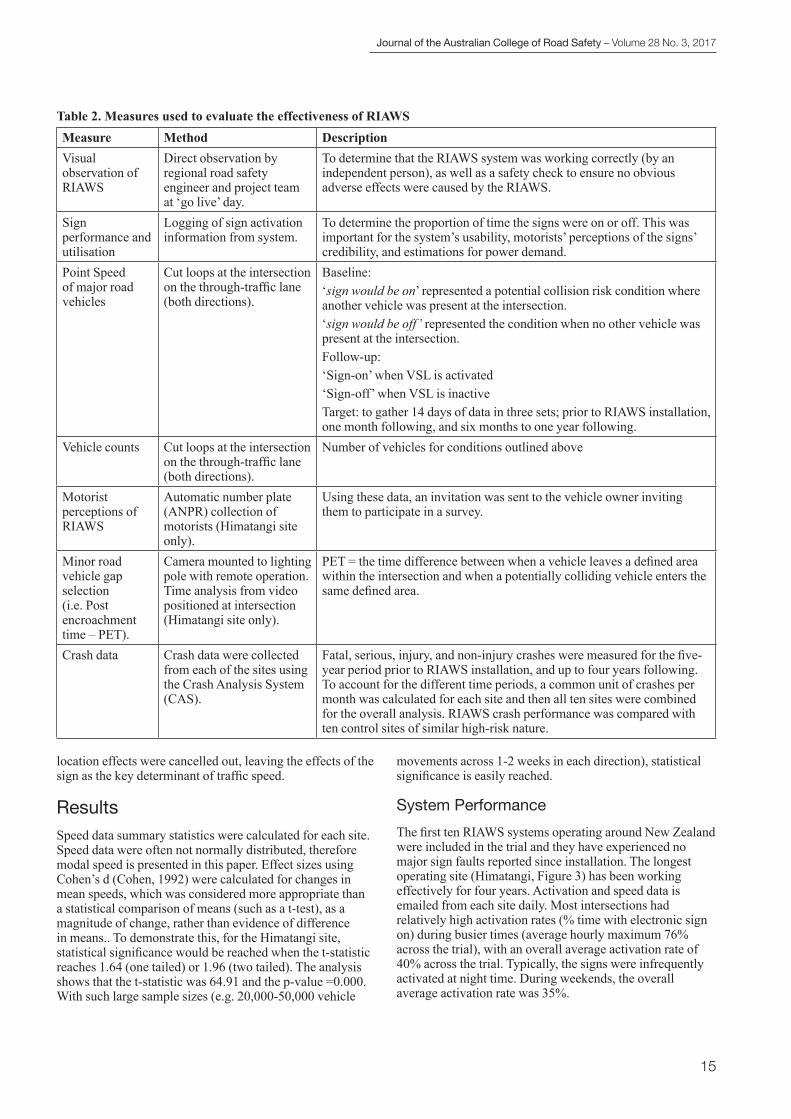
Table 2. Measures used to evaluate the effectiveness of RIAWSMeasure Method DescriptionVisual observation of RIAWS
Direct observation by regional road safety engineer and project team at ‘go live’ day.
To determine that the RIAWS system was working correctly (by an independent person), as well as a safety check to ensure no obvious adverse effects were caused by the RIAWS.
Sign performance and utilisation
Logging of sign activation information from system.
To determine the proportion of time the signs were on or off. This was important for the system’s usability, motorists’ perceptions of the signs’ credibility, and estimations for power demand.
Point Speed of major road vehicles
Cut loops at the intersection on the through-traffic lane (both directions).
Baseline: ‘sign would be on’ represented a potential collision risk condition where another vehicle was present at the intersection.‘sign would be off’ represented the condition when no other vehicle was present at the intersection. Follow-up:‘Sign-on’ when VSL is activated‘Sign-off’ when VSL is inactiveTarget: to gather 14 days of data in three sets; prior to RIAWS installation, one month following, and six months to one year following.
Vehicle counts Cut loops at the intersection on the through-traffic lane (both directions).
Number of vehicles for conditions outlined above
Motorist perceptions of RIAWS
Automatic number plate (ANPR) collection of motorists (Himatangi site only).
Using these data, an invitation was sent to the vehicle owner inviting them to participate in a survey.
Minor road vehicle gap selection (i.e. Post encroachment time – PET).
Camera mounted to lighting pole with remote operation. Time analysis from video positioned at intersection (Himatangi site only).
PET = the time difference between when a vehicle leaves a defined area within the intersection and when a potentially colliding vehicle enters the same defined area.
Crash data Crash data were collected from each of the sites using the Crash Analysis System (CAS).
Fatal, serious, injury, and non-injury crashes were measured for the five-year period prior to RIAWS installation, and up to four years following. To account for the different time periods, a common unit of crashes per month was calculated for each site and then all ten sites were combined for the overall analysis. RIAWS crash performance was compared with ten control sites of similar high-risk nature.
location effects were cancelled out, leaving the effects of the sign as the key determinant of traffic speed.
ResultsSpeed data summary statistics were calculated for each site. Speed data were often not normally distributed, therefore modal speed is presented in this paper. Effect sizes using Cohen’s d (Cohen, 1992) were calculated for changes in mean speeds, which was considered more appropriate than a statistical comparison of means (such as a t-test), as a magnitude of change, rather than evidence of difference in means.. To demonstrate this, for the Himatangi site, statistical significance would be reached when the t-statistic reaches 1.64 (one tailed) or 1.96 (two tailed). The analysis shows that the t-statistic was 64.91 and the p-value =0.000. With such large sample sizes (e.g. 20,000-50,000 vehicle
movements across 1-2 weeks in each direction), statistical significance is easily reached.
System PerformanceThe first ten RIAWS systems operating around New Zealand were included in the trial and they have experienced no major sign faults reported since installation. The longest operating site (Himatangi, Figure 3) has been working effectively for four years. Activation and speed data is emailed from each site daily. Most intersections had relatively high activation rates (% time with electronic sign on) during busier times (average hourly maximum 76% across the trial), with an overall average activation rate of 40% across the trial. Typically, the signs were infrequently activated at night time. During weekends, the overall average activation rate was 35%.

Journal of the Australian College of Road Safety – Volume 28 No. 3, 2017
16
Motorist perceptions of RIAWSMotorist perceptions of the 70km/h VSL at the Himatangi site were collected. In total, 307 motorists responded (297 posted paper, 10 online), representing a 31% response rate. Of those respondents, 68% had encountered the illuminated signs at the intersection.
Overall, motorists’ responses were positive, demonstrated not only by the latent understanding of the sign, but also the high percentage of respondents (81%) who felt the VSL would lead to a safer intersection. Most respondents correctly understood the key message from the RIAWS, with only 14% disagreeing or strongly disagreeing that the signs were easy to understand. Likewise, only 25% of respondents disagreed or strongly disagreed that the signs sent the right message. A small proportion of respondents (8%) expressed concern that drivers might ignore the sign.
Motorist behavioural responses to RIAWSSince installation over the medium to long-term, RIAWS was effective in maintaining lower traffic speeds (near the target speed of 70km/h) at almost all locations. Example speed distributions for the original Himatangi site are shown in Figure 4 below.
Results from one of the two cross-over studies, presented in Figure 5 clearly show that the 70km/h VSL signs resulted in greater speed reductions compared with the ‘Slow Down’ signs. At the sites where a ‘Slow Down’ sign was installed after a VSL sign, there were lower speeds than when the ‘Slow Down’ sign was the first sign installed. This may indicate some residual level of effect from the previous VSL sign.
10
Since installation over the medium to long-term, RIAWS was effective in maintaining lower traffic speeds (near the target speed of 70km/h) at almost all locations. Example speed distributions for the original Himatangi site are shown in Figure 4 below.
Figure 4. Speed distributions at the Himatangi site from 2012-2016 Results from one of the two cross-over studies, presented in Figure 5 clearly show that the 70km/h VSL signs resulted in greater speed reductions compared with the ‘Slow Down’ signs. At the sites where a ‘Slow Down’ sign was installed after a VSL sign, there were lower speeds than when the ‘Slow Down’ sign was the first sign installed. This may indicate some residual level of effect from the previous VSL sign.
Figure 4. Speed distributions at the Himatangi site from 2012-2016
Figure 3. The RIAWS in operation at Himatangi (side-road vehicle is shown in the circle)

Journal of the Australian College of Road Safety – Volume 28 No. 3, 2017
17
In cases where ‘Slow Down’ signs were installed, through-traffic speeds reduced in most cases, but to a much lesser extent compared with those sites where the VSL were installed. It was determined that the speed adjustment made at the ‘Slow Down’ sign was insufficient to minimise injury. Indeed, from our modelling, crashes under a ‘Slow Down’ sign would still result in severe injury. Following these findings, ‘Slow Down’ signs were replaced with 70km/h signs, and in one case (Pakaraka) 60km/h signs, remained at the sites after the trial.
Evaluation of 60km/h VSL SignAt the Pakaraka site, a 60km/h VSL sign was trialled following the conclusion of the cross-over trial (Figure 6). Although the 60km/h signs were more effective than the 70km/h signs, compliance with the 60km/h sign was lower (vehicles slowed to 5-7km/h above the limit under the 70km/h condition, and under the 60km/h condition, slowed to 11-12km above the limit). Note that mean speeds are used for this analysis as the modal data was difficult to interpret
11
Figure 5. Canterbury cross-over study of modal speed and sign type: Kaiapoi and Burnham
In cases where ‘Slow Down’ signs were installed, through-traffic speeds reduced in most cases, but to a much lesser extent compared with those sites where the VSL were installed. It was determined that the speed adjustment made at the ‘Slow Down’ sign was insufficient to minimise injury. Indeed, from our modelling, crashes under a ‘Slow Down’ sign would still result in severe injury. Following these findings, ‘Slow Down’ signs were replaced with 70km/h signs, and in one case (Pakaraka) 60km/h signs, remained at the sites after the trial.
Evaluation of 60km/h VSL Sign At the Pakaraka site, a 60km/h VSL sign was trialled following the conclusion of the cross-over trial (Figure 6). Although the 60km/h signs were more effective than the 70km/h signs, compliance with the 60km/h sign was lower (vehicles slowed to 5-7km/h above the limit under the 70km/h condition, and under the 60km/h condition, slowed to 11-12km above the limit). Note that mean speeds are used for this analysis as the modal data was difficult to interpret for some of the data sets. This performance was confirmed at a more recent RIAWS site (not included in the trial) which utilises 60km/h signs, where modal speeds have dropped to around 73km/h following travel speeds of 90km/h.
Figure 5. Canterbury cross-over study of modal speed and sign type: Kaiapoi and Burnham
12
Figure 6. Sign comparison (mean speed) at Pakaraka
Speed Results across 70km/h RIAWS sites Following RIAWS implementation, significant reductions in modal speeds (68-76km/h) were seen, compared to the baseline ‘collision risk’ condition (80-95km/h) (see Figure 7). Mean speeds also reduced significantly, but to a slightly lesser extent. Overall, these speed reductions when RIAWS is active have generally been maintained over time. The immediate post-implementation effect sizes were medium to large for the 70km/h signs (ranging from 0.4 to 2.3) and small to medium for the ‘Slow Down’ signs (ranging from 0 to 0.47). For the 70km/h signs, in locations with long straights and good visibility (Himatangi, Yaldhurst, Newbury, Kaiapoi, Burnham, and Longlands) effect sizes were larger, reflecting the greater speed reductions by through-traffic at these locations. In comparison, at sites with nearby corners and less visibility (Pakaraka, Puketona), where baseline speeds were already suppressed, the effect sizes were smaller. For sites with available medium-term data for the 70km/h VSL sign, effect sizes remained relatively stable 10 to 16 months on. This mostly remains true for the sites with longer-term data.
Figure 6. Sign comparison (mean speed) at Pakaraka
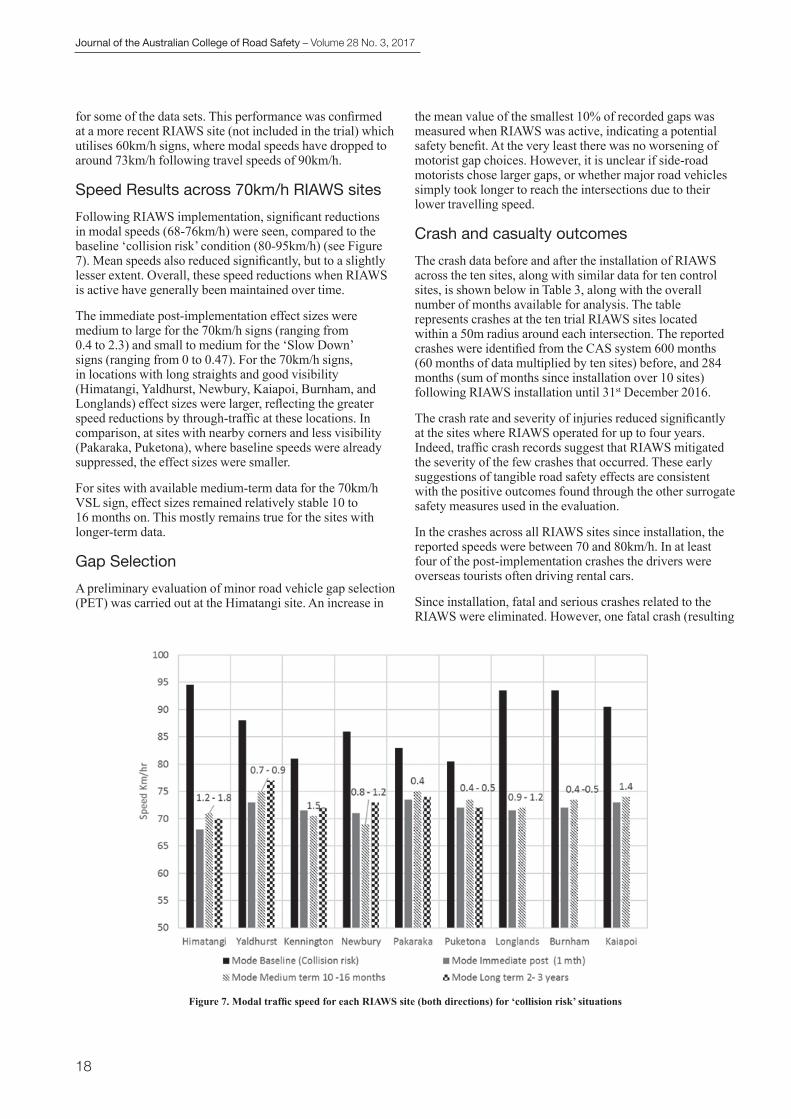
Journal of the Australian College of Road Safety – Volume 28 No. 3, 2017
18
for some of the data sets. This performance was confirmed at a more recent RIAWS site (not included in the trial) which utilises 60km/h signs, where modal speeds have dropped to around 73km/h following travel speeds of 90km/h.
Speed Results across 70km/h RIAWS sitesFollowing RIAWS implementation, significant reductions in modal speeds (68-76km/h) were seen, compared to the baseline ‘collision risk’ condition (80-95km/h) (see Figure 7). Mean speeds also reduced significantly, but to a slightly lesser extent. Overall, these speed reductions when RIAWS is active have generally been maintained over time.
The immediate post-implementation effect sizes were medium to large for the 70km/h signs (ranging from 0.4 to 2.3) and small to medium for the ‘Slow Down’ signs (ranging from 0 to 0.47). For the 70km/h signs, in locations with long straights and good visibility (Himatangi, Yaldhurst, Newbury, Kaiapoi, Burnham, and Longlands) effect sizes were larger, reflecting the greater speed reductions by through-traffic at these locations. In comparison, at sites with nearby corners and less visibility (Pakaraka, Puketona), where baseline speeds were already suppressed, the effect sizes were smaller.
For sites with available medium-term data for the 70km/h VSL sign, effect sizes remained relatively stable 10 to 16 months on. This mostly remains true for the sites with longer-term data.
Gap SelectionA preliminary evaluation of minor road vehicle gap selection (PET) was carried out at the Himatangi site. An increase in
the mean value of the smallest 10% of recorded gaps was measured when RIAWS was active, indicating a potential safety benefit. At the very least there was no worsening of motorist gap choices. However, it is unclear if side-road motorists chose larger gaps, or whether major road vehicles simply took longer to reach the intersections due to their lower travelling speed.
Crash and casualty outcomes The crash data before and after the installation of RIAWS across the ten sites, along with similar data for ten control sites, is shown below in Table 3, along with the overall number of months available for analysis. The table represents crashes at the ten trial RIAWS sites located within a 50m radius around each intersection. The reported crashes were identified from the CAS system 600 months (60 months of data multiplied by ten sites) before, and 284 months (sum of months since installation over 10 sites) following RIAWS installation until 31st December 2016.
The crash rate and severity of injuries reduced significantly at the sites where RIAWS operated for up to four years. Indeed, traffic crash records suggest that RIAWS mitigated the severity of the few crashes that occurred. These early suggestions of tangible road safety effects are consistent with the positive outcomes found through the other surrogate safety measures used in the evaluation.
In the crashes across all RIAWS sites since installation, the reported speeds were between 70 and 80km/h. In at least four of the post-implementation crashes the drivers were overseas tourists often driving rental cars.
Since installation, fatal and serious crashes related to the RIAWS were eliminated. However, one fatal crash (resulting
Figure 7. Modal traffic speed for each RIAWS site (both directions) for ‘collision risk’ situations
13
Figure 7. Modal traffic speed for each RIAWS site (both directions) for ‘collision risk’ situations
Gap Selection A preliminary evaluation of minor road vehicle gap selection (PET) was carried out at the Himatangi site. An increase in the mean value of the smallest 10% of recorded gaps was measured when RIAWS was active, indicating a potential safety benefit. At the very least there was no worsening of motorist gap choices. However, it is unclear if side-road motorists chose larger gaps, or whether major road vehicles simply took longer to reach the intersections due to their lower travelling speed.
Crash and casualty outcomes The crash data before and after the installation of RIAWS across the ten sites, along with similar data for ten control sites, is shown below in Table 3, along with the overall number of months available for analysis. The table represents crashes at the ten trial RIAWS sites located within a 50m radius around each intersection. The reported crashes were identified from the CAS system 600 months (60 months of data multiplied by ten sites) before, and 284 months (sum of months since installation over 10 sites) following RIAWS installation until 31st December 2016. The crash rate and severity of injuries reduced significantly at the sites where RIAWS operated for up to four years. Indeed, traffic crash records suggest that RIAWS mitigated the severity of the few crashes that occurred. These early suggestions of tangible road safety effects are consistent with the positive outcomes found through the other surrogate safety measures used in the evaluation.

Journal of the Australian College of Road Safety – Volume 28 No. 3, 2017
19
from fatigue); and one serious injury crash (a motorcycle hit from behind at low speed on the side road) occurred within a 50m radius of two RIAWS sites. It was established that RIAWS would not have made a difference to the outcome of those crashes. In the 50m radius around the RIAWS sites, the fatal and serious crash rate reduced by 79% from 0.35 crashes per month to 0.02 crashes per month. The overall crash rate reduced by 51% from 3.23 crashes per month to 0.92 crashes per month.
Note that these crash statistics include all crash types and so it is inevitable that some crashes will be included in the before and after statistics that the RIAWS cannot hope to influence. However, it is important to understand the intersection’s overall safety performance to comprehend the influence that RIAWS is likely to have. Given the large fatal and serious casualty reduction effect, RIAWS is clearly well designed for the major risks that exist at high-risk rural intersections.
DiscussionRIAWS effectivenessThe findings suggest that RIAWS is well accepted by the motoring public, improves motorist gap judgement (accepting longer gaps), reduces through-traffic speeds to safer levels when potential conflict situations exist, and reduces high severity crashes (and crashes in general) at high-risk rural intersections.
The speed outcomes are compelling, much more so than many other road safety countermeasures. In most situations, compliance with the 70km/h VSL was maintained and there are no examples of tangibly diminished compliance over time. Compliance with the 60km/h speed limit examples appear to be lower, despite lowering travel speeds through the intersection more than for the 70km/h signs. In addition, the VSL sign was more effective than an instructional sign alerting motorists to a potential hazard (i.e. ‘Slow Down’), which is supported by related trials from Victoria, Australia (Bradshaw et al., 2013). The longer-term findings reinforce that the RIAWS is most effective on relatively simple and
high-speed intersections where motorists have time to react to the system and adjust their behaviour.
The reasons for the success of RIAWS is of interest as it may yield clues for other speed limit and electronic sign applications. A key reason could be the credibility of the system, providing reasonable instructional information to support motorists’ existing perceptions of risk. This is consistent with other recent research evaluating the effectiveness of 20km/h speed limit signs on buses (Baas et al., 2014), and VSL trials at rural schools (Mackie & Scott, 2014). Across these studies, it was suggested that the VSL signs are effective because they are used in ‘high credibility’ locations, are attention-grabbing, noticed well in advance, and provide a clear and legal instruction to motorists with supplementary information about why motorists are being asked to slow down. For the RIAWS study, baseline speed data for the ‘sign would be on’ condition shows that even with no intervention there is some tendency for motorists to make a minor adjustment and decrease their speed when side-road vehicles are present, suggesting that the sign would therefore seem credible to motorists, and in fact may be helpful by providing overt instruction about the behaviours that are needed to stay safe (e.g. travel at 70km/h).
Although more time is needed to confirm the safety performance of RIAWS, the positive safety benefits experienced to date are likely to be a result of the high levels of compliance with the VSL. Modelling carried out as part of the development of RIAWS suggested that approach speeds of 80km/h, are likely to avoid serious or fatal injuries most of the time, and approach speeds of 60km/h are likely to result in serious or fatal injuries on very few occasions. The findings of the pre/post analysis show that intersection travel speeds of around 70km/h (and presumably lower collision speeds) are likely to be associated with a transformational reduction in fatal and serious casualties due to increased driver state awareness, increased availability of reaction time, and significantly reduced crash forces. Individual examples of crashes at RIAWS intersections have added support to the evidence for their safety performance. Indeed, the few crash records reported with RIAWS operational
Pre RIAWS Crashes per month
Post RIAWS Crashes per month
% Reduction
Net Reduction
Ten RIAWS Sites (600 months pre, 284 months post)
Fatal and serious 0.35 0.02 -93% -79%Minor injury 1.40 0.26 -81% -49%Non-Injury 1.48 0.64 -57% -48%All crashes 3.23 0.92 -71% -51%
Ten Control Sites (600 months pre, 300 months post)
Fatal and serious 0.35 0.30 -14%Minor injury 1.28 0.87 -32%Non-Injury 1.13 1.03 -9%All crashes 2.77 2.20 -20%
Table 3: Post-RIAWS crash history across ten trial sites and ten control sites

Journal of the Australian College of Road Safety – Volume 28 No. 3, 2017
20
indicate approach speeds between 70 and 80km/h and drivers seeing and reacting to the VSL signs. This reinforces that that some crashes may have been more severe if the RIAWS were not in place.
Design considerations for RIAWSSince the original RIAWS installations, improvements and modifications were suggested, and in some cases implemented. For example, a pulsing roundel (by flashing the inner or outer LED rings while leaving neighbouring rings illuminated) instead of separate flashing lights was a recent change to the sign design. This appears to be effective and is likely to be utilised in the future.
The most successful RIAWS applications were on long, straight roads where motorists have plenty of time to react to the active VSL. For curving roads with approaches with limited visibility, it may be that supplementary advanced signage is needed to prepare motorists for a potentially changed speed limit ahead. However, this has not been a large problem to date.
While VSL signs are effective in capturing drivers’ attention, their presence may influence the recognition of existing nearby signs (Rama, Luoma, & Harjula, 1998). This was raised when comparing the relative effectiveness of the VSL sign and the supplementary intersection sign immediately below. The VSL sign, with its moving elements, grabbed attention and the supplementary sign could potentially be overlooked. However there have been no reports of credibility issues associated with the system.
Operational limitations of RIAWSRIAWS isn’t considered a ‘Safe System’ treatment at high-risk rural intersections. Rural roundabouts are considered a ‘Safe System’ treatment due to their inherent safety and ability to accommodate many types of errors. It could be argued that a RIAWS does not accommodate motorists who deliberately violate the speed limit or somehow do not respond to it, and therefore expose intersecting vehicles to potentially fatal side impact crash forces. The intention with RIAWS was to at least reduce the impact speeds to potentially 50-60km/h on impact. Crash examples have shown this performance has been exceeded, which may account for the high safety performance. Furthermore, the safety performance of RIAWS to date is close to the performance that has been reported for rural roundabouts (Newstead & Corben, 2001; NZ Transport Agency, 2013).
However, RIAWS is significantly more cost effective than a rural roundabout. A challenge may therefore occur where a RIAWS is used as an interim measure pending a rural roundabout. If the RIAWS performs to a high level, as demonstrated in this trial, then the business case for a rural roundabout may be poor and it may not proceed. Conversely, a greater number of high-risk intersections may be treated using RIAWS than if rural roundabouts alone are considered and so potentially the network wide safety performance of RIAWS might exceed that of a rural roundabout for a given level of investment.
Study limitationsAlthough the RIAWS evaluation was relatively comprehensive and the performance of RIAWS was clearly very positive, a longer period to measure the safety performance at the various RIAWS sites is desirable to give more confidence to these findings.
This trial focused on the high-risk intersections targeted by selection criteria (Table 1). Although a variety of intersection types have had RIAWS installed, the trial intersections were deliberately chosen for their relatively simple attributes, with few complicating features such as multilane roads, complex geometry, or existing engineering features. It is not yet certain whether RIAWS would be equally as effective at more complex intersections and next steps could consider these intersection types.
Future work, implications for further use The evidence given in this paper supports further use of RIAWS to mitigate risk at high-risk rural intersections. The ultimate success of RIAWS - a reduction in DSIs, will be measured over a five-year period to determine the safety performance at each intersection. Apart from preliminary measures of gap acceptance by side-road motorists, the trials have not focussed on the role of side-road or right-turning vehicles in potential intersection crash situations. Further work to understand the mechanisms of intersection crashes or the effectiveness of various intersection safety countermeasures, may consider the situational awareness and behaviour of side-road vehicles. Additionally, future research could examine the effectiveness of different variable message sign warning systems as part of RIAWS, such as weather events (e.g. fog, ice, wind, wet and slippery), or blocked lanes (e.g. crash, tree branch, truck spill).
ConclusionThe trial of RIAWS at ten intersections around New Zealand showed positive results and the trial objectives were achieved. RIAWS is feasible, operates well, is effective, is perceived positively by the motoring public, and has shown tangible safety benefits consistent with the ‘Safe System’ approach. All ten RIAWS trial sites remain in service and additional RIAWS sites have been implemented.
AcknowledgementsThe development, implementation, and evaluation of RIAWS is part of a wider programme to address safety at high-risk intersections as part of the government’s Safer Journeys road safety strategy and associated action plans. The authors would like to acknowledge The NZ Transport Agency for funding the RIAWS trial and Armitage Group for assistance in designing and installing the systems.
Journal of the Australian College of Road Safety – Volume 28 No. 3, 2017
21
ReferencesAarts, L., & van Schagen, I. (2006). Driving speed and the
risk of road crashes: A review. Accident Analysis & Prevention, 38(2), 215-224. doi:http://dx.doi.org/10.1016/j.aap.2005.07.004
Archer, J., Fotheringham, N., Symmond, M., & Corben, B. (2008). The impact of lowered speed limits in urban and metropolitan areas. Retrieved from Melbourne, Victoria:
Baas, P. H., Charlton, S., Taramoeroa, N., & Edgar, J. (2010). School bus safety. Retrieved from NZ Transport Agency. Wellington, New Zealand:
Baas, P. H., de Pont, J., Mackie, H. W., Cotterill, L., Gascoigne, J., & Scott, R. (2014). The Ashburton 20km/h school bus signs trial. Retrieved from NZ Transport Agency. Wellington, New Zealand:
Bradshaw, C. L., Bui, B., & Jurewicz, C. (2013). Vehicle Activated Signs: An emerging treatment at high risk rural intersections. Paper presented at the Australasian Road Safety Research Policing Education Conference, Brisbane, Australia.
Burbridge, A., Eveleigh, M., & Van Eysden, P. (2010). Queensland Experiences with Vehicle Activated Signs. Paper presented at the Australasian Road Safety Research, Policing and Education Conference., Canberra, Australia.
Charlton, S. G. (2003). Restricting intersection visibility to reduce approach speeds. Accident Analysis & Prevention, 35(5), 817-823.
Charlton, S. G., & Baas, P. H. (2006). Assessment of hazard warning signs used on New Zealand roads (288). Retrieved from Land Transport New Zealand. Wellington, New Zealand:
Cohen, J. (1992). A power primer. Psychological Bulletin, 112(1), 155-159.
Fildes, B., & Lee, S. (1993). The speed review: Road environment, behaviour, speed limits, enforcement and crashes. Retrieved from Canberra:
Garber, N. J., & Gadiraju, R. (1989). Factors affecting speed variance and its influence on accidents. Retrieved from Washington DC:
Kwon, T. M., & Ismail, H. (2014). Advanced LED Warning System for Rural Intersections: Phase 2 (ALERT-2).
Lind, G. (2009). Estimation of safety benefits of VSL at intersections and on weather-controlled links. Paper presented at the 27th International Baltic Road Conference, Riga, Latvia.
Mackie, H. W. (2010). Rural Intersection Active Warning Systems: Review of Information and Recommendations Stage 1 Report. NZ Transport Agency,TERNZ Ltd.
Mackie, H. W., Gulliver, P., Scott, R. A., Hirsch, L., & Ameratunga, S. (In Press). Serious injury crashes: How do they differ from fatal crashes? What is the nature of injuries resulting from them? Retrieved from
Mackie, H. W., Russell, M., Holst, K., Brodie, C., & Lilley, M. (2013). Variable speed limit trials at rural intersections and rural schools in New Zealand. Paper presented at the ITS Asia Pacific Forum.
Mackie, H. W., & Scott, R. A. (2014). Implementation and monitoring of variable speed limit signs at rural schools: Stage 2. NZ Transport Agency.
Mackie, H. W., Scott, R. A., & Hawley, G. (2015). Rural Intersection Active Warning System (RIAWS) Trial, Final Report. Retrieved from NZ Transport Agency. Wellington, New Zealand:
Ministry of Transport. (2010). Safer Journeys - New Zealand’s Road Safety Strategy 2010-2020. Retrieved from Wellington:
Montella, A. (2010). A comparative analysis of hotspot identification methods. Accident Analysis & Prevention, 42(2), 571-581.
Newstead, S. V., & Corben, B. F. (2001). Evaluation of the 1992–1996 Transport Accident Commission Funded Accident Blackspot Treatment Program in Victoria. Retrieved from Clayton, Victoria, Australia:
Nilsson, G. (2004). Traffic Safety Dimensions and the Power Model to Describe the Effect of Speed on Safety. Retrieved from Lund:
Nygårdhs, S., & Helmers, G. (2007). VMS–Variable Message Signs: A literature review. Retrieved from Linköping, Sweden:
NZ Transport Agency. (2013). High-risk intersections guide. Retrieved from Wellington, New Zealand:
Penney, T. (1999). Intersection collision warning system: Techbrief. Retrieved from Virginia:
Rama, P., Luoma, J., & Harjula, V. (1998). Distraction due to variable speed limits. Traffic engineering and control, 39, 234-237.
Richards, D., & Cuerden, R. (2009). The relationship between speed and car driver injury severity. Road Safety Web Publication.
Tate, F. N. (2003). JAWS: The Safety Impact of a Junction Action Warning System. (PhD), University of Leeds (Institute forTransport Studies).
Winnett, M. A., & Wheeler, A. H. (2002). Vehicle-activated signs: a large scale evaluation.
Wramborg, P. (2005). A new approach to a safe and sustainable road structure and street design for urban areas. Paper presented at the In Proceedings of the Road Safety on Four Continents Conference, Conference Sponsor.
Yamanaka, H., & Mitani, T. (2005). Vehicle behavioral safety assessment for unsignalized small intersections to evaluate collision avoidance system. Journal of the Eastern Asia Society for Transportation Studies, 6, 2667-2675.
Journal of the Australian College of Road Safety – Volume 28 No. 3, 2017
22
Superstitious beliefs and practices in Pakistan: Implications for road safetyAhsan Kayani1,2, Judy Fleiter3,4 and Mark King2
1National Highways & Motorways Police, Pakistan 2Centre for Accident Research and Road Safety-Queensland (CARRS-Q), Queensland University of Technology (QUT), Australia3School of Psychology and Counselling, Queensland University of Technology (QUT), Australia4Global Road Safety Partnership,Geneva, Switzerland
Corresponding Author: Mark King, CARRS-Q, QUT, 130 Victoria Park Rd, Kelvin Grove QLD 4059, [email protected], +617 3138 4546.
Key Findings• In Pakistan superstitious beliefs about crash causes and risks are common.• These beliefs are shared by police and policy makers as well as drivers.• Evidence-based approaches need to be promoted, taking cultural context into account.
AbstractSuperstitious beliefs and practices represent barriers to safety-related behaviours, yet have received minimal research attention. To examine road crash causation perceptions, particularly the role of superstition, religious and cultural beliefs, 30 interviews with drivers, police, religious orators and policy makers were conducted in three Pakistani cities. Analyses revealed a variety of superstition-based crash attributions, including belief in the role of evil eye (malignant look) and use of black magic by rivals/enemies to bring harm. Popular conceptions of religion and use of objects and practices believed to prevent harm were reported. This research sought to gain an understanding of the nature of the relationship between superstitious attributions and the behaviours, with a view to informing road safety promotion and policy. It seems apparent that road safety countermeasures common in western countries may have little/no impact if the audience does not see such issues as valid reasons for why harm may occur.
KeywordsCross-cultural, Fatalism, Risk perception, Road safety, Road user behaviour, Superstition
IntroductionRoad traffic injuries and fatalities are a significant public health problem and the largest potential for reducing harm is said to lie in less-developed countries (WHO, 2015). Pakistan is one such country and road crashes are one of the major civic problems there. Road fatalities in Pakistan are relatively high compared to other South Asian countries (Kayani, Fleiter & King, 2014) and significantly greater than the burden of road trauma experienced by developed countries (WHO, 2015).
Attitudes have been demonstrated to be an important human factor associated with road user behaviours. Superstitious beliefs represent a specific category of attitudes (Vyse, 2013; Dixey, 1999; Foster & Kokko, 2009; Torgler, 2007) which can influence behaviour in various social situations (Hira, Fukui, Endoh, Rahman & Maekawa, 1998). Superstition is “a belief or practice resulting from ignorance, fear of the unknown, trust in magic or chance, or a false conception of causation” (Foster & Kokko, 2009:31) and may involve
attribution of negative events to transgression of taboos, the actions of ancestors, jealousy from others, and “witchcraft” (Dixey, 1999). It has been argued elsewhere (Kayani, King & Fleiter, 2011) that the concepts of superstition and fatalism overlap conceptually and in practice, with the difference being that when fatalism is invoked, actions are attributed to an all-powerful agent (e.g., God) whereas superstition relates to other forms of supernatural forces that can be propitiated (with sacrifices, offerings, prayers), averted (with amulets, spells, charms) or even controlled (with magic and witchcraft). Vyse (2013) describes the different forms of superstition, which include (at one end of the spectrum) “bad luck” associated with a chance occurrence (e.g. breaking a mirror is said to bring seven years bad luck in some traditions) while at the other end of the spectrum there is an overlap with religious beliefs.
Several authors (Dixey, 1999; Kouabenan, 1998) have identified high degrees of superstition among various

Journal of the Australian College of Road Safety – Volume 28 No. 3, 2017
23
categories of drivers in Nigeria and the Ivory Coast and found that to avoid danger, people practice certain rituals. Dixey (1999) reported that adherence to beliefs in traditional African deities is observed across followers of major religions (Islam and Christianity), such that many people consult babalawos (Ifa priests) before a journey. Bastian (1992) noted that death is rarely seen as a natural phenomenon in any Nigerian culture. Furthermore, a study of 245 Nigerian university students revealed that the majority of the participants thought death was caused by the “work of wicked people”, the gods or other forces (Jimoh, 1985). It has also been observed in Nigeria that some vehicle drivers believe in wearing charms or talismans to protect their vehicles from road crashes or so they can miraculously escape when a crash occurs. It was reported that people having such beliefs behave imprudently, disregard precautionary measures, and believe that such amulets will keep them safe (Sarma, 2007). Furthermore, it was reported that if they experience a road crash, in spite of this magical precaution, people believed that witches, wizards, secret societies or demons are responsible. Peltzer and Renner (2003) report similar findings from a study of superstition, risk-taking and risk perception of crashes among South African taxi drivers. To date, this topic as it relates to road user behaviour has received no research attention in Pakistan, a country where fatalism is prevalent (Acevedo, 2008) and cultural practices are likely to influence beliefs and attitudes (Kayani et al., 2014).
The research reported in this paper aimed to better understand the nature of superstitious beliefs relating to road use in Pakistan and its implications for improving road user behaviour there and elsewhere. In approaching the research it was borne in mind that Pakistan has a long cultural history which includes centuries of Hinduism and the influence of invaders, followed by the influence of Islam with its own Arab roots. Account was also taken of levels of education, because it has been argued that superstitious beliefs are a result of having lower education (Peltzer & Renner, 2003) although there is evidence of superstition not only in more educated developed nations (Torgler, 2007; Hira et al., 1998), but also among more educated people within developed nations (Barro & McCleary, 2002; Mears & Ellison, 2000). It has been demonstrated elsewhere (Kayani, King & Fleiter, 2012) that fatalism is present across all levels of education in Pakistan. Therefore, it is reasonable to consider that a similar spread of superstitious beliefs might also be expected.
Methods
ParticipantsUsing a focused ethnographic approach, in-depth, semi-structured interviews were conducted with 30 participants (aged from 24 to 63 years, median age of 46 years) in the three major cities of Lahore, Islamabad and Rawalpindi in Pakistan. This study used three forms of qualitative sampling: purposive (selecting particular groups); criterion (experienced in road use in Pakistan); and snowball (identified by other participants), and the findings presented
here represent part of a larger research project that sought to investigate the role of fatalism and cultural practices in un/safe road use in Pakistan. Participants included twelve professional drivers (3 taxi drivers, 6 truck drivers and 3 bus drivers recruited at their workplaces or where they gathered together), 5 car drivers, 7 police officers, 4 policy makers (working in areas related to road safety) and 2 religious orators (added during the study because the issues of interpretation of religion emerged during interviews). With the exception of one Christian driver and a Sikh field police officer, all participants were Muslims, and all the quotes presented below are from Muslim participants. For comparison purposes, national data (Pakistan Bureau of Statistics, 2017) indicates that the largest proportion of the Pakistani population identifies as Muslim (96.28%) with the remainder identifying as Christian (1.59%), Hindu (1.85%, combining what the source refers to as “Jati” and “scheduled castes”), Ahmadi (0.22%) or other (0.07%). The majority of the sample was male, with only two female participants (a car driver and a field police officer). All the professional drivers, one car driver, one field police officer, and two religious orators, had a high school degree or no education, while other participants, (e.g., car drivers, field police, and policy officers) had tertiary education qualifications. The majority of participants reported having experienced at least one road crash in their driving history, and almost every participant confirmed that relatives, friends and/or colleagues had been killed and severely injured in road crashes.
Materials and ProcedureEthical clearance for the research was provided by the relevant University Human Research Ethics Committee. Participants were approached personally (by the first author), and the purpose of the research was explained verbally in the first instance. For all interviews, verbal consent was obtained and participants were not paid for their participation. All interviews were audio-recorded with consent. An interview guide with simple prompt questions was developed and participants were interviewed individually for approximately 60 minutes. The prompt questions were designed to elicit discussion of the beliefs that participants had about road crashes and their prevention, and spanned fatalistic, superstitious, religious and cultural beliefs, (e.g., Why do you think road crashes happen?; Why are some people involved in road crashes and some are not?), though this paper only focuses on superstitious beliefs and related cultural practices. Participants were interviewed individually, all but one in Urdu, one of the two official languages in Pakistan (the other is English, which was used in the remaining interview). Because of the nature of the subject being explored and the limited amount of information in the literature, one-to-one in-depth interviews were considered an appropriate research method. Audio recordings were transcribed and translated by a separate translator using the concept of meaning translation (Esposito, 2001) and the first author (interviewer) checked translations for validity and reliability. Additionally, to ensure validity and integrity of the back translation process, a bilingual researcher (not associated with the
Journal of the Australian College of Road Safety – Volume 28 No. 3, 2017
24
research design or data collection) checked a random sample of transcripts (Beaton, Bombardier, Guillemin & Ferraz, 2000). Analysis of transcripts was conducted using thematic analysis (Rice & Ezzy, 1999) and all analyses were undertaken with the intention of understanding, not of prediction (see Sanderg, 2005). Note that comments made by participants about their beliefs are their own and do not constitute any judgment or statement on the part of the authors, and no comment is made as to whether these stated beliefs are correct or incorrect.
FindingsA range of superstitious beliefs were described by participants as responsible for crash causation and crash involvement among the sample. Urdu vernacular does not translate readily into English vernacular, which is the one of the challenges in presenting participant quotations. However, where possible, the flow of words and common expressions has been preserved. Information about the participant type, gender, age and level of education is provided after each quotation. The term ‘Int:’ is used to indicate comments by the interviewer.
Superstition and the Malicious Acts of OthersEvil eye
The concept of evil eye (literal translation is “malignant look”) was the most commonly described superstition relating to road crashes. Evil eye refers to the concept of looking at something or someone with the intention of creating harm or wishing for something bad to happen to another, often because of jealousy over the good fortune of other people (i.e., because they have a new car, good job, smart clothes), as illustrated by these quotations:
Int: Do you think evil eye can contribute to a road crash?
Yes, it is certain it is a dangerous thing.
Int: How does it affect (the chance of a crash)?
It depends on the person, how much they believe in these things. But I do believe in these things and that they can hurt us. Male Police officer aged 35, with Bachelor Degree
I had a road accident while performing my duty. I tried to stop a car that had made violations. He hit me while I was trying to stop him. I got seriously injured. The reason was that on that day I was looking very smart and some people made an evil look at me and I got evil eye. Male Police officer aged 30, Bachelor Degree
The term may also apply in a non-malicious sense in that evil eye was also described as occurring if someone praises something too much (e.g. lots of praise for a new car) or if the owner is overly proud of something. The wishing of harmful or jealous feelings or to look at something with the
intention that someone receives trouble was described by participants as looking with “tyrant eyes”, whereas the act of praising something too much or liking something too much was described as looking with “kind eyes”. Both tyrant and kind eyes (looks) were expressed as forms of evil eye.
Evil eye was described as a possible cause of road crashes as well as being detrimental to one’s lifestyle, business and performance. It was noted that the impact of evil eye was perceived to be borne by the object that had the “look” directed towards it. For example, if a person was on the receiving end of evil eye, the loss would be borne by his/her body (e.g., injury, death, disease), whereas if a vehicle attracted evil eye, the vehicle would experience mechanical faults or a crash. The concept of evil eye was also described in relation to envy or jealousy of someone’s position, advantages or possessions. The large gap between rich and poor within society was noted by some and commented upon with respect to why jealousy may occur. For example:
In a social set up, jealousy is a great factor in Asia, particularly like in Pakistan, India, Nepal, Sri Lanka, and Bhutan. Keeping in view this jealousy factor, for example, if someone was a [bus] conductor, then after [some time] he was able to buy a bus, the other drivers who were not able to have their own bus and could not rise to a better position [may] have a feeling of jealousy towards that person. This jealousy factor creates malignant look for that driver. For that purpose he writes holy verses on his vehicle or uses amulets [to protect against evil eye].Male Police officer aged 48, Masters Degree
Religious association with superstition and evil eyeIt was also noted that the concept of evil eye was linked to religious concepts by some participants. People who did not believe in other superstitious things (e.g., bad luck or bad omens) expressed a belief in the existence of evil eye because they thought it had been mentioned in religious teachings. They stated that the Islamic religion also provided information that evil eye could affect one’s performance and cause personal harm and damage to belongings. Furthermore, it was reported that this could also affect driver performance and cause road crashes. For example:
Int: Does malignant look [evil eye] have a role in road crashes?
From the Islamic point there is such a thing. If we relate this thing with religion it is obviously present [if you want to find answers about this in religion, the answers are there]. Male Police officer aged 48, Masters Degree
It was noted that some participants who expressed stronger religious views also expressed non-superstitious beliefs. In comparison, those who expressed less religious beliefs also expressed beliefs in superstition. Some participants reported the belief that there is no role for superstition in religion and that those who were inclined to seek help from superstitious
Journal of the Australian College of Road Safety – Volume 28 No. 3, 2017
25
methods were deemed to be distant from religion. Indeed, it was explicitly expressed by some that superstitions had no religious basis at all. For example:
I don’t believe in such things [evil eye, bad omens] according to my faith. These things can never save you from accidents. It’s absurd to think that a shoe or a piece of black cloth can save you from accidents. If God’s name [will of God] can’t save us from the happening of bad things, how can things like a shoe?
Int: What is the percentage of people, in your view who believe in such things?
Majority of people believe in such things. But I don’t because I know about my religion and there is no such thing in my faith [Islam]. Male truck driver aged 59, 5 years schooling
In the quotation above, reference is made to use of shoes and cloth. The practices of tying children’s shoes or black cloth to a vehicle are common preventive methods used in Pakistan in the belief that they keep people and vehicles safe from harm. This topic is discussed in greater detail towards the end of this section of the paper. Information in the interview transcripts suggested that people who were less educated were more likely to express superstitious beliefs and more likely to seek out readily available information on steps they could take to reduce their fears (through a presumed reduction in the chances of adverse events). This information is more available, and possibly more valued, when it is learned from avenues such as family members and others around them. It is the experience of the first author, a Pakistani citizen, that many uneducated people rely heavily on the teaching of their parents as the primary way of learning about coping with life’s difficulties, though it is recognized that family members are an important source of learning across all sections of the Pakistani community. Beyond parents, people may consult Saints (living holy people who have acquired saintly status), traditional healers, and religious orators/teachers. Whereas religious scholars (or Sheikhs) have a formal knowledge of Islam, saints do not, but have acquired their status through local reputation for their personality, spirituality or mystical powers.
If I completely had taken care of myself, like tying black threads or a small shoe on my new motorbike as advised by my family, I would not have been affected by evil eye. My parents used to say that black threads or clothes should be wrapped on a new bike so as to save it from evil eye. Male car driver aged 28, 10 years schooling
It was noted that some participants consider that superstitious beliefs exist among both educated and uneducated members of society, including police. For example:
The majority of people do [believe in superstition], even if they have done a Masters in education. Our society is like that. It [belief in superstitions] prevails everywhere. Male Police officer aged 52, 10 years schooling
Int: How many of your police colleagues believe in bad omens and use amulets to avoid them?
Many of my colleagues believe in these things. Female Police officer aged 36, Masters Degree
An Islamic religious orator expressed belief in the concept of evil eye and thought that it could contribute to road crashes. He also used it as an explanation for his own involvement in crashes. This suggests that people who have limited formal education and knowledge and who seek guidance from Islamic religious orators may be exposed to information that is based on superstition, rather than on more scientific explanations of crash causation. However, as can be seen from the quote below, the same orator who expressed the belief in the existence of evil eye did not express belief in the use of amulets to prevent it. Rather, he indicates the belief that the use of Sadqa can prevent evil eye. Sadqa is a form of charity where money, clothes or food are distributed to the needy in order to obtain the blessings of the creator and to avoid the possibility of bad events (Qidwai, Tabassum, Hanif & Khan, 2010).
Int: Is the use of amulets and charms like black cloth or shoes good to avoid evil eye?
No. For this purpose use Sadqa [charity]. Amulets are useless.
Int: If we don’t use Sadqa, will the evil eye affect our performance?
Yes it works, and we can face an accident. There are some evil eyes that can break stone. People who have jealousy, it has a very acute effect. There are some verses about this. The best solution is to give Sadqa and take help from Holy verses to avoid this. It has great impact. Male Religious orator aged 63, 5 years schooling
In contrast, the other orator described his belief that the use of amulets, talismans and charms would protect people from evil eye, as demonstrated in the following quotation.
Actually we make a thing, to some extent, dull so that it does not look so beautiful and will not attract attention. If something is very beautiful it catches evil eye. If we make it ugly by tying a shoe or black cloth it does not catch evil eye. Male Religious orator aged 37, 8 years schooling
Black Magic Another commonly discussed superstition was belief in mystical powers and practices, such as black magic. Black magic was described as a curse placed upon one person by another person with malicious intent, often because of jealousy, in order to bring them bad luck or misfortune. It was noted that black magic could be used to control the mind and impair driving performance, thus creating a situation where a driver is “forced” to make a mistake which would then lead to a crash. The following quotation is from a well-educated police officer.
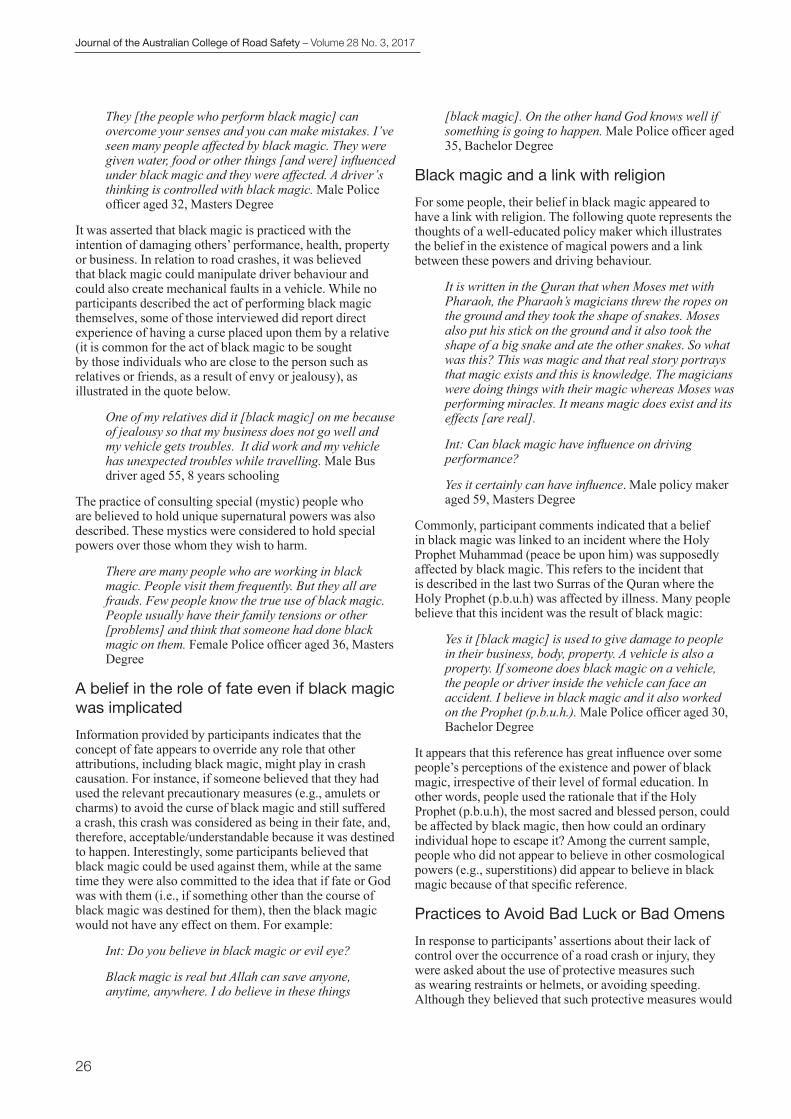
Journal of the Australian College of Road Safety – Volume 28 No. 3, 2017
26
They [the people who perform black magic] can overcome your senses and you can make mistakes. I’ve seen many people affected by black magic. They were given water, food or other things [and were] influenced under black magic and they were affected. A driver’s thinking is controlled with black magic. Male Police officer aged 32, Masters Degree
It was asserted that black magic is practiced with the intention of damaging others’ performance, health, property or business. In relation to road crashes, it was believed that black magic could manipulate driver behaviour and could also create mechanical faults in a vehicle. While no participants described the act of performing black magic themselves, some of those interviewed did report direct experience of having a curse placed upon them by a relative (it is common for the act of black magic to be sought by those individuals who are close to the person such as relatives or friends, as a result of envy or jealousy), as illustrated in the quote below.
One of my relatives did it [black magic] on me because of jealousy so that my business does not go well and my vehicle gets troubles. It did work and my vehicle has unexpected troubles while travelling. Male Bus driver aged 55, 8 years schooling
The practice of consulting special (mystic) people who are believed to hold unique supernatural powers was also described. These mystics were considered to hold special powers over those whom they wish to harm.
There are many people who are working in black magic. People visit them frequently. But they all are frauds. Few people know the true use of black magic. People usually have their family tensions or other [problems] and think that someone had done black magic on them. Female Police officer aged 36, Masters Degree
A belief in the role of fate even if black magic was implicated Information provided by participants indicates that the concept of fate appears to override any role that other attributions, including black magic, might play in crash causation. For instance, if someone believed that they had used the relevant precautionary measures (e.g., amulets or charms) to avoid the curse of black magic and still suffered a crash, this crash was considered as being in their fate, and, therefore, acceptable/understandable because it was destined to happen. Interestingly, some participants believed that black magic could be used against them, while at the same time they were also committed to the idea that if fate or God was with them (i.e., if something other than the course of black magic was destined for them), then the black magic would not have any effect on them. For example:
Int: Do you believe in black magic or evil eye?
Black magic is real but Allah can save anyone, anytime, anywhere. I do believe in these things
[black magic]. On the other hand God knows well if something is going to happen. Male Police officer aged 35, Bachelor Degree
Black magic and a link with religionFor some people, their belief in black magic appeared to have a link with religion. The following quote represents the thoughts of a well-educated policy maker which illustrates the belief in the existence of magical powers and a link between these powers and driving behaviour.
It is written in the Quran that when Moses met with Pharaoh, the Pharaoh’s magicians threw the ropes on the ground and they took the shape of snakes. Moses also put his stick on the ground and it also took the shape of a big snake and ate the other snakes. So what was this? This was magic and that real story portrays that magic exists and this is knowledge. The magicians were doing things with their magic whereas Moses was performing miracles. It means magic does exist and its effects [are real].
Int: Can black magic have influence on driving performance?
Yes it certainly can have influence. Male policy maker aged 59, Masters Degree
Commonly, participant comments indicated that a belief in black magic was linked to an incident where the Holy Prophet Muhammad (peace be upon him) was supposedly affected by black magic. This refers to the incident that is described in the last two Surras of the Quran where the Holy Prophet (p.b.u.h) was affected by illness. Many people believe that this incident was the result of black magic:
Yes it [black magic] is used to give damage to people in their business, body, property. A vehicle is also a property. If someone does black magic on a vehicle, the people or driver inside the vehicle can face an accident. I believe in black magic and it also worked on the Prophet (p.b.u.h.). Male Police officer aged 30, Bachelor Degree
It appears that this reference has great influence over some people’s perceptions of the existence and power of black magic, irrespective of their level of formal education. In other words, people used the rationale that if the Holy Prophet (p.b.u.h), the most sacred and blessed person, could be affected by black magic, then how could an ordinary individual hope to escape it? Among the current sample, people who did not appear to believe in other cosmological powers (e.g., superstitions) did appear to believe in black magic because of that specific reference.
Practices to Avoid Bad Luck or Bad OmensIn response to participants’ assertions about their lack of control over the occurrence of a road crash or injury, they were asked about the use of protective measures such as wearing restraints or helmets, or avoiding speeding. Although they believed that such protective measures would

Journal of the Australian College of Road Safety – Volume 28 No. 3, 2017
27
not work, participants described various superstitious and religious practices that are believed to protect people from harm, including road crashes. The quote below from a truck driver describes the practice of using a piece of green cloth to protect vehicles and prevent crashes. In Pakistan, it is common for people to put large pieces of green cloth at the tombs of Saints. Some people remove small portions of the cloth to use in their vehicles as a form of protection from harm.
People who follow Saints do these kinds of things. They also use green cloth in their vehicle. I also have green big cloth on my vehicle for good omens. When we buy a vehicle we go to Saints and distribute food at Saints’ tombs and take the green cloth. In this way we can keep safe from bad happenings. Male truck driver aged 26, no formal schooling
Talismans, amulets and charms were described as being used to combat evil eye and bad omens as well as to avoid road crashes. Commonly mentioned talismans and amulets were black and red strips of cloth, horses’ hooves and hair, peacock feathers, wigs, and shoes. Black cloth is usually attached to the outside of the vehicle, a horse’s hoof is placed within the body of the vehicle, and red strips and horse hair are fixed within the cabin of the vehicle. Amulets placed outside the vehicle are intended to be visible so that other vehicles and the malicious looks or feelings from other people do not harm the vehicle or driver. Below, a truck driver describes his use of such objects to protect a new vehicle from harm:
Int: Do you use these as precautions?
Yes, when I bought a new van I tied a horse’s hoof and an old shoe to it. I also have holy verses in my vehicle. I think it saved me from bad omens. Male truck driver aged 60. Primary school education
Finally the practice of using drood was described. Drood refers to the practice of having a holy breath blown on a person. In this practice, a person stands in front of a living Saint or a devout person who recites sacred or holy verses, then gently blows in the direction of the person requiring a blessing and assistance. Some participants described the use of this practice as a way of helping to protect them from any bad happening while travelling, such as disease or road crashes. For example:
We go to Pir (Saint) for drood for our own satisfaction. Allah also helps. There are certain things in which Allah has bestowed to his pious people (Pir). Allah listened to them who pray for us. I have this belief. Male car driver aged 28, high school education
DiscussionThe information provided by participants indicates that many superstitious beliefs are present in Pakistan and that such beliefs appear to be perceived by some people as the reason why road crashes occur. A variety of superstition-based crash attributions were widely discussed. For
instance, crashes were noted as being caused by evil eye (the malignant look of others), or black magic that had been performed by others. The information provided by participants indicated that there are many religious and cultural beliefs linked to perceptions of crash causation, regardless of education level, age, gender, or religion. The findings also revealed that police officers and officials themselves demonstrated a range of superstitious and other beliefs. It is difficult to determine exactly how many people in Pakistan believe in such practices. However, as noted earlier, this topic was commonly discussed among the different types of participants included in this study. Therefore, it is important to consider the role that such beliefs may play in regard to road use in Pakistan.
It has been demonstrated that fatalism is linked to both risky road use and the under-reporting of road crashes in Pakistan (WHO, 2015; Kayani et al., 2012). The information presented in the current paper indicates that superstitions did not appear to be an alternative to religious beliefs for all people. Like fatalism, superstitious beliefs are widespread, but their level of acceptance does not appear to be as universal, and fate appeared as the “default attribution” for a crash when all other explanations failed to account for the incident. However there is sufficient evidence from the findings to suggest that belief in the power of superstitions, such as those described here, can lead to risky behaviours. People may believe that there is no value in using standard safety measures (e.g., seat belts and helmets) because they will not work in the presence of such powers. Thus, people may be inclined to adopt the “safety measures” that they believe will address the supernatural risks, such as using preventive prayers, amulets, black cloth and other objects. This means that behaviours considered risky in many western countries (e.g., not wearing a seatbelt) would not necessarily be viewed as risky in Pakistan because of the belief that prayers and amulets mean that people have done everything necessary to avoid harm. Furthermore, some participants expressed a sense of powerlessness in the face of superstition or cosmological forces (e.g., black magic or evil eye) and thus, appeared to hold the view that they have little personal control over life events, including road crashes.
The finding relating to a sense of powerlessness is consistent with research conducted with work-related drivers in Ethiopia where no significant relationships were found between levels of self-efficacy and driving behaviours or self-reported crashes (Mamo, Newnam & Tulu, 2014). These authors suggested that their findings could be due to the beliefs expressed by the Ethiopian drivers that road crashes were random events occurring by bad luck and beyond their control, which contrasts with research findings from western countries. Similarly, the research described earlier from Nigeria (Dixey, 1999; Sarma, 2007) indicates the presence of a range of mystical and superstitious beliefs that appear to exert a great deal of influence on people’s risk perceptions and risk taking behaviours. Additionally, research conducted in Pakistan examined beliefs about the role of Sadqa (giving charity in order to gain blessings and good outcomes) in preventing and recovering from disease and illness (Qidwai

Journal of the Australian College of Road Safety – Volume 28 No. 3, 2017
28
et al., 2010). Participants of that study reported beliefs that the act of giving charity could improve their healing, shorten the duration of their disease, increase resistance to disease, prevent disease reoccurrence, and prolong life. This finding highlights the power of belief in practices such as Sadqa (giving charity), a practice that was described by participants in the current study as able to prevent harm from the malignant look (evil eye) of others.
Together, the findings presented here indicate that some people do not have a clear understanding of events which are perceived by them to be out of their control. Furthermore, their rationale for why road crashes occur is not based on scientific evidence, but rather, on cultural, religious, or other beliefs, such as superstition. The findings also indicate that people use such methods within their belief-based system. This suggests that there is a need to change the nature of popular belief systems towards a scientifically-based understanding of cause and effect. However, it is recognized that any such attempts could be met with resistance, particularly by those who perceive strong links with religion and religious practices. Therefore, caution is recommended when attempting to provide information about ‘scientifically-based’ strategies to a population where fatalistic and superstitious beliefs are prevalent. One avenue to tackle this challenging dilemma may be to promote the concept that taking care of others is important and, therefore, that care on the road is required. Indeed, being careful on the road could be portrayed as another way of giving charity to others, in a similar way to giving money or food to the needy. Another approach, given the very high Muslim population, would be to enlist the support of religious leaders to publicly point out the superstitious beliefs and behaviours considered contrary to Islam.
As has been discussed elsewhere (Wallén Warner, Åber, Sjögren, Thorsén & Okpokam, 2007), much of the injury prevention, risk assessment, and health education literature (including the road safety literature) is based on the concept of rational decision-making based on scientific understanding of why crashes occur and has largely ignored those who have a different world view – one where beliefs in fate, superstition, and other cultural/religious-based practices are prevalent. Therefore, it is imperative that safety practitioners and policy makers consider a wide range of world views when attempting to change attitudes and behaviours. From the information presented above, it seems apparent that road safety countermeasures commonly used in western countries, such as education campaigns aimed at raising awareness about things such as the risks of not wearing seat belts or helmets and not complying with speed limits may have little or no impact if the target audience does not see such issues as valid reasons for why harm may come to them (Sun, 2015).
This research has offered a first step for describing and better understanding some of the religious and cultural/superstitious belief-based factors related to risky behaviour in Pakistan which will hopefully stimulate further research interest in this area. Several limitations, however, should be considered when interpreting and using the findings. A methodological limitation is the reliance on self-reporting
prompted by questions on the topic. People may report more willingness to engage in practices related to superstitious beliefs than they actually exhibit. However, it is possible that, due to self-report bias, people would engage in more traditional behaviour than they espouse (Young, Morris, Burrus, Krishnan & Regmi, 2005). A quantitative study would provide an opportunity for validation . Another limitation relates to recruitment locations. All participants were recruited from large cities in Pakistan and their driving experience was largely confined to cities, highways and motorways, yet large numbers of road crashes occur away from these large urban areas. Future research should consider involving drivers from more rural parts of the country, since it is possible that people from these areas might exhibit more intense and expanded beliefs than those described above due to reduced opportunities for education and access to mainstream media. It is important to emphasize that our intentional use of qualitative methods means that there was no attempt to gain a representative sample (Rice & Ezzy, 1999). Rather, this method allowed the opportunity to explore in some depth the novel topics contained herein that could, in future work, be examined more systematically via representative sampling methods. Therefore, this limitation relating to the generalisability of our results means that caution is required when drawing conclusions about policy maker actions in addressing these issues. Finally, it would be a mistake to conclude that high income countries do not share similar issues, for example a recent Austroads report noted the need to address myths about speeding that are prevalent among segments of Australian drivers (Fleiter et al, 2016). The difference is one of degree, which points to the possibility of reciprocal learning between high income countries and low/middle income countries.
ConclusionsIn conclusion, our findings signal a need to carefully consider the social and cultural factors which can potentially affect road user behaviours and the attribution of road crashes to non-scientific means (e.g., black magic or evil eye). This is particularly important when implementing policies to promote safer road use, particularly if the policies are taken from societies where religious and/or cultural factors are quite different to those discussed in this paper. Additionally, it is important to consider such issues in societies where the population consists of a broad mix of people who bring a wide range of beliefs to their use of the road environment. For professionals in low and middle income countries involved in road safety, focusing on implementation of the Safe System approach advocated by WHO (2015) would crystallize action and advocacy in two ways: first, it would promote an evidence-based approach to road safety; and second, it would promote integrated approaches that combine enforcement, education, road environment improvements, vehicle standards and effective road safety management.
Journal of the Australian College of Road Safety – Volume 28 No. 3, 2017
29
AcknowledgementsFunding: This research did not receive any specific grant from funding agencies in the public, commercial, or not-for-profit sectors.
References Acevedo, G.A. (2008). Islamic fatalism and the clash of
civilizations: an appraisal of a contentious and dubious theory. Social Forces, 86(4), 1711-1752.
Barro, R.J. & McCleary, R.M. (2002). Religion and political economy in an international panel. Working Paper Series, No. 8931. Cambridge, MA: National Bureau of Economic Research.
Bastian, M. (1992). The world as marketplace: historical, cosmological, and popular constructions of the Onitsha market system (Unpublished PhD thesis). University of Chicago, Chicago, USA.
Beaton, D.E., Bombardier, C., Guillemin, F. & Ferraz, M.B. (2000). Guidelines for the process of cross-cultural adaptation of self-report measures, Spine, 25(24), 3186-3191.
Dixey, R.A. (1999). Fatalism, accident causation and prevention: issues for health promotion from an exploratory study in a Yoruba town, Nigeria. Health Education Research, 14(2), 197–208.
Esposito, N. (2001). From meaning to meaning: the influence of translation techniques on non-English focus group research, Qualitative Health Research, 11(4), 586-579.
Fleiter, J., Lewis, I., Kaye, S.-A., Soole, D., Rakotonirainy, A. & Debnath, A. (2016). Public demand for safer speeds: identification of interventions for trial. Sydney: Austroads Ltd.
Foster, K.R. & Kokko, H. (2009). The evolution of superstitious and superstition-like behaviour. Proceedings of Royal Society B: Bio Sciences, 276(1654). 31–37.
Hira, K., Fukui, T., Endoh, A., Rahman, M. & Maekawa, M. (1998). Influence of superstition on the date of hospital discharge and medical cost in Japan: retrospective and descriptive study. British Medical Journal, 317, http://www.bmj.com/content/317/7174/1680.full.
Jimoh, S.A. (1985). Nigerians’ concept of death and its implications for counselling. International Journal of Advanced Counselling, 8(1), 75–83.
Kayani, A., Fleiter, J.J., & King, M.J. (2014). Under-reporting of road crashes in Pakistan and the role of fate. Traffic Injury Prevention, 15(1), 34-39.
Kayani, A., King, M.J. & Fleiter, J.J. (2011). Fatalism and road safety in developing countries, with a focus on Pakistan. Journal of the Australasian College of Road Safety, 22(2), 41-47.
Kayani, A., King, M.J. & Fleiter, J.J. (2012). Fatalism and its implications for risky road use and receptiveness to safety messages: a qualitative investigation in Pakistan. Health Education Research, 27(6), 1043-1054.
Kouabenan, D.R. (1998). Beliefs and the perception of risks and accidents. Risk Analysis, 18(3), 243-252.
Mamo, W., Newnam, S. & Tulu, G.S. (2014). Investigating the individual and organisational predictors of work-related driving crash involvement in Ethiopia. Transportation Research Part F, 23, 156-164.
Mears, D.P. & Ellison, C.G. (2000). Who buys new age materials? Exploring sociodemographic, religious, network, and contextual correlates of new age consumption. Sociology of Religion, 61(3), 289–313.
Pakistan Bureau of Statistics (2017). Population by religion. Retrieved from http://www.pbs.gov.pk/content/population-religion.
Peltzer, K. & Renner, W. (2003). Superstition, risk-taking and risk perception of accidents among South African taxi drivers. Accident Analysis and Prevention, 35(4), 619–623.
Qidwai, W., Tabassum, R., Hanif, R. & Khan, F.H. (2010). Belief in charity giving (sadqa) and its role in healing: results of a survey conducted at a teaching hospital in Karachi, Pakistan. Oman Medical Journal, 25(2), 108-113.
Rice, P. & Ezzy, D. (1999). Qualitative research methods: a health focus. Melbourne: Oxford University Press.
Sandberg. J. (2005). How do we justify knowledge produced within interpretive approaches? Organisational Research Methods, 8(1), 41-68.
Sarma, B.A. (2007). Beliefs and character: theology and ethics of road safety in Nigeria. Retrieved from http://www.tcnn.org/articles/RB48_Sarma.pdf , Theological College of Northern Nigeria, Jos-Bukuru Theological Society.
Sun, D.J. (2015). Why wear a seat belt? I’m going to die anyway: Young Arab men’s rationales for deadly driving behaviors. The Journal of Local and Global Health Science, 2015(2), e79.
Torgler, B. (2007). Determinants of superstition. Journal of Socio-Economics, 36(5), 713–733.
Vyse, S.A. (2013). Believing in magic: the psychology of superstition. New York: Oxford University Press.
Wallén Warner, H., Åber, L., Sjögren, S., Thorsén, S. & Okpokam, T. (2007). A comparison between Swedish and Nigerian taxi drivers. Paper presented at the International Co-operation on Theories and Concepts in Traffic Safety, Beijing, China.
WHO (2015). Global Status Report on Road Safety 2015: Supporting a Decade of Action. Geneva: World Health Organization.
Young, M.J., Morris, M.W., Burrus, J., Krishnan, L. & Regmi, M.P. (2005). Forms of fatalism: Christian and Hindu approaches to attributing misfortune and coping with risks (Unpublished manuscript). University of California, Los Angeles.

Journal of the Australian College of Road Safety – Volume 28 No. 3, 2017
30
ULTRAGUARD™ Safety Barrier Conspicuity Treatment A patented mobile application treatment by licenced contractors.
Available as a chevron pattern or continuous ribbon in white or yellow. Suitable for concrete and w-beam barriers.
Potters Industries Pty Ltd. 100-102 Boundary Road, Sunshine West Vic 3020. Email: [email protected] Phone: 03 8325 6777
“Researched statistics suggest that as many as 40% of all fatal front and side vehicle impact crashes into safety barriers (guard-rail), occur at night and are into the ‘faces’ (as opposed to ‘ends’) of these barriers”.
Investigating perceived control over negative road outcomes: Implications for theory and risk communicationDr Rebecca Pedruzzi1, Dr Anne Swinbourne1, Professor Frances Quirk2
1James Cook University, Townsville, Australia2Barwon Health, Victoria, Autralia
Corresponding author: Rebecca Pedruzzi, [email protected], 0412432686.
Key findings • Drivers perceived high control over their own road behaviours such as speeding• These perceptions were not related to beliefs in ability to control road crashes• Similar findings found in a second study where individual fault was made salient• Behavioural control strongly related to beliefs in ability to control fine outcomes
AbstractRoad safety advertising in Australia is largely based on the assumption that more fear results in greater persuasion. As such, the portrayal of violent road crashes remains the status quo. The current research aimed to investigate if individuals perceive they can influence such outcomes, as theory suggests that efficacy perceptions are central to fear appeal success. Results from two studies demonstrated that participants believed their behaviours would influence financial and point penalty outcomes but not the occurrence of road crashes. This research demonstrates why the portrayal of car crash outcomes in road safety messages needs to be reconsidered.

Journal of the Australian College of Road Safety – Volume 28 No. 3, 2017
31
KeywordsFear appeal, threat appeal, efficacy, control perceptions, road safety advertising, Extended Parallel Process Model
IntroductionAt their most basic, ‘fear appeals’ are communication attempts that present the negative consequences of engaging in risky behaviours. The message aims to elicit fear by presenting a threat in an attempt to encourage motivation for the performance of protective behaviours (Ruiter, Abraham, & Kok, 2001). While threat and fear are terms that are used interchangeably, threat is more accurate as ‘threat’ is a stimulus and ‘fear’ is a response. Furthermore, a threat can produce a variety of emotions and cognitions beyond fear (Donovan & Henley, 1997). However, the terms have become somewhat blurred and unclear in the literature (Hastings, Stead, & Webb, 2004).
In Australia, road safety advertising frequently employs the use of ‘fear appeals’ that demonstrate severe consequences of risky driving in graphic ways (Donovan & Henley, 2003; Lewis, Watson, & White, 2008; O’Rourke, 2000; Tay, 2005). The consequences portrayed often involve horrifying pictures of mangled cars, bloodied victims and even the death of children (Algie & Rossiter, 2010). While some advertisements have focused on legal sanctions such as fines and demerit points (Donovan, Jalleh, & Henley, 1999) and others have appealed to perceptions of social acceptability (see the ‘Pinkie’ campaign, New South Wales Government, n.d.), outcomes portraying crashes, injury and death certainly remain the status quo (Algie & Rossiter, 2010; Carey, McDermott, & Sarma, 2013; Lewis, Watson, & White, 2013). It seems that Australia is not alone in this endeavour, with countries such as New Zealand (Walton & McKeown, 2001), the UK (Harman & Murphy, 2008; Tay, 2011) and parts of the USA also favouring this approach (Hoekstra & Wegman, 2011).
The use of ‘fear appeals’ in Australian road safety advertising became particularly popular in the 1990s. At this time, the Victorian Transport Accident Commission (TAC) had employed a series of hard hitting advertisements that demonstrated graphic scenes of road carnage, accompanied by depictions of the physical and emotional consequences (Donovan et al., 1999; Lewis, Watson, Tay, & White, 2007). These advertisements were expensive to create with estimated costs between $AUD 250,000 and 450,000 per advertisement. The TAC won international recognition for these advertisements and their approach was swiftly adopted by several other Australian jurisdictions (Donovan et al., 1999).
While experts have recommended that theoretical foundations and prior research are necessary to create successful road safety campaigns (Delaney, Lough, Whelan, & Cameron, 2004; Delhomme et al., 2009; Woolley, 2001), in practice this rarely occurs (Elliott, 2011; Tay, 1999; Tay & Watson, 2002; Wundersitz, Hutchinson, & Woolley, 2010). This is despite the potential pitfalls of ‘fear appeals’ as a method of risk communication in road safety being
emphasised for some time (Castillo-Manzano, Castro-Nuño, & Pedregal, 2012; Elliott, 2003, 2005; Henley & Donovan, 1999; Hoekstra & Wegman, 2011; Job, 1990; Wundersitz & Hutchinson, 2011). Designing appeals that portray personally relevant threats are hampered by biases. For example, overestimations of driving ability are quite common in motorists (Harré, Foster, & O’Neill, 2005; Job, 1990; Pedruzzi & Swinbourne, 2009) and may even lead individuals to perceive that road risk messages are intended for other people (Walton & McKeown, 2001). Due to the significant challenges in road safety risk communication, understanding the factors that influence the relationship between fear and persuasion may be more valuable to investigate (Lewis et al., 2007). Proponents of this view have employed a number of theoretical models of behaviour change to analyse road safety messages and their effects, and, make recommendations on message design. This work has included the Extended Parallel Process Model, Protection Motivation Theory, the Health Belief Model and the Elaboration Likelihood Model (D’Souza & Tay, 2016; Tay, 2011).
One particular model, the Extended Parallel Process Model (EPPM; Witte, 1992) has long received attention as a theoretical foundation upon which to base research (Lewis, Watson, & White, 2010; Lewis et al., 2013; Tay & Watson, 2002). The strength of this model (which distinguishes it from others) is that it aims to explain both successes and failures of fear appeals (Witte, 1992). Inherent to this model is the idea that the perception of threat is needed to generate fear which, in turn, motivates processing of a message. However, it is coping appraisal which determines whether the message is accepted or rejected (Lewis et al., 2007; Maloney, Lapinski, & Witte, 2011). The coping appraisal component of the EPPM concerns evaluations of self efficacy and response efficacy. Self efficacy can be defined as a person’s belief or confidence in performing a behaviour while response efficacy refers to a person’s belief that the behaviour will be effective in preventing the threat (Boer & Seydel, 1996; Maloney et al., 2011). The relationship between threat perception and coping appraisal hypothesised by the EPPM is an interactive one. That is, threatening information will only result in adaptive behaviour (message acceptance) if there are positive coping appraisals. Without positive coping appraisals, threatening information is hypothesised to lead to maladaptive behaviour (message rejection) (Ruiter, Verplanken, Kok, & Werrij, 2003).
Empirical evidence for the proposed theoretical relationship has been inconsistent. Meta analyses from the broader health literature have demonstrated main effects of threat and efficacy but have provided no support for the proposed interaction between these variables (de Hoog, Stroebe, & de Wit, 2007; Witte & Allen, 2000). These findings indicate that higher threat alone can facilitate message acceptance.

Journal of the Australian College of Road Safety – Volume 28 No. 3, 2017
32
Peters, Ruiter, and Kok (2012) hypothesised that the inconsistent evidence could be due to poor selection of the target audience, as audience profiles on threat and efficacy are not considered prior to delivering a threatening message. Thus, a review of empirical evidence by these authors included only studies that manipulated both variables. Results demonstrated an interaction effect between threat and efficacy whereby threat only had an effect on adaptive behaviour when efficacy was high. Likewise, the effect of efficacy was only significant when threat was high. This research suggests that unless efficacy perceptions are high at baseline (or effectively enhanced via an intervention), threatening communications can be ineffective at influencing adaptive behaviour (Peters et al., 2012).
The implications of this work are important to consider when discussing road safety outcomes. Research in this field has used various methods to examine the effect of threat and efficacy on behavioural intentions. The focus of the efficacy appraisal in much of this work has been ‘message efficacy’ (e.g. Cathcart & Glendon, 2016; Glendon & Walker, 2013; Lewis et al., 2007; Lewis et al., 2013; Tay & Watson, 2002). This construct has been measured by aggregating scores on self-efficacy (participants’ beliefs that a message provided strategies they could adopt) (Lewis et al., 2013) and response efficacy (participants’ beliefs that a message provided strategies to effectively reduce a threat (Lewis et al., 2008, 2013; Tay & Watson, 2002). Results from this research have demonstrated the important role of efficacy in message design to reduce maladaptive intentions. However, as mentioned earlier, road safety advertising focuses largely on threat, and efficacy components are not addressed. The work of Peters et al. (2012) suggests that the effectiveness of these messages may depend upon pre-existing perceptions of driving behaviours to influence negative outcomes. This is rarely examined in the road safety field. Audiences do not passively take on information. If threat perceptions are already high prior to viewing the advertisement (and surpass efficacy beliefs) threatening messages may only be effective for those who are best equipped to deal with the message from the outset (Hastings, Stead, & Webb, 2004; Rimal & Real, 2003; Witte, 1996). Therefore, the nature of the efficacy profiles of target audiences may be integral to message effectiveness (Muthusamy, Levine, & Weber, 2009; Pedruzzi, Swinbourne, & Quirk, 2016; Witte, Berkowitz, Cameron, & McKeon, 1998).
As noted by Pedruzzi, Swinbourne, and Quirk (2012) risk communication in road safety may be particularly challenging as a negative road outcome can be perceived, correctly, as a function of other people’s behaviour. Therefore, individuals may feel they have limited ability to influence outcomes. Road behaviours fall into two broad categories. Those an individual has control over (e.g. their own speeding behaviour) and those an individual has no control over (e.g. a speeding driver in another car). Road campaigns tend to target the former by demonstrating how the viewer’s driving behaviour can result in negative outcomes. However, the EPPM generates different predictions depending upon the threat targeted. Individuals may perform appropriate road behaviour but negative road
outcomes can still occur in the presence of this behaviour. Such a situation will likely affect efficacy appraisals. This situation is easily overlooked when using the EPPM due to the summative nature of the efficacy component. It therefore makes sense to evaluate individuals’ belief in their ability to influence road outcomes. Understanding efficacy appraisals could provide valuable insight into audience beliefs about road risks, and, the most appropriate outcomes to target in road safety research and advertising employing threat as a stimulus.
The current research thus aimed to investigate if belief in one’s ability to perform a set of road behaviours is in fact related to beliefs in influencing the occurrence of negative road outcomes. In order to do this participants were asked to estimate control perceptions, specifically their confidence in their ability to control or influence a set of road behaviours and outcomes. Relationships between these constructs were then examined. Numerous road safety advertisements focus on crash or fine outcomes, therefore these outcomes were the subject of this investigation. As the occurrence of fine penalties are ultimately due to individual behaviour, it was hypothesised that perceived control over road risk behaviour and perceived control over the occurrence of fines would be similarly high, and related to each other. In contrast, it was hypothesised that perceived control over the occurrence of crash outcomes would be relatively low and have a weak relationship with perceived control over road risk behaviours.
Study 1
MethodParticipantsA sample of 236 participants was recruited from the Townsville region in North Queensland via the advertisement of an online survey. The survey link was largely advertised on online social networks, university newsletters, and community events pages. Participants could click on the advertised link to proceed to the survey. Of this sample, 31 participants requested to fill out a paper questionnaire.
The sample consisted of 156 females and 76 males (4 participants did not indicate their gender) ranging in age from 18 to 73 years (M = 38.97, SD = 13.89, Mdn = 36.00). Eight percent of the respondents reported their highest level of education was year 10 in secondary school. A further 22% reported completing year 12. Almost 33% had completed an undergraduate degree. About 8% of the sample reported having a trade qualification while the remaining 27% reported completing some other form of education. Cases were examined for missing values. A total of 29 participants were missing data on one or more of the variables of interest and were excluded. These participants were older than those without missing data (t(233) = -2.01, p = .05). However the distribution of gender did not differ between groups (c2 (1, N = 232) = 2.19, p = .15). Six participants with missing data had been involved in a car
Journal of the Australian College of Road Safety – Volume 28 No. 3, 2017
33
crash compared to fifty participants without missing data. These proportions were not significantly different (c2 (1, N=235) = .10, p = .75). Missing data was dealt with using list wise deletion. Of the 207 remaining participants, 175 were Queensland residents and 25 participants reported living elsewhere in Australia. Seven participants were further excluded as they either reported living overseas or gave no information about their place of residence. The final sample therefore consisted of 200 participants.
MeasuresThis study was embedded within a broader project, and only the behaviours and outcomes specific to this report are grouped and listed below. Specifically, three target variables were examined. These were control over road behaviours, and control over fine and crash outcomes.
Control over road behaviours
Participants were presented with a number of road behav-iours. These behaviours included ‘driving without talking on a mobile phone,’ ‘driving without texting,’ ‘driving over the speed limit,’ and ‘driving with a blood alcohol level over the legal limit.’ Participants were asked to consider each behaviour happening to them, and indicate their con-fidence in their ability to control or influence each one. Participants responded on a 7 point Likert scale (1 = no confidence, 7 = complete confidence).
Control over fine and crash outcomes
A number of road related outcomes pertaining to fines were presented to the participants. These outcomes included ‘being booked for speeding,’ ‘being booked for drink driving,’ ‘being booked for talking on a mobile phone while driving,’ and ‘being booked for texting while driving.’ One item ‘being involved in a car crash’ assessed control over a crash outcome. Participants were asked to think about the outcomes happening to them and indicate their confidence in their ability to control or influence each one. Participants responded on a 7 point Likert scale (1=no confidence, 7 = complete confidence). Participants were also asked to indicate whether or not the event had happened to them.
ProcedureEthics approval was obtained through the James Cook University Ethics Committee (H4576). Participants were directed to an online version of the survey which was hosted at Survey Gizmo. Participants were asked to think about the behaviours and outcomes described as actually happening to them before indicating their confidence in their ability to control or influence each one.
Statistical methods & data preparationData was analysed using both SPSS and AMOS (version 22). In order to test the effects of behavioural control on fine and crash outcomes, Structural Equation Modelling (SEM) with AMOS was used. The strength of this approach, in comparison to creating composite variables, is that latent
variables can be tested and a Confirmatory Factor Analysis (CFA) can be performed simultaneously. Furthermore, SEM can provide more accurate estimates of relationships as it models the error variance specific to each variable. The overall models were tested with Maximum Likelihood Estimation using the covariance matrix. Univariate and multivariate non normality were assessed by examining normality statistics in AMOS (see Byrne, 2010). To adjust for inflated standard errors when data was identified as multivariate non normal, Bollen-Stine bootstrapping procedures were performed with 2000 bootstrapped samples at 95% confidence intervals (Bollen & Stine, 1992). A bootstrap is an acceptable approach to deal with non normal data (Byrne, 2010). Sample size considerations for SEM require at least 10 participants per estimated parameter as less than this can result in power and model stability issues (Kline, 2011). In consideration of this, no more than 20 estimated parameters were modelled with the current sample.
Model fit was assessed with chi square indices, Bentler’s Comparative Fit Index (CFI; Bentler, 1990), the Adjusted Goodness of Fit Index (AGFI), the Root Means Square Error of Approximation (RMSEA) and the Standardised Root Mean Square Residual (SRMR). A non-significant chi square is indicative of good model fit. The post hoc adjustment made by the Bollen –Stine bootstrap also yields a non-significant p value to indicate good model fit. For CFI, values obtained should be greater than .95 (.90 at minimum) AGFI should be above .90, RMSEA less than .06 and SRMR less than .05 (Byrne, 2010). Latent variables were created for ‘control over behaviours’, and ‘control over fine outcomes’. CFA was performed to evaluate the validity of the latent variables used in the structural model.
ResultsControl appraisalsParticipants’ average ratings of control for the behaviours and both fine and crash outcomes are presented in Table 1. The table also includes the average ratings for each item. Internal consistencies are presented for the latent variable measures.
Tests of the hypothesised modelThe conceptual framework guiding the hypothesised model was that behavioural control would be strongly related to one’s perceived ability to bring about or avoid a fine outcome. In comparison, it was expected that behavioural control would be weakly related to one’s ability to bring about a crash outcome. Further, we decided to investigate a pathway between perceived control over fine outcomes and perceived control over crash outcomes. This was performed in order to understand if beliefs in one’s ability to control fine outcomes generalized to crash outcomes.
Normality testing demonstrated significant evidence of multivariate non normality. Mardia’s multivariate kurtosis index was 85.15 (C.R. = 42.79). As such Bollen-Stine

Journal of the Australian College of Road Safety – Volume 28 No. 3, 2017
34
bootstrap was employed to adjust for the lack of multivariate normality. The hypothesised model and pathways are illustrated in Figure 1 along with their standardised coefficients. Only the direct relationships between variables were tested.
The direct pathway between the latent variables ‘control over behaviours’ and ‘control over fine outcomes’ was significant (p < .001). This relationship indicates that as perceived control over road behaviours increases, perceived control over fine outcomes tends to increase as well. The pathway between ‘control over fine outcomes’ and control over ‘being involved in a car crash’ was not significant
(p = .10). The relationship between ‘control over behaviours’ and control over ‘being involved in a car crash’ was also not significant (p = . 92). The factor loadings for each item onto the respective latent factors were all significant (p < .001). The item reliabilities are reported in Table 2. In particular, control over speeding and control over drink driving seem to be poor measures of the ‘behaviours’ construct. Likewise, control over being booked for speeding and control over being booked for drink driving are also weak measures of the ‘control over fine outcomes’ construct. These items require further investigation. Model fit statistics indicated a poor fitting model with c2 (25) = 171.61, p < .001; CFI = .84; AGFI = .71; RMSEA = .17 (90% CI = .15; .20); SRMR = .12. Bollen-Stine bootstrap produced an adjusted p value < .001 further supporting poor model fit.
Table 1. Means, standard deviations and internal consistencies for each item and measure
Control appraisals Mean (SD) αDriving without phone 5.97 (1.49)Driving without texting 6.26 (1.35)Speeding 5.77 (1.35)Drink driving 6.27 (1.56)Control over behaviours 6.06 (1.05) .71Booked for phoning 5.97 (1.58)Booked for texting 6.04 (1.60)Booked for speeding 5.70 (1.44)Booked for drink driving 6.47 (1.13)Control over fine outcomes 6.04 (1.19) .84Control over a car crash 3.60 (1.49)
Note: All items were measured on a 7 point scale with higher scores indicating greater perceived control
Item EstimateDriving without talking on a mobile phone .76Driving without texting .73Driving over the speed limit .19Driving with a blood alcohol level over the legal limit .10
Being booked for speeding .27Being booked for drink driving .26Being booked for talking on a mobile phone while driving .97
Being booked for texting while driving .88
Table 2. Item reliabilities for items in the measurement model
Figure 1. Road model including standardised coefficients for structural pathways and measurement model *p < .001
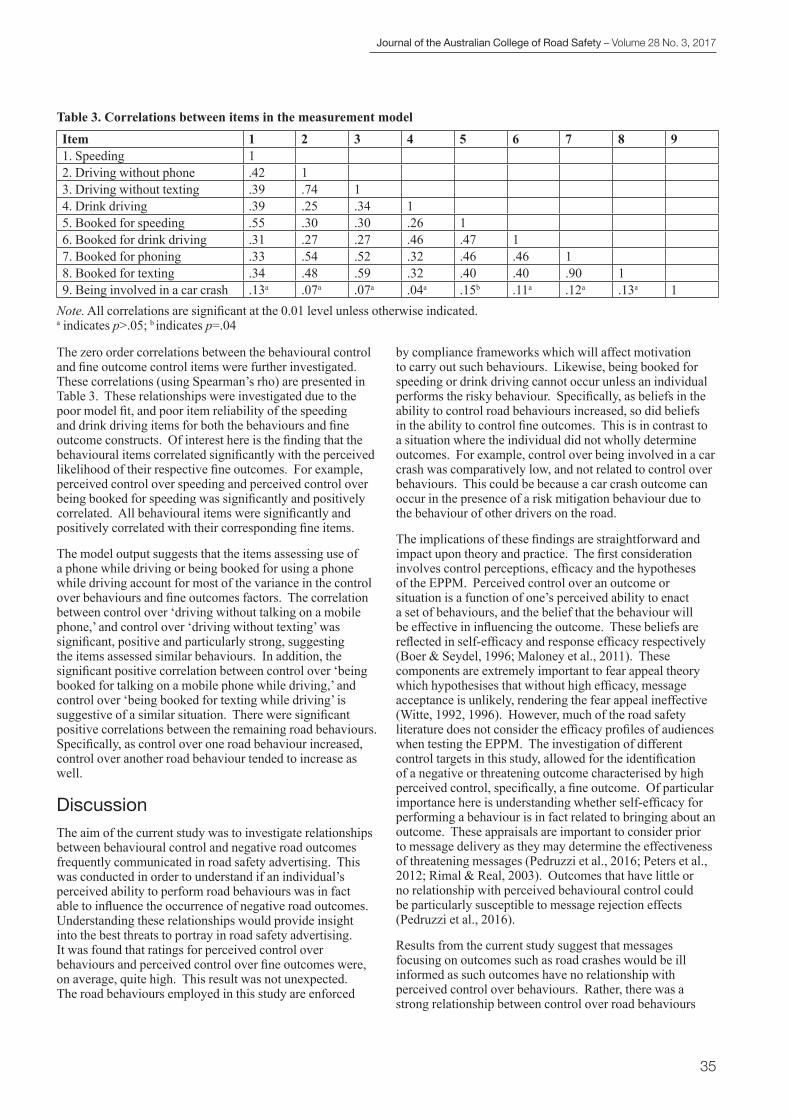
Journal of the Australian College of Road Safety – Volume 28 No. 3, 2017
35
The zero order correlations between the behavioural control and fine outcome control items were further investigated. These correlations (using Spearman’s rho) are presented in Table 3. These relationships were investigated due to the poor model fit, and poor item reliability of the speeding and drink driving items for both the behaviours and fine outcome constructs. Of interest here is the finding that the behavioural items correlated significantly with the perceived likelihood of their respective fine outcomes. For example, perceived control over speeding and perceived control over being booked for speeding was significantly and positively correlated. All behavioural items were significantly and positively correlated with their corresponding fine items.
The model output suggests that the items assessing use of a phone while driving or being booked for using a phone while driving account for most of the variance in the control over behaviours and fine outcomes factors. The correlation between control over ‘driving without talking on a mobile phone,’ and control over ‘driving without texting’ was significant, positive and particularly strong, suggesting the items assessed similar behaviours. In addition, the significant positive correlation between control over ‘being booked for talking on a mobile phone while driving,’ and control over ‘being booked for texting while driving’ is suggestive of a similar situation. There were significant positive correlations between the remaining road behaviours. Specifically, as control over one road behaviour increased, control over another road behaviour tended to increase as well.
DiscussionThe aim of the current study was to investigate relationships between behavioural control and negative road outcomes frequently communicated in road safety advertising. This was conducted in order to understand if an individual’s perceived ability to perform road behaviours was in fact able to influence the occurrence of negative road outcomes. Understanding these relationships would provide insight into the best threats to portray in road safety advertising. It was found that ratings for perceived control over behaviours and perceived control over fine outcomes were, on average, quite high. This result was not unexpected. The road behaviours employed in this study are enforced
by compliance frameworks which will affect motivation to carry out such behaviours. Likewise, being booked for speeding or drink driving cannot occur unless an individual performs the risky behaviour. Specifically, as beliefs in the ability to control road behaviours increased, so did beliefs in the ability to control fine outcomes. This is in contrast to a situation where the individual did not wholly determine outcomes. For example, control over being involved in a car crash was comparatively low, and not related to control over behaviours. This could be because a car crash outcome can occur in the presence of a risk mitigation behaviour due to the behaviour of other drivers on the road.
The implications of these findings are straightforward and impact upon theory and practice. The first consideration involves control perceptions, efficacy and the hypotheses of the EPPM. Perceived control over an outcome or situation is a function of one’s perceived ability to enact a set of behaviours, and the belief that the behaviour will be effective in influencing the outcome. These beliefs are reflected in self-efficacy and response efficacy respectively (Boer & Seydel, 1996; Maloney et al., 2011). These components are extremely important to fear appeal theory which hypothesises that without high efficacy, message acceptance is unlikely, rendering the fear appeal ineffective (Witte, 1992, 1996). However, much of the road safety literature does not consider the efficacy profiles of audiences when testing the EPPM. The investigation of different control targets in this study, allowed for the identification of a negative or threatening outcome characterised by high perceived control, specifically, a fine outcome. Of particular importance here is understanding whether self-efficacy for performing a behaviour is in fact related to bringing about an outcome. These appraisals are important to consider prior to message delivery as they may determine the effectiveness of threatening messages (Pedruzzi et al., 2016; Peters et al., 2012; Rimal & Real, 2003). Outcomes that have little or no relationship with perceived behavioural control could be particularly susceptible to message rejection effects (Pedruzzi et al., 2016).
Results from the current study suggest that messages focusing on outcomes such as road crashes would be ill informed as such outcomes have no relationship with perceived control over behaviours. Rather, there was a strong relationship between control over road behaviours
Table 3. Correlations between items in the measurement modelItem 1 2 3 4 5 6 7 8 91. Speeding 12. Driving without phone .42 13. Driving without texting .39 .74 14. Drink driving .39 .25 .34 15. Booked for speeding .55 .30 .30 .26 16. Booked for drink driving .31 .27 .27 .46 .47 17. Booked for phoning .33 .54 .52 .32 .46 .46 18. Booked for texting .34 .48 .59 .32 .40 .40 .90 19. Being involved in a car crash .13a .07a .07a .04a .15b .11a .12a .13a 1
Note. All correlations are significant at the 0.01 level unless otherwise indicated. a indicates p>.05; b indicates p=.04
Journal of the Australian College of Road Safety – Volume 28 No. 3, 2017
36
and fine outcomes demonstrated here. It would therefore seem that in order to best influence behaviour, outcomes related to graphic crashes and deaths should instead be replaced with outcomes related to financial and point penalties. Further, the correlations between the behavioural items indicates that the perceived ability to control a risky or protective road behaviour allows an individual to influence other road related behaviours. Interventions targeting at least one risk behaviour may therefore have some benefit in reducing other behaviours. Instead, fine and crash outcomes differed substantially in their average ratings and were not related to each other. This pathway was tested to rule out the possibility that feelings of control over fine outcomes may lead an individual to believe they can control crash outcomes. Such a relationship could occur for a number of reasons and would require further investigation. For example, being able to control the occurrence of fine outcomes may give rise to feelings of being a particularly skillful or safe driver, therefore crash outcomes may be perceived as unlikely to occur.
While this study has important implications for the focus of road safety campaigns, there are some limitations. First, the item assessing control over a car crash allowed for the perception that another person can cause a crash. Future work should employ items that exclude this possibility. If the relationship between behavioural control and occurrence of a car crash changes when perceiving fault, it has direct implications for interventions. The finding would suggest that making fault salient could result in more effective campaigns. This was addressed in Study 2. Further, some of the items used in the model were not reliable indicators of the latent variables. For example, the items related to speeding and drink driving were poor indicators of their constructs. This may be a consequence of the phone offence items used for each construct. These items were very similar, highly correlated, and as such accounted for most of the variance in both the behaviour and fine variables. Additionally, the behavioural items were not framed consistently. Two items were framed as protective behaviours while the remaining two were framed as risk behaviours. It could be that the poor reliability of the items may be an effect of frame. These issues were also addressed in Study 2.
Study 2Study 2 aimed to retest the structural model developed in Study 1 with a new sample. Study 1 allowed individuals to perceive that a car crash outcome could be due to the fault of another person. Study 2 corrected for this assumption by making fault salient. The item reliability issues from Study 1 were also addressed. It was hypothesised that behavioural control would have a strong and positive relationship with control over fine outcomes as previously demonstrated. It was further expected that making crash fault salient would change the nature of the relationship between behaviour and crash outcomes, whereby behavioural control would be related to the occurrence of crash outcomes.
MethodParticipantsParticipants were recruited mainly from the North Queensland region in Australia. Recruitment occurred via advertisements on local radio and news channels, online forums, newsletters and local car enthusiast websites and Facebook pages. Advertisements were also put up around the University and psychology students could participate for credit points. As the survey was conducted as an online survey, advertisements included the address of the online URL. Initially, 339 participants chose to participate by clicking the start button. Of these, 43 participants did not provide any further information. Another 24 of the participants indicated they lived outside of Australia and were thus removed from the analysis. A further 44 participants did not record scores on the variables of interest and were also excluded, resulting in a final sample size of 228 participants. There were 77 males and 133 females in the sample (18 people did not give information about gender). Participants ranged in age from 17 years to 71 years (M = 34.89, SD= 15.17, Mdn = 31.00) and approximately 30% of participants indicated their highest level of education was an undergraduate degree.
MeasuresThis study was embedded within a broader project, and only the variables specific to this report are described. To assess perceived control over road behaviours, 7 items were used employing different frames. Four items were framed as protective behaviours and three items were framed as risk behaviours. Examples of protective items included ‘driving to the speed limit,’ and ‘driving without using a mobile phone.’ Examples of risk items included ‘driving over the speed limit’ and ‘being distracted by a mobile phone whilst driving.’ Three items assessed perceived control over fine outcomes. These were ‘being booked for speeding,’ ‘being booked for using a mobile phone while driving’ and ‘being booked for drink driving.’ One item ‘having a crash as the driver at fault’ assessed perceived control over a crash outcome. Participants responded on a 7 point Likert scale (1 = no confidence, 7 = complete confidence). Participants were also asked questions about their driving history.
ProcedureEthics approval was obtained through the James Cook University Ethics Committee (H5043). The survey was hosted at Survey Monkey and participants were directed to an online link ‘Road threats: Feelings, thoughts and behaviours’ which first described the study. As per Study 1, participants were asked to think about the behaviours and outcomes happening to them before indicating their ability to control or influence each one.
Sample characteristicsAbout 90% of the sample reported having access to a car for their own personal use. Approximately 10% reported
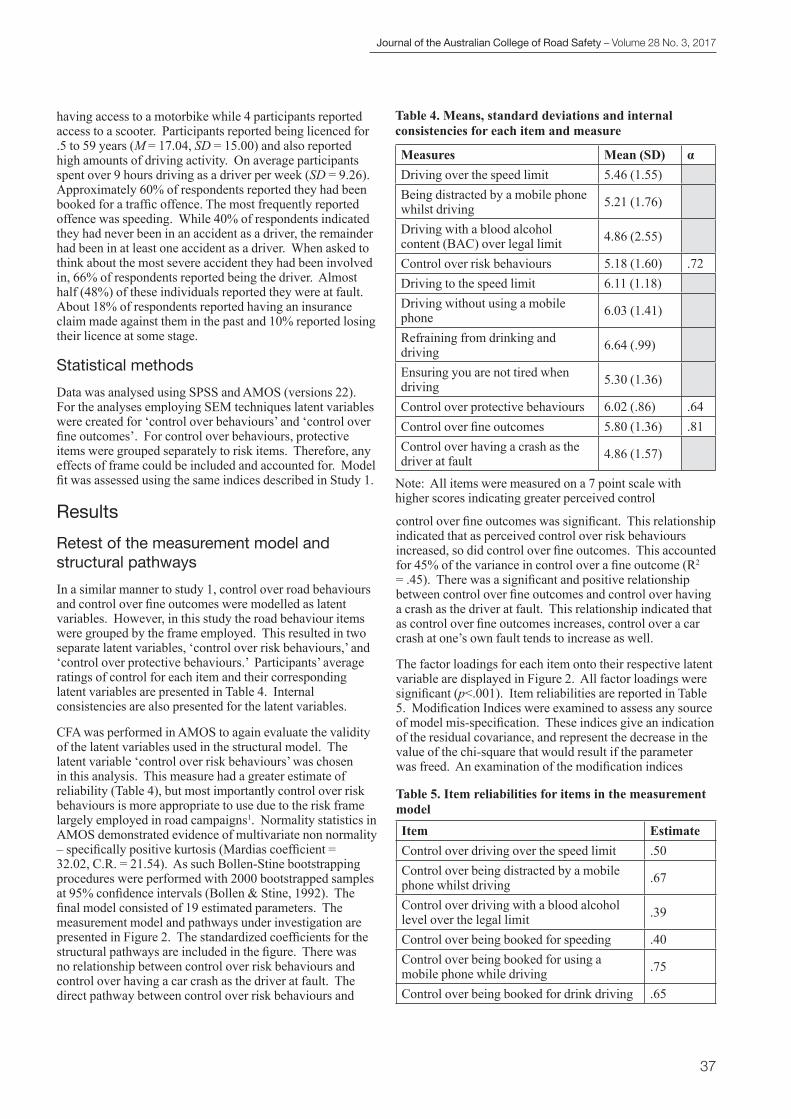
Journal of the Australian College of Road Safety – Volume 28 No. 3, 2017
37
having access to a motorbike while 4 participants reported access to a scooter. Participants reported being licenced for .5 to 59 years (M = 17.04, SD = 15.00) and also reported high amounts of driving activity. On average participants spent over 9 hours driving as a driver per week (SD = 9.26). Approximately 60% of respondents reported they had been booked for a traffic offence. The most frequently reported offence was speeding. While 40% of respondents indicated they had never been in an accident as a driver, the remainder had been in at least one accident as a driver. When asked to think about the most severe accident they had been involved in, 66% of respondents reported being the driver. Almost half (48%) of these individuals reported they were at fault. About 18% of respondents reported having an insurance claim made against them in the past and 10% reported losing their licence at some stage.
Statistical methodsData was analysed using SPSS and AMOS (versions 22). For the analyses employing SEM techniques latent variables were created for ‘control over behaviours’ and ‘control over fine outcomes’. For control over behaviours, protective items were grouped separately to risk items. Therefore, any effects of frame could be included and accounted for. Model fit was assessed using the same indices described in Study 1.
ResultsRetest of the measurement model and structural pathwaysIn a similar manner to study 1, control over road behaviours and control over fine outcomes were modelled as latent variables. However, in this study the road behaviour items were grouped by the frame employed. This resulted in two separate latent variables, ‘control over risk behaviours,’ and ‘control over protective behaviours.’ Participants’ average ratings of control for each item and their corresponding latent variables are presented in Table 4. Internal consistencies are also presented for the latent variables.
CFA was performed in AMOS to again evaluate the validity of the latent variables used in the structural model. The latent variable ‘control over risk behaviours’ was chosen in this analysis. This measure had a greater estimate of reliability (Table 4), but most importantly control over risk behaviours is more appropriate to use due to the risk frame largely employed in road campaigns1. Normality statistics in AMOS demonstrated evidence of multivariate non normality – specifically positive kurtosis (Mardias coefficient = 32.02, C.R. = 21.54). As such Bollen-Stine bootstrapping procedures were performed with 2000 bootstrapped samples at 95% confidence intervals (Bollen & Stine, 1992). The final model consisted of 19 estimated parameters. The measurement model and pathways under investigation are presented in Figure 2. The standardized coefficients for the structural pathways are included in the figure. There was no relationship between control over risk behaviours and control over having a car crash as the driver at fault. The direct pathway between control over risk behaviours and
control over fine outcomes was significant. This relationship indicated that as perceived control over risk behaviours increased, so did control over fine outcomes. This accounted for 45% of the variance in control over a fine outcome (R2 = .45). There was a significant and positive relationship between control over fine outcomes and control over having a crash as the driver at fault. This relationship indicated that as control over fine outcomes increases, control over a car crash at one’s own fault tends to increase as well.
The factor loadings for each item onto their respective latent variable are displayed in Figure 2. All factor loadings were significant (p<.001). Item reliabilities are reported in Table 5. Modification Indices were examined to assess any source of model mis-specification. These indices give an indication of the residual covariance, and represent the decrease in the value of the chi-square that would result if the parameter was freed. An examination of the modification indices
Table 4. Means, standard deviations and internal consistencies for each item and measure
Measures Mean (SD) αDriving over the speed limit 5.46 (1.55)Being distracted by a mobile phone whilst driving 5.21 (1.76)
Driving with a blood alcohol content (BAC) over legal limit 4.86 (2.55)
Control over risk behaviours 5.18 (1.60) .72Driving to the speed limit 6.11 (1.18)Driving without using a mobile phone 6.03 (1.41)
Refraining from drinking and driving 6.64 (.99)
Ensuring you are not tired when driving 5.30 (1.36)
Control over protective behaviours 6.02 (.86) .64Control over fine outcomes 5.80 (1.36) .81Control over having a crash as the driver at fault 4.86 (1.57)
Note: All items were measured on a 7 point scale with higher scores indicating greater perceived control
Table 5. Item reliabilities for items in the measurement modelItem EstimateControl over driving over the speed limit .50Control over being distracted by a mobile phone whilst driving .67
Control over driving with a blood alcohol level over the legal limit .39
Control over being booked for speeding .40Control over being booked for using a mobile phone while driving .75
Control over being booked for drink driving .65
Journal of the Australian College of Road Safety – Volume 28 No. 3, 2017
38
suggested to co-vary the error terms as specified in Figure 2. The highest cross loading was between e3 and e6 (coeff = .31). Model fit statistics indicate good model fit with c2 (9) = 17.19, p = .05; CFI = .99; AGFI = .94; RMSEA = .06 (90% CI = .01; .11); SRMR = .03. The Bollen-Stine bootstrap procedure to correct for non normality produced an adjusted p value of .27, thus also suggestive of adequate model fit. The entire model accounted for 29% of the variance in control over a road crash outcome (R2 = .29).
DiscussionThe aim of this study was to understand if individuals’ beliefs in their ability to control the performance of risky road behaviour were related to beliefs about controlling the occurrence of negative road outcomes. This study built upon study 1 by making fault salient and aiming to overcome some of the item reliability issues in the measurement model. The relationship between perceived control over risk behaviours and perceived control over fine outcomes was particularly strong, accounting for 45% of the variance in perceived control over being fined. This finding suggests as belief in the ability to control risky road behaviours increases, so does belief in the ability to control fine outcomes. Specifically, being able to control the performance of risky road behaviours such as speeding, distraction, and drink driving, was generally perceived as being effective in controlling whether or not an individual is fined for such behaviour. In contrast no relationship between perceived control over risk behaviours and perceived control over a crash outcome was detected. This relationship was not evident even though this study rectified the limitation of Study 1.
The crash outcome in this study was clearly framed as the respondent’s fault, that is, as a consequence of the respondent’s behaviour. The lack of relationship between behavioural control and crashing at fault is surprising and deserves further attention. It could be that several biases are involved. For example, overestimations of driving ability are quite common in motorists (Harré et al., 2005; Job, 1990; Pedruzzi & Swinbourne, 2009). These beliefs may have lead individuals to perceive they are unlikely to crash at fault or that road crashes are due to the fault of others. Perhaps then, crashes are only thought of in the context of other drivers on the road, making fault frames redundant. These findings should provide a warning against the consistent use of crash imagery in Australian road safety campaigns. Further, making fault salient in messages by linking individual behaviour to crash outcomes may not have the desired effect.
The significant and positive relationship between perceived control over fine outcomes and perceived control over crashing at fault was different to study 1. This relationship indicated that increases in the perceived ability to control fine outcomes were related to increases in the perceived ability to control crashing as the driver at fault. In order to explain this relationship, it is helpful to consider the hypotheses proposed by the EPPM (Witte, 1992). In the context of the EPPM, if an individual perceives high risk of a fine, it is suggested that s/he will be motivated to act
to decrease their fear (Witte & Allen, 2000). This action could include carrying out a behaviour that alleviates the threat but does not comply with driving laws. For example, if the location of a speed camera is known, an individual may speed but take an alternate route to avoid a fine. The avoidance of fine outcomes may lead to beliefs of superior driving ability. If an individual overestimates their driving ability, crashing at fault would again be perceived as an unlikely occurrence. This hypothesis may explain the relationship between the fine and crash outcome variables. If motorists perceive that they are unlikely to crash at fault, it also gives rise to the possibility that the model employed in this study was unable to adequately capture the hypothesised relationship between behavioural control and control over crashing at fault. Future work should aim to understand if overestimations of driving ability affect this pathway.
The increased reliability of the measurement model, compared to Study 1, could be a result of the more consistent frame employed for the items in this study. In Study 1 the behavioural control variable consisted of behaviours framed in both positive and negative ways. The model employed in this study used items that were framed consistently as risk behaviours. Additionally, some of the item reliability issues were addressed in the current study. For example, two separate (and highly correlated) items were used in Study 1 to assess perceived control over talking or texting while driving. The current study instead replaced these items with one item assessing perceived control over mobile phone related behaviours. The current study freed pathways between the respective behaviour and fine outcomes as suggested by the modification indices. This was not performed in Study 1 due to sample size considerations. This likely contributed to the better model fit in the current study. Correlated error terms in a measurement model indicate overlap in the unique variance of items, therefore the approach is usually reserved for error terms within latent factors. In this situation, it makes sense that residual error would be shared by the items specified in the model. For example, perceived control over speeding behaviour allows an individual to control the occurrence of being booked specifically for speeding. However, the relationship between each factor and control over crashing at fault demonstrates that they are qualitatively different measures. It is also possible that the better reliability of the measurement model is due to the change in sample.
The strength of this research is that the framework employed allows inferences to be made regarding the selection of outcomes for the development of effective road messages prior to message delivery. This work also has implications for theory, demonstrating how the EPPM may need to be expanded in road safety research. Instead of focusing on ‘message efficacy’ as previously done in the literature, the work instead examines the nature of efficacy beliefs in audience members, which has been demonstrated to influence the effect of threatening communications (Pedruzzi et al., 2016; Peters et al., 2012). This framework could also be used to predict message acceptance outcomes frequently employed in the literature. Most research using models such as the EPPM (Witte, 1992) sums the components of self-efficacy and response efficacy in order to test the relationship

Journal of the Australian College of Road Safety – Volume 28 No. 3, 2017
39
between efficacy and message acceptance or message rejection. The current research demonstrates how this could be problematic in a road context. Ensuring the relationship between self-efficacy for performing a behaviour is in fact related to controlling an outcome is necessary for adaptive behaviour. This research demonstrates that the predictions of the EPPM will be different depending upon the road outcome targeted. This insight could be lost, and potentially result in inconsistent evidence, if efficacy components are simply combined. Instead, the relationships between the components need to be defined in the model.
The main limitation of this work regards the selection of the sample. While research examining road safety behaviour in regional samples has been called for (Veitch, Sheehan, Turner, Siskind, & Pashen, 2005) it might be hasty to generalise to large metropolitan areas. The environment in North Queensland requires drivers to switch driving strategies more often than metropolitan drivers. Specifically, the region consists of smaller urban areas connected by long stretches of highway driving. These roads have considerably less traffic and fewer lanes, however more random road risks are prevalent. For example, highways can be crossed by wildlife at any time of the day thus impacting on driving conditions without warning. Poorly designed roads are often damaged or inaccessible as a result of severe weather events such as storms and cyclones. These events contribute to a high risk environment that can be more unpredictable than some metropolitan areas. Consequently, these experiences may have contributed to the perception that road behaviours were not able to influence the occurrence of crashes. Future work should be carried out in an urban environment to ensure the validity of the framework across diverse driving environments and thus samples.
Certainly, there will be subpopulations (e.g. repeat offenders and young male drivers) where efficacy beliefs may be especially useful to investigate to inform targeted education practices. Due to sample size constraints, this work was
unable to examine the potential influence of variables such as driving history or gender. The samples from both studies had high proportions of female drivers (approximately 65%) and this limitation needs to be addressed in future work. Further work should also aim to expand upon the road outcomes investigated. There are many types of crashes (e.g. braking suddenly due to an unexpected object, head on collisions, ‘fender bender’ collisions) and these may be associated with distinct efficacy appraisals.
In terms of recommendations for practice, this research suggests that campaign designers should concentrate their efforts on increasing the perception that people will be penalized with financial and point penalties for risky road behaviours. As these outcomes are largely appraised as controllable by individuals, risk mitigation behaviours should increase in an effort to avoid fine outcomes. Engaging in these behaviours will consequently reduce the number of road crashes. It is also suggested that such messages be used carefully, reminding audiences that they are responsible for the occurrence of fine outcomes by providing clear and controllable behavioural directives to prevent such outcomes. Factors in the environment may activate beliefs that interfere with pre-existing control perceptions. For example, there are groups in the community that actively seek out concealed speed cameras and warn others of their whereabouts (“Masked protesters,” 2014). Likewise, social media campaigns exist to block fine efforts by the police (O’Rourke, 2015). Radar scrambling devices can be easily purchased which stop traffic cameras from detecting speeding cars. Anecdotal evidence suggests that many motorists perform these behaviours because they believe that hidden traffic cameras exist for ‘revenue raising.’ It could be suggested that groups such as these are less likely to believe that fines are appropriate enforcement activities. As such, advertising efforts should remind people that these outcomes are ultimately due to their own behaviour and potentially focus on the point deduction component. The implementation of such efforts
Figure 2. Measurement model and structural pathways tested for hypothesised model of road control *p<.001

Journal of the Australian College of Road Safety – Volume 28 No. 3, 2017
40
may involve roadside billboards, messages, and increased policing efforts. For example, the use of speed monitoring devices on the road are an instant cue to slow down. This feedback method may also act to remind people that they will be caught if they continue to speed.
ConclusionsThis study demonstrates that the portrayal of crash outcomes in road safety advertising is counterintuitive because even high perceptions of self-efficacy for road behaviours are perceived to have little bearing on crash outcomes. Participants tended not to consider that crashes were in their control, or that engaging in risk mitigation behaviours such as driving within the speed limit would have any benefit in terms of preventing crashes – even when the crash was framed as the fault of the individual. These findings are quite surprising and somewhat alarming. Beliefs such as these may be particularly problematic for road safety promotion efforts, acting as potential barriers to message acceptance. The identification of controllable outcomes (such as fines) should instead be the focus of risk communication attempts. Assessing control in a multidimensional fashion within the context of the EPPM, as done here, could be especially useful in identifying appropriate road outcomes to target in road risk communication.
Footnotes1. For interest the hypothesised model employing ‘control
over protective behaviours’ has been included as an appendix. Standardized coefficients for the structural pathways and factor loadings for the measurement model have been provided along with indices of model fit. Item reliabilities for items in the measurement model are also provided (See Appendix).
2. All factor loadings were significant (p <.001). Model fit statistics indicate poor model fit with c2 (16) = 38.77, p < .001; CFI = .96; AGFI = .90; RMSEA = .08 (90% CI = .05; .11); SRMR = .05. A Bollen-Stine bootstrap procedure to correct for non normality produced an adjusted p value of .04, also suggestive of poor model fit.
AcknowledgementsFunding: The first author would like to acknowledge the financial contribution of an Australian Postgraduate Award funded by the Australian Federal Government, and James Cook University for hosting the work.
ReferencesAlgie, J., & Rossiter, J. R. (2010). Fear patterns: a new approach
to designing road safety advertisements. Journal of Prevention & Intervention in the Community, 38(4), 264-279. doi:10.1080/10852352.2010.509019
Boer, H., & Seydel, E. R. (1996). Protection motivation theory. In M. Connar & P. Norman (Eds.), Predicting Health Behavior: Research and Practice With Social Cognition Models. (pp. 95-120). Buckingham, PA: Open University Press.
Bollen, K. A., & Stine, R. A. (1992). Bootstrapping goodness-of-fit measures in structural equation models. Sociological Methods & Research, 21(2), 205-229.
Byrne, B. M. (2010). Structural equation modeling with AMOS: Basic concepts, applications, and programming (Second ed.). New York: Routledge.
Carey, R. N., McDermott, D. T., & Sarma, K. M. (2013). The impact of threat appeals on fear arousal and driver behavior: a meta-analysis of experimental research 1990-2011. PLoS One, 8(5), e62821. doi:10.1371/journal.pone.0062821
Castillo-Manzano, J. I., Castro-Nuño, M., & Pedregal, D. J. (2012). How many lives can bloody and shocking road safety advertising save? The case of Spain. Transportation research part F: traffic psychology and behaviour, 15(2), 174-187. doi:10.1016/j.trf.2011.12.008
Cathcart, R. L., & Glendon, A. I. (2016). Judged effectiveness of threat and coping appraisal anti-speeding messages. Accident Analysis & Prevention, 96, 237-248. doi:10.1016/j.aap.2016.08.005
D’Souza, C., & Tay, R. (2016). Advertising implications and design of messages. Marketing Intelligence & Planning, 34(4), 504-522.
de Hoog, N., Stroebe, W., & de Wit, J. B. F. (2007). The impact of vulnerability to and severity of a health risk on processing and acceptance of fear-arousing communications: A meta-analysis. Review of General Psychology, 11(3), 258-285. doi:10.1037/1089-2680.11.3.258
Delaney, A., Lough, B., Whelan, M., & Cameron, M. (2004). A review of mass media campaigns in road safety (0732617308). Retrieved from http://www.monash.edu.au/miri/research/reports/muarc220.pdf:
Delhomme, P., De Dobbeleer, W., Forward, S., Simoes, A., Adamos, G., Areal, A., . . . Walter, E. (2009). Manual for Designing, Implementing and Evaluating Road Safety Communication Campaigns. Retrieved from Brussels, Belgium:
Donovan, R., & Henley, N. (2003). Social marketing: Principles and practice. Melbourne: IP Communications.
Donovan, R., Jalleh, G., & Henley, N. (1999). Executing effective road safety advertising: are big production budgets necessary? Accident Analysis & Prevention, 31, 243-252.
Elliott, B. J. (2003). The Psychology of Fear Appeals Re-Visited. Paper presented at the Road Safety Research, Policing and Education Conference, Sydney.

Journal of the Australian College of Road Safety – Volume 28 No. 3, 2017
41
Elliott, B. J. (2005). The use of threat (fear) to reduce adolescent risk taking: A Literature review: Unpublished report prepared for VicRoads.
Elliott, B. J. (2011). Beyond reviews of road safety mass media campaigns: Looking elsewhere for new insights. Journal of the Australasian College of Road Safety, 22(4), 11-18.
Glendon, A. I., & Walker, B. L. (2013). Can anti-speeding messages based on protection motivation theory influence reported speeding intentions? Accident Analysis & Prevention, 57, 67-79. doi:10.1016/j.aap.2013.04.004
Harman, B., & Murphy, M. (2008). The application of social marketing in reducing road traffic accidents amoung young male drivers: an investigation using physical fear threat appeals. International Journal of Business and Management, 3(7), 129-139.
Harré, N., Foster, S., & O’Neill, M. (2005). Self‐enhancement, crash‐risk optimism and the impact of safety advertisements on young drivers. British journal of Psychology, 96(2), 215-230. doi:10.1348/000712605X36019
Hastings, G., Stead, M., & Webb, J. (2004). Fear appeals in social marketing: Strategic and ethical reasons for concern. Psychology & Marketing, 21(11), 961-986. doi:10.1002/mar.20043
Henley, N., & Donovan, R. (1999). Threat appeals in social marketing: Death as a ‘Special Case’. International Journal of Nonprofit and Voluntary Sector Marketing, 4(4), 300-319.
Hoekstra, T., & Wegman, F. (2011). Improving the effectiveness of road safety campaigns: Current and new practices. IATSS Research, 34(2), 80-86. doi:10.1016/j.iatssr.2011.01.003
Job, R. F. S. (1990). The application of learning theory to driving confidence: The effect of age and the impact of random breath testing. Accident Analysis & Prevention, 22(2), 97-107.
Kline, R. B. (2011). Principles and practice of Structural Equation Modeling. New York: The Guilford Press.
Lewis, I. M., Watson, B., Tay, R., & White, K. M. (2007). The Role of Fear Appeals in Improving Driver Safety: A Review of the Effectiveness of Fear-arousing (threat) Appeals in Road Safety Advertising. International Journal of Behavioral Consultation and Therapy, 3(2), 203-222.
Lewis, I. M., Watson, B., & White, K. M. (2008). An examination of message-relevant affect in road safety messages: Should road safety advertisements aim to make us feel good or bad? Transportation research part F: traffic psychology and behaviour, 11(6), 403-417. doi:10.1016/j.trf.2008.03.003
Lewis, I. M., Watson, B., & White, K. M. (2010). Response efficacy: the key to minimizing rejection and maximizing acceptance of emotion-based anti-speeding messages. Accident Analysis & Prevention, 42(2), 459-467. doi:10.1016/j.aap.2009.09.008
Lewis, I. M., Watson, B., & White, K. M. (2013). Extending the explanatory utility of the EPPM beyond fear-based persuasion. Health Commun, 28(1), 84-98. doi:10.1080/10410236.2013.743430
Maloney, E. K., Lapinski, M. K., & Witte, K. (2011). Fear appeals and persuasion: A review and update of the
extended parallel process model. Social and Personality Psychology Compass, 5(4), 206-219. doi:10.1111/j.1751-9004.2011.00341.x
Masked protesters warn drivers of upcoming speed cameras in protest of WA Government revenue raising. (2014, 28, August). Perth now. Retrieved from http://www.perthnow.com.au/news/western-australia/masked-protesters-warn-drivers-of-upcoming-speed-cameras-in-protest-of-wa-government-revenue-raising/story-fnhocxo3-1227040659341
Muthusamy, N., Levine, T. R., & Weber, R. (2009). Scaring the already scared: Some problems with HIV/AIDS fear appeals in Namibia. Journal of Communication, 59(2), 317-344. doi:10.1111/j.1460-2466.2009.01418.x
New South Wales Government. (n.d.). Speeding - No One Thinks Big Of You. Strategic Communications. Retrieved from http://www.advertising.nsw.gov.au/campaigns/speeding-no-one-thinks-big-you
O’Rourke, J. (2000, 17, December). Shock tactics to stop carnage. The Sun Herald.
O’Rourke, J. (2015, 4, January). Block Their Shot: Social media campaign blocking mobile speed cameras from clocking drivers. The Daily Telegraph. Retrieved from http://www.dailytelegraph.com.au/news/nsw/block-their-shot-social-media-campaign-blocking-mobile-speed-cameras-from-clocking-drivers/story-fnpn118l-1227173575482
Pedruzzi, R., & Swinbourne, A. L. (2009). It won’t happen to me: optimism, biases, and recall of road-risk information. Paper presented at the Australian College of Road Safety Conference: Road safety 2020: smart solutions, sustainability, vision, Perth, Australia.
Pedruzzi, R., Swinbourne, A. L., & Quirk, F. (2012). One size fits all: communicating the unknown in health promotion. International journal of behavioral medicine, 19(Suppl 1), S273-S274.
Pedruzzi, R., Swinbourne, A. L., & Quirk, F. (2016). Fear campaigns and control appraisals: Creating messages that matter in road safety. Road & Transport Research: A Journal of Australian and New Zealand Research and Practice, 25(3), 28-39.
Peters, G. J., Ruiter, R. A., & Kok, G. (2012). Threatening communication: a critical re-analysis and a revised meta-analytic test of fear appeal theory. Health Psychol Rev, 7(Suppl 1), S8-S31. doi:10.1080/17437199.2012.703527
Rimal, R. N., & Real, K. (2003). Perceived risk and efficacy beliefs as motivators of change. Human Communication Research, 29(3), 370-399. doi:10.1111/j.1468-2958.2003.tb00844.x
Ruiter, R. A., Abraham, C., & Kok, G. (2001). Scary warnings and rational precautions: A review of the psychology of fear appeals. Psychology & Health, 16(6), 613-630. doi:10.1080/08870440108405863
Ruiter, R. A., Verplanken, B., Kok, G., & Werrij, M. Q. (2003). The role of coping appraisal in reactions to fear appeals: Do we need threat information? J Health Psychol, 8(4), 465-474. doi:10.1177/13591053030084006

Journal of the Australian College of Road Safety – Volume 28 No. 3, 2017
42
Tay, R. (1999). Effectiveness of the anti-drink driving adverstising campaign in New Zealand. Road & Transport Research, 8(4), 3-15.
Tay, R. (2005). The effectiveness of enforcement and publicity campaigns on serious crashes involving young male drivers: Are drink driving and speeding similar? Accident Analysis & Prevention, 37(5), 922-929.
Tay, R. (2011). Drivers’ perception of two seatbelt wearing advertisements with different emotional appeals and cultural settings. Journal of the Australasian College of Road Safety, 22(4), 82.
Tay, R., & Watson, B. (2002). Changing drivers’ intentions and behaviours using fear-based driver fatigue advertisements. Health Marketing Quarterly, 19(4), 55-68. doi:10.1300/J026v19n04_05
Veitch, C., Sheehan, M. C., Turner, R., Siskind, V., & Pashen, D. (2005). The economic, medical and social costs of road traffic crashes in rural north Queensland: a 5-year multi-phase study. Paper presented at the National Rural Health Conference, Alice Springs.
Walton, D., & McKeown, P. (2001). Drivers’ biased perceptions of speed and safety campaign messages. Accident Analysis & Prevention, 33(5), 629-640. doi:10.1016/S0001-4575(00)00076-2
Witte, K. (1992). Putting the fear back into fear appeals: The extended parallel process model. Communications Monographs, 59(4), 329-349. doi:10.1080/03637759209376276
Witte, K. (1996). Predicting risk behaviors: Development and validation of a diagnostic scale. J Health Commun, 1(4), 317-342. doi:10.1080/108107396127988
Witte, K., & Allen, M. (2000). A Meta-Analysis of Fear Appeals: Implications for Effective Public Health Campaigns. Health Education & Behavior, 27(5), 591-615. doi:10.1177/109019810002700506
Witte, K., Berkowitz, J. M., Cameron, K. A., & McKeon, J. K. (1998). Preventing the spread of genital warts: Using fear appeals to promote self-protective behaviors. Health Education & Behavior, 25(5), 571-585. doi:10.1177/109019819802500505
Woolley, J. E. (2001). Literature review on best practice with mass media. Retrieved from Adelaide:
Wundersitz, L. N., & Hutchinson, T. P. (2011). What can we learn from recent evaluations of road safety mass media campaigns? Journal of the Australasian College of Road Safety, 22(4), 40-47.
Wundersitz, L. N., Hutchinson, T. P., & Woolley, J. E. (2010). Best practice in road safety mass media campaigns: A literature review. Retrieved from http://casr.adelaide.edu.au/publications/list/?id=1165:
Appendix
Factor loadings and structural pathways for model employing control over protective (safe) behaviours2
**p < .001
Journal of the Australian College of Road Safety – Volume 28 No. 3, 2017
43
Understanding parental beliefs relating to child restraint system (CRS) use and child vehicle occupant safety.Suzanne L. Cross1, Judith L. Charlton PhD1 and Sjaan Koppel PhD1
1 Monash University Accident Research Centre, Monash University, Clayton, VIC, 3800 AUSTRALIA
Corresponding Author: Suzanne L. Cross, 21 Alliance Lane, Monash University Accident Research Centre, Monash University, Clayton, VIC 3800. +61 3 9902 0452 [email protected]
Key Findings • Despite motor vehicle crashes being a leading cause of childhood death and serious injury in Australia, significant gaps
remain in parents’ knowledge regarding child restraint system (CRS) use and child occupant safety. • More than half of the parents who completed an online survey (59%) reported that the minimum recommended height
(145cm), for a child to most safely transition from a CRS to an adult seatbelt, would be reached by most children by the age of seven years.
• Parents tended to attribute the responsibility of child vehicle occupant safety to internal factors such as their own driving abilities and their own safety compliance, rather than external factors such as fate.
• Results suggest that there are still significant gaps in parents’ understanding about CRS use and child occupant safety which is important for the development and success of future child occupant safety initiatives.
AbstractThe aim of the current study was to understand Australian parents’ beliefs relating to child restraint system (CRS) use and child vehicle occupant safety. Three hundred and eighty parents completed an online survey related to CRS knowledge and their beliefs about which factors (the influence of internal and external) influence child vehicle occupant safety. The online survey was active from June 2013 until November 2014. Results revealed a wide variation in parents’ beliefs relating to CRS use and child vehicle occupant safety. The majority of parents responded correctly to CRS related questions, including: the appropriate CRS for child vehicle occupants aged between four and seven years (95%); and the need to adjust CRS harnesses for each trip for optimal safety (91%). However, half of the parents (50%) held the misconception that the after-market H-harness accessory, provided additional protection to their child/ren, regardless of the context of use and 41 percent of parents incorrectly believed that their child/ren would reach the recommended height (145cm) for a safe adult seatbelt fit by the age of seven years. Parents tended to attribute the responsibility of child/ren’s vehicle occupant safety to internal factors such as their own driving abilities (64%) and their own safety compliance (64%), rather than external factors (e.g., fate [7%]). The results of the current study suggest that there are still significant gaps in Australian parents’ understanding about CRS use and child occupant safety which is important for the development and success of future child occupant safety initiatives.
KeywordsChild vehicle occupant safety, child restraint systems (CRS), CRS use, CRS misuse
IntroductionMotor vehicle crashes remain a leading cause of childhood death and serious injury in Australia and in most OECD countries (Commonwealth of Australia, 2016; World Health Organization, 2008). Child Restraint Systems (CRS) are designed to provide specialised protection to child vehicle occupants in the event of a crash, with research demonstrating that CRS can effectively reduce the risk of child vehicle occupant death and injury by approximately 70 percent when compared to restraint by an adult seatbelt (Brown, McCaskill, Henderson, & Bilston, 2006; Durbin, Elliott, & Winston, 2003). The Australian government introduced new CRS legislation in 2009 mandating the
use of an age-appropriate CRS until children reach the age of at least seven years (National Road Transport Commission, 2009). The updated legislation included the following Australian Road Rules (National Road Transport Commission, 2009):
• All children under the age of 6 months must be restrained in a rearward-facing approved CRS;
• All children aged between 6 months and 4 years must be restrained by a rearward-facing OR forward facing approved CRS, with the type of restraint dependent on the child’s height and weight;

Journal of the Australian College of Road Safety – Volume 28 No. 3, 2017
44
• All children aged between 4 and 7 years of age must be restrained in either a forward-facing approved CRS with an inbuilt harness, OR an approved belt-positioning booster seat, with the type of restraint dependent on the child’s height and weight;
• A child aged 7 years to 16 years must travel in either an approved booster seat OR an adult seatbelt, with the type of restraint will depend on the child’s size, and
• A person 16 years of age and over must travel in an adult seatbelt.
In addition, the legislation states that CRS transitions (from one type to the next) be guided by age, however transitions are also dependent on the child’s size (National Road Transport Commission, 2009). Shoulder markings on CRS provide a visual guidance for transition based on size and are now included in the Safety Standards of all CRS (Standards Australia/Standards New Zealand, 2010). Use of a child safety harness with a belt positioning booster seat (BS), commonly referred to as the H-harness, ‘is recommended only in situations where it is not possible to replace (the) lap-only seatbelt with a lap-sash seatbelt’ (VicRoads, 2014, p. 1).
Previous research indicates high CRS use rates by Australian child vehicle occupants aged 0-12 years (Koppel et al., 2008; Koppel et al., 2013b), however the specialised protection provided by CRS relies on correct and appropriate CRS use. ‘Incorrect CRS use’ is defined as the use of a CRS system contrary to the manufacturer’s instruction, and used in ways other than those intended and includes: installation errors, harnessing/belt errors, and child movement/posture away from the ‘ideal’ position within the CRS (Ivers et al., 2011). ‘Inappropriate CRS use’ is defined as the use of a CRS by a child that is not within the height or age range for which the system was designed and safety tested (Ivers et al., 2011). Australian research suggests that there are significant implications of CRS misuse for injury risk in the event of a motor vehicle crash, particularly to the head, spine and abdomen (Bilston et al., 2007; Brown et al., 2006).
The role of parental knowledge and CRS use and child vehicle occupant safetyThe relationship between parents’ knowledge and CRS use and misuse was recently investigated following the introduction of Australia’s CRS legislation changes in 2009 (Koppel, et al., 2013b). Koppel and colleagues surveyed 272 parents with children aged between three and ten years. Findings revealed that although most parents reportedly ‘always’ restrained their child/ren (99%), over half did not know the best time to graduate their children from a booster seat to an adult seatbelt (53%) or the age for which it is appropriate for their child to sit in the front passenger seat of the vehicle (20%). However, previous research has not explored how parental beliefs may influence their use of CRS.
Parental beliefsThe Health Belief Model (HBM) offers a useful framework for understanding how parents’ knowledge and beliefs might
guide their expectations and influence their behaviour with respect to their children’s transportation safety (Butler, 2001). The HBM has its foundations in Social Learning psychology and focuses on understanding beliefs to assist in the prediction of health behaviours (Bandura, 1971; Rosenstock, 1974). In the HBM, beliefs are explained in terms of perceptions of threat, perceived benefits and the perceived consequences (Nelson & Moffit, 1988). Perceptions are described as an individual’s internal ‘picture’ or representation of the world (Reisberg, 2007). Existing belief systems, their subjective interpretation and reflection on past experiences assist the individual to evaluate and interpret a situation or event (Stutts et al., 2003). Importantly, the perception formed, may either reflect reality, or may not, that is, it may be a misconception (Weiten, 2005).
The HBM has been successfully applied to child injury research by Peterson and colleagues (Peterson, Farmer, & Kashani, 1990). Findings from this research show a significant positive association between HBM belief constructs of parents (knowledge, competence to teach, effort required and perceived benefits to safety) and reported teaching and environmental interventions to reduce child injury risk. In other research, the HBM has been used to explore parents’ perceptions of risk for the purpose of guiding future interventions for improving CRS use (Chen, Yang, Peek-Asa, & Li, 2014; Will & Geller, 2004).
In the context of children’s safety in motor vehicles, the HBM might predict that parents who are aware of their child/ren’s susceptibility to injury (threat) in the event of a motor vehicle crash and aware of the improved safety (benefits) offered from appropriate and correct CRS use are more likely to engage in behaviours conducive to child occupant safety. Arguably, these combined beliefs might influence parents’ engagement in precautionary behaviours and facilitate their acceptance of information about safe use of CRS such as routine checking of harnesses and correct decisions regarding CRS transitions. A recent qualitative study in China found that ‘lack of awareness’ was the most important factor explaining the low rate of CRS use (Chen et al., 2014). In contrast, a recent cluster randomised controlled trial of 830 families conducted by Hunter and colleagues (Hunter et al., 2015) in New South Wales, Australia, demonstrated that the delivery of information sessions to parents of children enrolled in preschools and day care centres significantly improved the use of age appropriate CRS. These findings suggest that there may be a benefit to be gained by providing appropriate knowledge to parents to guide beliefs on child vehicle occupant injury risk and skills on optimal use of CRS to improve the safety of children in motor vehicle travel in Australia.
The concept of Locus of control (LOC) offers another framework for understanding and categorising beliefs (Rotter, 1954). LOC focuses on the individual’s belief systems about responsibility and accountability for their own behaviours and the perceived self-control over actual and possible events. Individuals with a high internal LOC view themselves as responsible for events and outcomes, conversely individuals with high external LOC consider
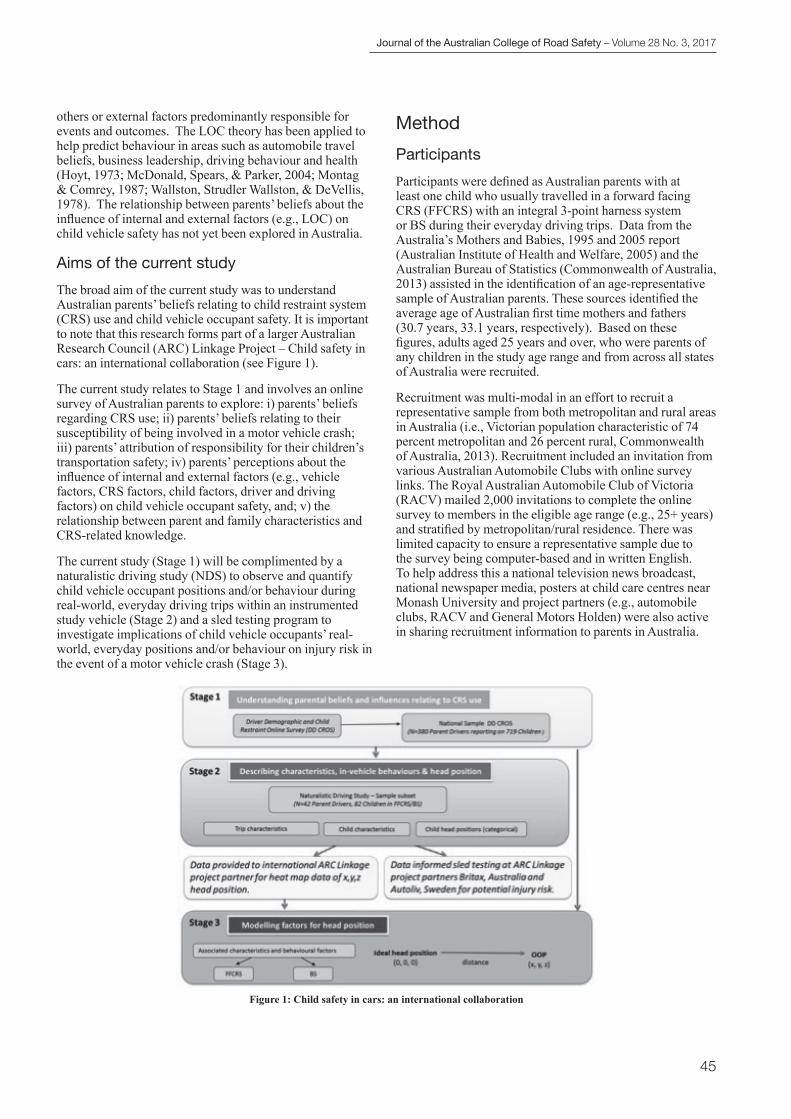
Journal of the Australian College of Road Safety – Volume 28 No. 3, 2017
45
others or external factors predominantly responsible for events and outcomes. The LOC theory has been applied to help predict behaviour in areas such as automobile travel beliefs, business leadership, driving behaviour and health (Hoyt, 1973; McDonald, Spears, & Parker, 2004; Montag & Comrey, 1987; Wallston, Strudler Wallston, & DeVellis, 1978). The relationship between parents’ beliefs about the influence of internal and external factors (e.g., LOC) on child vehicle safety has not yet been explored in Australia.
Aims of the current studyThe broad aim of the current study was to understand Australian parents’ beliefs relating to child restraint system (CRS) use and child vehicle occupant safety. It is important to note that this research forms part of a larger Australian Research Council (ARC) Linkage Project – Child safety in cars: an international collaboration (see Figure 1).
The current study relates to Stage 1 and involves an online survey of Australian parents to explore: i) parents’ beliefs regarding CRS use; ii) parents’ beliefs relating to their susceptibility of being involved in a motor vehicle crash; iii) parents’ attribution of responsibility for their children’s transportation safety; iv) parents’ perceptions about the influence of internal and external factors (e.g., vehicle factors, CRS factors, child factors, driver and driving factors) on child vehicle occupant safety, and; v) the relationship between parent and family characteristics and CRS-related knowledge.
The current study (Stage 1) will be complimented by a naturalistic driving study (NDS) to observe and quantify child vehicle occupant positions and/or behaviour during real-world, everyday driving trips within an instrumented study vehicle (Stage 2) and a sled testing program to investigate implications of child vehicle occupants’ real-world, everyday positions and/or behaviour on injury risk in the event of a motor vehicle crash (Stage 3).
MethodParticipantsParticipants were defined as Australian parents with at least one child who usually travelled in a forward facing CRS (FFCRS) with an integral 3-point harness system or BS during their everyday driving trips. Data from the Australia’s Mothers and Babies, 1995 and 2005 report (Australian Institute of Health and Welfare, 2005) and the Australian Bureau of Statistics (Commonwealth of Australia, 2013) assisted in the identification of an age-representative sample of Australian parents. These sources identified the average age of Australian first time mothers and fathers (30.7 years, 33.1 years, respectively). Based on these figures, adults aged 25 years and over, who were parents of any children in the study age range and from across all states of Australia were recruited.
Recruitment was multi-modal in an effort to recruit a representative sample from both metropolitan and rural areas in Australia (i.e., Victorian population characteristic of 74 percent metropolitan and 26 percent rural, Commonwealth of Australia, 2013). Recruitment included an invitation from various Australian Automobile Clubs with online survey links. The Royal Australian Automobile Club of Victoria (RACV) mailed 2,000 invitations to complete the online survey to members in the eligible age range (e.g., 25+ years) and stratified by metropolitan/rural residence. There was limited capacity to ensure a representative sample due to the survey being computer-based and in written English. To help address this a national television news broadcast, national newspaper media, posters at child care centres near Monash University and project partners (e.g., automobile clubs, RACV and General Motors Holden) were also active in sharing recruitment information to parents in Australia.
Figure 1: Child safety in cars: an international collaboration

Journal of the Australian College of Road Safety – Volume 28 No. 3, 2017
46
MaterialsThe Driver Demographic and Child Restraint Online Survey (DDCROS) was developed to investigate parental beliefs relating to CRS use and child vehicle occupant safety. The online survey comprised five discrete sections:
1. Participant demographics;2. Driving history;3. Restraint use and knowledge about CRS;4. Travel safety beliefs, and 5. Child occupant safety LOC beliefs. For the purpose of this study, beliefs relating to child occupant safety were investigated using ‘true’ or ‘false’ answers to questions on CRS related knowledge (Section C, see Table 4). Correct answers were operationalised as knowledge. Incorrect answers, or beliefs that differed from the factual evidence, were operationalised as misconceptions.
The susceptibility of threat construct of the HBM was applied to investigate parents’ beliefs about their susceptibility of being involved in a motor vehicle crash. Parents were asked ‘How concerned are you about the possibility of being in a car crash?’ Responses were on a 4-point Likert scale; ‘not at all’, ‘somewhat’, ‘quite’ and ‘extremely concerned’.
Parental perceptions relating to child occupant vehicle safety were also explored using a set of LOC questions which focussed on perceived responsibility and accountability for their own behaviours and control over actual and possible events (see Table 1). Factors were classified as either internal (e.g., their own driving abilities, their safety compliance, their choice of CRS) or external (e.g., other driver’s behaviours, road maintenance, legislation, fate). For each safety factor, parents were asked to use a slider scale (lowest to highest: 0-100%) to indicate the strength to which they believed each factor was responsible for child occupant safety. Ratings over 80 percent (≥80%) were classified as a high attribution of responsibility. This measure identified
whether parents’ considered general travel safety to be the responsibility of self (internal) or others (external).
Procedure Ethical approval was granted by Monash University Human Research Ethics Committee (MUHREC). Participants were invited to complete the DDCROS. Participation was voluntary and without compensatory incentive and took approximately 25-35 minutes. The DDCROS also included an invitation to participate in an observational driving study that is part of a broader research program (Stage 2, see Charlton et al., 2013).
AnalysisCompleted DDCROS responses were uploaded to a secured Qualtrics online survey website and downloaded and imported into SPSS Statistics 20 for data analysis. Data was cleaned and transformed prior to analysis and cases were deleted when critical variables were missing. Descriptive analyses were used to describe sample characteristics and responses to relevant DDCROS items, and univariate analyses (e.g., chi squares) were used to explore the relationships between variables of interest.
ResultsParticipantsResponses to the DDCROS were collected from 569 Australian parents with at least one child aged between one and eight years who used a FFCRS or BS. A total of 189 incomplete surveys were removed from the analyses due to missing data (i.e., responses relating to CRS related knowledge). Responses from the remaining 380 completed surveys were analysed.
A summary of the parents’ demographic characteristics is presented in Table 2. Most parents who completed the DDCROS were: female (80%), only spoke English (91%) and were married or in a defacto relationship (92%). Most parents who completed the DDCROS had completed a
Factors High attribution of responsibility (≥80%)
Low attribution of responsibility ≤79% Unanswered*
Internal LOC (self-accountability) Own driving abilities 241 (64) 104 (27) 35 (9) Safety compliance 241 (64) 104 (27) 35 (9) Choice of CRS 232 (61) 112 (30) 36 (9) Choice of vehicle 144 (38) 201 (53) 35 (9)External LOC (accountability to others) Other driver’s behaviours 190 (50) 153 (40) 37 (10) Road maintenance 89 (24) 257 (67) 34 (9) Legislation/Policy Makers 79 (21) 267 (70) 34 (9) Fate 25 (7) 321 (84) 34 (9)
Table 1. Parental beliefs about responsibility for child occupant safety
*n=380

Journal of the Australian College of Road Safety – Volume 28 No. 3, 2017
47
minimum of a tertiary/university education (67%), and nearly half of the sample earned a combined household gross income of $110,000AUD (46%). Over one third of parents reported that they worked/studied full time (38%). Most parents reported having two children (46%) and having more than four years’ parenting experience (58%).
Driving historyApproximately three quarters of parents who completed the DDCROS had more than ten years driving experience on a full licence (76%, see Table 3). Most parents reported no history of property damage crashes (89%) and no crash history resulting in injury (97%). Amongst those parents who reported receiving a driving-related infringement in the previous two years (25%), the most common infringement types were speeding (83%) and failing to stop (9%).
Demographic variables n (%)Gender
MalesFemales
76 (20)304(80)
Area of ResidenceMetropolitanRural
261 (69)119 (31)
Age group of parent (years)20-29 30-3940-4950-5960+Unspecified
60 (16)197 (52)92 (24)9 (2)3 (1)19 (5)
EthnicityBorn in AustraliaBorn elsewhere
305 (80)75 (20)
Language other than EnglishNoYesUnknown
346 (91)32 (8)21 (1)
Marital statusMarried/DefactoDivorced/SeparatedWidowedNever marriedNot specified
348 (92)12 (3)1 (<1)15 (4)3 (<1)
Education levelTAFE, VCE/HSC or less UniversityHigher Degree
127 (33)167 (44)86 (23)
Gross income bracket (000,AUD$)<5050 - <110110 +Not Specified
37 (10)163 (43)176 (46)4 (1)
Work status Working/Studying full-time, self-employedWorking/Studying part-time/casual,Volunteering, Carer (eg. children), unemployed, parental leave, pension
146 (38)
133 (35)101 (27)
Number of children1234+
132 (35)176 (46)53 (14)19 (5)
Parents with at least one child in age group†
Child under 1 year Child 1 to under 4 years Child 4 to under 7 years Child 7 years plus
60 (16)252 (66) 172 (45)104 (27)
Years of parenting experience0-<4 years4-<7 years7 years+
161 (42)116 (31)103 (27)
Table 2. Participant demographics
† Groups are not mutually exclusive and parents may be represented more than once.
Driving history variables n (%)Years driving experience on full licence Less than 5 years 5-10 years 10-15 years 15-20 years 20+ Not specified
23 (6)62 (16)85 (23)107 (28)95 (25)8 (2)
Crash history - property damage (last 2 years) None 1 2 3 4 5+
340 (89)36 (9)3 (1)0 (0)0 (0)1 (1)
Crash History – Injury (last 2 years) None 1 Unspecified
368 (97)5 (1)7 (2)
History of traffic infringement (last 2 years) No Yes Unspecified
287 (76)92 (24)1 (<1)
Types of traffic infringements (n=95, 25%) Speeding Failing to stop Distraction Failing to signal Didn’t know
79 (83)8 (9)3 (3)3 (3)2 (2)
Table 3. Driving history

Journal of the Australian College of Road Safety – Volume 28 No. 3, 2017
48
CRS useParents were asked questions about all of their children who were aged under 16 years. This equated to 719 children (males = 365, females = 352, gender not specified = 2). Table 4 shows the types of CRS used for these 719 children. Most children usually travelled in a FFCRS (45%) or a BS (23%). The use of an aftermarket H-harness accessory was minimal (2% or less) with FFCRS, BS or unspecified restraint types.
Parents’ knowledge about CRS use Parents’ knowledge about CRS use was ascertained by their responses to ten true/false questions. Table 5 summarises the findings with the questions presented in descending order of percentage of correct responses.
The majority of parents responded correctly to the questions relating to: the safety benefits of children travelling in the rear versus front passenger seat (97%) (Q6); the appropriate CRS for children aged between four and seven years (95%) (Q4); and the need to adjust harnesses for each trip for optimal safety (91%) (Q10). Additionally, most parents correctly identified the purpose of seatbelt guides on BS (89%) (Q9) and the minimum recommended height for use of a seatbelt (85%) (Q5).
Up to three-quarters of parents (66-76%) were able to correctly identify important CRS transition recommendations (Q1-3). Approximately three quarters of parents (76%) were able to correctly identify that the transition from a RFCRS to a FFCRS may occur from six months of age, dependent on size (Q1) and that the transition from a FFCRS to a BS may occur from four years and is also dependent on size (Q2), with visual shoulder markers to guide this transition (75%), (Q3). Approximately two thirds (66%) of parents correctly indicated that CRS transition from a FFCRS into a BS should be guided by age as well as on children’s individual height (Q2).
In contrast, forty-one percent of parents incorrectly responded that most children would reach the recommended height for transitioning into an adult seatbelt by seven years of age (Q8) and half of the parents (50%) incorrectly responded that the H-harness provides an added safety benefit for children in all situations (Q7).
Scores were summed to provide an overall score reflecting parents’ general level of CRS-related knowledge (see Figure A1 in Appendix). All parents answered at least three questions correctly and 16 percent answered all ten questions correctly. For the purpose of further analyses, parents were divided into two groups based on an arbitrary cut-point: low CRS-related knowledge score group (7 correct responses or less) and high CRS-related knowledge score group (8 correct responses or more). Forty percent of parents were allocated to the low knowledge score group.
The relationship between parent characteristics, driving history and CRS-related knowledge scores (high CRS-related knowledge vs. low CRS-related knowledge) is presented in Table 6. There was a significant relationship
between CRS-related knowledge scores and parental age, gender and age of child/ren in family (parental age: c2 (2) = 15.330, p < 0.001; gender: c2 (1) = 8.011, p < 0.01; at least one child aged under one year: c2 (1) = 5.083, p < 0.05; and at least one child aged between one and four years: c2 (1) = 6.102, p < 0.05, respectively). Male parents were more likely to be in the low CRS-related knowledge group (54%) than females (36%). Parents aged 40 years and older were more likely to be in the low CRS-related knowledge group (55%) compared to parents aged 20-29 years and 30-39 years (27%, 36%, respectively). Parents with at least one child aged under one year were significantly more likely to be in the high CRS-related knowledge group (73%) compared to the low CRS-related knowledge score group (27%). Similarly, parents with at least one child aged between one and four years were also significantly more likely to be in the high CRS-related knowledge group (65%) compared to low CRS-related knowledge group (35%). There were no other significant relationships between parent characteristics and CRS-related knowledge scores.
Beliefs relating to travel safetyParents’ beliefs relating to crash susceptibility were measured using their rating of concern for being involved in a motor vehicle crash. Most parents reported that they were ‘not at all’ or ‘somewhat’ concerned about involvement in a motor vehicle crash (6%, 53%, respectively), while 29 percent were ‘quite’ concerned and 12 percent were ‘extremely concerned’. Almost two-thirds of parents reported a high attribution of responsibility for their children’s occupant safety to internal factors such as their own driving ability (64%), safety compliance (64%), and choice of CRS (61%). Fifty percent of parents reported high attributions to other drivers’ behaviours, while more modest levels of reporting were observed for other external factors including road maintenance (24%), legislation (21%) and fate (7%).
Table 4. Restraint type used by children
Restraint type n (%)Rearward facing child restraint with integral 3-point harness (RFCRS) 111 (15)Forward facing child restraint with integral 3-point harness (FFCRS) 326 (45)Forward facing child restraint with integral 3-point harness with added H-harness accessoryBooster Seat using shoulder and lap seatbelt (BS)
1 (<1)162 (23)
Booster Seat using shoulder and lap seatbelt with added H-harness accessory 16 (2)Backless booster cushion with shoulder and lap seatbelt 10 (1)Adult seatbelt – lap/sash 79 (11)Adult seatbelt – lap onlyH-harness accessory without specification of restraint typeUnknown
4 (1)
4 (1)6 (1)

Journal of the Australian College of Road Safety – Volume 28 No. 3, 2017
49
Parents were asked to rank the factors that may influence their choice of CRS, including the safety rating of the CRS, fines/legal deterrents, and community or family advice (where 1= highest ranked influence, 6 = lowest ranked influence. See Table A1 in Appendix). Most parents reported that the safety rating specified in the CRS Buyers Guide had the most influence over their choice of CRS (84%). Parents were also asked to rank six factors that influence child occupant safety, including type of vehicle, type/brand of CRS, restraint fitment in car, child/ren’s rear seating location in car, child/ren’s movement during motor vehicle travel and driving performance (where 1 = most influential, 6 = least influential. See Table A2 in Appendix). Parents ranked driving performance (35%) and the fitment of the CRS into the motor vehicle (30%) as the most influential factors for child occupant safety. In contrast, child/ren’s movement during vehicle travel was ranked most influential by only three percent of parents.
DiscussionThis study has identified a number of interesting findings. The majority of parents were able to correctly answer questions related to the recommended transition from one restraint to the next based on age and visual marker guides. In contrast, most parents were not able to correctly identify the recommended height for transitioning their child into an adult seatbelt safely. Interestingly, parents with children under the age of four years were more likely to be in the high CRS related knowledge group. Females were more likely to be in the high CRS knowledge group, whereas males were more likely to be in the low CRS knowledge group.
The aims of the current study were to explore parents’ beliefs regarding CRS use, travel safety and the factors that may influence child occupant safety. Results revealed a wide variation in parents’ beliefs relating to CRS use and child vehicle occupant safety. When asked about their knowledge regarding CRS use, 97 percent of parents correctly reported that their children are safest when travelling in the rear of the vehicle. Most parents also correctly reported that the most appropriate type of CRS for children aged between four and seven years is a BS (95%). Most parents also reported the importance of correct CRS use for each individual trip by identifying the need to adjust harnesses for maximum safety (91%) and to use BS sash guides (89%).
Recommended CRS transition times from one CRS type to the next was less well known with three quarters (75%) of parents able to correctly identify transition recommendations from a FFCRS to a BS. Parents were required to have an understanding of transition times being dependent on age, size and be guided by the visual shoulder markers, as outlined in the recent safety standards. Using a different approach, an earlier study by Brown and colleagues (Brown, Fell, & Bilston, 2010) used mannequins for CRS inspections and found significantly fewer restraint errors in judging restraint appropriateness. This suggests some success in communicating CRS transition times to parents. Further initiatives may be warranted to reduce any remaining confusion and ambiguity between age and size that was found in this study.
Over 40 percent of parents incorrectly believed that most children would be at an appropriate height to be restrained effectively and safely by an adult seatbelt by the age of seven years. Previous research suggests that
Table 5. Summary of parents’ responses to CRS knowledge questions
Question # Survey question Correct n (%)
Incorrect n (%)
Unanswered n (%)
6 Research shows that children under the age of 16 years are at 40% greater injury risk in front seat.
367 (97) 13 (3) 0 (0)
4 Children 4-7 years to use FFCRS or BS. The type will depend on the child’s size.
361 (95) 19 (5) 0 (0)
10 Harnesses need to be adjusted for each trip for best protection against injury.
346 (91) 33 (9) 1 (<1)
9 Main purpose of seatbelt guides on BS to encourage correct placement of sash seatbelt.
339 (89) 39 (10) 2 (1)
5 An adult lap/sash seatbelt designed for people with a minimum height of 145cm.
323 (85) 52 (14) 4 (1)
1 Children older than 6 months should only be moved from RFCRS to FFCRS when they have outgrown RFCRS.
287 (76) 92 (24) 1 (<1)
3 FFCRS that comply with recent safety standards do not have a weight limit but instead use shoulder height markers to guide selection.
284 (75) 94 (25) 1 (<1)
2 All children 4-7 years should move into booster 252 (66) 128 (34) 0 (0)8 Most children reach seatbelt height by 7 years 222 (58) 156 (41) 2 (1)7 An ‘H-harness’ add-on accessory does not provide additional
protection to all booster seat use. 187 (49) 190 (50) 3 (1)
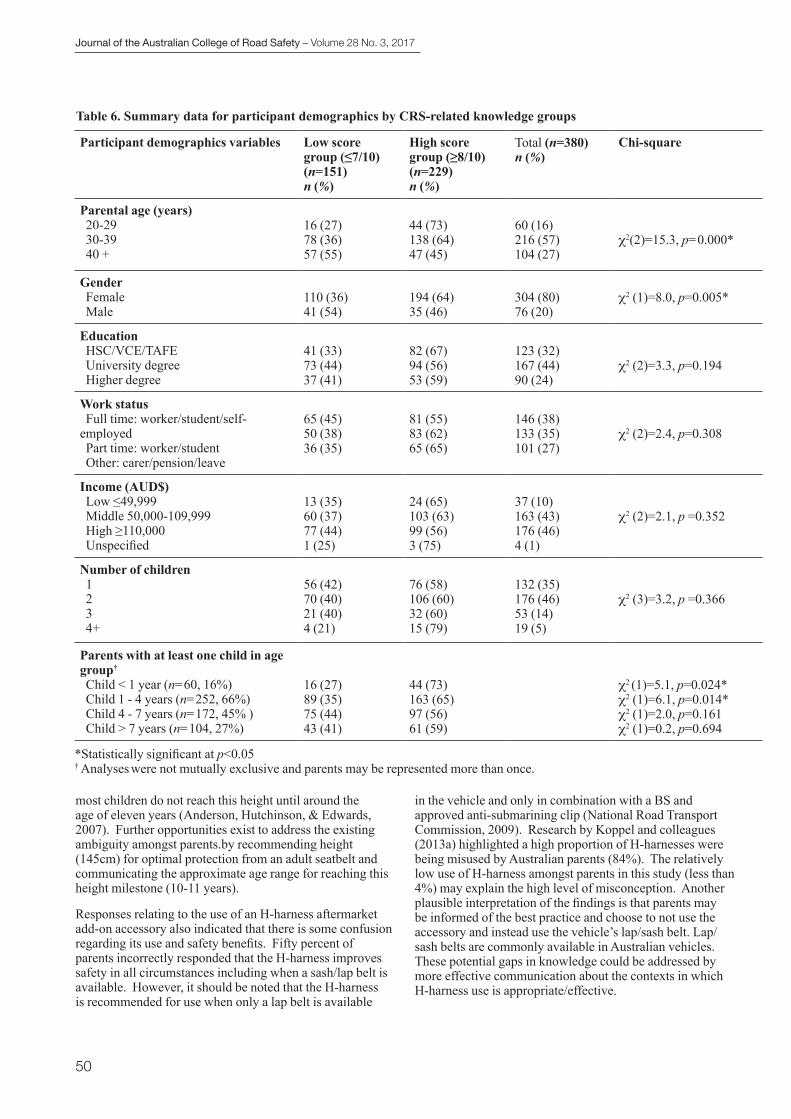
Journal of the Australian College of Road Safety – Volume 28 No. 3, 2017
50
most children do not reach this height until around the age of eleven years (Anderson, Hutchinson, & Edwards, 2007). Further opportunities exist to address the existing ambiguity amongst parents.by recommending height (145cm) for optimal protection from an adult seatbelt and communicating the approximate age range for reaching this height milestone (10-11 years).
Responses relating to the use of an H-harness aftermarket add-on accessory also indicated that there is some confusion regarding its use and safety benefits. Fifty percent of parents incorrectly responded that the H-harness improves safety in all circumstances including when a sash/lap belt is available. However, it should be noted that the H-harness is recommended for use when only a lap belt is available
in the vehicle and only in combination with a BS and approved anti-submarining clip (National Road Transport Commission, 2009). Research by Koppel and colleagues (2013a) highlighted a high proportion of H-harnesses were being misused by Australian parents (84%). The relatively low use of H-harness amongst parents in this study (less than 4%) may explain the high level of misconception. Another plausible interpretation of the findings is that parents may be informed of the best practice and choose to not use the accessory and instead use the vehicle’s lap/sash belt. Lap/sash belts are commonly available in Australian vehicles. These potential gaps in knowledge could be addressed by more effective communication about the contexts in which H-harness use is appropriate/effective.
Participant demographics variables Low score group (≤7/10)(n=151) n (%)
High score group (≥8/10)(n=229) n (%)
Total (n=380) n (%)
Chi-square
Parental age (years) 20-29 30-39 40 +
16 (27)78 (36)57 (55)
44 (73)138 (64)47 (45)
60 (16)216 (57)104 (27)
c2(2)=15.3, p=0.000*
Gender
Female Male
110 (36)41 (54)
194 (64)35 (46)
304 (80)76 (20)
c2 (1)=8.0, p=0.005*
Education
HSC/VCE/TAFE University degree Higher degree
41 (33)73 (44)37 (41)
82 (67)94 (56)53 (59)
123 (32)167 (44)90 (24)
c2 (2)=3.3, p=0.194
Work status
Full time: worker/student/self-employed Part time: worker/student Other: carer/pension/leave
65 (45)50 (38)36 (35)
81 (55)83 (62)65 (65)
146 (38)133 (35)101 (27)
c2 (2)=2.4, p=0.308
Income (AUD$) Low ≤49,999 Middle 50,000-109,999 High ≥110,000 Unspecified
13 (35)60 (37)77 (44)1 (25)
24 (65)103 (63)99 (56)3 (75)
37 (10)163 (43)176 (46)4 (1)
c2 (2)=2.1, p =0.352
Number of children 1 2 3 4+
56 (42)70 (40)21 (40)4 (21)
76 (58)106 (60)32 (60)15 (79)
132 (35)176 (46)53 (14)19 (5)
c2 (3)=3.2, p =0.366
Parents with at least one child in age group†
Child < 1 year (n=60, 16%)
Child 1 - 4 years (n=252, 66%)
Child 4 - 7 years (n=172, 45% )
Child > 7 years (n=104, 27%)
16 (27)89 (35)75 (44)43 (41)
44 (73)163 (65)97 (56)61 (59)
c2 (1)=5.1, p=0.024*c2 (1)=6.1, p=0.014*c2 (1)=2.0, p=0.161c2 (1)=0.2, p=0.694
Table 6. Summary data for participant demographics by CRS-related knowledge groups
*Statistically significant at p<0.05† Analyses were not mutually exclusive and parents may be represented more than once.
Journal of the Australian College of Road Safety – Volume 28 No. 3, 2017
51
The relationship between parent characteristics and CRS-related knowledge was also explored. Male participants were more likely to have lower CRS-related knowledge scores compared to female participants. Older participants (aged 40 years and older) were also more likely to have lower CRS-related knowledge scores compared to younger participants (aged between 22-39 years). Parents with children under four years of age were significantly more likely to have higher CRS-related knowledge than have lower CRS-related knowledge. Younger, female participants with children under four years of age may be more likely to have higher CRS-related knowledge scores because they may have had more recent exposure to maternal health care providers and other child-related health professionals. A plausible explanation for this would be recent communications with maternal health professionals. This finding supports recent research by Hunter and colleagues (2015) that revealed a relationship between exposure to information sessions regarding appropriate CRS use and actual appropriate CRS use. Other research has explored the challenges of promoting and achieving correct CRS use and acknowledged the importance of being able to deliver consistent CRS safety messages, as well as ensuring the delivering of tailored communications to minority groups (Brown et al., 2013; Weaver, Brixey, Williams, & Nansel, 2013). Knowing the target audience of those parents with lower CRS-related knowledge is a critical step to developing strategies that will encourage behaviour change.
Previous studies have identified a link between beliefs in terms of susceptibility to injury, LOC and behaviour (Bandura, 1971; Nelson & Moffit, 1988; Peterson, Farmer, & Kashani, 1990; Rosenstock, 1974). For example, individuals who understand motor vehicle injury risk and believe that they are accountable for safety have been shown to be more receptive to becoming engaged in seatbelt use (Hoyt, 1973). Despite the potential insights offered, no previous studies of LOC analysis of parents’ child occupant safety were identified. Arguably, initiatives may be more successful in optimising child safety when travelling in motor vehicles if there is a greater understanding of parents’ beliefs relating to crash injury risk, child occupant safety and the accountability for potential motor vehicle crash outcomes. When asked about whether they were concerned about being involved in a motor vehicle crash, parents reported being either ‘quite’ (29%) or ‘extremely concerned’ (12%) about being involved in a motor vehicle crash. This finding may mean that these parents will be more receptive to any CRS or child vehicle occupant safety initiatives.
Parents tended to attribute the responsibility of child vehicle occupant safety to internal factors such as their own driving abilities (64%), safety compliance (64%) and their choice of CRS (61%). Fewer attributed the responsibility to external factors such as other drivers (50%), road maintenance (24%) legislation (21%) and fate (7%). Early behavioural change research suggests that individuals who attribute the responsibility of the events/outcomes in their lives to internal factors are more receptive to adopting behaviour changes such as precautionary travel safety behaviours, when compared to the individuals that attribute responsibility of
the events/outcomes in their lives on others, luck/chance or fate (Hoyt, 1973). Encouragingly, few parents reported that they believed child vehicle occupant safety was luck or chance and therefore out of their control.
The findings of strong attribution of internal factors to child occupant safety indicates that parents may be receptive to future informative strategies to improve CRS knowledge. The strong influence of the CRS Buyers Guide on appropriate CRS use and the fitment of the CRS into the vehicle for optimal safety reported in this study is indicative of receptiveness to such current initiatives (Kidsafe Australia, 2014; RACV, 2014).
The study also explored parents’ perceptions of the factors that contribute to the provision of optimal child occupant safety. CRS use is dependent on correct installation and use. CRS use does not equate to protection (Brown, McCaskill, Henderson, & Bilston, 2006). The movement of the child while travelling in a CRS was considered by parents as most influential to child occupant safety by three percent of parents. Given that correct use of a CRS includes the placement of a child’s head within the protective zone of the CRS structure, with other placements potentially compromising safety delivered by the CRS, further exploration on movement is warranted.
Whether there is a relationship between CRS related knowledge and self-reported perceptions (such as safety consequences of child vehicle occupant movement) and child occupant travel behaviour, as suggested by the HBM (Bandura, 1971; Chen, et al., 2014; Rosenstock, 1974), will be further explored in a NDS. The injury consequences of child occupant movement and common OOP head placements will be explored in the next phase of this research through sled testing (see Stage 2, Figure 1). Future educational initiatives will be recommended from these findings.
Some limitations are noted. Despite attempts to recruit a representative sample, participants were predominantly female, had at least a university level of education and were in the two highest brackets for household combined gross income ($110,000 AUD or more). Therefore, the findings may not be representative of the general population. It should be noted that the study did successfully recruit 69% metropolitan participants and 31% rural participants which is consistent with recent Victorian data (Commonwealth of Australia, 2013). Another limitation to consider is the fact that the survey was only available in English language which may have biased the sample.
Also, findings reported in this study are based on responses to an online survey. While survey studies have provided valuable insights into child occupant safety, they have limitations in their capacity for accurate and unbiased reports regarding CRS use and misuse during real-world motor vehicle travel. For example, parents in the current study tended to attribute the responsibility of child occupant safety to internal factors such as their own driving performance. This may also be the result of social bias that has been evident in other research involving behaviours that may be

Journal of the Australian College of Road Safety – Volume 28 No. 3, 2017
52
deemed socially unacceptable (Williams, 2003). Parents may have reported themselves as being responsible for child occupant safety as it is socially expected and ‘the right thing to do’ rather than an accurate representation of their beliefs. Finally, the parental knowledge was measured by true or false questions. Parents’ CRS related knowledge should be explored further through the use of more qualitative and open ended interviewing techniques. To address the potential limitations associated with survey-based research on CRS use and misuse, a subset of participants from the current study (n = 42) were invited to participate in a NDS (Stage 2, Figure 1). NDS have been recently used to explore the nature and extent of CRS use and misuse (Andersson, Bohman, & Osvalder, 2010; Bohman et al., 2011; Charlton, Koppel, Kopinathan, & Taranto, 2010; Forman, Segui-Gomez, Ash, & Lopez-Valdes, 2011; Koppel, Charlton, Kopinathan, & Taranto, 2011). Importantly, NDS afford the possibility to examine the relative frequency and duration of occurrence of CRS misuse during everyday motor vehicle travel, providing better insight into the way in which child occupant safety may be compromised in the event of a motor vehicle crash. As part of Stage 2, participating families will be invited to drive an instrumented study vehicle (Charlton et al., 2013).
ConclusionAll parents demonstrated some level of knowledge on correct and appropriate CRS use, however a number of misconceptions and gaps in CRS related knowledge remain. A key finding was that most parents attributed child occupant safety to internal factors, which suggests that parents may be receptive to injury risk reduction initiatives. The recruited sample is not representative of the Australian population and may provide an under-estimation of gaps in CRS related knowledge. Future initiatives need to be broad and multicultural to capture the needs of the general population. Future research will use video data of child occupant behaviour from a NDS from the larger study to compare these self-reported online survey findings with real-world child occupant travel.
AcknowledgementsThe project is supported by the Australian Research Council Linkage Grant Scheme (LP110200334) and is a multi-disciplinary international partnership between Monash University, Autoliv Development AB, Britax Childcare Pty Ltd, Chalmers University of Technology, General Motors-Holden, Pro Quip International, Royal Automobile Club of Victoria (RACV), The Children’s Hospital of Philadelphia Research Institute, Transport Accident Commission (TAC), University of Michigan Transportation Research Institute and VicRoads. We also acknowledge the valuable recruitment contributions from General Motors-Holden, Royal Automobile Club of Victoria (RACV) Ltd, National Roads and Motorists’ Association (NRMA), Royal Automobile Club of Queensland (RACQ), Royal Automobile Association (South Australia) (RAASA), Royal Automobile Club of Western Australia (RACWA), Automobile Association of the Northern Territory (AANT), Royal Automobile Club of Tasmania (RACT).
In particular, we would like to specifically thank Melinda Congiu, Tim Davern and Elle Towner from the Road User Behaviour Team at RACV for their continuous support and Louise Purcell from VicRoads for her guidance in the survey development. Finally, we would like to thank the participants, without their involvement this study would not have been possible.
References Anderson, R. W. G., Hutchinson, T. P., & Edwards, S. A. (2007).
Using child age or weight in selecting type of in-vehicle restraint: implications for promotion and design. Paper presented at the Proceedings of 51st Annual Scientific Conference of the Association for the Advancement of Automotive Medicine.
Andersson, M., Bohman, K., & Osvalder, A.-L. (2010). Effect of Booster Seat Design on Children’s Choice of Seating Positions During Naturalistic Riding. Annals of advances in automotive medicine / Annual Scientific Conference. Association for the Advancement of Automotive Medicine. Scientific Conference, 54, 171-180. Australian Institute of Health and Welfare. (2005). Australia’s mothers and babies 2005. Canberra: AIHW.
Bandura, A. (1971). Social Learning Theory: General Learning Corporation.
Bilston, L. E., Yuen, M., & Brown, J. (2007). Reconstruction of crashes involving injured child occupants: the risk of serious injuries associated with sub-optimal restraint use may be reduced by better controlling occupant kinematics. Traffic injury prevention, 8(1), 47-61. doi: 10.1080/15389580600990352
Bohman, K., Stockman, I., Jakobsson, L., Osvalder, A.-L., Bostrom, O., & Arbogast, K. B. (2011). Kinematics and shoulder belt position of child rear seat passengers during vehicle maneuvers. Association for the Advancement of Automotive Medicine. Scientific Conference, 55, 15-26.
Brown, J., Fell, D., & Bilston, L. E. (2010). Shoulder height labeling of child restraints to minimize premature graduation. Pediatrics, 126(3), 490-497. doi: 10.1542/peds.2010-0516
Brown, J., Keay, L., Hunter, K., Bilston, L. E., Simpson, J. M., & Ivers, R. (2013). Increase in best practice child car restraint use for children aged 2–5 years in low socioeconomic areas after introduction of mandatory child restraint laws. Australian and New Zealand Journal of Public Health, 37(3), 272-277. doi: 10.1111/1753-6405.12070
Brown, J., McCaskill, M. E., Henderson, M., & Bilston, L. E. (2006). Serious injury is associated with suboptimal restraint use in child motor vehicle occupants. Journal of Paediatrics and Child Health, 42(6), 345-349. doi: 10.1111/j.1440-1754.2006.00870.x
Butler, J. T. (2001). Principles of Health Education & Health Promotion (3rd ed.). CA, USA: Wadsworth.
Charlton, J., Koppel, S., Cross, S. L., Kuo, J., Rudin-Brown, C., Arbogast, K., Stockman, I. (2013). Naturalistic Observation of Children in Cars: An International Partnership. Paper
Journal of the Australian College of Road Safety – Volume 28 No. 3, 2017
53
presented at the 1th International Conference on Protection of Children in Cars, December 2013, Munich. https://www.chalmers.se/safer/EN/publications/crash-safety/2013/naturalistic-observation.
Charlton, J., Koppel, S., Kopinathan, C., & Taranto, D. (2010). How Do Children Really Behave in Restraint Systems While Travelling in Cars? Annals of advances in automotive medicine/Annual Scientific Conference. (54), 181-192.
Chen, X., Yang, J., Peek-Asa, C., McGehee, D., & Li, L. (2014). Parents’ knowledge, attitude, and use of child restraints, Shantou. China Am J Prev Med, 46(1), 85 - 88.
Commonwealth of Australia. (2016). Causes of Death 2015 ‘Table 1.3 Underlying cause of death, Selected causes by age at death, numbers and rates, Australia, 2010’. (3303.0 ). Canberra: ABS.
Commonwealth of Australia. (2013). Population by Age and Sex: Regions of Australia. (3235.0). Australian Bureau of Statistics.
Durbin, D., Elliott, M., & Winston, F. (2003). Effectiveness of belt positioning booster seats for children in crashes. Pediatric research, 53(4), 19A-20A.
Forman, J. L., Segui-Gomez, M., Ash, J. H., & Lopez-Valdes, F. J. (2011). Child posture and shoulder belt fit during extended night-time traveling: an in-transit observational study. Association for the Advancement of Automotive Medicine. Scientific Conference, 55, 3-14.
Hoyt, M. F. (1973). Internal-External Control and beliefs about automobile travel. Journal of Research in Personality, 7(3), 288-293.
Hunter, K., Keay, L., Simpson, J. M., Brown, J., Bilston, L. E., Fegan, M., Cosgrove, L., Stevenson, M. & Ivers, & Ivers, R. Q. (2015). Program Fidelity Measures Associated With an Effective Child Restraint Program: Buckle-Up Safely. American journal of public health, 105(3), 584-590. doi: 10.2105/AJPH.2014.302308
Ivers, R. Q., Keay, L., Brown, J., Bilston, L. E., Hunter, K., Simpson, J. M., & Stevenson, M. (2011). Buckle up safely: a cluster randomised trial to evaluate the effectiveness of a pre-school based program to increase appropriate use of child restraints. BMC public health, 11, 16. doi: 10.1186/1471-2458-11-16
Kidsafe Australia. (2014). Child Restraint Guidelines. Recommendations for keeping our kids as safe as possible: Safe Installation and safe use of child restraints. Retrieved 25 June 014, 2104, from http://www.kidsafe.com.au/crrecommendation6
Koppel, S., Charlton, J. L., Fitzharris, M., Congiu, M., & Fildes, B. (2008). Factors associated with the premature graduation of children into seatbelts. Accident; analysis and prevention, 40(2), 657-666. doi: 10.1016/j.aap.2007.09.005
Koppel, S., Charlton, J., Kopinathan, C., & Taranto, D. (2011). Are child occupants a significant source of driving distraction?. Accident Analysis & Prevention, 43(3), 1236-1244.
Koppel, S., Charlton, J. L., & Rudin-Brown, C. M. (2013a). The Impact of New Legislation on Child Restraint
System (CRS) Misuse and Inappropriate Use in Australia. Traffic Injury Prevention, 14(4), 387-396. doi: 10.1080/15389588.2012.700746
Koppel, S., Muir, C., Budd, L., Devlin, A., Oxley, J., Charlton, J., & Newstead, S. (2013b). Parents’ attitudes, knowledge and behaviours relating to safe child occupant travel. Accident Analysis & Prevention, 51(0), 18-26. doi: http://dx.doi.org/10.1016/j.aap.2012.10.009
McDonald, M., Spears, M. C., & Parker, D. F. (2004). Strategic Management: Does Personality Make a Difference? Academy of Strategic Management Journal, 3, 37-45.
Montag, I., & Comrey, A. L. (1987). Internality and Externality as Correlates of Involvement in Fatal Driving Accidents. Journal of Applied Psychology, 72(3), 339-343.
National Transport Commission. (2009). Road Transport Legislation - Australian Road Rules. Canberra: Retrieved from http://www.comlaw.gov.au/Details/F2008L02562/Download.
Nelson, G. D., & Moffit, P. B. (1988). Safety belt promotion: Theory and practice. Accident Analysis and Prevention, 20(1), 27-38. doi: 10.1016/0001-4575(88)90012-7
Peterson, L., Farmer, J., & Kashani, J. H. (1990). Parental injury prevention endeavors: a function of health beliefs? Health Psychol, 9(2), 177-191.
RACV. (2014). Child restraints. Using child restraints video series and information. Retrieved 29 June 2014, 2014, from http://www.racv.com.au/wps/wcm/connect/racv/internet/primary/road+safety/child-restraints/using+child+restraints/using-child-restraints
Reisberg, D. (2007). Cognition: Exploring the science of the mind (J. Durbin & A. Javiscas Eds. 3rd ed.). New York: W W Norton & Company.
Rosenstock, I. (1974). The Health Belief Model and Preventive Health Behavior. Health Education & Behavior, 2(4), 354-386. doi: 10.1177/109019817400200405
Rotter, J. B. (1954). Social learning and clinical psychology. New York: Prentice-Hall.
Standards Australia/Standards New Zealand. (2010). Child Restraint Systems for Use in Motor Vehicles. In S. Australia (Ed.), Publication AS/NZ 1754:2010. Sydney, Australia.
Stutts, J. C., Feaganes, J., Rodgman, E., Hamlett, C., Reinfurt, D., Gish, K., Staplin, L. (2003). The Causes and Consequences of Distraction in Everyday Driving. Annual Proceedings / Association for the Advancement of Automotive Medicine, 47, 235-251.
VicRoads. (2014). Child safety harnesses. Retrieved 01042014, 2014, from https://www.vicroads.vic.gov.au/safety-and-road-rules/vehicle-safety/child-restraints/child-safety-harnesses
Wallston, K. A., Strudler Wallston, B., & DeVellis, R. (1978). Development of the Multidimensional Health Locus of Control (MHLC) Scales. Health Education & Behavior, 6(1), 160-170. doi: 10.1177/109019817800600107
Weaver, N. L., Brixey, S. N., Williams, J., & Nansel, T. R. (2013). Promoting Correct Car Seat Use in Parents of Young Children: Challenges, Recommendations, and Implications
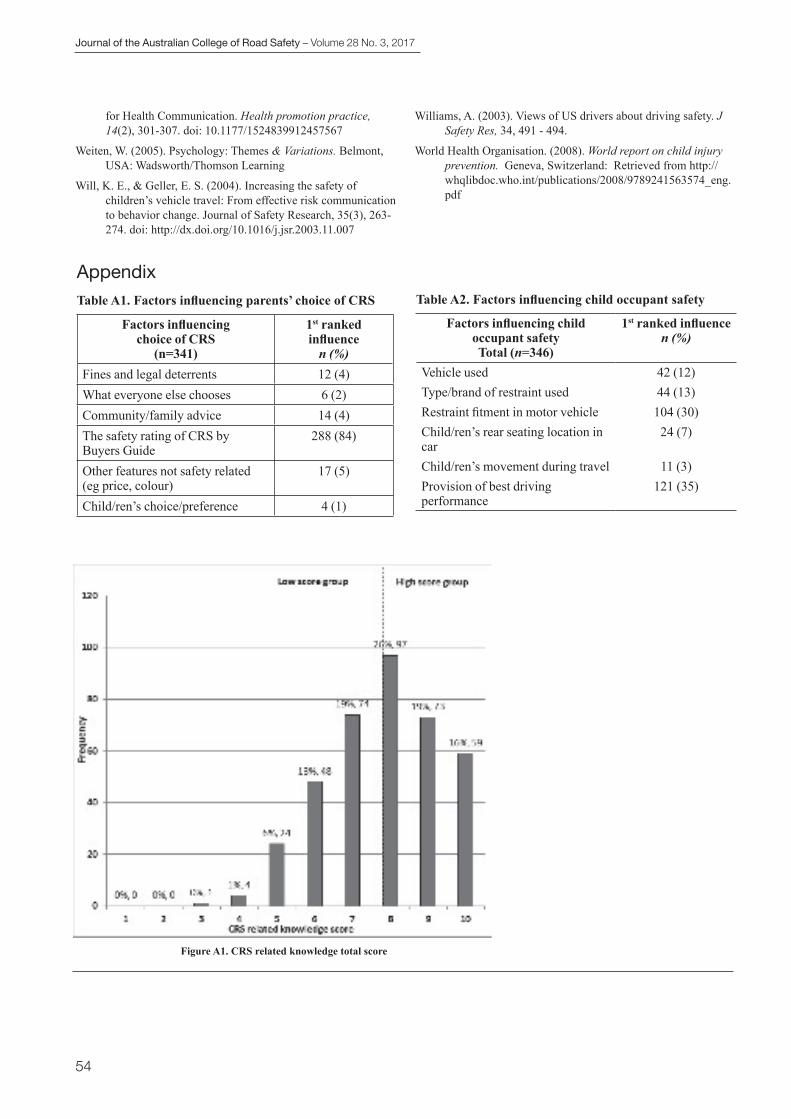
Journal of the Australian College of Road Safety – Volume 28 No. 3, 2017
54
for Health Communication. Health promotion practice, 14(2), 301-307. doi: 10.1177/1524839912457567
Weiten, W. (2005). Psychology: Themes & Variations. Belmont, USA: Wadsworth/Thomson Learning
Will, K. E., & Geller, E. S. (2004). Increasing the safety of children’s vehicle travel: From effective risk communication to behavior change. Journal of Safety Research, 35(3), 263-274. doi: http://dx.doi.org/10.1016/j.jsr.2003.11.007
Williams, A. (2003). Views of US drivers about driving safety. J Safety Res, 34, 491 - 494.
World Health Organisation. (2008). World report on child injury prevention. Geneva, Switzerland: Retrieved from http://whqlibdoc.who.int/publications/2008/9789241563574_eng.pdf
AppendixTable A1. Factors influencing parents’ choice of CRS
Factors influencing choice of CRS
(n=341)
1st ranked influence
n (%)Fines and legal deterrents 12 (4)What everyone else chooses 6 (2)Community/family advice 14 (4)The safety rating of CRS by Buyers Guide
288 (84)
Other features not safety related (eg price, colour)
17 (5)
Child/ren’s choice/preference 4 (1)
Table A2. Factors influencing child occupant safety
Factors influencing child occupant safety Total (n=346)
1st ranked influence n (%)
Vehicle used 42 (12)Type/brand of restraint used 44 (13)Restraint fitment in motor vehicle 104 (30)Child/ren’s rear seating location in car
24 (7)
Child/ren’s movement during travel 11 (3)Provision of best driving performance
121 (35)
Figure A1. CRS related knowledge total score
Journal of the Australian College of Road Safety – Volume 28 No. 3, 2017
55
MADING1225.MAKA_Rev1.
Australia’s leading manufacturer of road safety barriers since 1933.
www.ingalcivil.com.au
HEAD OFFICE: 57-65 Airds Road, Minto NSW 2566 1800 803 795
Guardrail • Wirerope Safety Barrier • CraSh CuShionS • Carpark BarrierS • ezy Guard Barrier
43080-Ingal Ad 191x124 Madding1225 Maka Rev 1.indd 1 18/12/15 9:28:28 AM
Contributed ArticlesRoad Safety Policy & Practice
Safe-Street Neighbourhoods: the role of lower speed limitsDick van den Dool1, Paul Tranter2 and Adrian Boss3
1GTA Consultants, Chatswood, Australia2School of Physical, Environmental and Mathematical Sciences, UNSW Canberra (the Australian Defence Force Academy), Canberra, Australia3BIKEast Incorporated, Bondi Junction, Australia
Corresponding Author: Dick van den Dool, GTA Consultants, PO Box 5254, West Chatswood, NSW, 1515, [email protected], 02 8448 1800
Key Findings• 30 km/h speed limits on local residential streets have the potential to reduce the Australian national road toll by 13% or
$3.5 Billion every year. • For example, the WA Safe Active Streets program receives bilateral political support from successive governments. • Community fears about impacts on travel time are a political reality but technically unfounded.
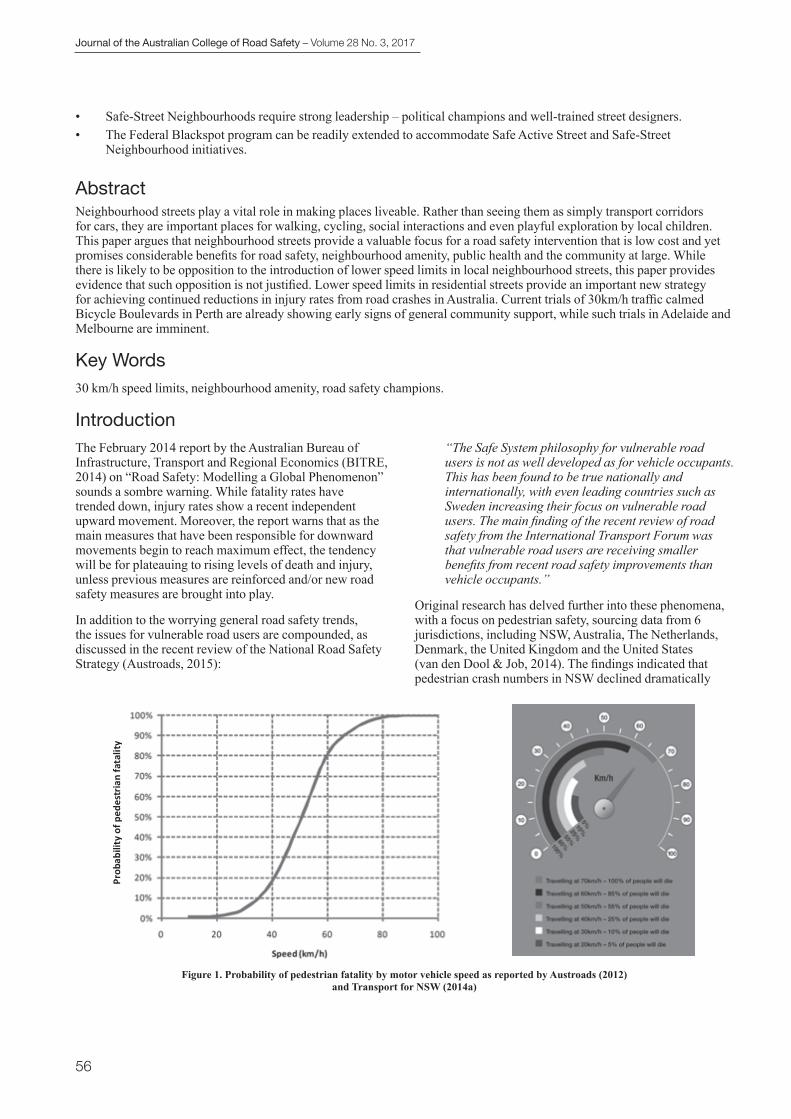
Journal of the Australian College of Road Safety – Volume 28 No. 3, 2017
56
• Safe-Street Neighbourhoods require strong leadership – political champions and well-trained street designers. • The Federal Blackspot program can be readily extended to accommodate Safe Active Street and Safe-Street
Neighbourhood initiatives.
AbstractNeighbourhood streets play a vital role in making places liveable. Rather than seeing them as simply transport corridors for cars, they are important places for walking, cycling, social interactions and even playful exploration by local children. This paper argues that neighbourhood streets provide a valuable focus for a road safety intervention that is low cost and yet promises considerable benefits for road safety, neighbourhood amenity, public health and the community at large. While there is likely to be opposition to the introduction of lower speed limits in local neighbourhood streets, this paper provides evidence that such opposition is not justified. Lower speed limits in residential streets provide an important new strategy for achieving continued reductions in injury rates from road crashes in Australia. Current trials of 30km/h traffic calmed Bicycle Boulevards in Perth are already showing early signs of general community support, while such trials in Adelaide and Melbourne are imminent.
Key Words30 km/h speed limits, neighbourhood amenity, road safety champions.
IntroductionThe February 2014 report by the Australian Bureau of Infrastructure, Transport and Regional Economics (BITRE, 2014) on “Road Safety: Modelling a Global Phenomenon” sounds a sombre warning. While fatality rates have trended down, injury rates show a recent independent upward movement. Moreover, the report warns that as the main measures that have been responsible for downward movements begin to reach maximum effect, the tendency will be for plateauing to rising levels of death and injury, unless previous measures are reinforced and/or new road safety measures are brought into play.
In addition to the worrying general road safety trends, the issues for vulnerable road users are compounded, as discussed in the recent review of the National Road Safety Strategy (Austroads, 2015):
“The Safe System philosophy for vulnerable road users is not as well developed as for vehicle occupants. This has been found to be true nationally and internationally, with even leading countries such as Sweden increasing their focus on vulnerable road users. The main finding of the recent review of road safety from the International Transport Forum was that vulnerable road users are receiving smaller benefits from recent road safety improvements than vehicle occupants.”
Original research has delved further into these phenomena, with a focus on pedestrian safety, sourcing data from 6 jurisdictions, including NSW, Australia, The Netherlands, Denmark, the United Kingdom and the United States (van den Dool & Job, 2014). The findings indicated that pedestrian crash numbers in NSW declined dramatically
Figure 1. Probability of pedestrian fatality by motor vehicle speed as reported by Austroads (2012) and Transport for NSW (2014a)
3of32
93Figure 1. Probability of pedestrian fatality by motor vehicle speed as reported by Austroads (2012) and 94
Transport for NSW (2014a) 95 96As well as a lower risk of fatality or injury at lower speeds, the likelihood of avoiding any collision 97is much greater at lower speeds due to the much lower stopping distances at 30 km/h compared with 9850 km/h (Svenson, et al, 2012): 99
“We assume a reaction time of 1 s and at a speed of 30 km/h a car will travel 8.33 m (30 100000/3600) during that time before the brakes start to apply. If the speed is 50 km/h the 101corresponding distance is 13.89 m. This is a little longer than the total stopping distance from 10230 km/h (12.75 m). This means that a driver who could stop from 30 km/h in front of an 103obstacle would hit that obstacle at a speed of 50 km/h if she drove at 50 km/h under the same 104conditions”. 105
This study also identified that drivers were “overly optimistic” about their ability to stop quickly, 106and showed little understanding of the impact of higher speeds on their stopping ability. The 107authors suggested that this was an important consideration in attitudes to speed limits. 108
More recent research in New Zealand (Hughes, 2014) further emphasises the problem (Figure 2), 109showing that although the fatality rate may be low at speeds of 40 km/h, there are serious concerns 110about severe injury risk for pedestrians at speeds of 40km/h and above. 111 112
Prob
abilityofp
edestrianfatality
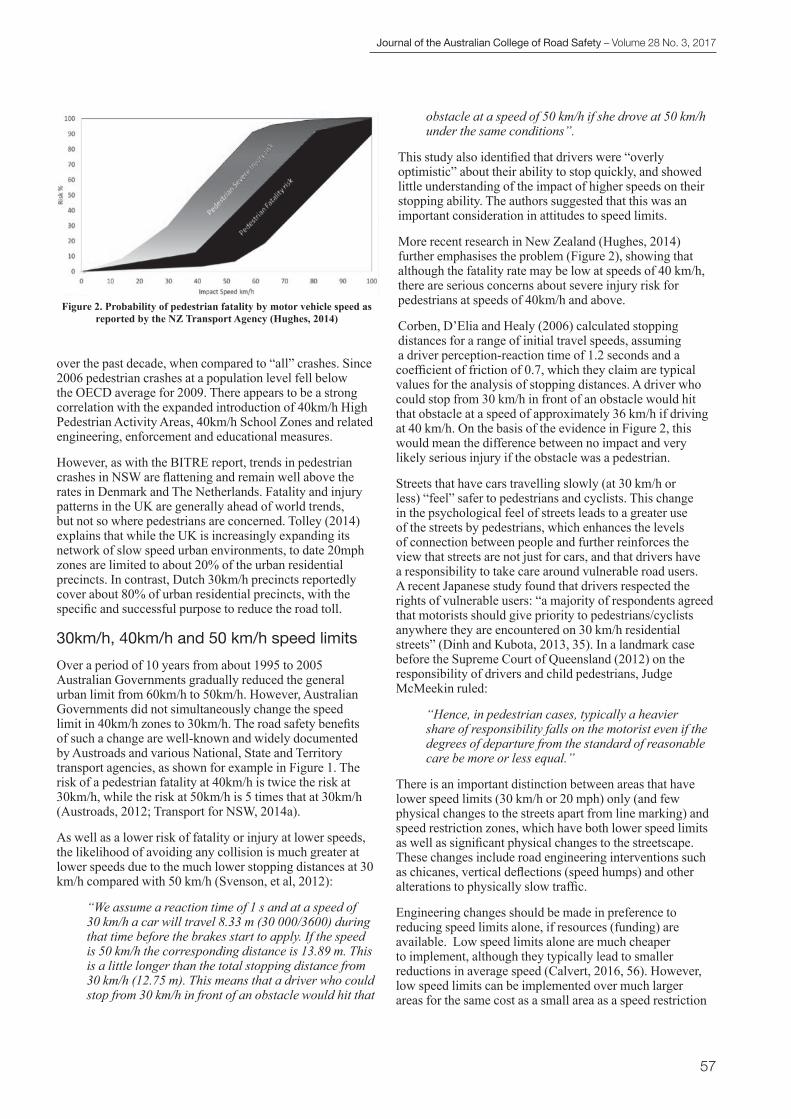
Journal of the Australian College of Road Safety – Volume 28 No. 3, 2017
57
over the past decade, when compared to “all” crashes. Since 2006 pedestrian crashes at a population level fell below the OECD average for 2009. There appears to be a strong correlation with the expanded introduction of 40km/h High Pedestrian Activity Areas, 40km/h School Zones and related engineering, enforcement and educational measures.
However, as with the BITRE report, trends in pedestrian crashes in NSW are flattening and remain well above the rates in Denmark and The Netherlands. Fatality and injury patterns in the UK are generally ahead of world trends, but not so where pedestrians are concerned. Tolley (2014) explains that while the UK is increasingly expanding its network of slow speed urban environments, to date 20mph zones are limited to about 20% of the urban residential precincts. In contrast, Dutch 30km/h precincts reportedly cover about 80% of urban residential precincts, with the specific and successful purpose to reduce the road toll.
30km/h, 40km/h and 50 km/h speed limitsOver a period of 10 years from about 1995 to 2005 Australian Governments gradually reduced the general urban limit from 60km/h to 50km/h. However, Australian Governments did not simultaneously change the speed limit in 40km/h zones to 30km/h. The road safety benefits of such a change are well-known and widely documented by Austroads and various National, State and Territory transport agencies, as shown for example in Figure 1. The risk of a pedestrian fatality at 40km/h is twice the risk at 30km/h, while the risk at 50km/h is 5 times that at 30km/h (Austroads, 2012; Transport for NSW, 2014a).
As well as a lower risk of fatality or injury at lower speeds, the likelihood of avoiding any collision is much greater at lower speeds due to the much lower stopping distances at 30 km/h compared with 50 km/h (Svenson, et al, 2012):
“We assume a reaction time of 1 s and at a speed of 30 km/h a car will travel 8.33 m (30 000/3600) during that time before the brakes start to apply. If the speed is 50 km/h the corresponding distance is 13.89 m. This is a little longer than the total stopping distance from 30 km/h (12.75 m). This means that a driver who could stop from 30 km/h in front of an obstacle would hit that
obstacle at a speed of 50 km/h if she drove at 50 km/h under the same conditions”.
This study also identified that drivers were “overly optimistic” about their ability to stop quickly, and showed little understanding of the impact of higher speeds on their stopping ability. The authors suggested that this was an important consideration in attitudes to speed limits.
More recent research in New Zealand (Hughes, 2014) further emphasises the problem (Figure 2), showing that although the fatality rate may be low at speeds of 40 km/h, there are serious concerns about severe injury risk for pedestrians at speeds of 40km/h and above.
Corben, D’Elia and Healy (2006) calculated stopping distances for a range of initial travel speeds, assuming a driver perception-reaction time of 1.2 seconds and a coefficient of friction of 0.7, which they claim are typical values for the analysis of stopping distances. A driver who could stop from 30 km/h in front of an obstacle would hit that obstacle at a speed of approximately 36 km/h if driving at 40 km/h. On the basis of the evidence in Figure 2, this would mean the difference between no impact and very likely serious injury if the obstacle was a pedestrian.
Streets that have cars travelling slowly (at 30 km/h or less) “feel” safer to pedestrians and cyclists. This change in the psychological feel of streets leads to a greater use of the streets by pedestrians, which enhances the levels of connection between people and further reinforces the view that streets are not just for cars, and that drivers have a responsibility to take care around vulnerable road users. A recent Japanese study found that drivers respected the rights of vulnerable users: “a majority of respondents agreed that motorists should give priority to pedestrians/cyclists anywhere they are encountered on 30 km/h residential streets” (Dinh and Kubota, 2013, 35). In a landmark case before the Supreme Court of Queensland (2012) on the responsibility of drivers and child pedestrians, Judge McMeekin ruled:
“Hence, in pedestrian cases, typically a heavier share of responsibility falls on the motorist even if the degrees of departure from the standard of reasonable care be more or less equal.”
There is an important distinction between areas that have lower speed limits (30 km/h or 20 mph) only (and few physical changes to the streets apart from line marking) and speed restriction zones, which have both lower speed limits as well as significant physical changes to the streetscape. These changes include road engineering interventions such as chicanes, vertical deflections (speed humps) and other alterations to physically slow traffic.
Engineering changes should be made in preference to reducing speed limits alone, if resources (funding) are available. Low speed limits alone are much cheaper to implement, although they typically lead to smaller reductions in average speed (Calvert, 2016, 56). However, low speed limits can be implemented over much larger areas for the same cost as a small area as a speed restriction
Figure 2. Probability of pedestrian fatality by motor vehicle speed as reported by the NZ Transport Agency (Hughes, 2014)

Journal of the Australian College of Road Safety – Volume 28 No. 3, 2017
58
zone. This means that a much larger population is affected and “small improvements to many people add up to a total of much more than large improvements for a few” (King and Semlyen, 2016, 66). Even reducing average speed by 1-2mph can have a significant effect with a wide area. “Each 1mph less is 5-6% fewer casualties. That 1-2mph reduction over the network adds up to much more benefit to more residents than a large reduction on a few streets in a zone” (King and Semlyen, 2016, 66). Thus, while physical low speed zones may be ideal if costs were ignored, for the same cost 50 times more people could be included in area-wide 30 km/h speed limits with line markings than could be included in physical speed zones.
King and Semlyn (2016, 66) further note that isolated and small area physically calmed low speed zones may have the effect of encouraging drivers to ’speed up’ as they leave the zone. In contrast, larger areas with 30 km/h speed limits encourage a mindset among drivers that low speeds are appropriate in ’all’ neighbourhood streets. Private observations by the authors confirm such patterns may also be true for small 10km/h Shared Zones.
Grundy et al (2009) found that the greatest reduction in road casualties from the introduction of 20 mph zones was amongst young children. The zones were particularly effective in reducing the severity of injury, as well as the total number of collisions. An important point here is that this study also found that there was little, if any, collision migration to surrounding roads after the introduction of these zones in London.
The ChallengeChanging speed limits in residential streets to 30 km/h has met with considerable opposition from the community at large, not just in Australia but overseas. When such limits were introduced in 1992 across the entire city of Graz, Austria, the majority of residents were not in support of them (Heinrich, 2013):
“When the discussion around speed reduction started in 1992, the approval for lower speeds was around 44%, but by 1995 this had nearly doubled to 82%”.
In terms of road safety, the Graz project resulted in a 12% reduction of crashes with injury, 24% reduction in serious injury, 17% reduction in pedestrian injury and a 14% reduction in injury to car users. Despite only a 4% reduction in cyclist injuries, 83% of cyclists strongly supported the reduced speed limit. General acceptance soon became so high that in July 1994, the scheme was made permanent.
In 2011, the South Australian Government engaged the services of world-renowned road safety expert Fred Wegman as part of its “Thinker in Residence” program. In the lead up to his engagement, Wegman conducted a media interview (Adelaide Advertiser, 2010), which brought out (South) Australian fears of a Nanny State with the discussion of extensive 30km/h zones in urban residential areas. These same fears were evident in the mid-1990s, when Australia transitioned from a 60km/h urban limit to the now widely applauded road safety success of the 50km/h urban limit (van den Dool, 1992). The important lessons are:
• Yes, careful consideration is required with good and detailed campaigns to inform communities and opinion leaders
• Yes, it is necessary to have strong leadership – a political champion
• Yes, strong improvements are expected in urban road safety.
In NSW, for example, the data shows (Transport for NSW, 2014b):
• two thirds of all crashes occur in urban areas• in urban areas, more than two thirds of crashes occur
on local and collector streets with 50-60km/h speed limits
• 50 and 60 km/h streets have shown a 27% reduction in crashes over the 15 year period from 1997 (almost no 50km/h zones) to 2012 (full implementation of 50km/h urban limit, Figure 3), compared to a 7% crash reduction on 70-110km/h roads and an overall crash reduction of 22%.
Figure 3. The NSW road toll dropped by 27% following introduction of the 50km/h Urban Speed Limit (Source: GTA Consultants)
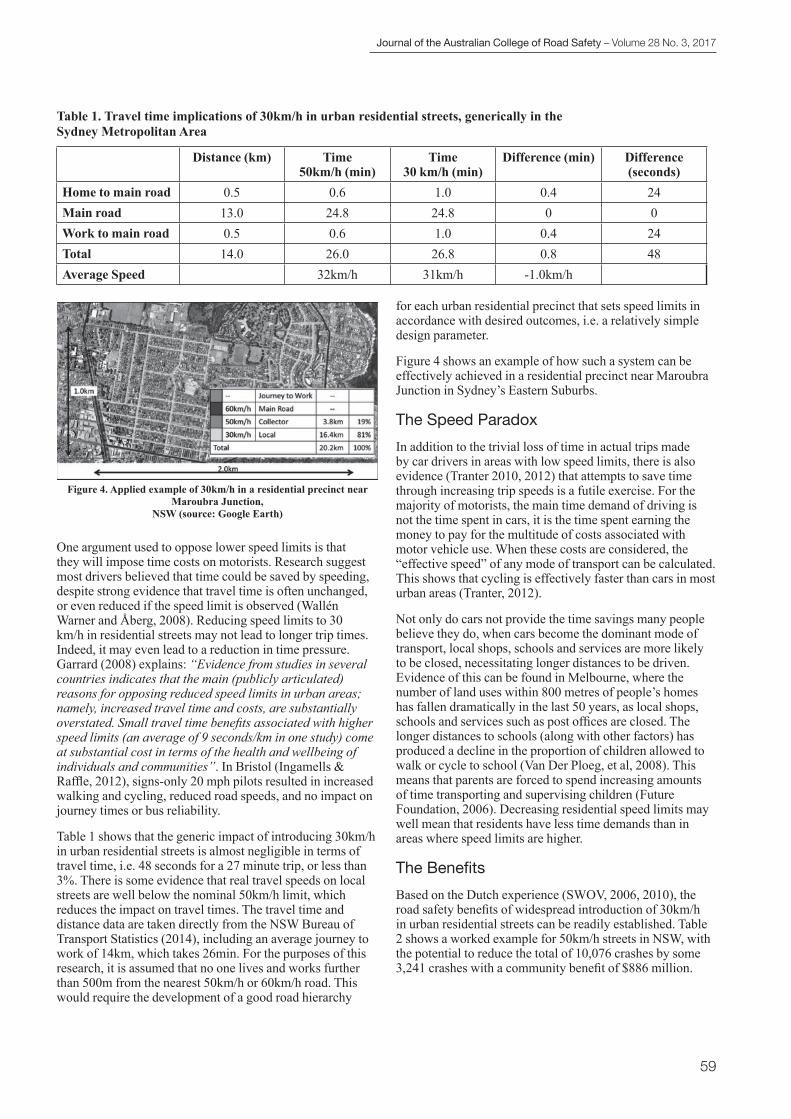
Journal of the Australian College of Road Safety – Volume 28 No. 3, 2017
59
One argument used to oppose lower speed limits is that they will impose time costs on motorists. Research suggest most drivers believed that time could be saved by speeding, despite strong evidence that travel time is often unchanged, or even reduced if the speed limit is observed (Wallén Warner and Åberg, 2008). Reducing speed limits to 30 km/h in residential streets may not lead to longer trip times. Indeed, it may even lead to a reduction in time pressure. Garrard (2008) explains: “Evidence from studies in several countries indicates that the main (publicly articulated) reasons for opposing reduced speed limits in urban areas; namely, increased travel time and costs, are substantially overstated. Small travel time benefits associated with higher speed limits (an average of 9 seconds/km in one study) come at substantial cost in terms of the health and wellbeing of individuals and communities”. In Bristol (Ingamells & Raffle, 2012), signs-only 20 mph pilots resulted in increased walking and cycling, reduced road speeds, and no impact on journey times or bus reliability.
Table 1 shows that the generic impact of introducing 30km/h in urban residential streets is almost negligible in terms of travel time, i.e. 48 seconds for a 27 minute trip, or less than 3%. There is some evidence that real travel speeds on local streets are well below the nominal 50km/h limit, which reduces the impact on travel times. The travel time and distance data are taken directly from the NSW Bureau of Transport Statistics (2014), including an average journey to work of 14km, which takes 26min. For the purposes of this research, it is assumed that no one lives and works further than 500m from the nearest 50km/h or 60km/h road. This would require the development of a good road hierarchy
for each urban residential precinct that sets speed limits in accordance with desired outcomes, i.e. a relatively simple design parameter.
Figure 4 shows an example of how such a system can be effectively achieved in a residential precinct near Maroubra Junction in Sydney’s Eastern Suburbs.
The Speed ParadoxIn addition to the trivial loss of time in actual trips made by car drivers in areas with low speed limits, there is also evidence (Tranter 2010, 2012) that attempts to save time through increasing trip speeds is a futile exercise. For the majority of motorists, the main time demand of driving is not the time spent in cars, it is the time spent earning the money to pay for the multitude of costs associated with motor vehicle use. When these costs are considered, the “effective speed” of any mode of transport can be calculated. This shows that cycling is effectively faster than cars in most urban areas (Tranter, 2012).
Not only do cars not provide the time savings many people believe they do, when cars become the dominant mode of transport, local shops, schools and services are more likely to be closed, necessitating longer distances to be driven. Evidence of this can be found in Melbourne, where the number of land uses within 800 metres of people’s homes has fallen dramatically in the last 50 years, as local shops, schools and services such as post offices are closed. The longer distances to schools (along with other factors) has produced a decline in the proportion of children allowed to walk or cycle to school (Van Der Ploeg, et al, 2008). This means that parents are forced to spend increasing amounts of time transporting and supervising children (Future Foundation, 2006). Decreasing residential speed limits may well mean that residents have less time demands than in areas where speed limits are higher.
The BenefitsBased on the Dutch experience (SWOV, 2006, 2010), the road safety benefits of widespread introduction of 30km/h in urban residential streets can be readily established. Table 2 shows a worked example for 50km/h streets in NSW, with the potential to reduce the total of 10,076 crashes by some 3,241 crashes with a community benefit of $886 million.
Distance (km) Time50km/h (min)
Time30 km/h (min)
Difference (min) Difference (seconds)
Home to main road 0.5 0.6 1.0 0.4 24Main road 13.0 24.8 24.8 0 0Work to main road 0.5 0.6 1.0 0.4 24Total 14.0 26.0 26.8 0.8 48Average Speed 32km/h 31km/h -1.0km/h
Table 1. Travel time implications of 30km/h in urban residential streets, generically in the Sydney Metropolitan Area
Figure 4. Applied example of 30km/h in a residential precinct near Maroubra Junction,
NSW (source: Google Earth)
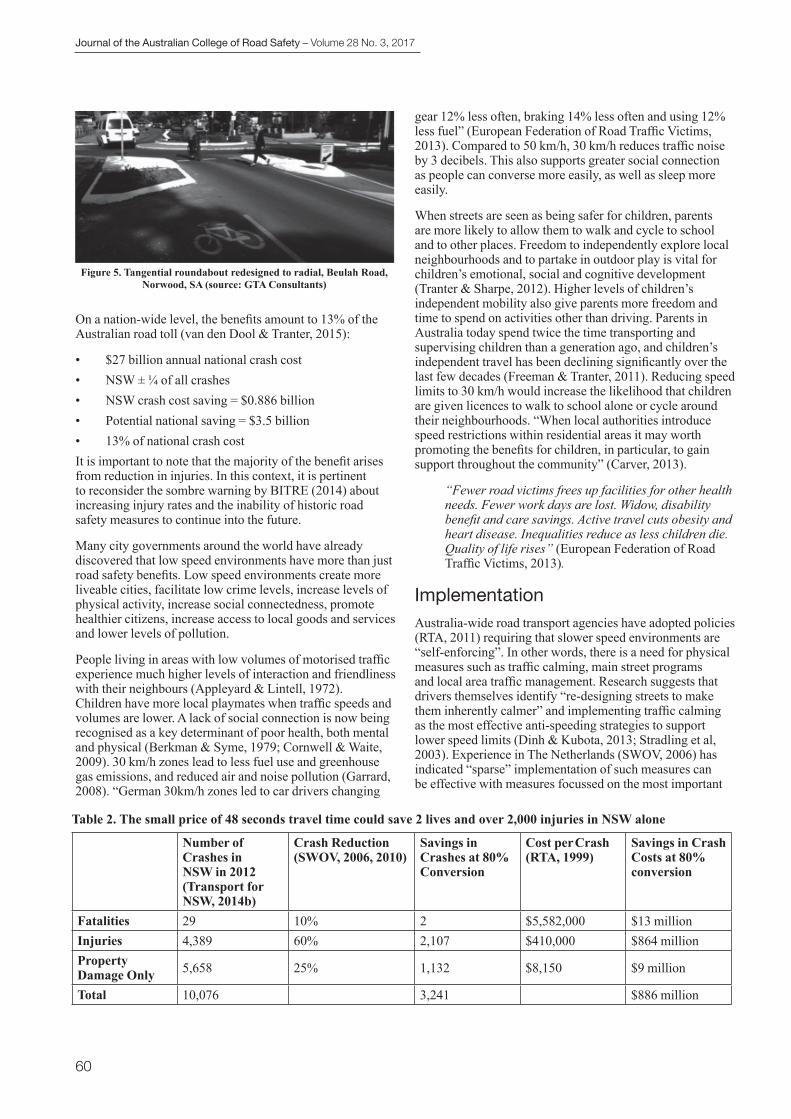
Journal of the Australian College of Road Safety – Volume 28 No. 3, 2017
60
On a nation-wide level, the benefits amount to 13% of the Australian road toll (van den Dool & Tranter, 2015):
• $27 billion annual national crash cost• NSW ± ¼ of all crashes• NSW crash cost saving = $0.886 billion• Potential national saving = $3.5 billion• 13% of national crash costIt is important to note that the majority of the benefit arises from reduction in injuries. In this context, it is pertinent to reconsider the sombre warning by BITRE (2014) about increasing injury rates and the inability of historic road safety measures to continue into the future.
Many city governments around the world have already discovered that low speed environments have more than just road safety benefits. Low speed environments create more liveable cities, facilitate low crime levels, increase levels of physical activity, increase social connectedness, promote healthier citizens, increase access to local goods and services and lower levels of pollution.
People living in areas with low volumes of motorised traffic experience much higher levels of interaction and friendliness with their neighbours (Appleyard & Lintell, 1972). Children have more local playmates when traffic speeds and volumes are lower. A lack of social connection is now being recognised as a key determinant of poor health, both mental and physical (Berkman & Syme, 1979; Cornwell & Waite, 2009). 30 km/h zones lead to less fuel use and greenhouse gas emissions, and reduced air and noise pollution (Garrard, 2008). “German 30km/h zones led to car drivers changing
gear 12% less often, braking 14% less often and using 12% less fuel” (European Federation of Road Traffic Victims, 2013). Compared to 50 km/h, 30 km/h reduces traffic noise by 3 decibels. This also supports greater social connection as people can converse more easily, as well as sleep more easily.
When streets are seen as being safer for children, parents are more likely to allow them to walk and cycle to school and to other places. Freedom to independently explore local neighbourhoods and to partake in outdoor play is vital for children’s emotional, social and cognitive development (Tranter & Sharpe, 2012). Higher levels of children’s independent mobility also give parents more freedom and time to spend on activities other than driving. Parents in Australia today spend twice the time transporting and supervising children than a generation ago, and children’s independent travel has been declining significantly over the last few decades (Freeman & Tranter, 2011). Reducing speed limits to 30 km/h would increase the likelihood that children are given licences to walk to school alone or cycle around their neighbourhoods. “When local authorities introduce speed restrictions within residential areas it may worth promoting the benefits for children, in particular, to gain support throughout the community” (Carver, 2013).
“Fewer road victims frees up facilities for other health needs. Fewer work days are lost. Widow, disability benefit and care savings. Active travel cuts obesity and heart disease. Inequalities reduce as less children die. Quality of life rises” (European Federation of Road Traffic Victims, 2013).
ImplementationAustralia-wide road transport agencies have adopted policies (RTA, 2011) requiring that slower speed environments are “self-enforcing”. In other words, there is a need for physical measures such as traffic calming, main street programs and local area traffic management. Research suggests that drivers themselves identify “re-designing streets to make them inherently calmer” and implementing traffic calming as the most effective anti-speeding strategies to support lower speed limits (Dinh & Kubota, 2013; Stradling et al, 2003). Experience in The Netherlands (SWOV, 2006) has indicated “sparse” implementation of such measures can be effective with measures focussed on the most important
Number of Crashes in NSW in 2012 (Transport for NSW, 2014b)
Crash Reduction (SWOV, 2006, 2010)
Savings in Crashes at 80% Conversion
Cost per Crash (RTA, 1999)
Savings in Crash Costs at 80% conversion
Fatalities 29 10% 2 $5,582,000 $13 millionInjuries 4,389 60% 2,107 $410,000 $864 millionProperty Damage Only 5,658 25% 1,132 $8,150 $9 million
Total 10,076 3,241 $886 million
Table 2. The small price of 48 seconds travel time could save 2 lives and over 2,000 injuries in NSW alone
Figure 5. Tangential roundabout redesigned to radial, Beulah Road, Norwood, SA (source: GTA Consultants)

Journal of the Australian College of Road Safety – Volume 28 No. 3, 2017
61
bottlenecks and dangerous locations such as the entry points to residential precincts and at intersections.
Research by GTA Consultants (2014) for Queensland Transport and Main Roads builds on Dutch research indicating roundabouts on local street intersections can be an effective measure to facilitate “sparse” implementation of traffic calming measures. The research indicates that traditional Australian “tangential” designs appear to be too generous, allowing general traffic to flow through the roundabout at relatively high speeds which are incompatible with pedestrian and bicycle movements. Recent trials in South Australia using tightly designed “radial” roundabouts appear to be effective in reducing speeds (Figure 5).
Another example is the WA program on Safe Active Streets or Bicycle Boulevards (DoT-WA, 2017, Figure 6). In essence, Bicycle Boulevards are local residential streets with traditional traffic calming and a cycling overlay, but there is more to it. Key cycling elements include:
• A clearly, self-explaining, legible route (unlike main roads which continue for long distances, a bicycle boulevard typically runs along a series of inter-connected local streets and intersections, which do not naturally provide route continuity)
• Direct connectivity with other elements of the cycle network, often across council boundaries, for access to shops, school, employment and services
• Priority over cross streets – bikes are a vehicle of momentum and stop-start conditions require large amounts of energy
• Excellent crossing facilities at main roads for safety and comfort
• Design speeds (and ideally speed limits) of 30km/h which is slower than the traditional 40km/h for traffic calming in Australia – this is essential for achieving the required safety outcomes.
The Bicycle User Group for Sydney’s Eastern Suburbs, BIKEast, has developed a similar initiative on Safe-Street Neighbourhoods (Boss, 2016), which has been endorsed by its state-wide parent organisation, Bicycle NSW. The focus is on changing neighbourhood streets in ways that slow
traffic and complements cycling networks under local bike plans and strategies. It is an urban design-based approach to foster redesign of streets, help tame the behaviour of motorists and riders and make local streets safe for everyone to use and enjoy and will also be good for local businesses and service providers. The key elements include designing or re-designing local neighbourhood streets to:
• make all vulnerable users safe by introducing 30km/h speed zoning
• primarily serve residential needs while maintaining essential vehicular access
• further improve amenity through adaptations that serve people’s use and enjoyment
• make every street a cycle street for a connected neighbourhood and city.
Political LeadershipWegman (2012) concludes there is a need for strong, paternalistic political leadership – a champion who really makes a difference:
“I conclude a need for government interventions in road safety, not only because ‘harm to others’ is involved, but also because personal choices require some sort of paternalistic guidance.”
“So far, we have introduced ‘the government’ as a single entity. As we all know, this is not the case. It is important to make a distinction between elected officials, politicians, and the bureaucracy. It is worthwhile paying specific attention to elected officials, because they have to play an important leadership role. It is not easy to see how progress can be made without giving a key role to politicians. Sometimes we call them ‘champions’; politicians who really make a difference.”
The analysis of Wegman’s legacy conducted for Walk21 (van den Dool & Job, 2014), further confirms the need for a champion. This requirement for political leadership is also emphasised in the current review of the National Road Safety Strategy (Austroads, 2015):
“Many stakeholders thought that the accountability for road safety is unclear and does not assist the leadership task. Improvement in institutional structures, capacities and delivery arrangements at a national level were identified as part of the “First Steps” agenda. Governance arrangements for road safety under the Transport and Infrastructure Council have been modified in the last two years to improve national oversight and coordination of the NRSS and provision of policy advice to Commonwealth, state and territory governments.”
Figure 6. Opening of the Safe Active Street along Shakespeare Street, Mount Hawthorn, WA (source: GTA Consultants)

Journal of the Australian College of Road Safety – Volume 28 No. 3, 2017
62
RecommendationsRecognising the challenges ahead for road safety policy in Australia, particularly for vulnerable groups such as children, the elderly, cyclists and pedestrians, the authors make the following recommendations:
1. Appoint and adequately resource political champions who can lead the community debate regarding Safe-Street Neighbourhoods at both a National and State level.
2. Engage with industry to develop a training program on the design of Safe-Street Neighbourhoods and Safe Active Streets.
3. Confirm that the NSW crash patterns (as presented here) are mimicked in the other Australian jurisdictions.
4. With a view to saving an estimated $3.5 billion (13%) annually in crash costs in Australia, extend the Federal Blackspot Funding Program to:
- develop a road hierarchy for all urban residential areas whereby no one lives further than about 500m from a road with a speed limit of 50km/h or more;
- change existing 40km/h zones to 30km/h; - implement “sparse” extension of 30km/h to 50%
of local streets, using “radial” roundabouts and entry thresholds, and treating known crash spots;
- over time, expand 30km/h to 100% of local neighbourhood streets;
- there may be a need for more intense treatment in accordance with “safe system” or “sustainable safety” principles;
- examples of effective and widely supported programs include the Safe Active Streets program in Western Australia and the BIKEast Safe-Street Neighbourhoods initiative.
ReferencesAdelaide Advertiser (2010). Expert wants 30km/h limit to reduce
road toll. On-line Edition. 8 May 2010.
Appleyard, D, & Lintell, M (1972). The environmental quality of city streets: the residents’ viewpoint. Journal of the American Institute of Planners, 38(2), pages 84-101.
Austroads (2012). Cycling on Higher Speed Roads. AP–R410-12. Sydney, Australia.
Austroads (2015). Review of the National Road Safety Strategy. AP-R477-15. Sydney, Australia.
Berkman, LF, & Syme, SL (1979). Social networks, host resistance, and mortality: a nine-year follow-up study of Alameda County residents. American journal of Epidemiology, 109(2), pages 186-204.
BITRE (2014). Road Safety: Modelling a Global Phenomenon. Report 141, Canberra, Australia. Department of Infrastructure and Regional Development.
Boss, A (2016). Safe-Street Neighbourhoods. BIKEast - Representing the community’s interests in bicycle riding in Sydney’s eastern suburbs.
Bureau of Transport Statistics (2013). Household Travel Survey (HTS). Electronic Publication No. E2013-35-HTS-Summary. Sydney, Australia. Transport for NSW.
Calvert, T. (2016) Measure No. 6: Environmental zones, World Transport Policy & Practice, 22 (1/2). pp. 56-65
Carver, A (2013). 30km/h Zones in Residential Areas: what difference would they make? Bike Futures Conference, Melbourne, Australia.
Corben, B. F., D’Elia, A., & Healy, D. (2006). Estimating pedestrian fatal crash risk. Proceedings of the Australasian road safety research, policing and education conference (Vol. 10). Monash University, Melbourne, Australia.
Cornwell, EY, & Waite, LJ (2009). Social disconnectedness, perceived isolation, and health among older adults. Journal of Health and Social Behavior, 50(1), pages 31-48.
Dinh, DD, & Kubota, H (2013). Drivers’ perceptions regarding speeding and driving on urban residential streets with a 30km/h speed limit. International Association of Traffic and Safety Sciences Research, 37(1), 30-38.
DoT-WA (2017). Safe Active Streets Program. http://www.transport.wa.gov.au/activetransport/safe-active-streets-program.asp
European Federation of Road Traffic Victims (2013). WHY 30km/h? Retrieved from http://doczz.fr/doc/2914203/why-30km-h---fevr-european-federation-of-road-traffic-vic...
Freeman, C, & Tranter, P (2011). Children and their Urban Environment: Changing worlds. London: Earthscan.
Future Foundation (2006). The Changing Face of Parenting: Professional Parenting, Information and Healthcare. London: Future Foundation.
Garrard, J (2008). Safe Speed: Promoting safe walking and cycling by reducing traffic speed. Heart Foundation. Melbourne, Australia.
Grundy, C., Steinbach, R., Edwards, P., Green, J., Armstrong, B. and Wilkinson, P. (2009). Effect of 20 mph traffic speed zones on road injuries in London, 1986-2006: controlled interrupted time series analysis. BMJ: British Medical Journal, 339.
GTA Consultants (2014). Retrofit Guide for Vulnerable Road User Safety at Roundabouts. For Queensland Transport and Main Roads. Draft report.
Heinrich (2013). 30 km/h blanket speed limit – does it work? Retrieved from http://btawa.org.au/2013/08/05/30-kmh-blanket-speed-limit-does-it-work/.
Hughes, T (2014, October). The challenge of walking under a safe system. Paper presented at Walk21. Sydney, Australia.
Ingamells, S, & Raffle, A (2012). 20 mph speed limits are the right policy for sociability, safety, and a healthy population. BMJ: British Medical Journal. Page 345.

Journal of the Australian College of Road Safety – Volume 28 No. 3, 2017
63
King, R. and Semlyen, A. (2016) Some comments on Measure Review Number 6 specifically relating to 20mph/30kph policies and interventions, World Transport Policy & Practice, 22 (1/2). pp. 66-68.
RTA (1999). Economic Analysis Manual, Version 2. Sydney, Australia.
RTA (2011). NSW Speed Zoning Guidelines, Version 4. Sydney, Australia.
Sammer, G (1994). General 30kph speed limit in the city: The results of a model project in the city of Graz.
Stradling, S. G., Campbell, M., Allan, I. A., Gorell, R. S. J., Hill, J. P., Winter, M. G., & Hope, S. (2003). The speeding driver: who, how and why? Scottish Executive Social Research, Edinburgh.
Supreme Court of Queensland (2012). Perfect v MacDonald & Anor. File Nos S350 of 2011.
Svenson, O., Eriksson, G. & Gonzalez, N. (2012). Braking from different speeds: Judgments of collision speed if a car does not stop in time. Accident Analysis & Prevention, 45, 487-492.
SWOV (2006). Advancing Sustainable Safety: National Road Safety Outlook for 2005-2020. Leidschendam, The Netherlands.
SWOV (2010). Effectiviteit en kosten van verkeersveiligheidsmaatregelen. R-2010-9. Leidschendam, The Netherlands.
Tolley, R (2014). Director Walk21 - Personal Communications. Sydney, Australia.
Transport for NSW (2014a). Pedestrian Safety Action Plan 2014–20. Pub 13.008. Sydney, Australia.
Transport for NSW (2014b). Road Traffic Crashes in NSW: statistical statement for the year ending 31 December 2012 (and 15 preceding years to 1997).
Tranter, P (2010). Speed Kills: The Complex Links Between Transport, Lack of Time and Urban Health. Journal of Urban Health, 87(2). Pages 155-166.
Tranter, P (2012). Effective speed: cycling because it’s faster. J Pucher & R Buehler (Eds), City Cycling (pp. 57 - 74). Cambridge, MA: MIT Press.
Tranter, P (2014). Active travel: A cure for the hurry virus. Journal of Occupational Science, 21(1). Pages 65-76.
Tranter, P, & Sharpe, S (2012). Disney-Pixar to the rescue: harnessing positive affect for enhancing children’s active mobility. Journal of Transport Geography, 20(1), pages 34-40.
van den Dool, D (1992). Seeking Safer Streets. The Open Road. October 1992. NRMA Publication. Sydney, Australia.
van den Dool, D, Job, S (2014, November). Pedestrian Safety – can we handle the next phase. Wak21, Sydney, 2014.
van den Dool, D, Tranter, P (2015, September). Low speed environments – why most cities have them. Asia Pacific Cycling Conference, Brisbane, Australia.
Van Der Ploeg, H, Merom, D, Corpuz, G & Bauman, A (2008). Trends in Australian children traveling to school 1971-2003: Burning petrol or carbohydrates? Preventive Medicine, 46(1). Pages 60-62.
Wallén, Warner & Åberg (2008). Drivers’ beliefs about exceeding the speed limits. Transportation Research Part F: Traffic Psychology and Behaviour. 11, 376–389.
Wegman, F (2012). Driving down the road toll by building a Safe System. Adelaide Thinker in Residence 2011–2012.
Yeates, M (1996). Towards a safe urban speed limit. Report of the Cyclists Urban Speed Limit Taskforce of the Bicycle Federation of Australia. Retrieved from http://www.yeatesit.biz/transfiles/bfaurbanspeedlimits.pdf
Road Safety Case StudiesSARSAI: Low Cost Speed Management Interventions around Schools – Dar es Salaam, TanzaniaAyikai Poswayo1, Jeffrey Witte2and Simon Kalolo3
1Amend, Accra, Ghana2Amend, New York, USA 3Amend, Dar es Salaam, Tanzania
Corresponding Author: Ayikai Poswayo, P. O. Box AN 18933, Accra-North, Ghana, [email protected], +233262659855.
Key Findings• Low cost road safety interventions have the potential to reduce speeds significantly and hence positively affect traffic
injury rates on both paved and unpaved roads.

Journal of the Australian College of Road Safety – Volume 28 No. 3, 2017
64
• Speeds continue to remain reduced a year after the implementation of low cost interventions on paved roads. • On unpaved roads, vehicle speeds increase again for certain vehicle categories such as motorcycles.• Motorcycles can potentially avoid speed reduction measures such as speed humps if they are installed at locations
without a kerb.
AbstractThis paper looks at the change in speed around nine schools in Dar es Salaam, Tanzania after the introduction of low-cost road safety interventions. It compares the speeds ‘before’, ‘two weeks after’ and ‘one year after’ intervention at nine sites – five of which were on a paved road and four of which were on an unpaved road. The purpose of the study was to determine the levels of change in speed at the identified sites over time and establish what level speeds were at, one year post intervention. Average and 85th percentile speeds reduced two weeks after intervention and though to a smaller extent one year after intervention compared to baseline. Speeds were also analysed by vehicle category. Motorcycles on unpaved roads were found, after the initial drop in speeds immediately after intervention, to have a significant rise in speed after one year of initial intervention. The study identified the need for further work looking specifically at ways to reduce speeds of motorcycles on an unpaved road setting, and the need for more sustainable speed management methods on this road type in general.
KeywordsSpeed management, children, school zones, Tanzania, road traffic injury, road traffic fatality
IntroductionWorldwide, road traffic injury is a leading cause of death among young people and the main cause of death for those aged 15 to 29 years (World Health Organisation, 2015). This has dire consequences for a continent such as Africa with a very young population which holds immense potential for the future of the region. Sixty percent of the population of Africa is below the age of 24, with 41% under fifteen and 19% between 15 and 24 (United Nation Department of Social and Economic Affairs, 2015). To compound this issue, the African region has the highest road traffic fatality rates, yet the lowest motorisation rates (World Health Organisation, 2015). Low and middle-income countries (of which almost all African countries are) have double the fatality rates of high-income countries and 90% of global road traffic deaths (World Health Organisation, 2015).
Amend, a road safety non-governmental organisation, which presently focuses its work in Africa, developed a programme – SARSAI – to help address the issue of road traffic injuries amongst young people. SARSAI stands for ‘School Area Road Safety Assessments and Improvements’ and was started in Dar es Salaam, Tanzania in 2012. The programme focuses on primary school age children (which in Tanzania can range from 6 years to 17 years). This group was a focus because it was found that the smaller frames and under developed perceptions of the younger children made them particularly vulnerable(FIA Foundation & Amend, 2016).In addition, most public primary school children walk to school, putting them in even more vulnerable positions (FIA Foundation & Amend, 2016).
According to the World Health Organisation, vulnerable road users – pedestrians, cyclists and motorcyclists – make up half of all fatalities (World Health Organisation, 2015). It is estimated that 500 children die each day from road traffic crashes on the world’s roads and for every person that dies
in a road traffic crash there are at least 20 others that sustain non-fatal injuries (World Health Organisation, 2015).
The SARSAI methodology involves identifying the highest risk primary schools for road traffic injury amongst pupils, carrying out assessments at these schools and implementing low cost infrastructure improvements which have the aim of separating pedestrians from vehicles, and where they do interact, reducing vehicle speeds in order to reduce the risk or severity of a crash. Speed is known to be a critical risk factor for Road Traffic Injuries, especially in areas of high pedestrian activity such as around schools. There is evidence supporting speed management to protect children on their way to school from other continents but not much research in relation to this from the African continent. An evaluation study of 820 locations in New South Wales, Australia where school zone speed limits were reduced to 40 km/h showed that casualties among pedestrians ages 5-16 decreased by 46%. The benefits extended to all road users, as the total pedestrian casualty rate decreased by 45% (Graham and Sparkes, 2010).
Between 2015 and 2016, Amend carried out an extensive study looking at the impact of the SARSAI programme in Dar es Salaam, Tanzania. There were two aspects to the study – a control population-based study which looked at the impact of SARSAI on road traffic injury rates at nine intervention schools vs nine control schools – and a secondary aspect of the study which looked at the change in speeds at the nine intervention schools before and after SARSAI was carried out.
The full results of the population-based control study are being published separatelyand only key findings are presented here. Some key findings of the pre-intervention study was that 85% of all pupils injured were pedestrians and 63% of all crashes occurred on a journey to/from
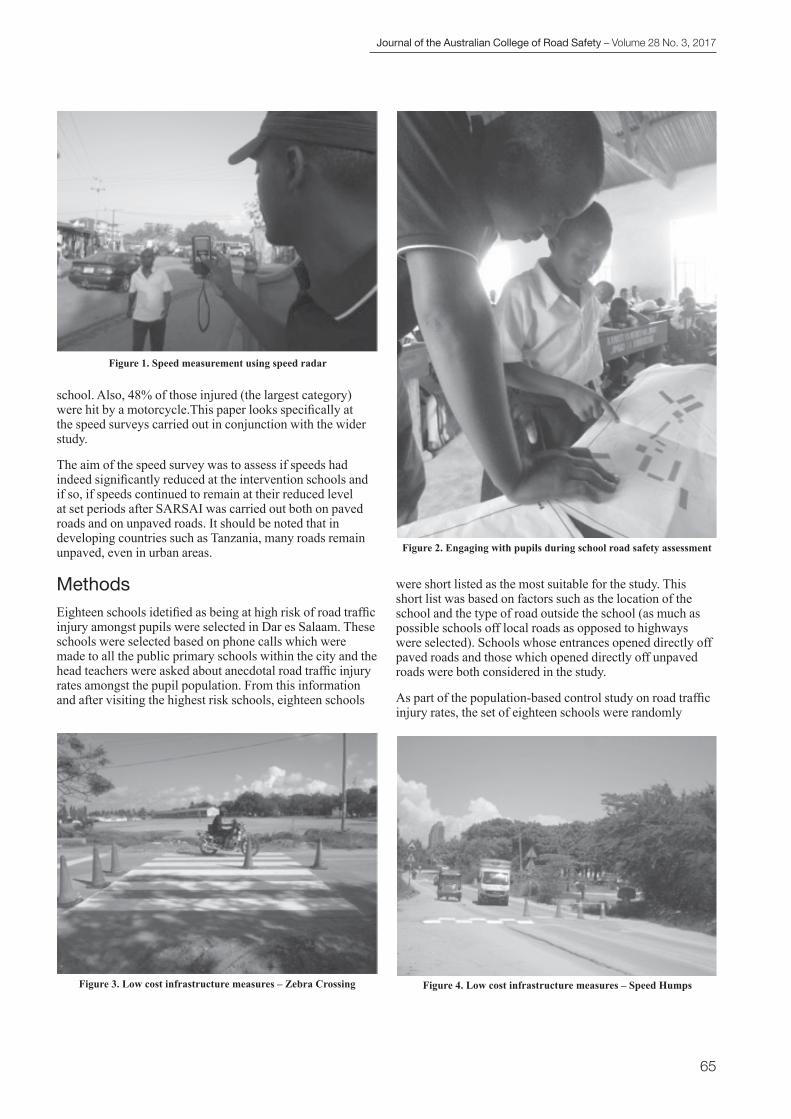
Journal of the Australian College of Road Safety – Volume 28 No. 3, 2017
65
school. Also, 48% of those injured (the largest category) were hit by a motorcycle.This paper looks specifically at the speed surveys carried out in conjunction with the wider study.
The aim of the speed survey was to assess if speeds had indeed significantly reduced at the intervention schools and if so, if speeds continued to remain at their reduced level at set periods after SARSAI was carried out both on paved roads and on unpaved roads. It should be noted that in developing countries such as Tanzania, many roads remain unpaved, even in urban areas.
MethodsEighteen schools idetified as being at high risk of road traffic injury amongst pupils were selected in Dar es Salaam. These schools were selected based on phone calls which were made to all the public primary schools within the city and the head teachers were asked about anecdotal road traffic injury rates amongst the pupil population. From this information and after visiting the highest risk schools, eighteen schools
were short listed as the most suitable for the study. This short list was based on factors such as the location of the school and the type of road outside the school (as much as possible schools off local roads as opposed to highways were selected). Schools whose entrances opened directly off paved roads and those which opened directly off unpaved roads were both considered in the study.
As part of the population-based control study on road traffic injury rates, the set of eighteen schools were randomly
Figure 1. Speed measurement using speed radar
Figure 2. Engaging with pupils during school road safety assessment
Figure 3. Low cost infrastructure measures – Zebra Crossing Figure 4. Low cost infrastructure measures – Speed Humps

Journal of the Australian College of Road Safety – Volume 28 No. 3, 2017
66
put into two groups – a ’control’ school group and an ’intervention’ school group. For this aspect of the study looking at speeds, speed data was collected at the nine ’intervention’ schools. Of the nine schools, five of the schools had paved asphalt roads outside the school gate and four of the schools had unpaved natural gravel roads outside the school gate.
Speed measurements were taken outside the school gates of each of the nine schools in their existing situations, before any road safety infrastructureinterventions were implemented. This data served as the ’baseline situation’. The measurements were taken over a 60-minute periods at the times when children arrive and depart from school. For public schools in Dar es Salaam, this was 06:30 –
7:30, 11:00 – 12:00 and 14:00 – 15:00. For each school, mesurements were taken on two seperate days (Tuesday, Wednesday or Thursday) at two of these time periods. A schedule was set for each school based on a randomised selection of observation days and times.
A research assistant was trained to collect the speed data. The research assistant made use of a speed radar (Figure 1) and, as much as possible, blended into the surrounding area to avoid contributing to a change of driver behaviour as a result of the speed measurement exercise.
The data was collected for all vehicles passing in one direction outsidethe school gate, in free flowing conditions. The speed of each vehicle, as well as the types of vehicles were recorded.
Figure 5. Low cost infrastructure measures – Bollards and Signage
Figure 6. Low cost infrastructure measures – Earth Hump (Unpaved Road)
Sample Sample Size (Vehicles Surveyed)Pre-intervention Post-intervention (2 weeks after) Post-intervention (One year after)
All Sites (9 sites) 1,873 1,921 1,766Paved Sites (5 sites) 1,535 1,468 1,112Unpaved Sites (4 sites) 338 453 654
Table 1. Achieved Sample Sizes for Speed Data
Figure 7. Relationship between impact speed and risk of pedestrian death in road traffic crash (Tingvall & Haworth, 1999)
Figure 8. Road safety education
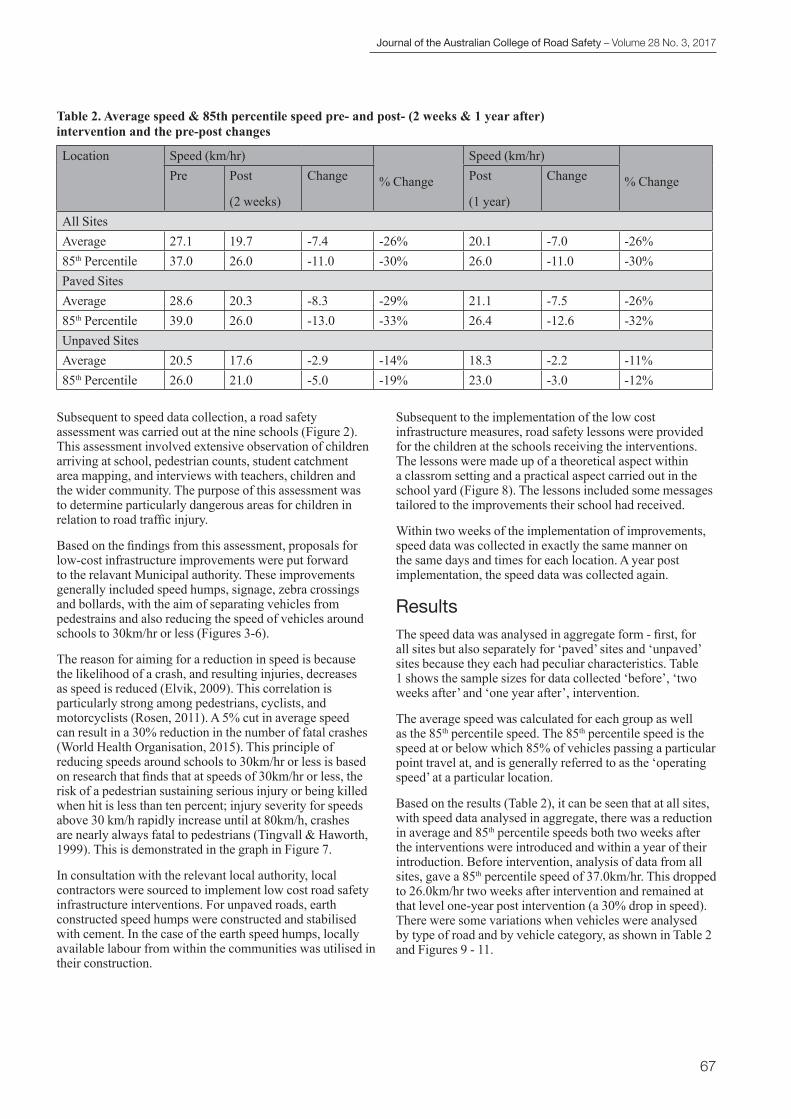
Journal of the Australian College of Road Safety – Volume 28 No. 3, 2017
67
Subsequent to speed data collection, a road safety assessment was carried out at the nine schools (Figure 2). This assessment involved extensive observation of children arriving at school, pedestrian counts, student catchment area mapping, and interviews with teachers, children and the wider community. The purpose of this assessment was to determine particularly dangerous areas for children in relation to road traffic injury.
Based on the findings from this assessment, proposals for low-cost infrastructure improvements were put forward to the relavant Municipal authority. These improvements generally included speed humps, signage, zebra crossings and bollards, with the aim of separating vehicles from pedestrains and also reducing the speed of vehicles around schools to 30km/hr or less (Figures 3-6).
The reason for aiming for a reduction in speed is because the likelihood of a crash, and resulting injuries, decreases as speed is reduced (Elvik, 2009). This correlation is particularly strong among pedestrians, cyclists, and motorcyclists (Rosen, 2011). A 5% cut in average speed can result in a 30% reduction in the number of fatal crashes (World Health Organisation, 2015). This principle of reducing speeds around schools to 30km/hr or less is based on research that finds that at speeds of 30km/hr or less, the risk of a pedestrian sustaining serious injury or being killed when hit is less than ten percent; injury severity for speeds above 30 km/h rapidly increase until at 80km/h, crashes are nearly always fatal to pedestrians (Tingvall & Haworth, 1999). This is demonstrated in the graph in Figure 7.
In consultation with the relevant local authority, local contractors were sourced to implement low cost road safety infrastructure interventions. For unpaved roads, earth constructed speed humps were constructed and stabilised with cement. In the case of the earth speed humps, locally available labour from within the communities was utilised in their construction.
Subsequent to the implementation of the low cost infrastructure measures, road safety lessons were provided for the children at the schools receiving the interventions. The lessons were made up of a theoretical aspect within a classrom setting and a practical aspect carried out in the school yard (Figure 8). The lessons included some messages tailored to the improvements their school had received.
Within two weeks of the implementation of improvements, speed data was collected in exactly the same manner on the same days and times for each location. A year post implementation, the speed data was collected again.
ResultsThe speed data was analysed in aggregate form - first, for all sites but also separately for ‘paved’ sites and ‘unpaved’ sites because they each had peculiar characteristics. Table 1 shows the sample sizes for data collected ‘before’, ‘two weeks after’ and ‘one year after’, intervention.
The average speed was calculated for each group as well as the 85th percentile speed. The 85th percentile speed is the speed at or below which 85% of vehicles passing a particular point travel at, and is generally referred to as the ‘operating speed’ at a particular location.
Based on the results (Table 2), it can be seen that at all sites, with speed data analysed in aggregate, there was a reduction in average and 85th percentile speeds both two weeks after the interventions were introduced and within a year of their introduction. Before intervention, analysis of data from all sites, gave a 85th percentile speed of 37.0km/hr. This dropped to 26.0km/hr two weeks after intervention and remained at that level one-year post intervention (a 30% drop in speed). There were some variations when vehicles were analysed by type of road and by vehicle category, as shown in Table 2 and Figures 9 - 11.
Location Speed (km/hr)
% Change
Speed (km/hr)
% ChangePre Post
(2 weeks)
Change Post
(1 year)
Change
All SitesAverage 27.1 19.7 -7.4 -26% 20.1 -7.0 -26%85th Percentile 37.0 26.0 -11.0 -30% 26.0 -11.0 -30%Paved SitesAverage 28.6 20.3 -8.3 -29% 21.1 -7.5 -26%85th Percentile 39.0 26.0 -13.0 -33% 26.4 -12.6 -32%Unpaved SitesAverage 20.5 17.6 -2.9 -14% 18.3 -2.2 -11%85th Percentile 26.0 21.0 -5.0 -19% 23.0 -3.0 -12%
Table 2. Average speed & 85th percentile speed pre- and post- (2 weeks & 1 year after) intervention and the pre-post changes
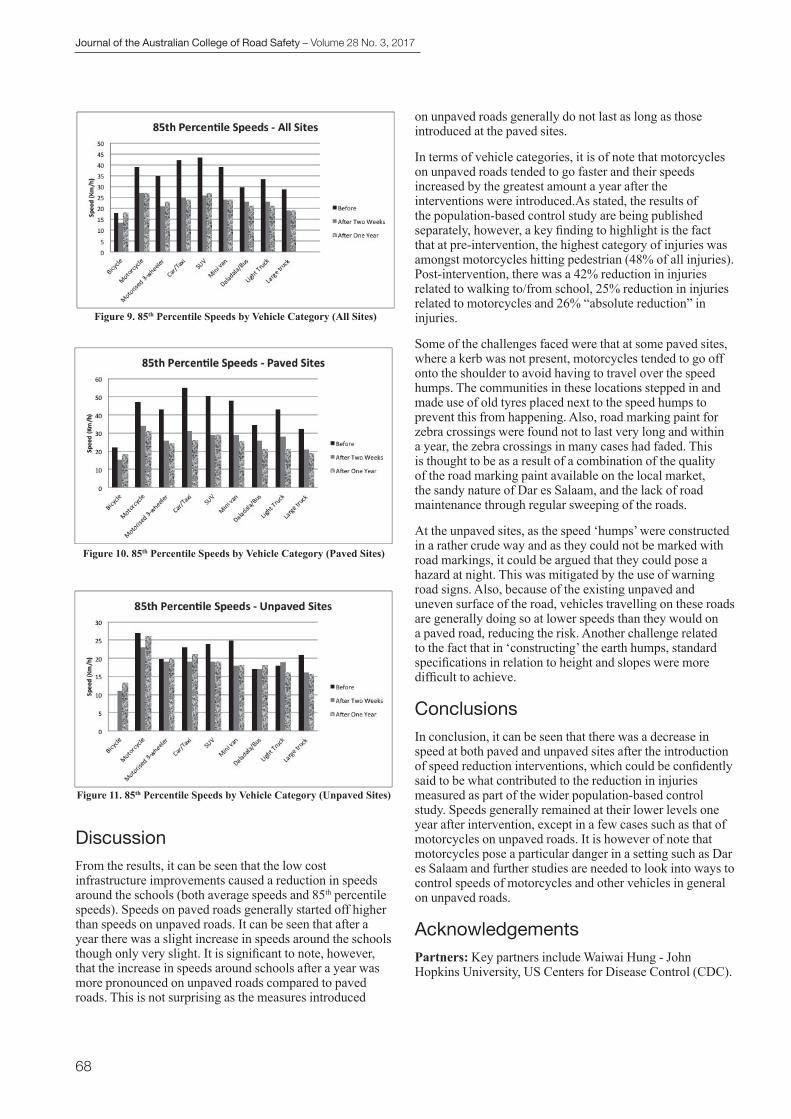
Journal of the Australian College of Road Safety – Volume 28 No. 3, 2017
68
DiscussionFrom the results, it can be seen that the low cost infrastructure improvements caused a reduction in speeds around the schools (both average speeds and 85th percentile speeds). Speeds on paved roads generally started off higher than speeds on unpaved roads. It can be seen that after a year there was a slight increase in speeds around the schools though only very slight. It is significant to note, however, that the increase in speeds around schools after a year was more pronounced on unpaved roads compared to paved roads. This is not surprising as the measures introduced
on unpaved roads generally do not last as long as those introduced at the paved sites.
In terms of vehicle categories, it is of note that motorcycles on unpaved roads tended to go faster and their speeds increased by the greatest amount a year after the interventions were introduced.As stated, the results of the population-based control study are being published separately, however, a key finding to highlight is the fact that at pre-intervention, the highest category of injuries was amongst motorcycles hitting pedestrian (48% of all injuries). Post-intervention, there was a 42% reduction in injuries related to walking to/from school, 25% reduction in injuries related to motorcycles and 26% “absolute reduction” in injuries.
Some of the challenges faced were that at some paved sites, where a kerb was not present, motorcycles tended to go off onto the shoulder to avoid having to travel over the speed humps. The communities in these locations stepped in and made use of old tyres placed next to the speed humps to prevent this from happening. Also, road marking paint for zebra crossings were found not to last very long and within a year, the zebra crossings in many cases had faded. This is thought to be as a result of a combination of the quality of the road marking paint available on the local market, the sandy nature of Dar es Salaam, and the lack of road maintenance through regular sweeping of the roads.
At the unpaved sites, as the speed ‘humps’ were constructed in a rather crude way and as they could not be marked with road markings, it could be argued that they could pose a hazard at night. This was mitigated by the use of warning road signs. Also, because of the existing unpaved and uneven surface of the road, vehicles travelling on these roads are generally doing so at lower speeds than they would on a paved road, reducing the risk. Another challenge related to the fact that in ‘constructing’ the earth humps, standard specifications in relation to height and slopes were more difficult to achieve.
ConclusionsIn conclusion, it can be seen that there was a decrease in speed at both paved and unpaved sites after the introduction of speed reduction interventions, which could be confidently said to be what contributed to the reduction in injuries measured as part of the wider population-based control study. Speeds generally remained at their lower levels one year after intervention, except in a few cases such as that of motorcycles on unpaved roads. It is however of note that motorcycles pose a particular danger in a setting such as Dar es Salaam and further studies are needed to look into ways to control speeds of motorcycles and other vehicles in general on unpaved roads.
AcknowledgementsPartners: Key partners include Waiwai Hung - John Hopkins University, US Centers for Disease Control (CDC).
Figure 9. 85th Percentile Speeds by Vehicle Category (All Sites)
Figure 10. 85th Percentile Speeds by Vehicle Category (Paved Sites)
Figure 11. 85th Percentile Speeds by Vehicle Category (Unpaved Sites)
Journal of the Australian College of Road Safety – Volume 28 No. 3, 2017
69
Funding: This work was supported by the FIA Foundation, United Kingdom [grant numbers 06-15, 2015-16]
References Elvik R. et al. (2009). The handbook of road safety measures, 2nd
ed. Bingley, UK. Emerald Group Publishing Limited.
FIA Foundation & Amend (2016) , Step Change Report, Retrieved from http://www.fiafoundation.org/connect/publications/step-change
Graham, A; Sparkes, P. (2010). Casualty reductions in NSW associated with the 40 km/h school zone initiative. Presented to 2010 Australasian Road Safety, Research, Policing and Education Conference, Canberra, 31 August to 3 September.
Rosen et al. (2011). Literature review of pedestrian fatality risk as a function of car impact speed. Accident Analysis and Prevention. 43:25–33.
Tingvall C, and Haworth N. (1999). Vision Zero – an ethical approach to safety and mobility. Presented to the 6th ITE International Conference Road Safety & Traffic Enforcement: Beyond 2000, Melbourne, 6-7 September.
United Nation Department of Social and Economic Affairs (2015), Retrieved from https://esa.un.org/unpd/wpp/publications/files/key_findings_wpp_2015.pdf
United Nation Department of Social and Economic Affairs (2015), Population Facts No. 2015/1, Retrieved from http://www.un.org/en/development/desa/population/publications/pdf/popfacts/PopFacts_2015-1.pdf
World Health Organisation (2004). Road Safety Speed Facts, Retrieved from http://www.who.int/violence_injury_prevention/publications/road_traffic/world_report/speed_en.pdf
World Health Organization (2015) Global Status Report on Road Safety
Perspective on Road SafetyPromoting “Safe Speeds” behaviour by changing the conversation around speed and speedingIan Johnston1 and Eric Howard2
1Ian Johnston Transport Safety Pty Ltd2Whiting Moyne
Corresponding Author: Ian Johnston, [email protected]
Key Findings• The evidence establishing that speed moderation is an essential “holding measure” (and sometimes a long-term
measure) in the implementation of a “Safe System” is overwhelming• Community norms entrench low-level speeding• Intense enforcement is critical but the community is antagonistic• Effective enforcement changes behaviour but attitudes lag decades behind• A new long-term strategy to address the community norms and support intense enforcement is proposed to sustain and
extend compliance
AbstractTraditional speed limit setting and speed enforcement practices created a community norm which historically accepted, indeed valued, low-level speeding. Public education strategies to date have largely focussed on conveying crash risk and casualty consequences and have lacked credibility. The approach required stems from preventive medicine and is analogous to promoting inoculation; something everyone needs to do to protect the community as well as themselves. Elements of a proposed new strategy are outlined.
Keywords Speed; speeding; public education; behaviours; enforcement

Journal of the Australian College of Road Safety – Volume 28 No. 3, 2017
70
Introduction The scientific evidence establishing the causal links between both casualty crash likelihood and severity and each of increased speed limits, limits set above the level of safety provided by extant conditions, and travel speeds above most limits (even by small margins) is incontrovertible (Johnston, 2004; Johnston, Muir and Howard, 2014). The “Safe Speeds” pillar of the Safe Systems conceptual model recognises that speed moderation is the crucial holding measure to manage road trauma levels until sufficient investment in infrastructure and vehicle safety can raise network safety to sustainable levels. Matching travel speeds to extant vehicle and infrastructure conditions is fundamental.
Despite the overwhelming evidence, measures to moderate travel speed remain controversial and under constant public challenge. Enforcement practices, especially the use of speed cameras and small enforcement tolerances, are regularly challenged (Wells, 2011). Limits are not seen as high and the relationship between a limit and the level of safety in that section of infrastructure is not understood (Bunting, et al 2017). Efforts to convince road users to moderate their speed behaviour have had measurable but limited success and such change as there has been has only occurred in conjunction with intense enforcement (VAGO, 2011).
The social and cultural context of low-level speedingExceeding the speed limit by small margins is endemic. Helen Wells describes it as normal deviant behaviour and as the everyday crime of the law-abiding (Wells, 2011). Many factors contribute to explaining why the cultural context is accepting of speed limit non-compliance:
1. The way we traditionally set limits was to measure speed distributions on different classes of road and set “default” limits around the 85th percentiles of the distributions under an assumption that compliance will be highest when most people are comfortable travelling at or around that speed. While we have since moved well past this practice we have (largely) retained default limits derived from the old days, especially on rural roads: limits that are discordant with the level of infrastructure safety built into many of these roads. We are out of step with accepted international practice; for example, two-lane two-way rural limits of 100 km/h are higher than in most comparable countries. In urban areas, particularly on arterials, especially those on older lower standard outer metropolitan arterials serving population growth areas, reducing traditional limits to match constructed and operating safety levels has proven difficult. Again, this is out of step with international practice.
2. Historically, police applied a tolerance to their speed enforcement of the order of 10% or 10km/h. For example, in a 60 zone, tickets were not issued for speeds below 70km/h. While the tolerance was never
official (public) policy it was widely known and accepted by motorists with the resultant widespread belief that the number on a speed limit sign was not a limit per se and a view that travel speeds a little in excess were clearly recognised by government as safe.
3. Personal daily experience reinforces the belief that low-level speeding is not dangerous – the behaviour is endemic and crash risk for any individual trip is clearly very low. Trying to convince people that the risks are high and the consequences substantial lacks credibility (Blackwell, Zanker and Davidson, 2017). In short, we have an internalised speed limit which is the product of perceived enforcement tolerances and low perceived risk. Intense enforcement introduces a risk of detection to modify behaviour and it is only this perceived risk that underpins the speed moderation gains to date (Johnston, Muir and Howard, 2014).
4. Populist statements from government leaders has provided further reinforcement. For example, in the early 2000’s in Victoria, enforcement tolerances and the use of speed cameras became an election issue with one party promising to restore the former and decrease the latter. Of course, political positions are underpinned by the prevailing community views and are part of the cultural context. The Victorian government requested an investigation of the integrity, accuracy and efficiency of the camera system on a high-speed toll road following public complaints. This toll road had fixed cameras that were also linked to create a point-to-point system. The report concluded that the …public are …slowing at each of the cameras and then speeding up …. resulting in readings of higher point-to-point speed than instantaneous speed. (Victorian Road Safety Camera Commissioner 2017)
5. What is credible to the public is that speeds well above the posted limits are both high risk and that resultant crashes have significant consequences. This is reinforced almost daily through the common media focus on dramatic crashes with their frequent reference to very high speeds. Many police still tend to focus their on-road speed interceptions on high-end speeders and many front-line officers hold the prevailing public views about low-level speeding (Johnston, Muir and Howard, 2014).
6. There is nothing in vehicle design that fosters speed moderation. For example, the speedometer is not a “fit for purpose” instrument. Typically, more than half the speedometer shows speeds that are illegal, even on our highest speed rural roads. The portion of the dial for the low range urban speeds is less than a third of the total. Vehicle advertising promotes power and performance – admittedly not to the extent that used to prevail, but clearly performance still sells. There is not a single vehicle safety design rule that addresses top speed capability or acceleration rates.
7. Unlike drink-driving, which is a once-a-journey decision, speed choice is a moment-to-moment continuous set of decision choices. There are instant perceived rewards from low-level speeding such as

Journal of the Australian College of Road Safety – Volume 28 No. 3, 2017
71
overtaking a vehicle ahead, clearing an intersection before the signals change, and so on. As congestion increases so does the saliency of these immediate rewards.
A perspective from preventive medicineGiven the social and cultural context in which low-level speeding occurs it is instructive to examine preventive medicine for a possible way forward. Whenever a low risk is widespread within a population the most effective strategy is to seek population change rather than to treat the minority sub-population at highest risk (Rose, 1992). For example, seeking to reduce average blood pressure across an entire population will prevent more heart disease than treating only those currently with elevated levels. Rose puts it thus: It is an irony of preventive medicine that many people must take precautions to prevent illness in only a few.
In road safety, the success of mandatory seat-belt wearing legislation is that it protects the whole population, analogous to inoculation, when most are exposed to a very low risk at the individual trip level. Similarly, although most seriously injured drink-drivers have blood alcohol levels well above 0.10, setting the legal limit at 0.05 sends a message about separating drinking from driving and, when coupled with random breath testing, facilitates population level change. In the same vein, low-level speeding is of lower casualty crash risk than high end speeding but it is endemic whereas high end speeding is undertaken by only a small minority of drivers. A small widespread risk generates a larger absolute number of casualty crashes than a relatively rare high risk (Johnston, Muir and Howard, 2014). Thus, this fundamental preventive medicine principle underpins the system-wide speed moderation strategy.
While the strategy is sound, effective implementation is problematic. It requires road users to accept the value of changing personal behaviour in order that (unknown) others may benefit. In the case of seat belt wearing, at the individual level little effort is required, no transient reward is forgone and there is perceived insurance value. Strict speed limit compliance requires effort, forgoes perceived immediate rewards and, since crash risk is perceived as low, insurance is irrelevant.
It also seems that many drivers will “game” the system (see the Victorian Road Safety Camera Commissioner 2017 findings). It is a difficult journey to achieve willingly compliant behaviour. In a sense, population-wide behaviour change requires acceptance of the principle of “the greatest good for the greatest number” best explained by reference to the classic economic case of the dilemma of the commons (Rose, 1992). In centuries past, each village in the UK held land “in common” for villagers to graze stock. If individual villagers increased the number of animals they grazed the commons became unsustainable, hence each villager had to forgo personal gain in favour of communal benefit. Public roads are clearly held in common – ownership is joint, the large number of users have independent access, no one user
can control the actions of others and total use can exceed supply. Yet road use behaviour appears determined by personal immediate gratification (Vanderbilt, 2008).
Facing the challengeThe inescapable conclusions are that the community-at-large simply does not accept that current speed limits on poorer standard roads need to be reduced as a priority or that low-level speeding is a risky behaviour. It seems the immediate rewards gained through everyday personal experience of the behaviour entrench these views. Success in behaviour change has been limited to intense enforcement, supplemented by public education seeking to justify that enforcement. It would seem from the ongoing opposition to intense enforcement that new public education strategies are needed. The principle is to mirror the social context for belt wearing and drink-driving to make low-level speeding undesirable from a community perspective. Turn enforcement into a positive.
The challenge to gain support for lower limits on less safe roads is complex and requires targeted education at regional and local levels. The following are suggested as principles for such a strategy:
1. Publicise the notion that infrastructure can be safety star-rated, just as vehicles are, and demonstrate the links between low safety ratings and crash history on a range of roads. Find and use blatant examples of the mismatch between built safety and extant speed limits.
2. Transparently relate intense enforcement to lower star-rated roads (including higher risk roads such as those with high volumes of vulnerable road users). Make enforcement about addressing the mismatch.
3. Consider reducing limits only on blatant sub-standard sections. Emphasise that enforcement is a holding measure until the poor standard roads can be upgraded.
4. Enhance deterrence through an increase in cameras across the network to create and sustain the anywhere, anytime principle so successful to date (Johnston, Muir and Howard, 2014).
5. Ensure that all road sections are well signed for speed limits. Credibility requires that drivers cannot claim not to have known the limit of the section they were on.
6. Ensure there is an avenue for appeal against perceived unfair enforcement (such as the speed camera Commissioner in Victoria).
7. Ensure all speed infringement fine revenue is transparently allocated to infrastructure safety remediation (to reinforce point 2 above).
8. Praise the public for improved compliance. For example, publicise the casualty reductions achieved by speed limit reductions to date and by intense enforcement. Similarly, do not publicise the number of infringements issued but praise the level of compliance (typically less than one or two percent of vehicles passing a speed camera site are above the limit).

Journal of the Australian College of Road Safety – Volume 28 No. 3, 2017
72
9. Promote the links between lower speed and improved fuel economy, reduced emissions and improved urban amenity. As with campaigns such as “Keep Australia Beautiful” an effort is required to make speed limit compliance socially desirable.
ReferencesBlackwell, R., Zanker,S ,and Davidson, J. (2017) Understanding
low-level speeders to increase speed compliance via road safety campaigns Journal of the Australasian College of Road Safety 28(2),47-55
Bunting, G., Durdin, P., Gamble, D., McAuley, I., Bridges, T., and Benson, M. (2017) Not allroads are created equal: Technical analysis and engagement frameworks developed for New Zealand’s Speed Management Guide Journal of the Australasian College of Road Safety 2Victoria Australia8(2), 36-46
Johnston, I. R. (2004) ‘Reducing Injury from Speed-Related Road Crashes – Towards the achievement of a Population-Based Preventive Strategy’ (Invited Guest Editorial) Injury Prevention 10(5), 257-259
Johnston, I., Muir, C. and Howard, E. (2014) Eliminating Serious Injury and Death from Road Transport: A crisis of complacency CRC Press (Taylor and Francis): Florida, USA.
Rose, G. (1992) The strategy of preventive medicine OEP London
Vanderbilt, T. (2008) Traffic: Why we drive the way we do (and what it says about us) Vintage Books (Random House), New York
VAGO (2011) Road Safety Camera Program: Victorian Auditor General’s Report Victoria, Australia
Victorian Road Safety Camera Commissioner (2017) Report of the Investigation into the Road Safety Cameras operating along Peninsula Link
Wells, H. (2011) The fast and the furious: Drivers, speed cameras and control in a risk society. Ashgate Publishing Group, Surrey, UK.
Calling for submissions to the Journal of the Australasian College of Road Safety (JACRS)
November 2017 Issue: We are soliciting contributions for the November 2017 Issue on all topics of road safety. Sample topics may include, but are not limited to: in-depth analyses of the rising road deaths in Australia with practical implications on actions to address them; evaluation of Safe System interventions; drug-driving related research, technology, and countermeasures; research related to autonomous vehicles; research/evaluation of road safety activities in low and middle income countries; case studies of best practice evidence-based enforcement.
SUBMISSION DEADLINE for November 2017 Issue:Peer-review papers: Wednesday, 2nd August 2017
Contributed (non peer-review) articles: Wednesday, 30th August 2017
For more details on article types, the scope and requirements see the Instructions to Authors available from the ACRS website: http://acrs.org.au/contact-us/em-journal-conference-contacts/ (scroll down). Please submit your manuscript online via the Editorial Manager: http://www.editorialmanager.com/jacrs/default.aspx. Authors wishing to contribute papers and discuss their ideas with the Managing Editor in advance of submission or to ask any questions, please contact Dr Chika Sakashita: [email protected]
You can also search for current and past papers here:https://trid.trb.org/http://acrs.org.au/publications/acrs-conference-papers/acrs-database/ http://search.informit.com.au/https://www.safetylit.org/Hard copies of the JACRS are also available at the National Library of Australia.
The JACRS citations are being indexed in the Emerging Sources Citation Index (ESCI) and citation activity is visible in Web of Science. We thank you for your continued support and contribution towards JACRS attaining an Impact Factor.
Want to be an exhibitor/sponsor at the much anticipated 28th Australian Road Research Board International Conference of 2018, bringing ‘Next Generation Connectivity’?
Over three days, attendees will be treated to talks from world renowned experts on Smart Roads, Next-Gen Asset Management, Disruptive Technologies, Enabled Mobility and Human Factors – not to mention a dazzling array of social and networking functions.
Following on from the 28th ARRB Conference, we are also hosting the PIARC 8th Symposium on Pavement Surface Characteristics: SURF 2018. ARRB brings this event to Australia on behalf of PIARC, with a focused consideration of ‘Vehicle to Road Connectivity’.
Shaping our transport future.
Visit arrb2018.com.au or surf2018.com.au
29 APRIL - 4 MAY 2018 BRISBANE CONVENTION CENTRE, AUSTRALIA

Journal of the Australian College of Road Safety – Volume 28 No. 3, 2017
ii
Win a trip to the USA
These awards include the following presentations:
• The prestigious Australasian College of Road Safety Fellowship Award in recognition of exemplary contribution being
made by an individual to road safety in Australasia.
• Australasia’s premier road safety award recognising projects
that exhibit exemplary innovation and effectiveness to save lives
and injuries on roads – the 3M-ACRS Diamond Road Safety Award. This award is entering its 7th year and is recognised as
Australasia’s premier road safety award recognising an outstanding
road trauma reduction project.
• ARSC Conference Awards (presented in the closing session of the
Australasian Road Safety Conference)
• Other awards as deemed appropriate by the joint hosts for the
ARSC Conference: ACRS, Austroads, C-MARC and ARRB
Austroads, ARRB, C-MARC and the ACRS look forward to
your participation in ARSC2017 which aligns with international,
Australasian and national road safety efforts, and is a significant
step forward in Australasia’s road safety strategy. Most importantly
we encourage your participation at this important event, which
recognises our outstanding individuals, organisations and projects as
we all strive to reduce road trauma.
More information is available at:
www.theaustralasianroadsafetyawards.com.au
Crown Ballroom, Crown Perth Wednesday 11th October 2017
The Australasian College of Road Safety Awards continue the tradition of the original Australasian road safety awards and conferences by recognising and celebrating exemplary projects and people working hard across our region to save lives and reduce injuries on our roads.

Journal of the Australian College of Road Safety – Volume 28 No. 3, 2017
73
Want to be an exhibitor/sponsor at the much anticipated 28th Australian Road Research Board International Conference of 2018, bringing ‘Next Generation Connectivity’?
Over three days, attendees will be treated to talks from world renowned experts on Smart Roads, Next-Gen Asset Management, Disruptive Technologies, Enabled Mobility and Human Factors – not to mention a dazzling array of social and networking functions.
Following on from the 28th ARRB Conference, we are also hosting the PIARC 8th Symposium on Pavement Surface Characteristics: SURF 2018. ARRB brings this event to Australia on behalf of PIARC, with a focused consideration of ‘Vehicle to Road Connectivity’.
Shaping our transport future.
Visit arrb2018.com.au or surf2018.com.au
29 APRIL - 4 MAY 2018 BRISBANE CONVENTION CENTRE, AUSTRALIA

Less Waste
Less Mess
Faster Reinstatement
Fewer Replacement Parts
Temporary Or Permanent Installations
Complete Standalone Unit
Low Maintenance
Lowest Whole Of Life Costs
•
•
•
•
• MASH TL3 Tested•
•
•
All Steel Construction•
•
The SMART CUSHION Spare parts detailed record to date for the �rst 47 resets.
To date 26 Smart Cushions have been impacted, one of these has been impacted 11 times. The total cost of all Spare Parts used in 47 resets is $7,338.00 at an average of $160.00 per reset.
sci-01 07/15 sci-02 07/15 sci-03 09/15 sci-04 10/15 sci-05 10/15 sci-06 11/15 sci-07 11/15
1st SP 1st SP 1st SP 1st SP 1st SP 1st SP 1st SP
11/15 11/15 12/15 04/16 05/16 05/16 06/16
1st SP+DP 1st SP 1st SP 1st SP 1st SP 1st SP+DP 1st SP+DP
07/16 07/16 10/16 10/16 11/16 11/16 11/16
1st SP+DP 1st SP+DP 1st SP 1st SP+DP 1st SP 1st SP 1st SP+DP
11/16 02/17 02/17 02/17 02/17 09/15 02/17
1st SP 1st SP 1st SP 1st SP+Sd 1st SP+Sd 2nd SP+DP 2nd SP
11/15 07/16 12/15 12/15 07/16 11/16 11/15
2nd SP+DP 2nd SP+DP 2nd SP 2nd SP+DP 2nd SP 2nd SP+DP 3rd SP
11/15 05/16 12/15 09/16 12/16
3rd SP 3rd SP 4th SP 4th SP+DP 4th SP
12/15 01/16 01/16 05/16 06/16 06/16 08/16
5th SP+DP 6th SP 7th SP 8th SP+Sd 9th SP+DP 10th SP 11th SP
Code for Unit number / date / sequence Reset/Repair required
sci-XX unique Smart Cushion number SP only Shear Pins were required
MM/YY Month reset/repaired SP+DP Delinator panel also replaced
1st / etc Reset sequence per unit SP+Sd Sled panel also replaced
sci-08 sci-09 sci-10 sci-11 sci-12 sci-13 sci-14
sci-15 sci-16 sci-17 sci-18 sci-19 sci-20 sci-21
sci-22 sci-23 sci-24 sci-25 sci-26 sci-01 sci-02
sci-06 sci-07 sci-08 sci-09 sci-14 sci-25 sci-01
sci-06 sci-09 sci-01 sci-06 sci-09
sci-01 sci-01 sci-01 sci-01 sci-01 sci-01 sci-01a
ROAD SAFETY DESIGN AT ITS BEST
distributed exclusively by
www.lbaustralia.com.auPh: 02 9631 8833
For further information, please contact:
Paul Hansen, LB Australia Pty Ltd
DESIGNED FOR SAFETYLow ride down accelerations on vehicle occupants in end-on impact
Reduced spare parts inventory: In almost 50% of all resets to date the only replacement parts needed are two 1/4” shear bolts
Increased crew safety: The average reset/repair time (often with just a one man crew) is 56 minutes
Reduced call out increase crew safety: to date there has been no call outs for side angle impacts, a similar pattern to that in the USA
Reduced lane closure time: Fewer call outs and faster repairs keep traf�c lanes open for longer
Happier motorists: Fewer lane closures, less blockages and faster repairs
SMART DESIGN, SAFER SITES FOR ROAD CREW and SAFER MOTORING
The SMART MONEY in Road Safety...
is onSMART CUSHION
GAME CHANGER
·
·
·
·
·
·
·
C
M
Y
CM
MY
CY
CMY
K
LB_SMART_CUSHION_420x275_PRESS.pdf 1 17/03/2017 9:34:27 AM
Lives lost on NSW roads. Our goal is zero.
To better understand road safety issues and trends, Centre for Road Safety road crash data is available via interactive reports.
Dynamic reports include detailed NSW statistics on road user deaths and serious injuries, crash types, injury trends and locations. Presentations and road safety data reports on speed, drug driving, heavy vehicles and younger drivers are also available on the website.
Interactive crash statistics available for NSW
Interested in road safety crash data?
Serious injuries 2016Including:
Visit roadsafety.transport.nsw.gov.au/statistics to find out more.
Sydney RMS Region Rest of NSW

Proudly sponsored byLB Australia
New South Wales Governmentand ANCAP
Australasian College of Road Safety Inc.
ACRS,POBox198,MawsonACT2607AustraliaTel0262902509Fax0262900914
PearceCentre,CollettPlace,PearceACTAustralia
Visit the College website at www.acrs.org.au
Vol 28 No 3, 2017
Journal ofthe Australasian College of Road Safety
Formerly RoadWise – Australia’s First Road Safety Journal
Peer-reviewed papersOriginal Road Safety Research
• The signs they are a-changin’: Development and evaluation of New Zealand’s rural intersection active warning system • Superstitious beliefs and practices in Pakistan: Implications for road safety• Investigating perceived control over negative road outcomes: Implications for theory and risk communication• Understanding parental beliefs relating to child restraint system (CRS) use and child vehicle occupant safety
Contributed articlesRoad Safety Policy & Practice
• Safe-Street Neighbourhoods: the role of lower speed limitsRoad Safety Case Studies
• SARSAI: Low Cost Speed Management Interventions around Schools – Dar es Salaam, TanzaniaPerspective on Road Safety
• Promoting “Safe Speeds” behaviour by changing the conversation around speed and speeding
Proudly sponsored byLB Australia
New South Wales Governmentand ANCAP
Australasian College of Road Safety Inc.
ACRS,POBox198,MawsonACT2607AustraliaTel0262902509Fax0262900914
PearceCentre,CollettPlace,PearceACTAustralia
Visit the College website at www.acrs.org.au
Proudly sponsored byLB Australia
NSW Transport Centre for Road Safety, and New Zealand Transport Agency


![Dynamic Open-source Satlink Analyzer (DOSA) · Bibliography [16] Tranter, William H., and Carl R. Ryan. "Simulation of communication systems using personal computers." IEEE journal](https://static.fdocuments.us/doc/165x107/602b37767db4b756d92b1907/dynamic-open-source-satlink-analyzer-dosa-bibliography-16-tranter-william-h.jpg)


