
JOURNAL N O H A* M FISHERIEI CS A N MANAGEMENTfaculty.washington.edu/skalski/classes/QERM597/... ·...
18
N O H A M I C A N JOURNAL* FISHERIES MANAGEMENT Volume 12 Winter 1992 Number 1 i\'f)rth American Journal of Fisheries Management 12:1-18. 1992 •p Copyrighi by the American Fisheries Society 1992 Experimental Design in the Management of Fisheries: A Review MURDOCH K. McAtLiSTER 1 AND RANDALL M. PETERMAN School of Resource and Environmental Management. Simon Fraser University Burnaby. British Columbia V5A IS6, Canada Abstract. —Despite the accumulating theoretical interest in experimental management, there are few practical applications of it. Because most fisheries management plans lack rigorous experimental design, managers often face controversy when results appear consistent with several alternative mechanisms or when results yield little information about causes offish population dynamics. We provide a synthesis of the problems of experimental design in fisheries science and management, and we show how these problems can be solved to generate better information and better decisions, especially when combined with proper statistical practices and formal decision analysis. Reasons why experimental management is currently rare are (1) lack of unfamiliarity of management agencies with designing management actions to yield information, (2) logistical constraints placed on rep- lication by fish migratory patterns. (3) resistance by fishermen who fear experimentation will lower incomes, or (4) risk of stock collapse. However, recent applications show that these constraints can be overcome if (1) experimentation is done on a small scale, such as on small stocks, (2) fishermen are compensated when cuts in fishing effort are required, (3) fishermen believe that experimentation is in their best interest (e.g., when it is likely to increase harvests), or (4) control populations are held in reserve in case overharvesting occurs in a treated population. Several quantitative decision analyses that include uncertainty show that experimentation sometimes has much higher expected economic value than not experimenting. Even though most fisheries biologists are trained to do field and laboratory experiments using principles of experimental design, approaches to fisheries management typically have been nonex- perimental (Larkin 1972; Walters 1986). Conse- quently, unexpected results of management ac- tions often lead to confusion rather than to learning, because the management manipulations were not designed to distinguish rigorously between alter- native explanations of observations. In other words, we are seldom able to use surprising results as tests of understanding. Many controversies exist over whether fish stocks 1 Present address: School of Fisheries, WH-10, Uni- versity of Washington, Seattle, Washington 98195, USA. are being underharvested or overharvested and whether management actions or environmental causes have led to the collapse of stocks (e.g., Glantz and Thompson 1981). One root cause of these controversies is the large uncertainty in our sci- entific understanding of managed systems. Part of this uncertainty results from the most common approach to fisheries management, called passive adaptive management (Walters and Hilborn 1976), in which historical data are periodically fitted to a model, new parameters are estimated, and new controls on fishing practices are identified. This form of incremental management often prevents scientists from resolving uncertainties about al- ternative hypotheses concerning productivity or optimal harvest for a stock because it tends to limit the range of observed stock abundances and it 1
Transcript of JOURNAL N O H A* M FISHERIEI CS A N MANAGEMENTfaculty.washington.edu/skalski/classes/QERM597/... ·...

N O H A M I C A N
JOURNAL* FISHERIESMANAGEMENT
Volume 12 Winter 1992 Number 1
i\'f)rth American Journal of Fisheries Management 12:1-18. 1992•p Copyrighi by the American Fisheries Society 1992
Experimental Design in the Management of Fisheries: A ReviewMURDOCH K. McAtLiSTER1 AND RANDALL M. PETERMAN
School of Resource and Environmental Management. Simon Fraser UniversityBurnaby. British Columbia V5A IS6, Canada
Abstract. — Despite the accumulating theoretical interest in experimental management, there arefew practical applications of it. Because most fisheries management plans lack rigorous experimentaldesign, managers often face controversy when results appear consistent with several alternativemechanisms or when results yield little information about causes offish population dynamics. Weprovide a synthesis of the problems of experimental design in fisheries science and management,and we show how these problems can be solved to generate better information and better decisions,especially when combined with proper statistical practices and formal decision analysis. Reasonswhy experimental management is currently rare are (1) lack of unfamiliarity of management agencieswith designing management actions to yield information, (2) logistical constraints placed on rep-lication by fish migratory patterns. (3) resistance by fishermen who fear experimentation will lowerincomes, or (4) risk of stock collapse. However, recent applications show that these constraintscan be overcome if (1) experimentation is done on a small scale, such as on small stocks, (2)fishermen are compensated when cuts in fishing effort are required, (3) fishermen believe thatexperimentation is in their best interest (e.g., when it is likely to increase harvests), or (4) controlpopulations are held in reserve in case overharvesting occurs in a treated population. Severalquantitative decision analyses that include uncertainty show that experimentation sometimes hasmuch higher expected economic value than not experimenting.
Even though most fisheries biologists are trainedto do field and laboratory experiments usingprinciples of experimental design, approaches tofisheries management typically have been nonex-perimental (Larkin 1972; Walters 1986). Conse-quently, unexpected results of management ac-tions often lead to confusion rather than to learning,because the management manipulations were notdesigned to distinguish rigorously between alter-native explanations of observations. In otherwords, we are seldom able to use surprising resultsas tests of understanding.
Many controversies exist over whether fish stocks
1 Present address: School of Fisheries, WH-10, Uni-versity of Washington, Seattle, Washington 98195, USA.
are being underharvested or overharvested andwhether management actions or environmentalcauses have led to the collapse of stocks (e.g., Glantzand Thompson 1981). One root cause of thesecontroversies is the large uncertainty in our sci-entific understanding of managed systems. Part ofthis uncertainty results from the most commonapproach to fisheries management, called passiveadaptive management (Walters and Hilborn 1976),in which historical data are periodically fitted toa model, new parameters are estimated, and newcontrols on fishing practices are identified. Thisform of incremental management often preventsscientists from resolving uncertainties about al-ternative hypotheses concerning productivity oroptimal harvest for a stock because it tends to limitthe range of observed stock abundances and it
1

Me ALLISTER AND PETERMAN
generates only small contrasts in fishing patternsover lime (Walters and Collie 1989).
Several other factors contribute to uncertaintyin our scientific understanding of managed sys-tems. Research scientists are continually reducinguncertainty in some aspects of fisheries biology(e.g., somatic growth, natural mortality, migra-tion), but the inability to manipulate systems overlarge areas and to control perturbations caused byfishing impedes understanding of the dynamics(e.g., recruitment processes) of harvested fish pop-ulations. Also, results of small-scale field experi-ments may differ from those of large-scale exper-iments because of community interactions(Peterman 1991). Partly for these reasons and partlybecause managers rarely have designed and im-plemented policies to test alternative biologicalhypotheses, we have few unambiguous under-standings of complex interactions among com-ponents offish communities. Thus, theories aboutsuch interactions and about responses of com-munities to disturbances remain based primarilyon incomplete and indirect evidence (Larkin 1972;Walters and Hilborn 1978; Mercer 1982; Walters1986; Colby et al. 1987; Sainsbury 1988).
These sources of uncertainty in our understand-ing of fish population dynamics have led severalauthors to advocate an experimental approach tomanagement (Larkin 1972; Loftus 1976; Waltersand Hilborn 1976, 1978; Holt 1977; Moiling 1978;Silvert 1978; Ludwig and Hilborn 1983; Petermanand Routledge 1983; Lee and Lawrence 1986;Walters 1986; Sainsbury 1988; Walters etal. 1988;Buckley 1989; Collie etal. 1990; McAllister 1990).Walters1 (1986) book, devoted entirely to this top-ic, presents compelling arguments for applying arigorous, quantitative approach. Experimentalmanagement promotes a scientific basis for man-agement yet does not require action to be depen-dent on extensive past studies; instead, actions canbe based on limited current data as long as un-certainties are recognized openly and experimentsare designed to generate new information to re-solve them. For example, proponents of the ex-perimental approach advocate that managementactions be treated as deliberate experiments to testhypotheses about components of population dy-namics offish stocks and to identify optimal man-agement regimes (e.g., Walters and Hilborn 1978;Peterman and Routledge 1983). This manipula-tive approach is essential to most resource man-agement sciences, and it allows fisheries managersto learn from their past actions (Larkin 1972). Themain goal of this approach is to reduce uncertainty
in our understanding of the dynamic componentsof harvested fish populations so the populationscan be managed more effectively.
An implicit assumption in experimental man-agement is that information gained by experimen-tation will be used to meet management objec-tives. The approaches to analyzing this informationinclude (1) informal comparisons of treatment andcontrol populations, and (2) formal quantitativeupdating of parameter estimates, testing of alter-native models of population dynamics, and choos-ing future management actions based on expectedeconomic yield and on the actions' ability to yieldthe most information about remaining uncertain-ties. The second approach was called active adap-tive management by Walters and Hilborn (1978),and it constitutes a special case of the broadercategory of experimental management. Activeadaptive management provides a framework forlearning as well as for systematically choosing andevaluating management actions as they are carriedout (Lee and Lawrence 1986; Walters 1986).
Although many authors have advocated exper-imental management in various situations, rela-tively few management agencies have tried theapproach. A significant drawback to active adap-tive management—as the method is portrayed byWalters and Hilborn (1976), Sainsbury (1988), andothers—is that it may not be readily understand-able to fisheries managers and the fishing industrybecause it involves relatively sophisticated quan-titative methods (see Walters 1986). Moreover,experimental management is only now gaining wideacceptance, and most fisheries managers are sim-ply not yet familiar with its potential benefits. Ad-ditional reasons for the paucity of applications ofexperimental management involve social, eco-nomic, and biological constraints. For example,large reductions in fishing effort could generatelarge, informative contrasts (ranges) in catch andeffort data that might allow analysts to moreclearly identify the true underlying shape of den-sity- or effort-dependent relationships on whichsuccessful management depends. However, suchreductions in effort may be resisted by fishermenbecause of the possibility of lowered incomes. Incontrast, large increases in effort may produce anunacceptable risk of stock collapse. Spatial repli-cation of management actions to control for spatialvariation in responses may be impossible if dif-ferent stocks move widely across potential spatialreplicates. Nevertheless, examples described be-low illustrate that experimental management canbe applied even with these constraints.

EXPERIMENTAL DESIGN FOR FISHERIES MANAGEMENT
In this paper, we attempt to make the case fora more experimental approach to fisheries man-agement by bridging the gap between the complexquantitative methods of active adaptive manage-ment and the general conceptual approach to ex-perimental management. First, we outline somegeneral features of experimental design highlightedby Hurlbert (1984), and we add statistical power,Bayesian analysis, and formal decision analysiscriteria to these concepts. Second, we demonstratehow various management actions and field re-search projects with improper experimental designhave led to inconclusive results. We suggest im-provements to the designs in each case. Third, wediscuss the heuristic potential of some proposedand implemented experimental designs. Fourth,we review evidence from analyses of decision op-tions showing that, in some fisheries, an experi-mental approach to management may generatehigher economic value than current managementstrategies generate. Finally, we discuss the appli-cability of the experimental approach, as well asits constraints and how to overcome them.
General Design of ExperimentsHurlbert's Features of Experimental Design
Hurlbert (1984) identified the components of anexperiment as (1) hypothesis, (2) experimental de-sign, (3) execution of experiment, (4) data analysis,and (5) interpretation of results. In this paper, weare primarily concerned with experimental design.Advocates of experimental management empha-size that before management actions are taken,hypotheses should be clearly stated, possible bi-ological models should be described mathemati-cally, and experimental designs should be carefullychosen (Walters and Hilborn 1978; Walters 1986;Sainsbury 1988). Good experimental design is cru-cial to distinguish among alternative hypotheses(Hurlbert 1984).
Hurlbert (1984) stated that experiments basedon simple methods such as comparing means with/-tests or analyses of variance should include (1)control units (e.g., populations) against which oneor more treatment units are to be compared; (2)treatments that control for effects of the procedureand for temporal changes in experimental units;(3) replication in time and space, which controlsfor stochastic factors among replicates that are in-herent in the experimental material or introducedby the experimenter; (4) interspersion of differ-ently treated units in time or space to control forregular spatial or temporal gradients in properties
of experimental units; (5) randomization in allo-cation of different treatments to experimental unitsto control for bias; and (6) statistically indepen-dent experimental units so that the responses inone experimental unit are not related to responsesin other units except insofar as they share the sametype of treatment and there is a treatment effect.Note, however, that some of these criteria are notnecessary for some types of statistical analyses (e.g.,replication is not necessary if responses to differentlevels of a treatment are determined by regres-sion).
Statistical PowerThe concept of statistical power is also impor-
tant for the design of field and management ex-periments (Dixon and Massey 1969; Pearson andHartley 1976; Green 1979, 1989; Vaughan andVan Winkle 1982; Peterman and Routledge 1983;Toft and Shea 1983; Millard and Lettenmaier 1986;Gen-Odette 1987; Holt etal. 1987; Peterman 1989,1990). Statistical power reflects the ability of anexperiment to detect an effect that actually exists.The power of an experiment is equal to 1 - #,where 0 is the probability of committing a type IIerror. A type II error occurs when an experimentfails to reject the null hypothesis, the hypothesisstating that there is no effect, even though an effectexists. For a given experimental situation, 0 is in-versely related to a, the probability of committinga type I error, whereby the null hypothesis is in-correctly rejected. The power of an experimentmay be increased by increasing the differences be-tween the levels of treatments, increasing the num-ber of experimental units, increasing the durationof the experiment, reducing sample variance causedby measurement error, or increasing the a level.Cohen (i 988) and Peterman (1990) discussed sta-tistical power further.
Until recently, most ecologists focused onavoiding the costs of type I errors (Toft and Shea1983; Peterman 1990). However, type II errorsmay also be very costly, as when one incorrectlyconcludes that stock productivity is not decliningunder current management regulations (Alien 1980;Toft and Shea 1983; Green 1984; Peterman 1990).Because type II errors can be costly, managersshould design experimental or management ac-tions so that true responses can be detected withhigh probability (high power).
Bayesian CriteriaBayesian analysis is another means to assess the
statistical performance of an experimental design
Me ALLISTER AND PETERMAN
(Edwards et al. 1963; Berger 1985). It offers analternative to classical or "frequentist" statisticalinference, of which statistical power analysis is apart. As is well known, by using data to estimatea test statistic, the classical approach addresses thequestion "Given that the null hypothesis is true,what is the probability of obtaining a test statisticas extreme as or more extreme than the one ob-served?" If the probability (i.e., P value) is lessthan the significance level chosen (usually 0.05),the null hypothesis is rejected.
In contrast, the Bayesian approach allows thescientist to address the question "What is the prob-ability that a hypothesis is true, given the data?"—and thereby directly address the likelihood of dif-ferent hypotheses being true—whereas the classi-cal approach only indirectly provides informationconcerning whether some effect exists (Berger andBerry 1988; Reckhow 1990). In addition, theBayesian approach facilitates quantification of sci-entists' subjective input in experimental design andstatistical analysis by incorporating into the anal-ysis the scientists' prior expectations of the like-lihood of alternative hypotheses (known as priorprobabilities). Bayesian methods can also be usedto design and evaluate the results of large-scalefield experiments for which no replication is pos-sible (Walters 1986; Parma and Deriso 1990;Reckhow 1990). Hence, Bayesian statistical anal-ysis has been advocated for ecological field ex-periments (Carpenter 1990; Reckhow 1990), andit is also starting to receive attention in fisheriesscience (Walters 1986; Sainsbury 1988; Parma andDeriso 1990).
To evaluate the statistical performance of anexperimental design within the Bayesian frame-work, the analyst computes the expected rate atwhich the assumed-true hypothesis can be iden-tified when there are a number of alternative hy-potheses. In separate simulation analyses, each al-ternative hypothesis is treated as if it is true. Themost informative design then becomes the onethat, for example, maximizes the expected rate ofimprovement in the probability that the assumed-correct hypothesis is true (summed across all ofthe alternative hypotheses) (e.g., Parma and Der-iso 1990).
However, there is a continuing controversy overthe benefits and disadvantages of the Bayesian ap-proach compared with the traditional approach(Howson and Urbach 1989 summarize many ofthe arguments). In spite of this, Bayesian statisticsappear to be gaining wider acceptance among ecol-ogists (e.g., Reckhow 1990).
Decision Theoretic Criteria
In addition to statistical criteria, decision the-oretic criteria can be used for experimental designwhen components of management decisions canbe identified and costs and benefits of differentoutcomes can be estimated. In this context ana-lysts identify alternative hypotheses about the sys-tem of interest and several alternative manage-ment policies, usually ranging from experimentalto nonexperimental. The optimal experimentaldesign or policy option is the one that yields thehighest value of the objective function—for in-stance, the highest expected economic value. Theexpected value of a policy option incorporates thealternative hypotheses of interest, the odds placedon each alternative hypothesis, and the economicvalue (often in terms of catch biomass) of an out-come that is expected under each alternative hy-pothesis. The expected value of a policy option isthus the sum of products of the probability levelplaced on each hypothesis and the discounted val-ue yielded under it, summed across all of the al-ternative hypotheses (including the null hypoth-esis) (Raiffa 1968; Walters 1977, 1986; Parma andDeriso 1990). Utility functions are sometimes usedto convert economic and nonmonetary measuresof performance into units that reflect the relativevalue of each option (Keeney and Raiffa 1976;Walters 1977).
Within this framework of decision theory, theclassical approach to hypothesis testing is not di-rectly useful because it does not generate proba-bilities that a given alternative state of nature istrue (Berger and Berry 1988). In contrast theBayesian approach gives these probabilities di-rectly; it is thus sometimes used in computing theexpected values of alternative policy options (Wal-ters 1986; Sainsbury 1988; Parma and Deriso1990).
But clearly both statistical and decision theo-retic criteria are important in assessing the appro-priateness of experimental design in different man-agement situations. When sensitivity analyses ofa decision analysis show that uncertainties regard-ing utility or net economic benefits drastically in-fluence the choice of experimental design, statis-tical criteria provide important additionalinformation. Statistical criteria are also importantin situations where decision processes are so com-plex that they preclude decision analysis (C. J.Walters, University of British Columbia, personalcommunication) or where economic or utility val-ues cannot be estimated. For more discussion and
EXPERIMENTAL DESIGN FOR FISHERIES MANAGEMENT
details on methods of Bayesian, frequentist, andother approaches relevant to statistical inferencein ecological and fisheries experiments, see Wal-ters (1986), Carpenter (1990), and Reckhow (1990).For descriptions and discussion of decision the-oretic techniques, see Raiffa (1968), Lindley (1985),and papers referenced by Walters and Holling(1990).
Problems with Past Experimental Designsand Possible Improvements
Some readers of our examples below may con-clude that we have not adequately recognized thebiological, logistical, or budgetary constraints facedby researchers and managers. On the contrary, werecognize these constraints, but one of our pur-poses is to raise the current level of awarenessabout the benefits of applying principles of exper-imental design to management so that researchersand managers can take full advantage of oppor-tunities that arise if such constraints are relaxed.We respect past attempts at ex peri mental man-agement and are merely trying to constructivelyidentify additional elements of design that couldbe added if similar situations arise again. We em-phasize that because of biological, logistical, orbudgetary constraints, some of the improvementswe recommend do not create ideal experimentaldesigns with all the appropriate features. However,our recommended improvements should at leastlead to stronger tests of hypotheses, reduce thenumber of alternative explanations of the resultingobservations, and thereby reduce uncertainty con-cerning the effects of past and current approachesto management.
Lack of Temporal and Spatial ReplicationIn situations where treatments are not replicat-
ed, interpretations of results are often limited.However, application of replicate treatments toseparate experimental units enables researchers to(1) test whether treatments produce repeatable ef-fects in situations with similar conditions, (2) dis-tinguish treatment effects from natural variation,(3) estimate the variance in estimated parameters,and (4) test for significance. Given the situationsoften faced by resource managers (no replicationand one or two levels of a treatment), results can-not easily be generalized to other cases. In manyfisheries situations, managers are interested onlyin one fish stock, or they can undertake manipu-lations only on the entire set of managed stocksor only at one site. Thus, managers frequently ini-tiate one treatment (e.g., a new regulation) at a
time rather than conducting two or more contrast-ing treatments simultaneously on different popu-lations, and manipulations often are initiatedwithout spatial replication or simultaneous con-trols. Because fisheries systems are typified by spa-tial variability and chance events, ideal experi-mental conditions may not hold, and this use ofunreplicated, uncontrolled treatments exacerbatesdifficulties in subsequent interpretation of results.
If there is any replication, it is usually temporal.Stewart-Oaten et al. (1986) argued that when thereis only one control and one treatment site, mea-surements of responses should be taken repeatedlyboth before and after the manipulation begins.Without this replication in time, there is no controlfor temporal variability and error in the measuredresponses. Repeated measurements in time, how-ever, are no substitute for replicated treatments,especially when only one stock is treated and theresults will be applied to more than one fish stockin the future. Replication in time by itself doesnot control for, or enable measurement of, themagnitude of spatial variability or the interactionsbetween spatial units and treatments (Green 1987).These problems of replication are exemplified be-low. See Walters (1986) and Walters et al. (1988,1989) for quantitative methods (e.g., cluster anal-ysis) for choosing spatial replicates in managementsituations.
In the following cases, the first and second ex-amples show temporally but not spatially repli-cated manipulations, and the third example showsmanipulations that were neither spatially nor tem-porally replicated.
Example / .—In the 1930s the International Pa-cific Halibut Commission (IPHC) imposed severalregulations to conserve stocks of Pacific halibutHippoglossus stenolepis. For example, in 1932, inorder to protect immature Pacific halibut, the IPHCclosed halibut fishing year-round in two areas, onein southeastern Alaska and the other in BritishColumbia. These closures were maintained untilthe 1960s (Skud 1985). In addition, seasonal quo-tas and closures were established elsewhere in the1930s and have continued since then.
The IPHC gained international recognition forrebuilding Pacific halibut stocks between i 930 and1960. However, some scientists (Burkenroad 1948;Ketchen 1956; Fukuda 1962) have questionedIPHCs role in the recovery of the stocks. For ex-ample, Ketchen (1956) concluded that historicaldata are also consistent with climatic trends as acause of recovery of Pacific halibut stocks sincethe 1930s. Furthermore, it is unclear how well each
McALLISTER AND PETERMAN
of the different regulations worked because theywere all initiated at approximately the same time.
Recommended improvements: In the Pacifichalibut fishery, spatial replication of contrastingfishery regulations is not practical because of thewide-ranging migratory behavior of halibut. Yetthe effects of different regulations could have beendistinguished better if the regulations had beenimposed sequentially rather than simultaneously(Stewart-Oaten et al. 1986). Seasonal closures andcatch quotas could have been imposed at non-overlapping times in an attempt to yield strongcontrasts in abundance among sets of age-classes.For example, the effect on age-class abundancesof a large quota imposed over 10 years could havebeen compared with that of a small quota in asubsequent period. This procedure would not haveeliminated the possibility that changing marineconditions could confound the results, but onecould guard against this by later reintroducing alarge quota. Parma and Deriso (1990) reported amore comprehensive analysis of experimental op-tions for Pacific halibut; it was based on a Bayesianapproach that compared the expected perfor-mances of actively adaptive, passively adaptive,and nonadaptive harvest policies in discriminat-ing between alternative hypotheses about mech-anisms that could affect recruitment of Pacific hal-ibut.
Example 2.-Between 1903 and 1936, 10 fishhatcheries in British Columbia propagated sock-eye salmon Oncorhynchus nerka (White 1988).During the 1920s biologists questioned whetherhatchery propagation of sockeye salmon actuallyresulted in higher freshwater survival rates thandid natural propagation (Foerster 1938). Foerster(1938) compared the egg-to-smolt survival ratesof natural and two artificial methods of propaga-tion, but only at Cultus Lake, British Columbia.The different treatments were alternated betweenyears for 12 years. Because Foerster found no sig-nificant difference in survival rates, the British Co-lumbia Minister of Fisheries closed all 10 BritishColumbia sockeye salmon hatcheries in 1936(Foerster 1968). As a result, hatcheries have notbeen used subsequently in British Columbia toproduce sockeye salmon, with the exception of twosmall pilot projects (White 1988).
However, Foerster's experimental design, whichemployed only one hatchery and its associated wildpopulation, gave insufficient evidence to concludethat all hatcheries in British Columbia were notmore efficient at propagation of sockeye salmonthan were natural means. Of course, Foerster (1968)
recognized this insufficiency, and he reported thatspawning conditions at Cultus Lake were atypicalrelative to conditions at other hatchery locations:sockeye salmon at Cultus Lake spawned alonggravel inshore areas of the lake where seepage oc-curred, but at other hatchery locations wild pop-ulations of sockeye salmon spawned in tributarystreams. Thus, egg-to-smolt survival rates at Cul-tus Lake were probably not representative of thoseat other hatchery locations (White 1988), and thefindings of this study should not have been gen-eralized to other sockeye salmon hatcheries by theMinister of Fisheries.
Recommended improvements: A design thatcould have permitted generalization would haveincluded spatial replication. Hatcheries in severaldifferent river systems could have been includedin the experiment. As in Foerster's (1938) study,hatchery propagation could have been alternatedwith artificial propagation between years, andsockeye salmon responses to each propagationmethod could have been monitored in each riversystem. However, because of the potential varia-tion in the performance among hatcheries, perhapsit would have been even better to decide whetherto maintain or close hatcheries based on their in-dividual performance rather than on the averageperformance of a subset of all of the hatcheries(Foerster 1968).
Example J.—Bilton et al. (1982) studied howsize and time at release of hatchery-raised smoltsof coho salmon Oncorhynchus kisutch affected re-turns. The study took place over one season at onestudy site. Groups of small, medium, and largesmolts were tagged and released at four limes be-tween April and July. The rates of return of jack(2-year-old) and adult (3-year-old) coho salmonwere then monitored. Bilton et al. (1982) deter-mined optimal sizes and times of release by usingbiological and economic (benefit-cost) criteria.However, they could not estimate interannualvariability in times and smolt sizes optimum forrelease because they had data from only 1 year.Furthermore, they could not estimate the mag-nitude of among-stock variability because testswere performed only at one site. Thus, they couldnot make generalizations applying to other yearsor to other stocks at other sites.
Recommended improvements: The experimen-tal design could have been improved by replicatingthe same design in other years at the same site toenable estimation of temporal variation in optimaltime and size of release at the study site (Stewart-Oaten et al. 1986). To develop a model to predict
EXPERIMENTAL DESIGN FOR FISHERIES MANAGEMENT
times and fish sizes optimal for release of hatchery-raised coho salmon from other hatcheries and inother years (and thus generate the highest sustain-able economic yield), researchers could use an ex-perimental design similar to that described by Bil-ton et al. (1982) but at several different hatcheriesover several years. It is likely that times and fishsizes optimal for release varied between years andamong sites because of variation in such featuresas genetic stock of coho salmon, availability offood, and risk of predation in release waters. Thesepotentially important variables would have to becarefully and systematically monitored and re-corded at all experimental sites. The effect of vari-ables such as genetic stock on fish sizes and timesthat are optimal for release could be tested byreplicating treatments within and across sites; suchan approach incorporates a control for interactioneffects between site and treatment (Green 1979,1987).
Thus, manipulations that are not replicated intime or space may provide only limited infor-mation. As shown above, replication in time butnot in space may be uninformative, especially whenrare events occur between years or when changesin environmental conditions occur simultaneouslywith the imposed regulations. Experiments withboth temporal and spatial replication are less likelyto be confounded by these events and will allowthe probability levels in classical hypothesis teststo be calculated after the experiment (Hurlbert1984). Even with Bayesian criteria, such experi-ments also facilitate better discrimination amongalternative hypotheses than do manipulations withonly temporal replication (Walters 1986; Sains-bury 1988; Carpenter 1990; Reckhow 1990).
Lack of Contrasting TreatmentsAbsence of informative ranges for stock abun-
dances and fishing patterns over time characterizesmany fisheries, especially conservatively managedones (Walters 1986; Walters and Collie 1989). Thispattern is apparent, for example, in managementof whales (Holt 1977; Alien 1980), of Pacific oceanperch Sebastes alutits (Walters and Collie 1989)and sockeye salmon in British Columbia (WaltersandHilborn 1976; Collie etal. 1990), and of somemultispecies communities (Tyler et al. 1982;Sainsbury 1988). The authors cited above notedthat ranges of fishing effort and stock abundancein these fisheries are not wide enough to identifyclearly the best model of stock dynamics or toprovide reasonable estimates of model parametersor maximum sustainable yield (MSY).
Managers often are reluctant to increase effortto test their understanding of stock dynamics forfear of overharvesting (Walters 1986; Sainsbury1988; Walters and Collie 1989) or to decrease ef-fort because of social or economic constraints. Yetthe inability of mathematical and statistical meth-ods to eliminate uncertainty associated with ex-isting data often indicates a need for "adaptiveprobing"—that is, fishing effort needs to be sig-nificantly changed to generate informative con-trasts in the data. This approach thus would de-crease variance estimates in model parameters(Walters and Hilborn 1976; Ludwig and Hilborn1983; Walters and Collie 1989).
Example.— Dwindling spawning escapementsof chinook salmon Oncorhynchus tshawytscha inthe Fraser River led managers to attempt to reducethe terminal gill-net harvest by imposing a max-imum gill-net mesh size in 1981. It was expectedthat smaller nets would catch sockeye salmon andpink salmon O. gorbuscha effectively but not thelarger chinook salmon. Indeed, the terminal gill-net catch of chinook salmon decreased signifi-cantly (K. Wilson, Canada Department of Fish-eries and Oceans, personal communication), andreplication over several years produced resultsconsistent with the hypothesis that the new reg-ulation was effective. However, adult chinooksalmon abundance continued to decrease after thenew regulation was imposed (Walters and Riddell1986). Therefore, one cannot definitively concludethat the new mesh regulations worked, because thedecrease in abundance may have accounted forsome or all of the decrease in catch of chinooksalmon (Wilson, personal communication).
Recommended improvements: Managers couldhave more accurately estimated the effectivenessof the mesh-size regulation in reducing the by-catch of chinook salmon by applying simultaneouscontrasting treatments in which a portion of thefleet used large-mesh nets and the remainder usedsmall-mesh nets. Managers could then have com-pared the catch per unit effort (CPUE) for chinooksalmon between the two types of nets. If CPUEfor the two types of nets had decreased by aboutthe same amount after the new regulations wereimposed, then it would have been clear that theoverall decline in stock abundance was a majorcontributor to the decrease in CPUE. In contrast,if the CPUE for boats with small-mesh nets haddecreased much more than that for boats withlarge-mesh nets, then the evidence would havebeen stronger that the change in mesh size had alarger effect than did the decrease in stock abun-
8 McALLISTER AND PETERMAN
dance. Statistical power analysis (Peterman 1990)could also have been used to estimate the numberof boats to be equipped with large-mesh nets, sothat the effect (if any) of the new regulation on by-catch of Chinook salmon could be detected.
Lack of Statistical IndependencePseudoreplication occurs when researchers use
inferential statistics to test for treatment effects indata from experiments in which treatments werenot replicated or replicates were not statisticallyindependent (Hurlbert 1984). Green (1987) em-phasized that a typical result of pseudoreplicationis that the variance in error terms used in statisticaltests is underestimated. This inaccuracy can occurif the variance among repeated samples of a singletreatment—rather than properly replicated treat-ments—is used in the tests, or if treatment in oneexperimental replicate affects measured responsesto treatment in other replicates and the replicatesare treated as independent from one another instatistical tests.
Example. —Lack of independence among ex-perimental units could also make it difficult formanagers to interpret responses to treatments. Inthe Great Central Lake fertilization (enrichment)project in British Columbia, the returns of adultsockeye salmon to the nearby, unfertilized SproatLake, which is in the same river system, were mon-itored as a control. Addition of nutrients to thetreated lake was expected to increase its primaryand secondary productivity and thereby increasethe production of sockeye salmon rearing in GreatCentral Lake. However, adult returns to both lakesincreased substantially following treatment ofGreat Central Lake. LeBrasseur et al. (1978) at-tributed the unexpected increase in adult returnsto Sproat Lake to (1) reduction in depensatorymortality factors (e.g., from predators feeding onsmolts migrating from both lakes) as a result ofsubstantially increased smolt output from GreatCentral Lake, (2) straying of Great Central Lakeadults into Sproat Lake, or (3) unplanned simul-taneous cultural eutrophication in Sproat Lake,which could have increased the food supply forjuveniles. The first two possible interactions makeSproat Lake an unsuitable control in this experi-ment.
Lack of independence between spatial units is auniversal problem for spatially replicated designsin fisheries management. Strong interactions be-tween adjacent fish stocks from migration, sharedpredators, or competition for a shared food sourcemay violate their statistical independence, so
managers should be extremely careful in choosingreplicates to minimize this problem.
Lack of InterspersionWhere there are several experimental units or
stocks with different treatments, the use of inter-spersion is critical to avoid confounding resultswith spatial differences in properties of experi-mental units (Hurlbert 1984). These differencesmay represent an initial condition, or they mayarise from spatially distinct disturbances that oc-cur once an experiment is in progress (Hurlbert1984). If the differences occur along a gradient,and if experimental units with different treatmentsare arrayed along that gradient, it may be difficultto distinguish treatment effects from other sourcesof variation. Spatially interspersing the differenttreatments across experimental units may reducethe potential for such sources of confusion. Parallelarguments also apply to the need for temporalinterspersion, whereby a stock is exposed to treat-ment A for some period, treatment B for the nextperiod, and then to treatment A again. This patternreduces the possibility that the apparent initialresponse to treatment B could be confused withsome temporal change in a variable that happenedto occur simultaneously with initiation of treat-ment B.
Example. —As noted above, the by-catch ofchi-nook salmon in the Fraser River decreased afterthe mesh size of gill nets was changed in 1981, butit was unclear whether this decrease was due tochanging selectivity of nets or whether, as sug-gested by other data (Walters and Riddell 1986),chinook salmon abundance had simply decreased.If the simultaneous contrasting-treatment designrecommended above proved unworkable, it mightbe possible to eliminate one of these explanationsby monitoring total stock abundance and by in-terspersing contrasting treatments in time. Afterseveral years with the new, smaller-mesh nets, onecould allow the old-style, large-mesh gill nets againfor some period, which would create interspersionin time of the two treatments—a period of yearsof fishing with large-mesh gill nets followed by aperiod with small-mesh gill nets, and then back tolarge-mesh nets. If CPUE was high, low, and highin those respective periods, and if stock abundancewas constant or showed a monotonic trend acrossthe three periods, this would indicate that thechange in mesh size was effective. But if the CPUEpattern was high, low, and low, it would suggestthat decreasing fish abundance was mainly re-sponsible for the decrease in by-catch in the second

EXPERIMENTAL DESIGN FOR FISHERIES MANAGEMENT
period and that the change in mesh size was notvery important.
Lack of RandomizationRandomization is critical when there is poten-
tial bias in selecting replicates for experimentationfrom a population of potential replicates and inassigning different treatments to experimental units(Hurlbert 1984; Green 1987). Because of the manyconstraints on applying experimental designs infisheries management, randomization is rarelypossible. The following example represents a caseof inadequate controls but also demonstrates howrandomization can be useful.
Example. —The experimental design of the large-scale Lake Enrichment Program for sockeye salm-on in British Columbia lacks proper controls be-cause response variables have not been monitoredin untreated (unfertilized) lakes to the same extentas in the 17 treated lakes (Hyatt and Stockner1985). Ideally, controls and treatments should havebeen randomly assigned to all lakes consideredsuitable for treatment to avoid bias that could un-duly influence the results. Lakes not chosen forenrichment may not serve as valid controls pre-cisely for the reasons they were not chosen in thefirst place. For example, currently untreated coast-al lakes that rear sockeye salmon generally arenonoligotrophic, much smaller than treated lakes,or fry-recruitment limited (K. Hyatt, Canada De-partment of Fisheries and Oceans, personal com-munication). Thus, rearing conditions may differsignificantly between treated and untreated lakes,and the untreated lakes might be unsuitable ascontrols for statistical tests of the effects of lakeenrichment on biomass of adult sockeye salmon.Given various assumptions, empirically basedsimulation modeling could be used to evaluate theeconomic value and information payoffs of ran-domization of treatments and controls and valueof a monitoring program in more sockeye salmonrearing lakes.
Incomplete Measurement of ResponsesIn fisheries research and management, the re-
sponse variables that are monitored are sometimeseither uninformative or monitored inadequately(Walters 1986). Attributes of a good biological re-sponse variable include (1) linkage to the questionsand hypothesis tested, (2) relevance to regulationsand management as well as sensitivity to them,(3) economic value, (4) tendency to change in someconsistent manner with respect to the type and
level of treatment, and (5) ability to be estimatedfrom sampling that is quick, precise, and minimalin cost. The choice of response variables and thespatial and temporal pattern in which they aremeasured also affect the probability of an exper-iment correctly detecting a response (Peterman1990).
Example 7.—To determine whether hatcheriesare effective, Foerster (1938) estimated egg-to-smolt survival rates for artificially and naturallyproduced sockeye salmon at Cultus Lake, BritishColumbia. However, because the ultimate goal ofhatcheries is to produce adult sockeye salmon,measurement of egg-to-smolt survival rates mayhave been insufficient. Egg-to-adult survival rateswould have been the appropriate response vari-able because density-dependent responses aftersmolts left the lake could have occurred, therebydecreasing the benefits from the hatchery (Peter-man 1987, 1991; Guthrie and Peterman 1988).An even better design would have involved mea-surement of both survival rates to create a higher-power test.
Example 2. — In the British Columbia Lake En-richment Program, scientists have not consistentlymeasured primary and secondary production,sockeye salmon smolt sizes, and adult returns inall 17 lakes that were fertilized (Hyatt and Stock-ner 1985). Trophic responses and smolt sizes ingeographically remote lakes are monitored less fre-quently than in more accessible ones, yet processesof cultural eutrophication could depend on acces-sibility. Thus, researchers may not be obtaining arepresentative picture of the effects of lake enrich-ment. Moreover, emphasis has been on the mostreadily measured responses—primary and second-ary production and sizes of smolts (Hyatt andStockner 1985). These responses provide only in-direct evidence for the effect of lake enrichmenton biomass of adult returns.
Monitoring of adult returns in a larger numberof treated lakes and also in untreated control lakescould improve the scientific basis for lake enrich-ment. Currently, adult returns are monitored inonly four treated lakes because of mixed-stockfisheries, remote location of spawning sites, andpoor documentation of procedures to generate his-torical escapement estimates (Hyatt and Stockner1985). With errors as large as 25% in estimatedabundance (Hyatt and Stockner 1985) and largeinterannual variability in returns, it may take manyyears to detect possible responses in the abundanceof the returns, as was found in Alien's (1980) whaleexample (see below). The potential net economic

10 Mt ALLISTER AND PETERMAN
value of these additional monitoring efforts couldbe evaluated through quantitative analysis to de-termine if they are worth pursuing.
Low Statistical PowerExample,—White (1988) found that Foerster's
(1938) Cultus Lake hatchery investigation had lowstatistical power (i.e., low probability of rejectingthe null hypothesis of no difference between fresh-water survival rates of hatchery and wild fish).Although Foerster (1938) failed to find a signifi-cant difference in survival rates, the low power ofhis experimental design meant that he had at leasta 64% chance of making a type II error, if in factthe mean observed survival rates reflected the truevalues. Statistical power analysis was not knownin Foerster's time, and it remains unclear whetherartificial propagation significantly improved egg-to-smolt survival rates of sockeye salmon at Cul-tus Lake. The potentially high cost of a type IIerror is therefore possibly important; British Co-lumbia may have forgone economic benefits ofhatchery propagation of sockeye salmon for manyyears. The power of the test could have been im-proved by increasing the duration of the study andthe number of hatchery sites employed. This ex-ample shows that in the absence of other criteria,unless the power of an experiment is expected tobe high, experimentation may not be worthwhile.
54° 40'
58-CLOSED(MORESBY GULLY]
51° 39'
BRITISH
COLUMBIA
SB-QUOTA FISHING51° 15' (MITCHELL GULLY)
5A-FREE FISHING(GOOSE ISLAND GULLY)'
50° 30'
3D-OUOTA FISHING
49<> 30'
3C-FREE FISHING
47° 20'U.S.A.
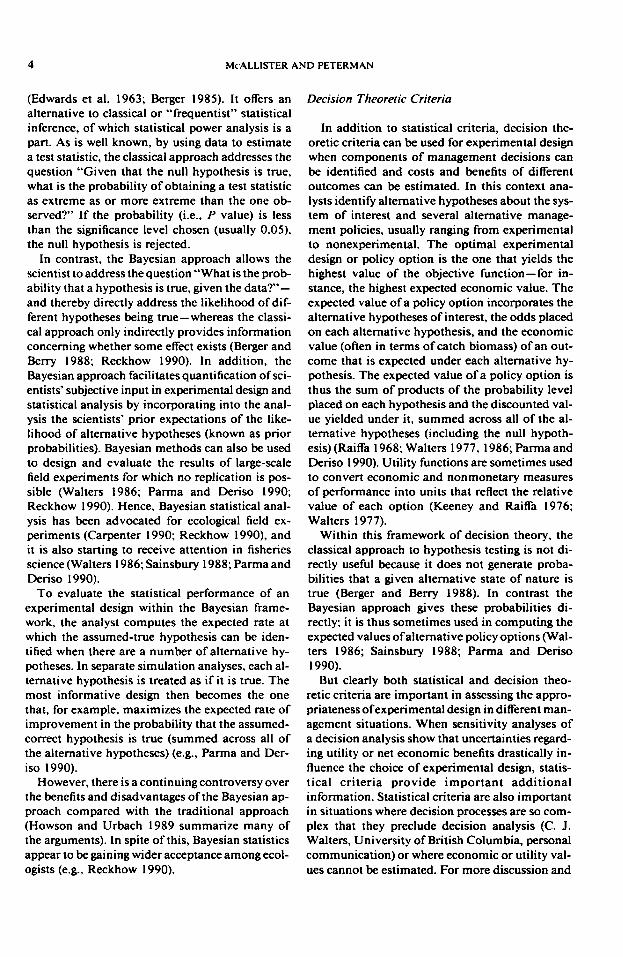
FIGURE 1.—Proposed arrangements of closed, unre-stricted, and quota fishing areas for a slope rockfish ex-perimental management program off the British Colum-bia coast (redrawn from Walters and Collie 1989). Areas5E, 5B, etc., are statistical areas used by the CanadianDepartment of Fisheries and Oceans.
Examples of Better ExperimentalManagement Designs
This section contains examples of managementprograms that address some of the experimentaldesign problems described above. Again, these arenot ideal experimental designs, but at least theyhelp improve our knowledge of managed fish pop-ulations by eliminating some of the possible con-founding interpretations.
Designs That Include InterspersionExample.—Wallers and Collie (1989) used in-
terspersion in their proposed experimental harveststrategy for Pacific ocean perch in Canada. To ob-tain better estimates of stock sizes and MSYs, fish-ermen agreed in principle to three types of exper-imental fishing zones: unrestricted, quota, and nofishing (Figure 1). In the proposed design, thesethree different treatments are interspersed acrossseven fishing zones from north to south, each ofwhich contains a distinct substock and is identifiedas an experimental unit. The one zone chosen forno fishing is bordered by two chosen for quota
fishing to buffer the effects of unrestricted fishingin other areas and to simplify enforcement of theclosure. The interspersion may help to distinguishdifferences in responses to quota and unrestrictedfishing from latitudinal gradients that may existin productivity and stock abundance. The arrange-ment also permits pairwise comparisons betweenadjacent quota and unrestricted fishing areas (Wal-ters and Collie 1989).
Designs That Include RandomizationExample. — Bergh et al. (1990) evaluated two
potential trawl gear experiments designed to testfor an effect on catch value per hour of towingdifferent types of trawl cod ends (diamond-meshand knotless square-mesh nets with different meshsizes). One experiment involved randomly assign-ing a single type of cod end to each vessel for eachtrip. The other involved a randomized block de-sign in which each vessel was to use all types ofcod ends during each fishing trip. In a completerandomized block, all types of cod ends would be

EXPERIMENTAL DESIGN FOR FISHERIES MANAGEMENT 11
used in a series of successive tows. The order ofuse of these cod ends would be chosen randomly—that is, if there were four types of cod ends, thefirst three would be picked randomly without re-placement, and the fourth would be dictated bythe type not picked in the first three randomchoices. Randomization, which occurred after thesite and target species were chosen, prevented bias,for example, in the order of the choice of net typeswith respect to each site and species. Furthermore,the randomized block design required between 10and 25% of the number of trips that the unblockedexperimental design required to yield acceptablyhigh statistical power in tests for the effect of geartype on catch value. The randomized block designhas already been executed and has provided high-er-power tests of hypotheses than originally ex-pected (E. Pikitch, University of Washington, per-sonal communication). The results could beinstrumental in the redesign of mesh-size regula-tions for the demersal fishery along the Oregonand Washington coast.
Designs That Include Statistical Power AnalysisExample /. —Peterman and Routledge (1983)
showed that evaluating statistical power is essen-tial to distinguish experimental designs that willyield valuable information from those that willnot. Managers of Oregon coho salmon were un-certain whether the relationship between abun-dance of adult hatchery-produced coho salmonand abundance of smolts released by hatcheries islinear or shows density dependence. This is be-cause marine survival rates are highly variable andsmolt abundances vary over a relatively narrowrange. Experimental management options includ-ed repeated releases of moderate or large numbersof coho smolts over varying periods. Petermanand Routledge (1983) showed that both the num-ber of smolts released per year and the durationof the experiment critically affected the ability ofan experiment to indicate whether survival ratesof coho salmon in the ocean are density dependent.These estimations of power of alternative designsprovide useful information to managers in theirchoices among alternatives where experiments andtype II errors are very costly. For example, if ma-rine survival rate is density dependent but man-agers assume density independence, releases oflarge numbers of smolts may generate low if notnegative net economic benefits because costs in-crease with smolt releases (Peterman 1989, 1991).
Example 2.— Statistical power is also used toevaluate experiments to estimate trends in stock
abundance and optimal harvest rate (Alien 1980;Gerrodette 1987; Peterman and Bradford 1987;Peterman 1990). Alien (1980) suggested that man-agers may learn most about optimal harvest ratesof whale populations by harvesting different pop-ulations at different rates and observing responses.He evaluated whether this strategy was practicalby estimating the lime that would elapse beforethe rate of decrease in whale abundance would besignificantly different from zero. Estimations weremade with different a levels and levels of impre-cision in the method of estimating whale abun-dance. Alien found that the magnitude of deple-tion in whale abundance that occurred before asignificant decrease in abundance could be de-tected increased with a lower a level, a higher rateof decrease in abundance, and more imprecisionin abundance estimates. In one example with alow a level (0.05), high rates of change per year(20%), and high imprecision (coefficient of vari-ation, 30%), whale populations would be depletedseverely (down to 26% of initial levels) before asignificant decrease could be detected with greaterthan 80% probability (after 7 years). Alien (1980)emphasized the need to (1) carefully design man-agement experiments to have high probability ofproducing useful results, (2) decide in advance theacceptable level of accuracy that would be soughtin the results, and (3) estimate abundance in a waythat minimizes the coefficient of variation.
Designs That Control for Temporal andSpatial Variability
In the following five examples, the cited authorshave proposed harvest strategies designed to gen-erate informative contrasts in the data, control forspatial variability and effects of concurrent envi-ronmental changes, and provide fail-safe plans incase of overfishing.
Example /.—As noted above, the purpose ofWalters and Collie's (1989) proposed experimen-tal harvest strategy for Pacific ocean perch is tobetter estimate stock sizes and MSYs by estab-lishing informative contrasts in the fishing effort.Survey schemes were proposed to monitor re-sponses of each of the seven substocks in the rep-licated areas designated for unregulated harvest,quota management, and complete closure of fish-ing (Figure 1). Contingency plans were proposedto detect and respond to collapse of stocks in theunregulated zones.
Example 2.—In response to the uncertaintyabout the stock dynamics of whale species, somemanagers in the 1970s advocated a temporary

12 Me ALLISTER AND PETERMAN
moratorium on harvest. However, Holt (1977) ar-gued that little will be learned about sustainableyields from whale stocks unless attempts are madeto significantly change stock abundances. Thus,Holt (1977) proposed an experimental harvest re-gime in which different stocks of a whale specieswould be subject to differing quotas set by opti-mistic and pessimistic estimates of the state andproductivity of the stocks. These quotas would bemaintained for several years so that responses tothem could be monitored. Stocks with smallamounts of overlap in habitat were suggested forthis experiment so that any stocks that sufferedcollapse could recover by gradual immigrationfrom uncollapsed stocks.
Example 3.— Tyler et al. (1982) proposed twodifferent experimental fishing regimes for multi-species fisheries. In the first, the objective was tofind the highest sustainable effort or catch levelthat would maintain the viability of all species ineach multispecies assemblage. The managed com-munities would consist of a group of similar yetspatially distinct assemblages of ecologically in-terdependent species. A replicate would consist ofan individual assemblage. The management planwould explore a range of constant effort levels fromzero to levels thought to exceed MSY. The mix ofthe catch would be set by fishermen and processorsand would remain constant within different as-semblages and over time. Areas with zero effortwould serve as refugia so that migrants from themcould replenish areas subject to high efforts in caseof depletion.
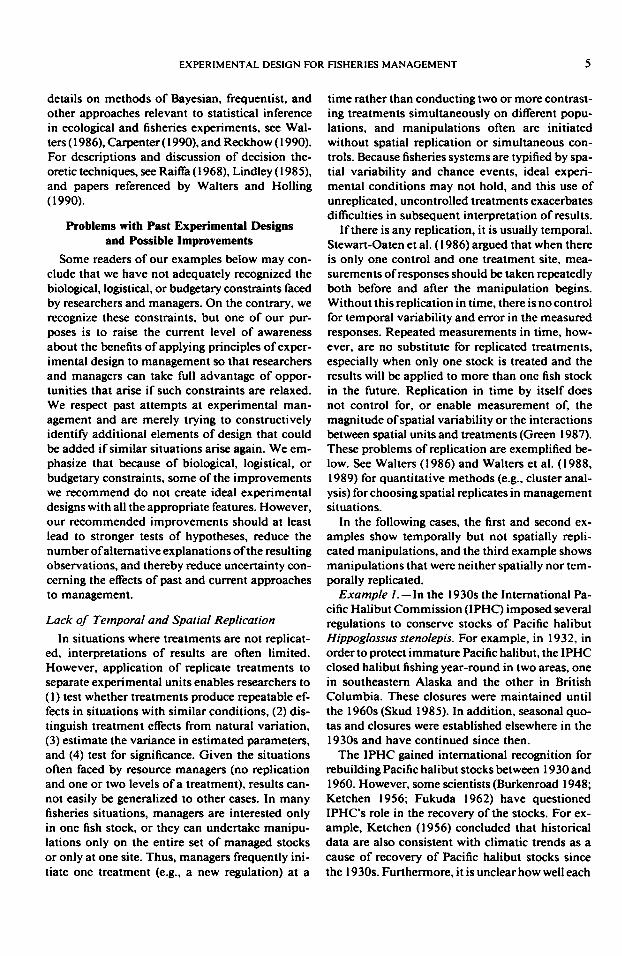
Example 4.— The objective of the second re-gime of Tyler et al. (1982) was to find out howmuch an assemblage can be perturbed and still beable to recover its original community structure.The plan called for perturbation of one of threegroups of assemblages at a time for 2 years. Dif-ferent harvest efforts (some at zero for safety) wouldbe applied to the assemblages in one group. After2 years, the next group would be fished for 2 yearsand the first group would not be fished for 4 yearsto permit an observable recovery. Thus, each groupwould be fished for 2 years at a time then not fishedfor 4 years, and this pattern would be repeated(Figure 2). Research cruises would monitor changesin structure of the assemblage. Effort levels thatthreatened the presence of some key species in theassemblage would be reduced. Light effort levelswould be increased toward intermediate levels thatdid not preclude recovery of assemblage species.
One problem common to the four examplesabove is that migration between units would vi-
ASSEMBLAGE OF REGULARSGROUP 1GROUP 2GROUP 3
1 1A P U S
1 1
2-YR PULSE EFFORT LEVEL
UPDATE
YESFIGURE 2.—Schematic for experimental or adaptive
management of multispecies assemblages in transitionstates (redrawn from Tyler et al. 1982). APUs = assem-blage production units.
olate their statistical independence (see below) andhence reduce the power of the experiments to de-tect the true response. This deficiency must beweighed against the benefit of having a fail-safesource of fish if the target stock is unexpectedlydepleted.
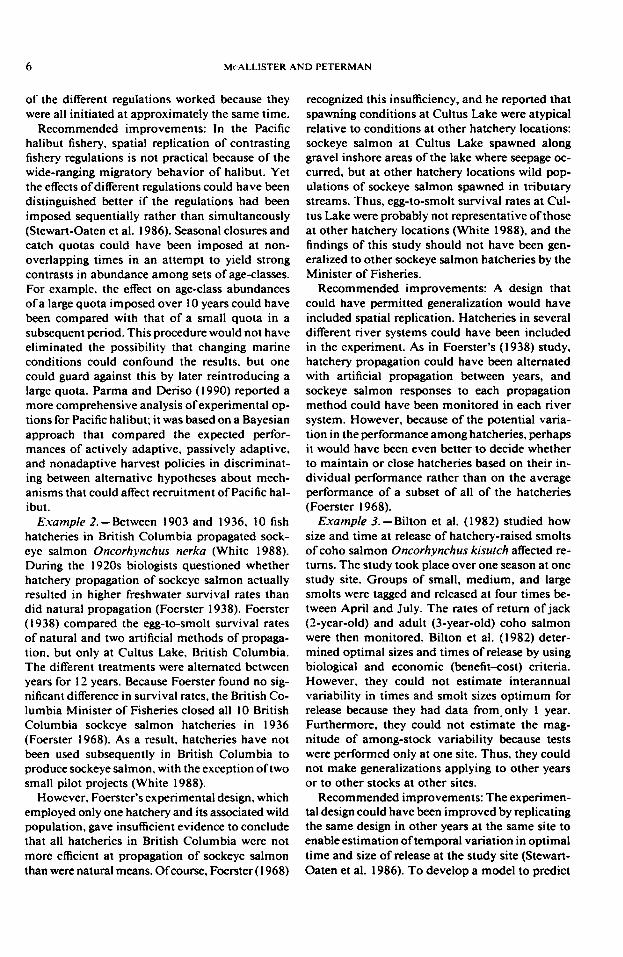
Example 5.—Sainsbury (1988) outlined an ex-perimental harvest strategy in a multispecies fish-ery on Australia's west coast. Considerable un-certainty existed about the ecological dynamics ofthe fishery, which involved four major demersalspecies, and about the harvest methods and in-tensity that could maximize economic yield. Ex-tensive simulation modeling based on a Bayesianapproach, plus consultation among scientists,managers, and fishermen, resulted in an experi-mental design in which two adjacent areas havebeen closed to trawl fishing for 5 years each, onestarting in 1985 and the other in 1987. At the endof the closure, trap fisheries will be initiated for 5years in each of the two areas (Figure 3). In twoadditional areas trawling has been maintained. Theresulting design, which has spatially and tempo-rally replicated contrasting treatments (two areaswith trawling and two with trap fishing), shouldenable estimation of spatial and temporal vari-ability in the responses to the management actions(Walters et al. 1988). However, the design doesnot control for spatial gradients in the propertiesof the spatial units because it does not interspersetreatments spatially (Figure 3) (see section aboveon interspersion).
Example 6. —In contrast to the above proposalsfor adaptive probing, the following experiment isproposed to test a specific hypothesis rigorously.Mean adult body weight has declined in most Brit-ish Columbia pink salmon stocks in the past few

EXPERIMENTAL DESIGN FOR FISHERIES MANAGEMENT 13
AREA CLOSED TO TRAWLINGIN 1987 AND OPEN TOTRAP FISHING IN 1992
116
AREAS REMAININGOPEN TO TRAWLING
AREA CLOSED TOTRAWLING IN 1985AND OPEN TO TRAPFISHING IN 1990
"\ 117°
FIGURE 3.—Spatial and temporal arrangement oftrawling, closed, and trap-fishing areas in the experi-mental demersal fishery of the northwest coast of Aus-tralia (redrawn from Sainsbury 1988).
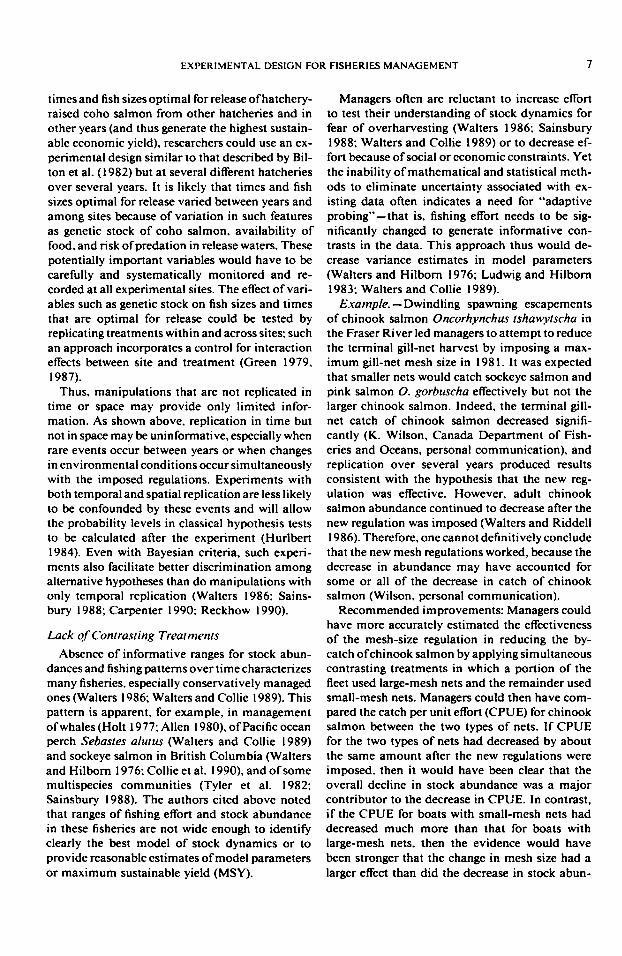
decades (Figure 4; Ricker et al. 1978). Ricker etal. (1978) hypothesized that these trends have re-sulted from size-selective fishing gear. Gill netsand troll gear catch larger-than-average individ-uals and allow smaller individuals to escape (Rick-er et al. 1978). If growth rate is heritable (Falconer1981), as has been shown for other teleosts (Roff1984) and for pink salmon reared under artificialconditions (Beacham and Murray 1988), the trendin body size may be an evolutionary response torepeated size-selective removal of larger-than-av-erage fish by fishing gear. However, Ricker et al.(1978) did not exclude density-dependent oroceanographic explanations for the observedchange in mean adult weight (Healey 1986). Man-
2.4 i
2.0-
1.6 -
1.2 •
r2= 0.52, P < 0.0005
1950 1960 1970YEAR
1980 1990
FIGURE 4.—The decrease in mean adult body weightfor even-year pink salmon in statistical area 6 off thecentral British Columbia coast (from McAllister 1990).
Odd years1 3 5 7
10
£ 20 *-
o"5 3Q_to
4
it f* selective fishing
" T • "I' ""•.WR'j
| nonselective fishing]
:*' . £ '••:
•fm-f*«r«,i£
• <:* av ;:;* «;.?•
10<D*- 9o ^0
=5 3Q_
(/>
4
Even years2 4 6 8 10
•V. •: ' 1:1;
f*' ||
••: ;f "1|
f- •if
ll ;*':|:1* '51
Illl'
if'FIGURE 5.—An experimental harvest strategy to test
the gear selectivity hypothesis for British Columbia pinksalmon (from McAllister 1990). The fixed 2-year lifecycle of pink salmon permits odd- and even-year pop-ulations to be treated as separate experimental units.
agers could rigorously test this gear selectivity hy-pothesis by conducting size-selective fishing withgill-net gear and nonselective fishing with seinegear in areas having separate stocks of pink salmon(Figure 5) (McAllister 1990). The trends in meanweight would be monitored in these areas. By ap-plying different treatments simultaneously amongthe fishery areas, managers may be able to distin-guish possible gear effects from environmental ef-fects. Environmental effects would be present inboth selectively and nonselectively fished areas,whereas gear effects would be present only in se-lectively fished areas. Furthermore, replication oftreatments would enable managers to compute thevariance and probability level of the estimate ofheritability of body size (McAllister 1990).
Staircase Design to Deal with Time-TreatmentInteractions
Example.—In some situations managers areprevented from distinguishing possible effects oftheir actions because of possible time-treatmentinteractions (Walters et al. 1988, 1989). Treatedunits may respond differently than untreated unitsto environmental changes. In British Columbia

14 Me ALLISTER AND PETERMAN
and Washington, several hatcheries began pro-duction of chinook and coho salmon over a decadeago. Results from coded wire tag surveys haveshown substantial declines in survival rates ofhatchery-produced but not of wild chinook andcoho salmon (Walters and Riddell 1986). Accord-ing to one hypothesis, hatchery declines representa transient response (whose magnitude changeswith time) in which high initial successes are fol-lowed by moderate sustainable production afteradjustment to diseases, predation, and other lim-iting factors (Walters et al. 1988). However, de-clines have coincided with a warming trend inocean temperatures (Walters et al. 1988). So, ac-cording to another hypothesis, hatchery-producedand wild fish are affected differently by transientenvironmental effects (e.g., hatchery-produced fishmay be more sensitive than wild fish to a warmingtrend, perhaps because of differences in growthrates of hatchery and wild fish), and productionlevels will increase once the trend reverses (Wal-ters et al. 1988).
To control for such time-treatment interactions,Walters et al. (1988) developed the staircase designin which treatments are initiated sequentially inseparate experimental units. Monitoring wouldtake place before initiation of treatments to detecttime trends and variability in the properties to bemeasured that might be unique to each experi-mental unit. (However, it is questionable whethersuch time trends could be correctly assumed tocontinue during the experiment.) Treatment of thesecond experimental unit would begin 2 years afterthe first, for example. Treatment of the third unitwould begin 3 years after the second, and so on(Figure 6). Designs can include relatively few con-trol areas and widely spread starting times fortreatments (Walters et al. 1988).
Designs in which treatments all start at the sametime do not enable researchers to distinguish be-tween transient responses to treatments and time-treatment interactions. In contrast, in a staircasedesign the transient responses that result from themanagement action (e.g., relaxation of selectionfor competitive ability in hatcheries) will occur atthe same length of time after initiation in eachexperimental unit and, because the times of ini-tiation of treatments are sequential, transient re-sponses will not all occur in the same calendaryear. On the other hand, time-treatment interac-tions that affect treated units independently of thetime of initiation (e.g., oceanographic effects onsurvival rate) will show effects in the same yearacross all treated units and will not be apparent
YEAR3 4 5 6 7 8 9 10
°20
13
FIGURE 6.—An example of temporal and spatial ar-rangement of treatments in a staircase experimental de-sign (redrawn from Walters et al. 1988). Shaded boxesshow treated time-area combinations. Clear boxes shownontreated time-area combinations.
in control units (Figure 6). Time-treatment inter-actions that affect treated units only at certain pe-riods after initiation can also be distinguished: theseresponses will appear only in units in which treat-ments are initiated at the same time; they will notappear in other units in which treatments are start-ed at other times. Replication at each time of ini-tiation will be required to distinguish these inter-action effects from possible trends unique to eachexperimental unit.
Evidence from Decision Analyses ThatInclude Uncertainty
The most convincing arguments in favor of tak-ing an experimental approach to fisheries man-agement come from case studies where researchersevaluated economic benefits of a variety of man-agement options, including status quo and exper-imental strategies. The most sophisticated of theanalyses include (1) various biological uncertain-ties in the form of alternative hypotheses aboutthe true production dynamics, weighted by theirprobabilities of occurrence; (2) several manage-ment options, some of which help discriminatebetween alternative biological hypotheses; and (3)analyses of the decision options across these hy-potheses (e.g., Walters and Hilborn 1976; Walters1977; Sainsbury 1988; McAllister 1990; Parmaand Deriso 1990; Welch and Noakes 1990). Forexample, Sainsbury (1988) calculated that, giventhe uncertainty about the extent of interactionamong species in the northwestern Australiangroundfish community, an experimental fishingstrategy (Figure 3) is likely to generate as much as1.99 times the current value of the fishery. Thisresult depends on the duration of the experimentaltrial and the assumed-true biological situation.Also, this experimental fishing strategy has a high-er probability of enabling discrimination between
EXPERIMENTAL DESIGN FOR FISHERIES MANAGEMENT 15
alternative ecological models and their parametersthan do other possible management policies. Sim-ilarly, McAllister (1990) estimated through exten-sive modeling and sensitivity analyses that a block-designed fishing experiment on pink salmon inBritish Columbia (Figure 5) has a high probabilityof detecting significant heritability in salmon bodyweight, which in combination with size-selectivefishing might be the cause of the large decrease inbody weight offish. This experiment can also gen-erate as much as a 45% increase in present eco-nomic value of the catch. Finally, Welch andNoakes (1990) showed that, regardless of the un-certainty concerning the degree of interactionamong year-classes of Adams River sockeye salm-on in British Columbia, an experiment with equalescapement targets each year (as opposed to thecurrent wide range of escapement targets in eachgroup of 4 years) could increase the net presentvalue of the fishery by between Can$675 millionand $3 billion, depending on the true degree ofinteraction among year-classes. These examplessuggest the enormous potential economic benefitsof experimental management.
Applicability of Experimental DesignMost fisheries situations are amenable to some
form of experimental design. Even when there isa large unit stock (e.g., Pacific halibut), temporalreplication and interspersion of large and smallquotas, for example, could help managers discrim-inate more effectively among alternative hypoth-eses about productivity, compared with constantharvest rate policies (Parma and Deriso 1990).However, more features of good experimental de-sign can be employed as the number of statisticallyindependent units available for experimentationincreases. This is especially true where noninter-acting fish populations occur in separate ponds,lakes, or rivers. Replication of treatments and hencebetter designs can also be achieved in studies onunit stocks or assemblages of species when theresponse variables of interest relate to the opera-tion of the fishing fleet (e.g., fishermen behavior,gear design, and gear effectiveness), instead of tothe basic population biology of a stock or assem-blage (Pikitch 1988; Bergh et al. 1990).
Constraints on Experimental ManagementApplying an experimental approach to manage-
ment, however, is not without severe constraints.For example, an experimental harvest strategy be-comes less acceptable as it decreases fishing effort,increases inconvenience to fishermen, or leads to
significant displacement of fishermen from theirtraditional fishing grounds or from the fishery al-together. In contrast, a strategy that permits tem-porarily increased fishing effort to test for a highersustainable yield than previously estimated maybe readily accepted because of the potential short-term gains for industry. If an experiment is to bemade acceptable to fishermen, the expected pay-offs from experimentation must be apparent tothem. Under some circumstances, managers maymake experimental harvest plans acceptable tofishermen by providing some form of compensa-tion (Tyler et al. 1982) or by showing them thatthe experiment is in their best interest (e.g., theBritish Columbia groundfish fleet was willing toincrease costs of monitoring because they believedthat the experiment would lead to increased quo-tas) (Walters and Collie 1989). Experimental re-gimes with high fishing effort on some replicatestocks and low effort on others (Holt 1977) couldgenerate useful contrasts in data while at the sametime satisfying widely different positions taken bythose favoring a moratorium on harvest and thosefavoring unrestrained effort.
The acceptability and chance of success of anexperimental harvest strategy clearly depend onthe cooperation of fishermen. A strategy may havethe largest expected payoff over other alternativesyet may be opposed by skeptical fishermen. Fish-ermen may find experimentation more agreeable(1) if they have experienced significant declines instock abundance, (2) if they engage in debate withmanagers over stock abundance and the appro-priate level of fishing effort, or (3) if managersactively seek cooperation with them, admit to un-certainty, and inform them of management ra-tionale (Pringle 1985; Peyton 1987; Walters andCollie 1989). The experimental idea is novel tomost fisheries and may gain acceptance only ifintroduced on a small scale or with a set of smallstocks (Tyler et al. 1982; Bergh et al. 1990).
ConclusionsThis review of various management situations
demonstrates that proper experimental design andgood statistical practice are important means togenerate information essential for improved man-agement of fisheries. With a rigorous experimentalapproach, managers can learn whether stocks arebeing overharvested or underharvested, whetherregulations are having desired effects, and how tomodify harvest regimes as a result of improvedinformation (Smith and Walters 1981; Walters1986; Sainsbury 1988; Peterman 1990). Reduc-
16 Me ALLISTER AND PETERMAN
tion of uncertainty about biological processes willalso reduce controversy ove$ conditions of ex-ploited stocks and effectiveness of methods of stockenhancement or management.
It is unlikely that a perfect experimental designwill ever be feasible in fisheries management, giv-en all of the real-world constraints, so analystsmust explicitly identify trade-offs among alter-native designs. They should examine two or moreexperimental designs (with different numbers ofreplicate stocks or different periods of treatment,for instance) and quantify several measures foreach design, including (I) the probability of cor-rectly discriminating between the alternative bi-ological models that are behind key areas of un-certainty. (2) the expected economic value of thatdesign, and (3) risks. Such quantitative simulationanalyses of alternative experimental designs (e.g.,Sainsbury 1988; McAllister 1990) will permitmanagers to make informed choices of experi-mental management options.
Despite the constraints noted in the previoussection, there is growing interest in the applicationof experimental design in fisheries management.The experimental designs of Sainsbury (1988),Walters and Collie (1989), and Bergh et al. (1990)for demersal fisheries demonstrate that fishermen,as well as managers, are willing to cooperate. Also,the gap between theory and practice could soonnarrow; for example, managers of Fraser Riversockeye salmon in British Columbia (Collie et al.1990) and members of the Northwest Power Plan-ning Council in Portland, Oregon, who are at-tempting to rehabilitate Columbia River basinsalmonids (Lee and Lawrence 1986; Orians 1986)recently have expressed interest in experimentalmanagement. Programs that combine good ex-perimental design with comprehensive, quantita-tive assessments of biological uncertainties, policyoptions, and potentials for learning will undoubt-edly uncover many other situations in which man-agers and the fishing industry are likely to benefitfrom experimental management. We hope this re-view will stimulate more genuine interest in ex-perimental management and help erode existingbarriers to its implementation.
AcknowledgmentsWe are grateful to Kirn D. Hyatt, Michael A.
Henderson, and Ken Wilson for information con-cerning various fisheries. We thank Jeremy Collie,Robert Crittenden, Scott Forbes, Michael Hen-derson, Michael Lapointe, Richard Lockhart, Mi-
chael Link, Shane Frederick, Ray Hilborn, CarlWalters, and an associate editor of this journal fortheir helpful comments.
ReferencesAlien, K. R. 1980. Conservation and management of
whales. University of Washington Press, Seattle.Beacham, T. D., and C. B. Murray. 1988. A genetic
analysis of body size in pink salmon (Oncorhynchusgorbuscha). Genome 30:31-35.
Berger, J. O. 1985. Statistical decision theory andBayesian analysis. Springer-Verlag, New York.
Berger, J. O.,andD.A. Berry. 1988. Statistical analysisand the illusion of objectivity. American Scientist76:159-165.
Bergh, M. O., E. K. Pikitch, J. R. Skalski, and J. R.Wallace. 1990. Statistical design of comparativefishing experiments. Fisheries Research 9:143-163.
Bilton. H. T., D. F. Alderdice, and J. T. Schnute. 1982.Influence of time and size at release of juvenile cohosalmon (Oncorhynchus kisutch) on returns at ma-turity. Canadian Journal of Fisheries and AquaticSciences 39:426-427.
Buckley, R. M. 1989. Habitat alterations as a basis forenhancing marine fisheries. California CooperativeOceanic Fisheries Investigations Reports 30:40-45.
Burkenroad, M. D. 1948. Fluctuations in abundanceof Pacific halibut. Bulletin of the Bingham Ocean-ography Collection, Yale University 11(4):81-129.
Carpenter, S. R. 1990. Large-scale perturbations: op-portunities for innovation. Ecology 71:2038-2043.
Cohen, J. 1988. Statistical power analysis for the be-havioral sciences, 2nd edition. L. Erlbaum Associ-ates. Hillsdale, New Jersey.
Colby, P. J., P. A. Ryan, D. H. Schupp, and S. L. Serns.1987. Interactions in north-temperate lake fishcommunities. Canadian Journal of Fisheries andAquatic Sciences 44(supplement 2): 104-128.
Collie, J. S., R. M. Peterman, and C. J. Walters. 1990.Experimental harvest policies for a mixed stock fish-ery: Fraser River sockeye salmon (Oncorhynchusnerka). Canadian Journal of Fisheries and AquaticSciences 47:145-155.
Dixon, W. J., and F. J. Massey, Jr. 1969. Introductionto statistical analysis, 3rd edition. McGraw-Hill, NewYork.
Edwards, W., H. Lindman, and L. J. Savage. 1963.Bayesian statistical inference for psychological re-search. Psychological Review 70:193-242.
Falconer, D. S. 1981. Introduction to quantitative ge-netics, 2nd edition. Longman, New York.
Foerster, R. E. 1938. An investigation of the relativeefficiencies for natural and artificial propagation ofsockeye salmon (Oncorhychus nerka). Journal of theFisheries Research Board of Canada 4:151-161.
Foerster, R. E. 1968. Sockeye salmon (Oncorhynchusnerka). Fisheries Research Board of Canada Bulletin162:1^22.
Fukuda, Y. 1962. On the stocks of halibut and theirfisheries in the northeastern Pacific. Bulletin of the

EXPERIMENTAL DESIGN FOR FISHERIES MANAGEMENT 17
International North Pacific Fisheries Commission7:39-50.
Gerrodette, T. 1987. A power analysis for detectingtrends. Ecology 68:1364-1372.
Glantz, M. H., and J. D. Thompson, editors. 1981.Resource management and environmental uncer-tainty: lessons from coastal upwelling fisheries. Wi-ley. New York.
Green, R. H. 1979. Sampling design and statisticalmethods for environmental biologists. Wiley, NewYork.
Green, R. H. 1984. Statistical and nonstatistical con-siderations for environmental monitoring studies.Environmental Monitoring and Assessment 4:293-301.
Green, R. H. 1987. Statistical and mathematical as-pects: distinction between natural and induced vari-ation. Pages 335-354 in V. B. Vouk, G. C. Butler,A. C. Upton, D. V. Parke, and S. L. Asher, editors.Methods for assessing the effects of mixtures ofchemicals. Wiley, Chichester, UK.
Green, R. H. 1989. Power analysis and practical strat-egies for environmental monitoring. EnvironmentalResearch 50:195-205.
Guthrie, I. C, and R. M. Peterman. 1988. Economicevaluation of lake enrichment strategies for BritishColumbia sockeye salmon. North American Journalof Fisheries Management 8:442-454.
Healey, M. C. 1986. Optimum size and age at maturityin Pacific salmon and effects of size-selective fish-eries. Canadian Special Publication of Fisheries andAquatic Sciences 89:39-52.
Moiling, C. S., editor. 1978. Adaptive environmentalassessment and management. Wiley, Chichester, UK.
Holt, R. S., T. Gerrodette, and J. B. Cologne. 1987.Research vessel survey design for monitoring dol-phin abundance in the eastern tropical Pacific. U.S.National Marine Fisheries Service Fisheries Bulletin85:435-^46.
Holt, S. J. 1977. Whale management policy. Report ofthe International Whaling Commission 27:133-137.
Howson,C.,andP. Urbach. 1989. Scientific reasoning:the Bayesian approach. Open Court, La Salle, Illi-nois.
Hurlbert,S. H. 1984. Pseudoreplication and the designof ecological field experiments. Ecological Mono-graphs 54:184-211.
Hyatt, K. D., and J. E. Stockner. 1985. Responses ofsockeye salmon (Oncorhynchus nerka) to fertiliza-tion of British Columbia lakes. Canadian Journalof Fisheries and Aquatic Sciences 42:320-331.
Keeney, R. L., and H. Raiffa. 1976. Decisions withmultiple objectives. Wiley, New York.
Ketchen, K. S. 1956. Climatic trends and fluctuationsin yield of marine fishes in the northeast Pacific.Journal of the Fisheries Research Board of Canada13:357-374.
Larkin, P. A. 1972. A confidential memorandum onfisheries science. Pages 189-197 in B. J. Rothschild,editor. World fisheries policy: multi-disciplinaryviews. University of Washington Press, Seattle.
LeBrasseur, R. J., and six coauthors. 1978. Enhance-
ment of sockeye salmon (Oncorhynchus nerka) bylake fertilization in Great Central Lake: summaryand report. Journal of the Fisheries Research Boardof Canada 35:1580-1596.
Lee. K. N., and J. Lawrence. 1986. Adaptive manage-ment: learning from the Columbia River Basin Fishand Wildlife Program. Environmental Law 16:431-460.
Lindley, D. V. 1985. Making decisions. Wiley, NewYork.
Loftus, K. H. 1976. Science for Canada's fisheries re-habilitation needs. Journal of the Fisheries ResearchBoard of Canada 33:1822-1857.
Ludwig, D., and R. Hilborn. 1983. Adaptive probingstrategies for age-structured fish stocks. CanadianJournal of Fisheries and Aquatic Sciences 40:559-569.
McAllister, M. 1990. Decision and power analyses oflarge-scale fishing experiments on British Columbiapink salmon (Oncorhynchus gorbuscha). Master'sthesis. Simon Fraser University, Burnaby, BritishColumbia. [Also see: McAllister et al. and McAllis-ter and Peterman. In press. Canadian Journal ofFisheries and Aquatic Sciences 49(7).)
Mercer, M. C., editor. 1982. Multispecies approachesto fisheries management advice. Canadian SpecialPublication of Fisheries and Aquatic Sciences 59.
Millard, S. D., and D. P. Lettenmaier. 1986. Optimaldesign of biological sampling programs using anal-ysis of variance. Estuarine, Coastal and Shelf Sci-ence 22:637-657.
Orians, G. H. 1986. The place of science in environ-mental problem solving. Environment 28:12-41.
Parma, A. M., and R. B. Deriso. 1990. Experimentalharvesting of cyclic stocks in the face of alternativerecruitment hypotheses. Canadian Journal of Fish-eries and Aquatic Sciences 47:595-610.
Pearson, E. S., and H. O. Hartley, editors. 1976. Bio-metrika tables for statisticians, volume 2. CharlesGriffin, High Wycombe, UK.
Peterman, R. M. 1987. Review of the components ofrecruitment of Pacific salmon. American FisheriesSociety Symposium 1:417-429.
Peterman, R. M. 1989. Application of statistical poweranalysis to the Oregon coho salmon (Oncorhynchuskisutch) problem. Canadian Journal of Fisheriesand Aquatic Sciences 46:1183-1187.
Peterman, R. M. 1990. Statistical power analysis canimprove fisheries research and management. Ca-nadian Journal of Fisheries and Aquatic Sciences47:2-15.
Peterman, R. M. 1991. Density-dependent marine pro-cesses in North Pacific salmonids: lessons for ex-perimental design of large-scale manipulations offish stocks. Pages 69-77 in S. Lockwood, editor. Theecology and management aspects of extensive aqua-culture. International Council for the Explorationof the Sea, Marine Science Symposium 192, Co-penhagen.
Peterman, R. M., and M. Bradford. 1987. Statisticalpower of trends in fish abundance. Canadian Journalof Fisheries and Aquatic Sciences 44:1879-1889.

18 MrALLISTER AND PETERMAN
Peterman, R. M., and R. D. Routledge. 1983. Exper-imental management of Oregon coho salmon: de-signing for yield of information. Canadian Journalof Fisheries and Aquatic Sciences 40:1212-1223.
Peyton, R. B. 1987. Mechanisms affecting public ac-ceptance of resource management policies and strat-egies. Canadian Journal of Fisheries and AquaticSciences 44:306-312.
Pikitch, E. K. 1988. Objectives for biologically andtechnically interrelated fisheries. Pages 107-136 inW. S. Wooster, editor. Fisheries science and man-agement: objectives and limitations. Springer-Ver-lag, New York.
Pringle, J. D. 1985. The human factor in resource man-agement. Canadian Journal of Fisheries and AquaticSciences 42:389-392.
Raiffa, H. 1968. Decision analysis. Introductory lec-tures on choices under uncertainty. Addison-Wes-ley. Reading, Massachusetts.
Reckhow, K. H. 1990. Bayesian inference in non-rep-licated ecological studies. Ecology 71:2053-2059.
Ricker, W. E., H. T. Bilton, and K. V. Aro. 1978. Caus-es of the decline in size of pink salmon (Oncorhyn-chus gorbuscha). Canada Fisheries and Marine Ser-vice Technical Report 820.
Roff, D. A. 1984. The evolution of life history param-eters in teleosts. Canadian Journal of Fisheries andAquatic Sciences 41:989-1000.
Sainsbury, K. J. 1988. The ecological basis of multispe-cies fisheries and management of a demersal fisheryin tropical Australia. Pages 349-382 in J. A. Gul-land, editor. Fish population dynamics, 2nd edition.Wiley, New York.
Silvert, W. 1978. Price of knowledge: fisheries man-agement as a research tool. Journal of the FisheriesResearch Board of Canada 35:208-212.
Skud, B. E. 1985. The history and evaluation of closureregulations in the Pacific halibut fishery. FAO (Foodand Agriculture Organization) Fisheries Report289(3):449-456.
Smith, A. D. M., and C. J. Walters. 1981. Adaptivemanagement of stock-recruitment systems. Cana-dian Journal of Fisheries and Aquatic Sciences 38:690-703.
Stewart-Oaten, A., W. W. Murdoch, and K. R. Parker.1986. Environmental impact assessment: "pseu-doreplication" in time? Ecology 64:929-940.
Toft, C. A., and P. J. Shea. 1983. Detecting commu-nity-wide patterns: estimating power strengthensstatistical inference. American Naturalist 122:618-625.
Tyler, A. V., W. L. Gabriel, and W. J. Overholtz. 1982.
Adaptive management based on structure of fishassemblages of northern shelves. Canadian SpecialPublication of Fisheries and Aquatic Sciences 59:149-156.
Vaughan, D. S., and W. Van Winkle. 1982. Correctedanalysis of the ability to detect reductions in year-class strength of the Hudson River white perch (Mo-rone americana) population. Canadian Journal ofFisheries and Aquatic Sciences 39:782-785.
Walters, C. J. 1977. Management under uncertainty.Pages 261-297 in D. V. Ellis, editor. Pacific salmonmanagement for people. University of Victoria Press,Victoria, British Columbia.
Walters, C. J. 1986. Adaptive management of renew-able resources. Macmillan, New York.
Walters, C. J., and J. S. Collie. 1989. An experimentalstrategy for groundfish management in the face oflarge uncertainty about stock size and production.Canadian Special Publication of Fisheries andAquatic Sciences 108:13-25.
Walters, C. J., J. S. Collie, and T. Webb. 1988. Ex-perimental design for estimating transient responsesto management disturbances. Canadian Journal ofFisheries and Aquatic Sciences 45:530-538.
Walters, C. J., J. S. Collie, and T. Webb. 1989. Ex-perimental design for estimating transient responsesto habitat alterations: is it practical to control forenvironmental interactions? Canadian Special Pub-lication of Fisheries and Aquatic Sciences 105:13-20.
Walters, C. J., and R. Hilborn. 1976. Adaptive controlof fishing systems. Journal of the Fisheries ResearchBoard of Canada 33:145-159.
Walters, C. J., and R. Hilborn. 1978. Ecological op-timization and adaptive management. Annual Re-view of Ecology and Systematics 9:157-188.
Walters, C. J., and C. S. Holling. 1990. Large-scalemanagement experiments and learning by doing.Ecology 71:2060-2068.
Walters, C. J., and B. Riddell. 1986. Multiple objec-tives in salmon management: the Chinook sport fish-ery in the Strait of Georgia, B.C. Northwest Envi-ronmental Journal 2:1-15.
Welch, D. W., and D. J. Noakes. 1990. Cyclic domi-nance and optimal escapement of Adams Riversockeye salmon (Oncorhynchus nerka). CanadianJournal of Fisheries and Aquatic Sciences 47:838-849.
White, B. A. 1988. Benefit-cost evaluation of sockeyesalmon (Oncorhynchus nerka) hatchery on the Nah-mint River, British Columbia. Master's thesis. SimonFraser University, Burnaby, British Columbia.