![) 2] ( and o+Xr)2 ) 2] - americanradiohistory.com...pedan e to the chara teristic imp dan of the line, and upon the typ of re-pon of the oltm ter, that i , peal reading, r-m- , or](https://static.fdocuments.us/doc/165x107/5ff837a10116786ea53eef8a/-2-and-oxr2-2-pedan-e-to-the-chara-teristic-imp-dan-of-the-line.jpg)
Jouna Acupuctu esearch - e-jar.org · impedan u .e h on go up h th go w n h an gh instan th am...
4
Background: Reduced impedance at acupuncture points (acupoints) is a well-known phenomenon; and the impedance has been found to reduce further in relation to organ stress. e author hypothesises that any changes to an organ’s state or function are communicated to its related acupoints in real time. As part of a research project to demonstrate this communication, the impedance of several acupoints was studied in real time. Methods: e acupoints were located electrically, and a 40 kHz signal was used to sample the impedances. Samples were taken at each acupoint and also at a 6 mm radius. e sample rate was 1 kHz and the session lasted for 5 minutes. e results presented here were taken from a single patient. Results: The impedance at an acupoint’s centre frequently changed in an inverse relationship to the impedance at a 6 mm radius (i.e. when one goes up, the other goes down) and the leſt and right instance of the same acupoint usually displayed different impedance features. Conclusion: When studying the fine detail of real-time impedance samples taken from the centre of an acupoint and also from a 6 mm radius, this previously unreported contrary-motion phenomenon provides a useful tool to differentiate between artefact and genuine organ-related features in an impedance trace. ©2018 Korean Acupuncture & Moxibustion Medicine Society. is is an open access article under the CC BY- NC-ND license (http://creativecommons.org/licenses/by-nc-nd/4.0/). Article history: Submitted: April 17, 2018 Revised: June 5, 2018 Accepted: June 15, 2018 Keywords: acupoints, acupuncture, communication, impedance https://doi.org/10.13045/jar.2018.00080 pISSN 2586-288X eISSN 2586-2898 J Acupunct Res 2018;35(3):104-107 Original Article e Impedance Profile of Acupuncture Points Fletcher Kovich * Curepoint Acupuncture Practice, Bristol, United Kingdom ABSTRACT Journal of Acupuncture Research Journal homepage: http://www.e-jar.org Introduction The phenomenon of low electrical impedance at acupoints has been widely studied since the 1950’s, with Voll (1953) [1], Nakatoni (1956) [2], and Niboyet (1957) [3] pioneering this work. And the low impedance has also been found to decrease further in acupoints whose associated organ is diseased. In 1978, Serisawa [4] reported that in 50 patients with pulmonary tuberculosis, points of reduced impedance existed along the lung meridian on the upper arm. And in 1993, Saku et al [5] reported that in patients with acute myocardial infarction, there was significantly reduced impedance at the auricular cardiac acupoint in 28 out of 30 patients (compared to only 2 out of 19 patients in the control group). Kovich has hypothesized that organ information is communicated to the organ’s associated acupoints in real-time via an electrical wave [6]. This information is thought to affect the local tissue at acupoints, producing various effects which are familiar in Chinese Medicine clinics, such as tenderness, skin temperature changes, rough skin, redness, boils, or shooting pains. It is proposed that whatever causes such changes, also causes the impedance changes [6]. In a series of experiments to explore this acupoint-impedance phenomenon, and any insight it may provide into the communication between an organ and its related acupoints, the author discovered distinct patterns in acupoint impedance which are described here. Materials and Methods A male subject, aged 58, was diagnosed with poor stomach and pancreas function (usually known as “Stomach chi deficiency” and “Spleen chi deficiency” in Chinese Medicine; and comparable terms would be used in Traditional Korean Medicine, and in other holistic disciplines). e subject was always thinking and studying, and oſten felt soreness along the gallbladder meridian on his lower right leg, which corresponded with periods of heavy thinking. Impedance samples were taken from left and right Stomach-36 (Zusanli), leſt and right Gallbladder-34 (Yanglingquan), and also a non-acupoint located 55 mm lateral to right ST-36. e sampling * Corresponding author. Curepoint Acupuncture Practice, Bristol, United Kingdom E-mail: fl[email protected] ©2018 Korean Acupuncture & Moxibustion Medicine Society. This is an open access article under the CC BY-NC-ND license (http://creativecommons.org/licenses/by-nc- nd/4.0/).
Transcript of Jouna Acupuctu esearch - e-jar.org · impedan u .e h on go up h th go w n h an gh instan th am...
Background: Reduced impedance at acupuncture points (acupoints) is a well-known phenomenon; and the impedance has been found to reduce further in relation to organ stress. The author hypothesises that any changes to an organ’s state or function are communicated to its related acupoints in real time. As part of a research project to demonstrate this communication, the impedance of several acupoints was studied in real time.Methods: The acupoints were located electrically, and a 40 kHz signal was used to sample the impedances. Samples were taken at each acupoint and also at a 6 mm radius. The sample rate was 1 kHz and the session lasted for 5 minutes. The results presented here were taken from a single patient.Results: The impedance at an acupoint’s centre frequently changed in an inverse relationship to the impedance at a 6 mm radius (i.e. when one goes up, the other goes down) and the left and right instance of the same acupoint usually displayed different impedance features.Conclusion: When studying the fine detail of real-time impedance samples taken from the centre of an acupoint and also from a 6 mm radius, this previously unreported contrary-motion phenomenon provides a useful tool to differentiate between artefact and genuine organ-related features in an impedance trace.
©2018 Korean Acupuncture & Moxibustion Medicine Society. This is an open access article under the CC BY-NC-ND license (http://creativecommons.org/licenses/by-nc-nd/4.0/).
Article history:Submitted: April 17, 2018Revised: June 5, 2018Accepted: June 15, 2018
Keywords:acupoints, acupuncture, communication, impedance
https://doi.org/10.13045/jar.2018.00080pISSN 2586-288X eISSN 2586-2898
J Acupunct Res 2018;35(3):104-107
Original Article
The Impedance Profile of Acupuncture PointsFletcher Kovich *
Curepoint Acupuncture Practice, Bristol, United Kingdom
ABSTRACT
Journal of Acupuncture ResearchJournal homepage: http://www.e-jar.org
Introduction
The phenomenon of low electrical impedance at acupoints has been widely studied since the 1950’s, with Voll (1953) [1], Nakatoni (1956) [2], and Niboyet (1957) [3] pioneering this work. And the low impedance has also been found to decrease further in acupoints whose associated organ is diseased. In 1978, Serisawa [4] reported that in 50 patients with pulmonary tuberculosis, points of reduced impedance existed along the lung meridian on the upper arm. And in 1993, Saku et al [5] reported that in patients with acute myocardial infarction, there was significantly reduced impedance at the auricular cardiac acupoint in 28 out of 30 patients (compared to only 2 out of 19 patients in the control group).
Kovich has hyp ot hes ize d t hat organ in for mat ion i s communicated to the organ’s associated acupoints in real-time via an electrical wave [6]. This information is thought to affect the local tissue at acupoints, producing various effects which are familiar in Chinese Medicine clinics, such as tenderness, skin temperature changes, rough skin, redness, boils, or shooting pains.
It is proposed that whatever causes such changes, also causes the impedance changes [6].
In a series of experiments to explore this acupoint-impedance phenomenon, and any insight it may provide into the communication between an organ and its related acupoints, the author discovered distinct patterns in acupoint impedance which are described here.
Materials and Methods
A male subject, aged 58, was diagnosed with poor stomach and pancreas function (usually known as “Stomach chi deficiency” and “Spleen chi deficiency” in Chinese Medicine; and comparable terms would be used in Traditional Korean Medicine, and in other holistic disciplines). The subject was always thinking and studying, and often felt soreness along the gallbladder meridian on his lower right leg, which corresponded with periods of heavy thinking. Impedance samples were taken from left and right Stomach-36 (Zusanli), left and right Gallbladder-34 (Yanglingquan), and also a non-acupoint located 55 mm lateral to right ST-36. The sampling
*Corresponding author.Curepoint Acupuncture Practice, Bristol, United KingdomE-mail: [email protected]©2018 Korean Acupuncture & Moxibustion Medicine Society. This is an open access article under the CC BY-NC-ND license (http://creativecommons.org/licenses/by-nc-nd/4.0/).
Aug-011

Fletcher Kovich / Impedance Profile of Acupoints 105
began at 10:34 AM on 29 March 2018, and the subject had not eaten for about 2.5 hours previously.
The acupoints were located first by an acupuncturist with 12 years of clinical experience in Chinese Medicine, then the location of lowest impedance was verified electrically. To reliably locate acupoints by measuring the impedance at the skin is a skill that takes some practice and particular techniques. The Appendix 1 lists an accompanying document that describes these techniques in detail, and also the equipment used in the experiment. Once the point of lowest impedance was identified (which was usually within about 4 mm of the location picked by the acupuncturist), this was used as the test location for that acupoint. A pair of electrodes was used for each acupoint, 1 electrode placed at its centre, and 1 at a distance of 6 mm, perpendicular to the meridian.
Each pair of electrodes was set in plastic, 6 mm apart, each electrode having a conical point, reducing to a tip of around 1 mm diameter. An earth electrode (being a standard ECG electrode) was placed 4-10 cm from each test acupoint. Gel was used to make the contact between each electrode and the skin. The accompanying document listed in the Appendix 1 also describes how to manufacture the test electrodes, since they were custom made.
A PicoScope 2204A was used as a signal generator to produce a 200 mv (peak value) sine wave signal at 40 kHz. This was passed through each test electrode and returned via the earth electrode. A custom-built unit was used to monitor the voltage at each test electrode. Within this unit, the monitored voltage was amplified by a factor of 7, half rectified and smoothed, to produce a DC signal, which was then passed to a PicoLog1216 data logger which was set to sample this voltage once every millisecond. (See Appendix 1 for the design and circuit details.) The data was then imported into Matlab and filtered to produce the plots given here. A low pass filter was used with a pass band frequency of 0.7 Hz. An Access database and macro was used to control the data logger and convert the voltage samples into KΩ values before they were imported into Matlab. The Appendix 1 describes where to download the Access database and macro.
Results and Discussion
The raw experimental data is available online in a dataset [7] which includes all readings from each electrode and also the Matlab scripts used to filter the data to produce the charts. Fig. 1
shows the samples from right GB-34.The most striking feature of the right GB-34 readings was the
contrary motion between the 2 plots. The 2 plots represent the readings taken at 2 locations that were only 6 mm apart on the skin, yet every significant feature in the one plot (marked with blue arrows in Fig. 1) was mirrored in the other plot in contrary motion. That is, if the feature involved a sharp fall in the impedance at the acupoint’s centre (the blue plot), it was accompanied by a sharp rise in the impedance at a location only 6 mm away (the brown plot). Not only this, but the general trend of each plot (as well as the individual features) also tends to move in contrary motion to the trend in the other plot, producing a mirror-image effect (except between 180 to 230 seconds).
The inset in Fig. 1 highlights the feature that appeared at 124 seconds, where the transition between similar and contrary motion can be seen. Before the feature begins, both plots moved in similar motion. At 123 seconds, the feature begins, and contrary motion was adopted by the two plots. This contrary motion then reduced over the following 3 seconds, when the plots again moved in similar motion. Hence this feature lasted for 3 seconds and can be interpreted to represent a 3 second burst of gallbladder activity.
The sections in the plots where the smaller features move in similar motion are probably artefact. This is because these same features appear on most of the 10 plots taken simultaneously in that session, indicating that they are artefact, which may have originated due to radio or magnetic interference, instrumentation noise, or even electrical artefact present in the subject, either generated biologically or picked up from the environment.
An chance discovery
In this series of experiments, the use of dual electrodes set 6 mm apart, was initially chosen to provide a control reading. When an expected change in impedance at an acupoint’s centre was detected (usually in response to some known stimulus, such as an invoked change in organ function), the intention was to use the 2nd reading, from 6 mm away from the acupoint’s centre, to show that the impedance at that 2nd location had not changed, confirming that the change in impedance at the acupoint’s centre was a genuine reflection of a changed state in the related organ.
However, two unexpected results were routinely obtained. Firstly, it was found that the real-time impedance readings at an acupoint’s centre often contained much fine detail (of uncertain origin, though the assumption was that this detail may reflect aspects of the related organ’s function). And secondly, that when the impedance changed at an acupoint’s centre, rather than the impedance 6 mm away not changing, it often also changed but in contrary motion.
This was unexpected and seemingly bizarre. Because the electrical signal used in these experiments was passed through the skin and also the underlying tissue (such as the muscle, tissues, body fluids, vessels) all these components could contribute to the impedance readings (rather than just the skin). Therefore, when an impedance change was recorded in the experiment, it could be due to a change in the structure of any or all of these components (including the skin). But even so, when sampling the impedance at 2 locations on the skin, only 6 mm apart, if the impedance change was due to some normal biological process, it would be expected to change equally at both locations, and in the same direction in both (i.e. to both rise or fall). The fact that at an acupoint, this pair of impedance samples often changed in opposite directions was counterintuitive. This seemed to suggest that such contrary motion was not natural and was perhaps peculiar to acupoints.Fig. 1. Simultaneous impedance readings at right GB-34 and at a 6 mm distance from
the acupoint’s centre.

J Acupunct Res 2018;35(3):104-107106
What might account for the contrary motion?
According to Kovich’s hypothesis [6], the impedance variations at the GB-34 acupoint (Fig. 1) are a real-time representation of states in the gallbladder (its changing function and physical state). The association between such real-time impedance variations and states in the related organ, has not yet been proved. However, for the purpose of this discussion, it is hypothetically assumed that the hypothesis is correct. In this case, the organ information would be communicated to every location along the organ’s related meridian via an electrical wave. This information would then interact with the local tissue at an acupoint to produce changes in the tissue (the skin, muscle, body fluids, etc), which changes would then affect the impedance of the tissue; and it is this varying impedance that is shown in Fig. 1. But what type of signal (carried upon a wave) would produce contrary motion changes in the impedance of the tissue at these 2 locations that are only 6 mm apart? To achieve this, the interaction of the wave with the local tissue would need to produce an impedance pattern that had a “V” shape, which is explained as follows.
Firstly, when a wave is focused on an acupoint (or a meridian), the strength of the wave would be strongest at the acupoint’s centre and would gradually weaken with distance on either side of the acupoint (when considering a plane perpendicular to the meridian). And secondly, when an organ’s function is weak, this usually results in low impedance at its related acupoints, whereas when the organ function is strong, this usually results in higher impedance at the acupoints. These two facts are put together to construct the following explanation.
Fig. 2A visualizes the effect that a signal reflecting a weak organ function might have on the impedance of the local tissue at the acupoint. At the acupoint’s centre, the information-carrying wave is strongest, and this would result in low impedance (shown by the longest blue arrow); but the signal/wave’s effect would need to rapidly fall off with distance from the acupoint’s centre, and at the 6 mm radius, this would result in much higher impedance (shown by the shorter blue arrows).
It is possible that the effect of the signal on the tissue, would fall off so rapidly due to the fact that the signal represents weak organ function and could therefore be considered a weak signal.
Fig. 2B visualizes the effect that a signal reflecting a strong organ function might have. At the acupoint’s centre, when the wave is at its strongest, this results in high impedance in the local tissue (the longer red arrow); but the wave’s effect would wear off
with distance. However, with a signal representing a strong organ function, the effect would need to not wear off as rapidly as it would with a signal representing a weak organ function, therefore the “V” shape is shallower.
Fig. 2C then superimposes the two “V” shapes to demonstrate that this behaviour would reproduce the pattern found in the experimental data. As shown by the black arrows in Fig.2C, when the impedance at the centre of the acupoint increases (moving from the blue dotted line to the red), this would result in a decrease in the impedance at the location 6 mm away (also moving from the blue dotted line to the red)—and vice versa.
The reasons given here for the particular way these signals interact with the local tissue are speculative, however this is the behaviour that would be required to produce the necessary “V” shapes to account for this contrary-motion phenomenon. Such behaviour would also produce the following pattern. As the impedance at the centre of an acupoint reduces, the “visible” diameter of the acupoint at the skin’s surface would also reduce and become more well defined (the impedance gradient increases—i.e. the angle of the blue dotted “V” is steeper); while, when the acupoint’s impedance increases, its skin-surface diameter would also increase, and the acupoint become less well defined (i.e. the area encompassed by the red dotted lines at the skin’s surface is much larger than the area encompassed by the blue dotted lines). This pattern is found in clinic, and also in impedance experiments. When an organ is stressed, the impedance of its related acupoints is notably lower than that of the surrounding skin, and the acupoints are easy to locate; while, when an organ functions normally, its acupoints are harder to locate, and impedance studies may even fail to reliably locate them (in a 2008 review by Ahn et al [8], 9 studies were summarized that investigated the phenomenon of lowered impedance at acupoints, and only 5 of the 9 studies managed to confirm the phenomenon).
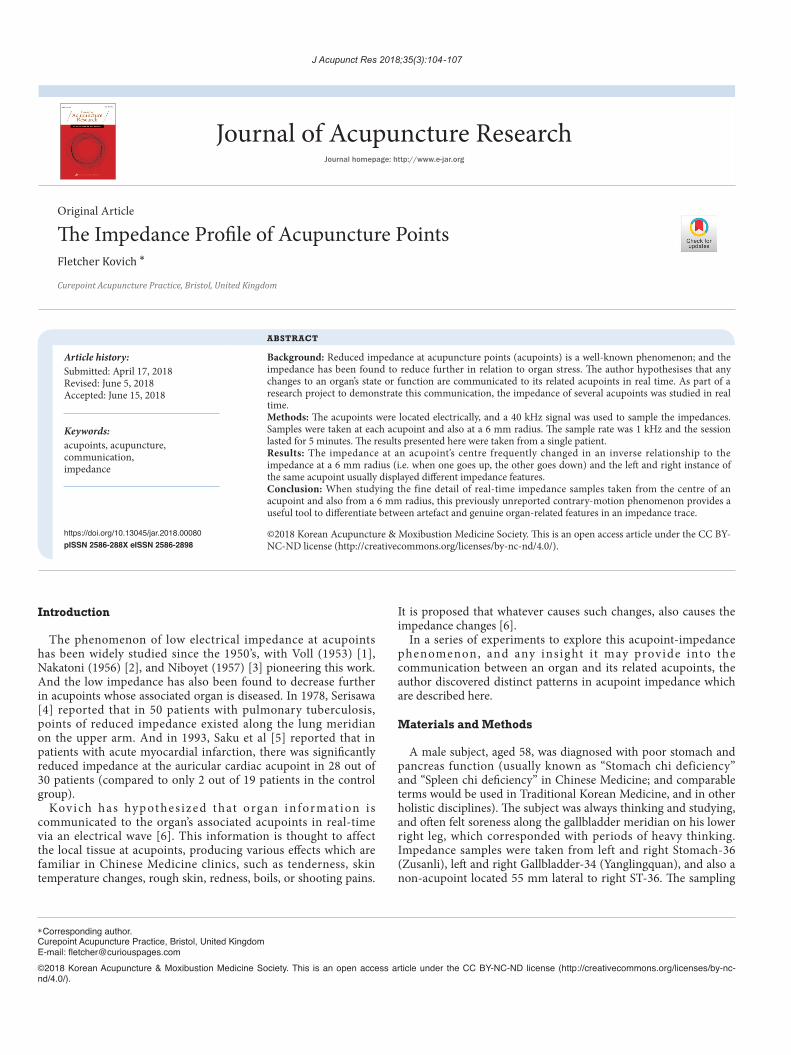
Comparing the left and right instance of each acupoint
In Fig. 3 the features in the impedance of the left and right GB-34 acupoints are notably different (though the general trends are similar), with little duplication of the main features between the two plots. In the left acupoint, there are little more than 2 significant features, while in the right, there are at least 16 (the blue arrows in Fig. 1).
In readings taken at GB-34 and also the stomach acupoints in this series of experiments, it was invariably the case that the left and right instances of the same acupoint produced different impedance traces and this may occur in all pairs of acupoints.
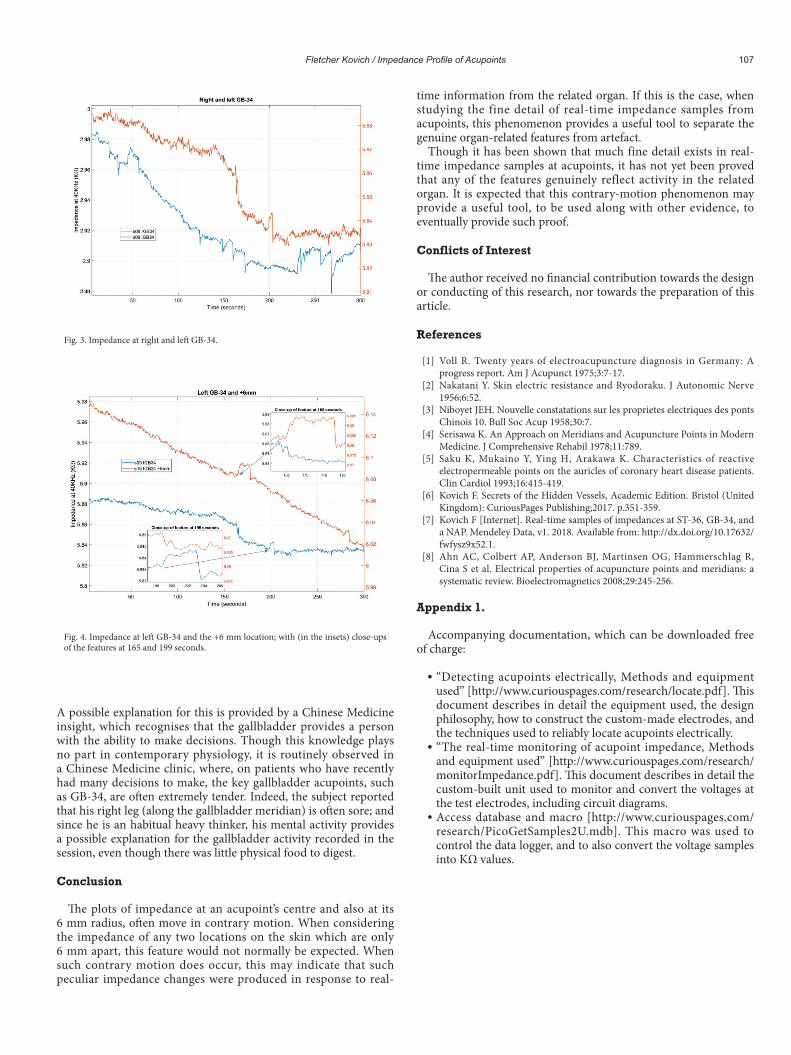
Fig. 4 shows the impedance of the left GB-34 acupoint and also the impedance at a location 6 mm away; and as can be seen from the insets, the most significant features in each trace begin with contrary motion, suggesting that they genuinely reflect gallbladder activity, rather than being artefact.
The fact that the left and right acupoint in any pair of acupoints, have different impedance features (each reflecting organ activity), suggests that the left and right acupoint reflect different aspects of the related organ; and therefore (according to Kovich’s hypothesis), treat different aspects of the organ. In clinic, acupoints are usually needled bilaterally, so that this fact would appear to be of academic interest only. However, it may have significance in the future scientific research of acupoint functions.
Is there an explanation for the gallbladder activity shown in Fig. 1?
The subject had not eaten for around 2.5 hours, yet during the experiment, there was clearly a great deal of gallbladder activity.
Fig. 2. Imagined signal behaviour to produce the characteristic contrary-motion pattern at an acupoint.
(A) (B) (C)
Fletcher Kovich / Impedance Profile of Acupoints 107
A possible explanation for this is provided by a Chinese Medicine insight, which recognises that the gallbladder provides a person with the ability to make decisions. Though this knowledge plays no part in contemporary physiology, it is routinely observed in a Chinese Medicine clinic, where, on patients who have recently had many decisions to make, the key gallbladder acupoints, such as GB-34, are often extremely tender. Indeed, the subject reported that his right leg (along the gallbladder meridian) is often sore; and since he is an habitual heavy thinker, his mental activity provides a possible explanation for the gallbladder activity recorded in the session, even though there was little physical food to digest.
Conclusion
The plots of impedance at an acupoint’s centre and also at its 6 mm radius, often move in contrary motion. When considering the impedance of any two locations on the skin which are only 6 mm apart, this feature would not normally be expected. When such contrary motion does occur, this may indicate that such peculiar impedance changes were produced in response to real-
time information from the related organ. If this is the case, when studying the fine detail of real-time impedance samples from acupoints, this phenomenon provides a useful tool to separate the genuine organ-related features from artefact.
Though it has been shown that much fine detail exists in real-time impedance samples at acupoints, it has not yet been proved that any of the features genuinely reflect activity in the related organ. It is expected that this contrary-motion phenomenon may provide a useful tool, to be used along with other evidence, to eventually provide such proof.
Conflicts of Interest
The author received no financial contribution towards the design or conducting of this research, nor towards the preparation of this article.
References
[1] Voll R. Twenty years of electroacupuncture diagnosis in Germany: A progress report. Am J Acupunct 1975;3:7-17.
[2] Nakatani Y. Skin electric resistance and Ryodoraku. J Autonomic Nerve 1956;6:52.
[3] Niboyet JEH. Nouvelle constatations sur les proprietes electriques des ponts Chinois 10. Bull Soc Acup 1958;30:7.
[4] Serisawa K. An Approach on Meridians and Acupuncture Points in Modern Medicine. J Comprehensive Rehabil 1978;11:789.
[5] Saku K, Mukaino Y, Ying H, Arakawa K. Characteristics of reactive electropermeable points on the auricles of coronary heart disease patients. Clin Cardiol 1993;16:415-419.
[6] Kovich F. Secrets of the Hidden Vessels, Academic Edition. Bristol (United Kingdom): CuriousPages Publishing;2017. p.351-359.
[7] Kovich F [Internet]. Real-time samples of impedances at ST-36, GB-34, and a NAP. Mendeley Data, v1. 2018. Available from: http://dx.doi.org/10.17632/fwfysz9x52.1.
[8] Ahn AC, Colbert AP, Anderson BJ, Martinsen OG, Hammerschlag R, Cina S et al. Electrical properties of acupuncture points and meridians: a systematic review. Bioelectromagnetics 2008;29:245-256.
Appendix 1.
Accompanying documentation, which can be downloaded free of charge:
“Detecting acupoints electrically, Methods and equipment used” [http://www.curiouspages.com/research/locate.pdf]. This document describes in detail the equipment used, the design philosophy, how to construct the custom-made electrodes, and the techniques used to reliably locate acupoints electrically.
“The real-time monitoring of acupoint impedance, Methods and equipment used” [http://www.curiouspages.com/research/monitorImpedance.pdf]. This document describes in detail the custom-built unit used to monitor and convert the voltages at the test electrodes, including circuit diagrams.
Access database and macro [http://www.curiouspages.com/research/PicoGetSamples2U.mdb]. This macro was used to control the data logger, and to also convert the voltage samples into KΩ values.
Fig. 3. Impedance at right and left GB-34.
Fig. 4. Impedance at left GB-34 and the +6 mm location; with (in the insets) close-ups of the features at 165 and 199 seconds.