Joseph Thomas Andrews arXiv:0810.5755v1 … G S Institute of Technology & Science, Indore - 452 003,...
47
arXiv:0810.5755v1 [physics.med-ph] 31 Oct 2008 Non-Invasive Glucose Monitoring Techniques: A review and current trends Raju Poddar ∗ Photonics Lab I, Division of Microelectorics, School of EEE, Nayang Technological University, Singapore - 639798. Joseph Thomas Andrews † Department of Applied Physics, Shri G S Institute of Technology & Science, Indore - 452 003, India. Pratyoosh Shukla Department of Biotechnology, Birla Institute of Technology, Mesra, Ranchi 835 215 India. Pratima Sen Laser Bhawan, School of Physics, Devi Ahilya University, Khandwa Road, Indore 452 007 India. 1
-
Upload
trinhhuong -
Category
Documents
-
view
214 -
download
2
Transcript of Joseph Thomas Andrews arXiv:0810.5755v1 … G S Institute of Technology & Science, Indore - 452 003,...
arX
iv:0
810.
5755
v1 [
phys
ics.
med
-ph]
31
Oct
200
8Non-Invasive Glucose Monitoring Techniques:
A review and current trends
Raju Poddar∗
Photonics Lab I, Division of Microelectorics, School of EEE,
Nayang Technological University, Singapore - 639798.
Joseph Thomas Andrews†
Department of Applied Physics,
Shri G S Institute of Technology & Science,
Indore - 452 003, India.
Pratyoosh Shukla
Department of Biotechnology, Birla Institute of Technology, Mesra, Ranchi 835 215 India.
Pratima Sen
Laser Bhawan, School of Physics, Devi Ahilya University,
Khandwa Road, Indore 452 007 India.
1
Abstract
Diabetes mellitus is a complex group of syndromes that have in common a disturbance in the
body’s use of glucose, resulting in an elevated blood sugar. Once detected, sugar diabetes can
be controlled by an appropriate regimen that should include diet therapy, a weight reduction
program for those persons who are overweight, a program of exercise and insulin injections or
oral drugs to lower blood glucose. Blood glucose monitoring by the patient and the physician
is an important aspect in the control of the devastating complications (heart disease, blindness,
kidney failure or amputations) due to the disease. Intensive therapy and frequent glucose testing
has numerous benefits. With ever improving advances in diagnostic technology, the race for the
next generation of bloodless, painless, accurate glucose instruments has begun. In this paper, we
reviewed various methods, techniques and approaches successfully demonstrated for measuring or
monitoring blood glucose. Invasive, minimally invasive and noninvasive techniques available in
literature are summarised.
∗On Study Leave from Department of Biotechnology, Birla Inst. Tech., Mesra, Ranchi 835 215 India.†Corresponding author: [email protected], Phone: +91-731-243 4095, www.sgsits.ac.in
2
I. INTRODUCTION
Diabetes mellitus is a medical condition in which the body does not adequately produce
the quantity or quality of insulin needed to maintain a normal circulating blood glucose.
Insulin is a hormone that enables glucose (sugar) to enter the body’s cells to be used for
energy. Two types of diabetes are common. Type - I is also known as Insulin Dependent
Diabetes Mellitus (IDDM) and accounts for 5-10% of all cases. Type - II or Non-Insulin
Dependent Diabetes Mellitus (NIDDM) occurs in 90-95% of the diabetic population. IDDM
occurs in childhood. It requires insulin doses to maintain life, in addition to healthy practices.
Frequent self-monitoring of blood glucose is crucial for effective treatment and reduction of
the morbidity and mortality of diabetes.
Unmonitored diabetes can lead to severe complications over time, including blindness,
kidney failure, heart failure, and peripheral neuropathy associated with limb pain, poor
circulation, gangrene and subsequent amputation [1]. These complications are largely due to
poor glucose control. The Diabetes Care and Complications Trial (DCCT) demonstrate that
more frequent monitoring of blood glucose and insulin levels could prevent many of the long
term complications of diabetes [2]. However, the conventional blood (finger stick) glucose
testing & monitoring are painful, inconvenient due to disruption of daily life. Also, it causes
fear of hyoglycemia resulting from tighter glucose control and may be difficult to perform
in long term diabetic patients due to calluses on the fingers and poor circulation. A glucose
measurement with following qualities, i) non-invasive, ii) non-contact, iii) fast measurement
capability, iv) painless measurements, v) convenience for glucose monitoring and vi) cost
effective which could provide adequate control and greatly reduce the complications seen in
these patients.
At present, the simplest and less painful method for glucose measurements are done
by pricking a finger and extracting a drop of blood (50µl/dl) which is applied to a test
strip composed of chemicals sensitive to the glucose in the blood sample. An optical meter
(glucometer) is used to analyze the blood sample and gives a numerical glucose reading.
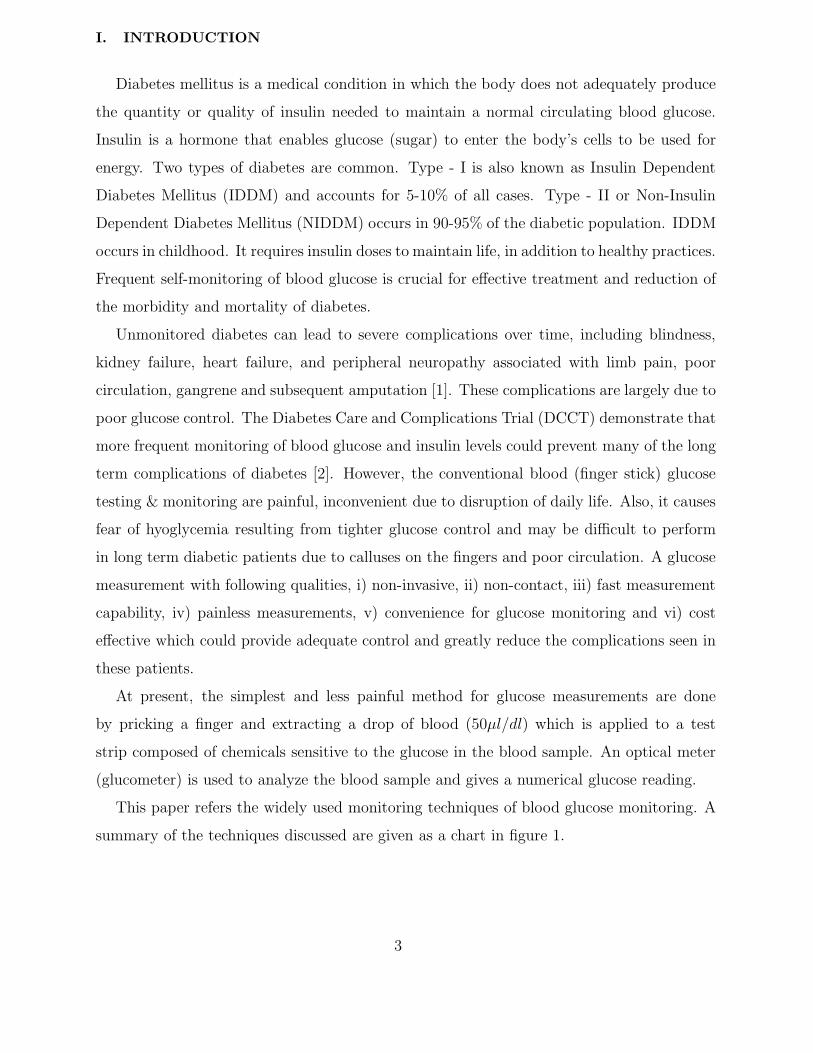
This paper refers the widely used monitoring techniques of blood glucose monitoring. A
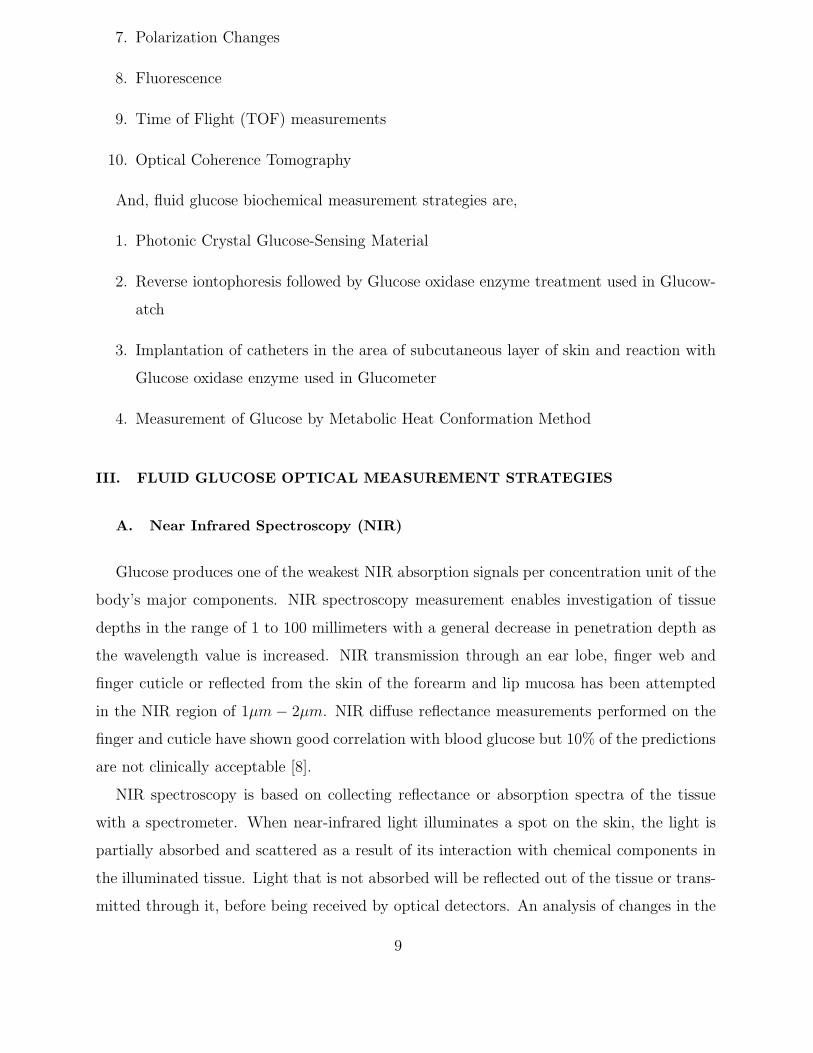
summary of the techniques discussed are given as a chart in figure 1.
3
Blood Glucose Mesurment Techniques
Invasive Minimally Methods Invasive Methods
Noninvasive Methods
Chemical
Biochemical Methods&
Glucometer ReverseIontophoresis (Glucowatch)
MicrodialysisProbe
FluorescentSensor Optical
Other
Techniques
Techniques Near InfraredSpectroscopy
RamanSpectroscopy
PhotoacousticSpectroscopy Techniques
ScatteringChanges
Polarization Changes
Midinfrared Fluorescence
NIR DiffuseReflectance
NIR DiffuseTransmittance
Spatially ResolvedDiffuse Reflectance
Optical CoherenceTomography
Time of Flight
Photonic Crystal Glucose Sensing
Metabolic Heat Confirmation Method
FIG. 1: Methods of glucose measurement techniques.
A. Glucose in human body
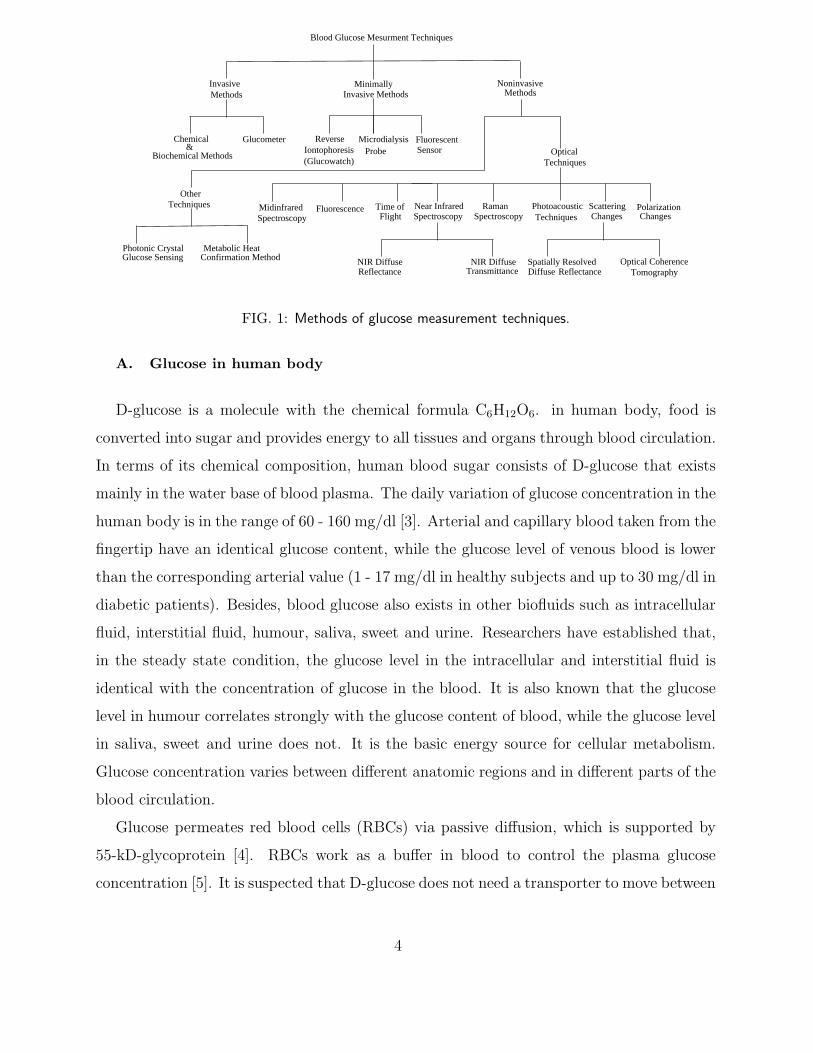
D-glucose is a molecule with the chemical formula C6H12O6. in human body, food is
converted into sugar and provides energy to all tissues and organs through blood circulation.
In terms of its chemical composition, human blood sugar consists of D-glucose that exists
mainly in the water base of blood plasma. The daily variation of glucose concentration in the
human body is in the range of 60 - 160 mg/dl [3]. Arterial and capillary blood taken from the
fingertip have an identical glucose content, while the glucose level of venous blood is lower
than the corresponding arterial value (1 - 17 mg/dl in healthy subjects and up to 30 mg/dl in
diabetic patients). Besides, blood glucose also exists in other biofluids such as intracellular
fluid, interstitial fluid, humour, saliva, sweet and urine. Researchers have established that,
in the steady state condition, the glucose level in the intracellular and interstitial fluid is
identical with the concentration of glucose in the blood. It is also known that the glucose
level in humour correlates strongly with the glucose content of blood, while the glucose level
in saliva, sweet and urine does not. It is the basic energy source for cellular metabolism.
Glucose concentration varies between different anatomic regions and in different parts of the
blood circulation.
Glucose permeates red blood cells (RBCs) via passive diffusion, which is supported by
55-kD-glycoprotein [4]. RBCs work as a buffer in blood to control the plasma glucose
concentration [5]. It is suspected that D-glucose does not need a transporter to move between
4
CH OH
HO O
OH
OH OH
OH
HO O
OH
OH OH
OH
O
OH
OH
OH
OH
O
OH
OH
OH
OH
OH
OH
OH
HO
HCO
alpha - D - glucopyranose
beta - D - glucofuranose beta - D - glucopyranose
2CH OH2
CH OH2 CH OH2
CH OH2
alpha - D - glucofuranose
acyclic - D - glucose
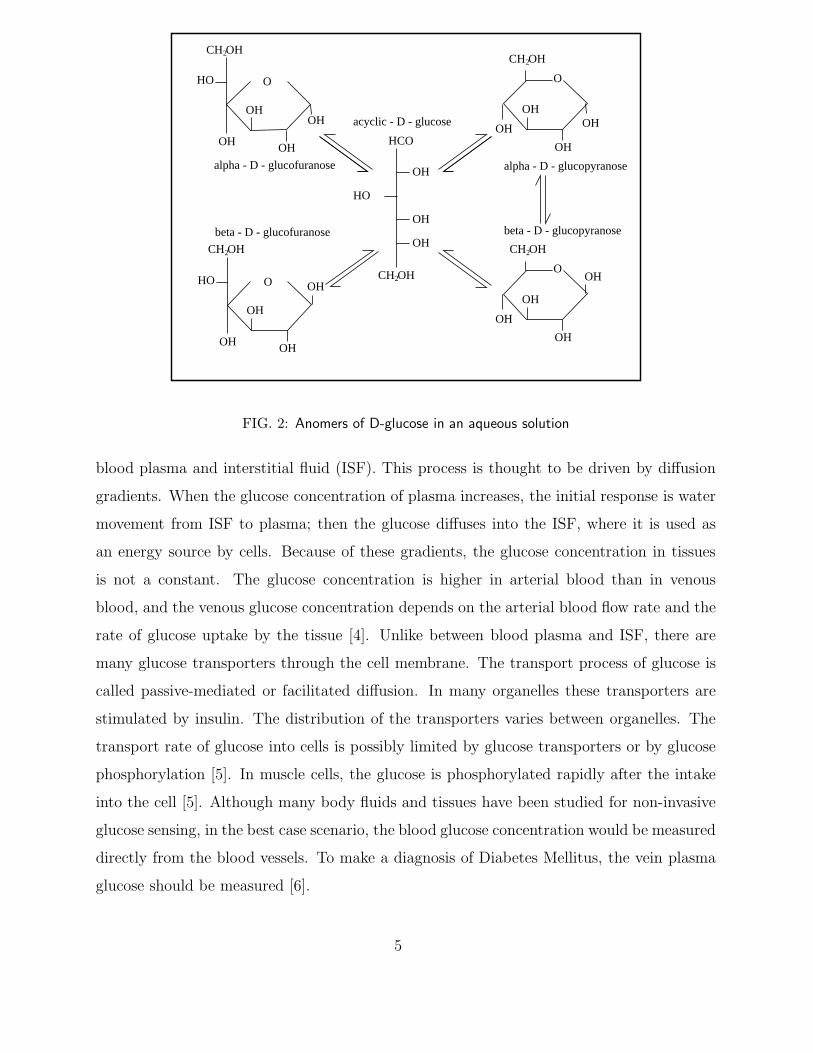
FIG. 2: Anomers of D-glucose in an aqueous solution
blood plasma and interstitial fluid (ISF). This process is thought to be driven by diffusion
gradients. When the glucose concentration of plasma increases, the initial response is water
movement from ISF to plasma; then the glucose diffuses into the ISF, where it is used as
an energy source by cells. Because of these gradients, the glucose concentration in tissues
is not a constant. The glucose concentration is higher in arterial blood than in venous
blood, and the venous glucose concentration depends on the arterial blood flow rate and the
rate of glucose uptake by the tissue [4]. Unlike between blood plasma and ISF, there are
many glucose transporters through the cell membrane. The transport process of glucose is
called passive-mediated or facilitated diffusion. In many organelles these transporters are
stimulated by insulin. The distribution of the transporters varies between organelles. The
transport rate of glucose into cells is possibly limited by glucose transporters or by glucose
phosphorylation [5]. In muscle cells, the glucose is phosphorylated rapidly after the intake
into the cell [5]. Although many body fluids and tissues have been studied for non-invasive
glucose sensing, in the best case scenario, the blood glucose concentration would be measured
directly from the blood vessels. To make a diagnosis of Diabetes Mellitus, the vein plasma
glucose should be measured [6].
5
B. Glucose oxidation methods
Traditional glucose determination is based on the glucose oxidation reaction, catalyzed
by glucose oxidase (GOD). It may be described by
glucose + O2 + H2O GOD−−−−−−−→
H2O2 + gluconic acid (1)
Glucose oxidase catalyzes the oxidation of β-D-glucose to D-gluconic acid and hydrogen
peroxide. It is highly specific for β-D-glucose and does not act on α-D-glucose. Its major
use is in the determination of free glucose in body fluids. Although specific for β-D-glucose,
glucose oxidase can be used to measure the total amount of glucose. This is because,
following the consumption of β-glucose, α-glucose at equilibrium is converted to the β-
form by mutarotation. The consumed oxygen or the ensuing production of gluconic acid
or hydrogen peroxide (H2O2) is in direct proportion to the glucose content. The glucose
oxidase method is characterized by high sensitivity, accuracy and reliability. Traditional
electrochemical methods such as potentiometry or amperometry can be used to determine
the glucose content during the glucose oxidation reaction.
Very recently, the results obtained on the glycemia measurement by an indirect method
are presented.[7] The measurement method uses a sensor to electromagnetic coupling based
on loss currents. This sensor allows the detection of the bloods glucose level through the
variation of the sensor impedance that is depend on the dielectric parameters of blood, in
particular the conductivity. The in vitro results presented a standard deviation of 2.1 mV,
an average error of 1.8 mV, and a maximum variation of 3.6 mV equivalents to a maximum
error of ± 197 mg dl−1 on the concentration of D+ glucose compared to the line of tendency.
II. NON-INVASIVE OPTICAL TECHNIQUES
A. General Features of Non-Invasive Optical Techniques
Non-invasive optical measurement of glucose is performed by focusing a beam of light onto
the body. The light is modified by the tissue after transmission through the target area.
An optical fingerprint of the tissue content is produced by the diffuse light that escapes
the tissue it has penetrated. The absorbance of light by the skin is due to its chemical
6
components (i.e., water, hemoglobin, melanin, fat and glucose). The transmission of light
at each wavelength is a function of thickness, color and structure of the skin, bone, blood
and other material through which the light passes [8]. The glucose concentration can be
determined by analyzing the optical signal changes in wavelength, polarization or intensity
of light. The sample volume measured by these methods depends on the measurement site.
The correlation with blood glucose is based on the percent of fluid sample that is interstitial,
intracellular or capillary blood. The fluid viewed through the limb is 63% intracellular and
37% extracellular, of which 27% is interstitial and 10% plasma. A blood glucose value of
100mg/dl is equivalent to a tissue sample glucose average of 38 mg/dl of which 26% is
due to blood, 58% is due to interstitial fluid and 16% is due to intracellular fluid. Optical
measurements dependent on concentration changes in all body compartments measured, as
well as changes in the ratio of tissue fluids (as altered by activity level, diet or hormone
fluctuations) and this, in turn, effects the glucose measurement. Problems also occur due to
changes in the tissue after the original calibration and the lack of transferability of calibration
from one part of the body to another. Tissue changes include: body fluid source of the
blood supply for the body fluid being measured, medications that affect the ratio of tissue
fluids, day-to-day changes in the vasculature, the aging process, diseases and the persons
metabolic activity. However, the ratio of body fluids (intracellular, interstitial, plasma) are
affected by factors such as activity level, diet or hormone fluctuations, but also by blood
circulation, body temperature shift, metabolic activity and medication. All these factors
are capable of influencing the optical parameters and, consequently, impacting the blood
glucose measurement. Moreover, day-to-day changes in vasculature and tissue texture as
well as the aging process may affect the long-term stability of glucose monitoring.
B. Types of Measurement Techniques
Non-invasive glucose monitoring techniques can be grouped as subcutaneous, dermal,
epidermal and combined dermal and epidermal glucose measurements. As all methods based
on glucose oxidase require a direct contact between glucose and some chemical reagents,
they necessitate the extraction of glucose from the body. However, a non-contact, non-
invasive method is impossible with any chemical based method. The only attraction is use a
spectroscopic methods. In a spectroscopic technique is used an optical beam interacts with
7
glucose within the human body. The generated signals are then analyzed and the results
displayed. Since optical methods do not require the extraction of glucose from the body,
they are highly suitable for the continuous, non-invasive monitoring of glucose.
Matrices other than blood under investigation include interstitial fluid, ocular fluids and
sweat. Test sites being explored include finger tips, cuticle, finger web, forearm and ear lobe.
Subcutaneous measurements include microdialysis, wick extraction, and implanted electro-
chemical or competitive fluorescence sensors. Microdialysis is also an investigational dermal
and epidermal glucose measurement technique. Epidermal measurements can be obtained
via infrared spectroscopy, as well. Combined dermal and epidermal fluid glucose measure-
ments include extraction fluid techniques (iontophoresis, skin suction and suction effusion
techniques) and optical techniques. Different properties of light are measured and the effect
of glucose on the collected signals is evaluated with different techniques. Bruulsema et. al [9]
have studied the effect of glucose and the corresponding changes in optical properties. Glu-
cose affects light scattering and also, to some extent, light absorption. The most pronounced
effect of increased glucose concentration is decreased scattering coefficients. This overview is
focused on a description of the optical techniques currently under development by diagnostic
equipment manufacturers for glucose monitoring in diabetics - the fastest growing segment
of diagnostic testing. Till today the noninvasive blood glucose measurements techniques
may categorized into two major groups viz. fluid glucose optical measurement strategies,
fluid glucose biochemical measurement strategies and combination of both strategies. A
summary of the optical techniques and their salient feature are summarize in the Table 1
Further, fluid glucose optical measurement techniques may be classified into the following
subclasses,
1. Near Infrared Spectroscopy (NIR)
2. Infrared Spectroscopy (IR)
3. Raman Spectroscopy
4. Photoacoustic and optoacoustic techniques
5. Spatially resolved diffuse reflectance measurements
6. Frequency-domain reflectance technique
8
7. Polarization Changes
8. Fluorescence
9. Time of Flight (TOF) measurements
10. Optical Coherence Tomography
And, fluid glucose biochemical measurement strategies are,
1. Photonic Crystal Glucose-Sensing Material
2. Reverse iontophoresis followed by Glucose oxidase enzyme treatment used in Glucow-
atch
3. Implantation of catheters in the area of subcutaneous layer of skin and reaction with
Glucose oxidase enzyme used in Glucometer
4. Measurement of Glucose by Metabolic Heat Conformation Method
III. FLUID GLUCOSE OPTICAL MEASUREMENT STRATEGIES
A. Near Infrared Spectroscopy (NIR)
Glucose produces one of the weakest NIR absorption signals per concentration unit of the
body’s major components. NIR spectroscopy measurement enables investigation of tissue
depths in the range of 1 to 100 millimeters with a general decrease in penetration depth as
the wavelength value is increased. NIR transmission through an ear lobe, finger web and
finger cuticle or reflected from the skin of the forearm and lip mucosa has been attempted
in the NIR region of 1µm − 2µm. NIR diffuse reflectance measurements performed on the
finger and cuticle have shown good correlation with blood glucose but 10% of the predictions
are not clinically acceptable [8].
NIR spectroscopy is based on collecting reflectance or absorption spectra of the tissue
with a spectrometer. When near-infrared light illuminates a spot on the skin, the light is
partially absorbed and scattered as a result of its interaction with chemical components in
the illuminated tissue. Light that is not absorbed will be reflected out of the tissue or trans-
mitted through it, before being received by optical detectors. An analysis of changes in the
9
intensity of the light combined with the application of multivariate calibration techniques
[10] permits the extraction of the tissue’s chemical components, including glucose. Robinson
[11] used NIR transmission spectroscopy and the multivariate calibration method to measure
blood/tissue glucose concentrations in diabetic subjects. Several conventional spectrometer
configurations are designed on transmission sampling in the 600 - 1300 nm range. The re-
ported average prediction errors vary from 19.8 mg/dl to 37.8 mg/dl in oral glucose tolerance
tests (OGTT) conducted on three subjects. In turn, Burmeister and Arnold [12], employed
near-infrared transmission spectroscopy to study noninvasive blood glucose sensing in differ-
ent measurement sites like cheek, lip, nasal septum, tongue and webbing tissue. The results
showed that the tongue, containing the least amount of fat, provided spectra with the high-
est signal-to-noise ratio. They collected the transmission spectra of the tongue in the 1400 -
2000 nm ranges. Their findings showed a standard error of prediction (SEP) in excess of 54
mg/dl for all diabetic subjects [13]. Hiese and Marbach [14] have reported a series of stud-
ies on glucose determination in the oral mucosa membrane in the 1111 - 1835 nm spectral
range through a diffuse reflectance measurement. The best SEP was 43 mg/dl from a 2-day
single-person OGTT. Jagemann and cowokers [15]used a fiber optic probe to study diffuse
reflectance over the 800 - 1350 nm range on the middle finger of the right hand. The blood
glucose concentrations of the test persons were perturbed using carbohydrate loading. The
results were evaluated using the partial least squares regression method (PLS) and radial
basis function neural networks. In these tests, the mean root square prediction error was
3.6 mg/dl.This method has the advantage that no reagents are required for the measure-
ments and that fiber optical components can be used. As a consequence only insulators are
in direct contact with the skin. Furthermore the spectrometer can be constructed without
moving parts, leading to a rugged design.
Methodology Continuous wave light source is used to illuminate the tissue under study.
A typical wavelength range 1050 - 2450 nm is used for measurements. The short wavelength
region of the near infrared (λ ∼= 800-1300 nm) has the following advantages that are ideal
for non-invasive and in vivo diagnostics. In this range there is an optical window between
the region in which visible light is absorbed by blood and skin pigments and the longer
wavelengths in which absorption of water predominates. The NIR spectrum consists of
overtones and combinations of the fundamental vibrations mainly of the bonds of carbon,
nitrogen and oxygen with hydrogen. NIR spectra of aqueous systems show weak, broad and
10
overlapping bands with random baselines. The position and intensity of the signals vary
according to the chemical vicinity (hydrogen bonding effects). The influence of dissolved
salts and temperature on the NIR spectra of aqueous systems is well known. Since the normal
proportion of glucose in blood and tissue is only about 0.1 percent of the water content the
spectral variations due to glucose concentration are extremely small. The evaluation of the
recorded spectra is further complicated by several influences: water is a strong absorber and
also the main component of living tissue. In addition time dependent biological processes
take place, e.g. pulse and respiration. Other sources of variation are erroneous spectral
recordings caused for example by irregular pressure of the measuring head on the finger. As
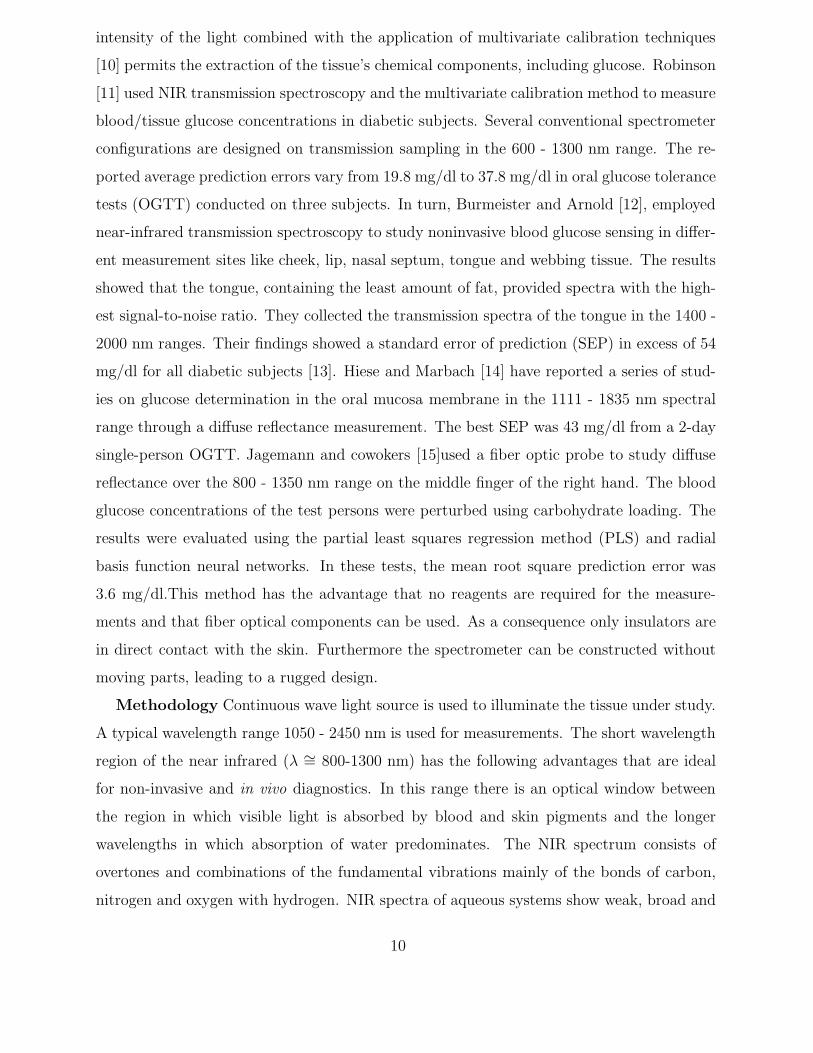
a consequence multivariate calibration methods have to be used for evaluating the spectra.
FIG. 3: Schematic of the filter-based IR spectroradiometer.
NIR spectrometer: The equipment for recording the spectra is shown in Fig. and
consists of a light source, a fiber optical measuring head and a NIR spectrometer. This
spectrometer uses a polychromator with a holographic imaging diffraction grating and an
InGaAs photo diode array detector with 128 pixels mounted on a glass block. A very
compact design (70 mm x 50 mm x 40 mm) with excellent optical performance was achieved
by using a high-dispersion grating with extremely short focal length. The optical resolution
(Rayleigh criterion) is about 12 nm in the wavelength region from 820-1320 nm. Fiber
optical bundles connect light source (tungsten halogen lamp) and spectrometer with the
11
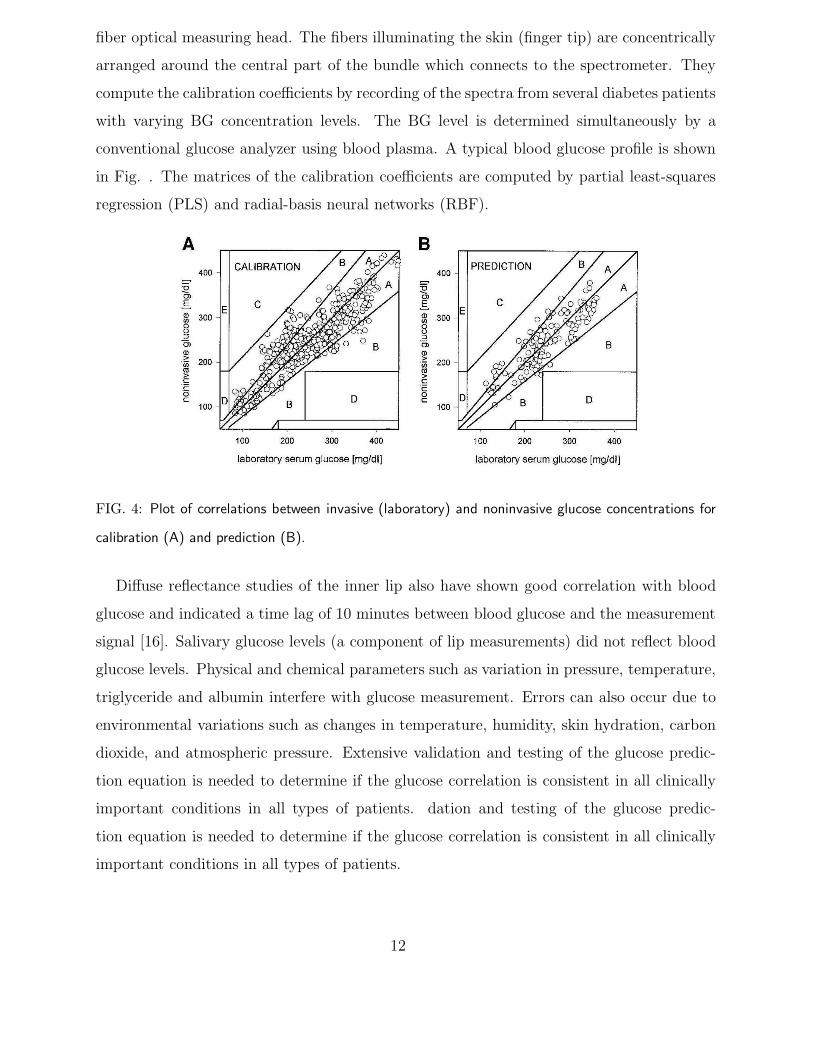
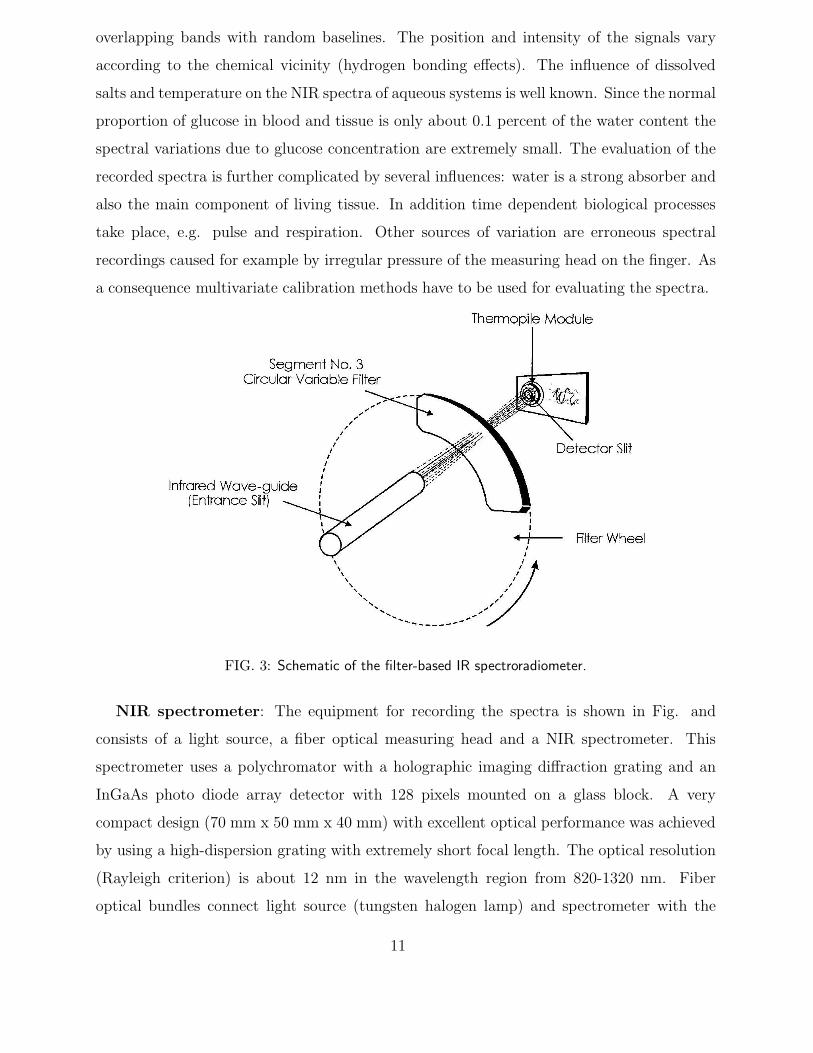
fiber optical measuring head. The fibers illuminating the skin (finger tip) are concentrically
arranged around the central part of the bundle which connects to the spectrometer. They
compute the calibration coefficients by recording of the spectra from several diabetes patients
with varying BG concentration levels. The BG level is determined simultaneously by a
conventional glucose analyzer using blood plasma. A typical blood glucose profile is shown
in Fig. . The matrices of the calibration coefficients are computed by partial least-squares
regression (PLS) and radial-basis neural networks (RBF).
FIG. 4: Plot of correlations between invasive (laboratory) and noninvasive glucose concentrations for
calibration (A) and prediction (B).
Diffuse reflectance studies of the inner lip also have shown good correlation with blood
glucose and indicated a time lag of 10 minutes between blood glucose and the measurement
signal [16]. Salivary glucose levels (a component of lip measurements) did not reflect blood
glucose levels. Physical and chemical parameters such as variation in pressure, temperature,
triglyceride and albumin interfere with glucose measurement. Errors can also occur due to
environmental variations such as changes in temperature, humidity, skin hydration, carbon
dioxide, and atmospheric pressure. Extensive validation and testing of the glucose predic-
tion equation is needed to determine if the glucose correlation is consistent in all clinically
important conditions in all types of patients. dation and testing of the glucose predic-
tion equation is needed to determine if the glucose correlation is consistent in all clinically
important conditions in all types of patients.
12
B. Infrared Spectroscopy (IR)
The IR glucose measurement systems at the epidermal surface enables investigation of
tissue depths in the range of 10 to 50 micrometers at using a wavelength band in the IR
region from 700 to 1000nm [17]. These systems are not suitable for measuring glucose in
the blood containing tissues. An attenuated total reflection technique has been used for oral
mucosa.
Spectral Regions: The entire near infrared region of the electromagnetic spectrum
encompasses light with wavelengths ranging from 0.7 to 2.5 microns (14,286 - 4000 cm−1
wavenumbers). For the most part, near infrared spectroscopic information corresponds to
harmonics of overtones and combinations of fundamental vibrational transitions more fre-
quently associated with mid-infrared spectroscopy. Overtone and combination absorptions
are principally seen for CH, OH, and NH molecular groups. The energetics associated with
these transitions result in absorption bands that are broad and featureless with low ab-
sorptivities. The ambiguity of CH, OH, and NH groups within biological systems and the
physical nature of these transitions result in complex, overlapping spectra. The chemical en-
vironment surrounding these CH, OH, and NH groups controls the exact position and shape
of these near infrared absorption features, thereby resulting in unique spectral signatures
for the molecular species of interest. Selective analytical measurements rely on the unique-
ness of these spectra. IR spectroscopy uses wavelengths between 2.5 20 mm. It is based
on studies of light absorption by glucose at a selected wavelength range. The absorption
spectrum are collected with a spectrophotometer. Zeller et al [18, 19, 20] have measured
blood glucose concentration with IR spectroscopy.
Water is a critical matrix component for near infrared spectra of aqueous based clinical
samples, such as the human body. The high concentration of water in clinical samples
coupled with the relatively strong absorptivity of OH groups result in large water absorbance
bands. The strong absorbance of water dictates using the regions between these water
bands where sufficient amounts of light are transmitted. The following three regions are
generally accessible: (i) the combination region: 2.0 - 2.5 microns (5000 - 4000 cm−1);
(ii) the first overtone region: 1.54 - 1.82 microns (6500 - 5500 cm−1); and (iii) the short-
wavelength near infrared (sw-NIR) region: 0.7 - 1.33 microns (14,286 - 7500 cm−1). Glucose
has three absorption bands in both the combination region (centered at 2.10, 2.27, and 2.32
13
microns) and the first overtone region (centered at 1.73, 1.69, and 1.61 microns). Although
glucose absorption bands are difficult to measure in the sw-NIR owing to their extremely
low absorptivities, bands centered at 0.76, 0.92, and 1.00 microns are reported.
A regression method is used to identify the best combination of tissue thickness to ac-
curately simulate human in vivo spectra. In this method, absorbance spectra from pure
samples of the aqueous buffer and beef fat are combined according to equation :
AH = β0 + β1 ∗ Aw + β2 ∗ Af (2)
where AH , Aw, and Af correspond to absorbance spectra for these pure samples of
human webbing, water, and beef fat, respectively, and βi values correspond to the respective
regression coefficients. Absorbance values (A) are defined according to equation :
A = − log(I/Io) (3)
where I and Io represent transmitted light intensities with and without the sample of
interest, respectively. Absorbances are used owing to their additive nature according to
the Beer-Lambert relationship. Application of this method involves starting with an in vivo
absorbance spectrum from the subject of interest and then fitting this spectrum by adjusting
the relative amounts of the pure water and fat absorbance spectra in such a way to minimize
the sum of the square of residuals. Model layer thicknesses are computed as the product of
the regression coefficient and the known thickness of the corresponding pure samples. The
regression model presented here represents a slightly simplified version where absorbance
from muscle protein is ignored. This simplification is well justified for noninvasive spectra
over the overtone region. Muscle protein absorbance must be considered, however, in the
combination region. Quantitatively, we can compute the standard error of prediction (SEP)
for the validation data in both cases. The SEP drops from 1.60 mM to 0.49 mM when
increasing the path length from 5.6 to 6.2 mm. It must be noted that the spectral noise
is essentially identical for these two data sets (23.4 and 23.5 micro-absorbance units for
the 5.6 and 6.2 mm path length data, respectively). Improvements are expected from the
Beer-Lambert relationship which states that longer path lengths will provide larger signals,
thereby enhancing the signal-to-noise ratio of the measurement and improving analytical
performance.
Experimental Parameters: It is important to recognize that noninvasive blood glucose
measurements are simply absorbance measurements in a complex matrix. As such, one must
14
be able to differentiate the amount of light absorbed by glucose from spectral noise. In this
regard sample thickness is a critical experimental parameter because tissue thickness affects
both glucose sensitivity and spectral noise. As the sample thickness increases more light is
absorbed for a given concentration of glucose, thereby enhancing sensitivity and lowering
the detection limit. On the other hand, fewer photons successfully traverse a thicker layer
of tissue, thereby reducing the measured light intensity and increasing spectral noise. A
compromise is required to maximize sensitivity to glucose while minimizing spectral noise.
however, the drawbacks include glucose contamination of the measurement site by food and
a highly variable saliva of low rate [21]. Assays using whole blood as the sample matrix,
are subject to interferences due to albumin, red cells and gamma globulin and changes in
temperature and pH. Further, saliva glucose varies considerably and does not reflect blood
glucose methods.
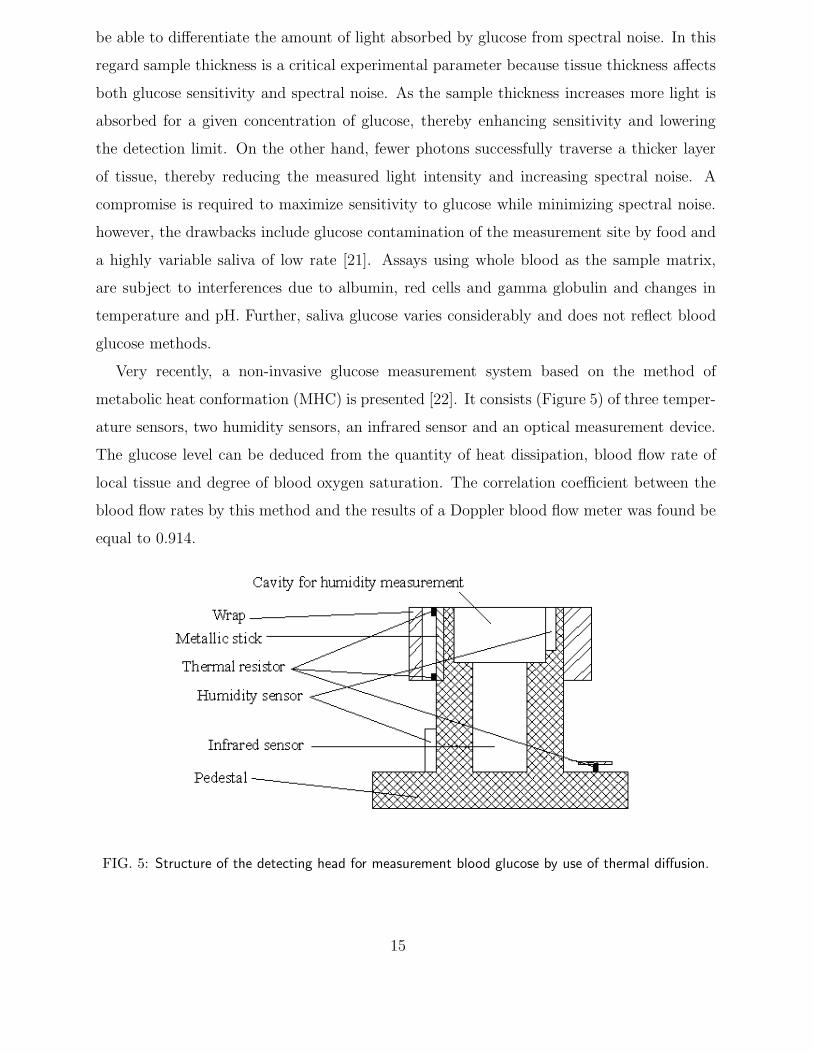
Very recently, a non-invasive glucose measurement system based on the method of
metabolic heat conformation (MHC) is presented [22]. It consists (Figure 5) of three temper-
ature sensors, two humidity sensors, an infrared sensor and an optical measurement device.
The glucose level can be deduced from the quantity of heat dissipation, blood flow rate of
local tissue and degree of blood oxygen saturation. The correlation coefficient between the
blood flow rates by this method and the results of a Doppler blood flow meter was found be
equal to 0.914.
FIG. 5: Structure of the detecting head for measurement blood glucose by use of thermal diffusion.
15
C. Raman Spectroscopy
The phenomenon of Raman scattering is observed when monochromatic radiation is in-
cident upon optically transparent (negligible absorption) media. In addition to the trans-
mitted light, a portion of the radiation is scattered. Most of the light that is scattered is
elastically scattered at the same wavelength; however, some of the incident light of frequency
ωo exhibits inelastic scatter with frequency shifts ±ωm, which is associated with transitions
between rotational, vibrational and electronic levels. In general, the intensity and polariza-
tion of the scattered radiation are dependent upon the position of observation relative to
the incident energy. Most studies use the Stokes type of scattering bands, which correspond
to the ωo − ωm scattering. Therefore, the Raman bands of interest are shifted to longer
wavelengths relative to the excitation wavelength. An example of this is depicted in Figure
for water-subtracted glucose.
Compared with near-infrared spectroscopy, Raman spectroscopy monitors fundamental
vibrations, which are sharper and exhibit less overlap. Moreover, water has a low Raman
cross-section, although its infrared absorption capacity is high. However, scattering effects
and the re-absorption of light in bio-tissues make the detection of Raman signals a difficult
task. Protein molecules, for example, produce a background fluorescence signal that is often
equal to or larger than the Raman signal itself. For these reasons, the anterior chamber
of the eye and aqueous humour are the best sites for noninvasive Raman measurements.
Unfortunately, these are sensitive parts of the body, and the signal level has to be low such
that the power of incident irradiation is confined to a safe dose. By analysing the resulting
spectra of Raman scattering it is possible to get information about the chemical structure
(including glucose) of the medium. [23, 24, 25]. Recent [26] data shows demonstrate the
feasibility of Raman spectroscopy in monitoring blood glucose in vivo. It reports the first
successful study of use of Raman spectroscopy for quantitative, noninvasive transcutaneous
measurement of blood analytes, using glucose as an example. As an initial evaluation of
the ability of Raman spectroscopy to measure glucose transcutaneously. Raman spectra
were collected transcutaneously along with glucose reference values provided by standard
capillary blood analysis. A partial least squares calibration was created from the data from
each subject and validated using leave-one-out cross validation. The mean absolute errors
for each subject were 7.8% ± 1.8% (mean ± std) with R2 values of 0.83±0.10. Spectral
16
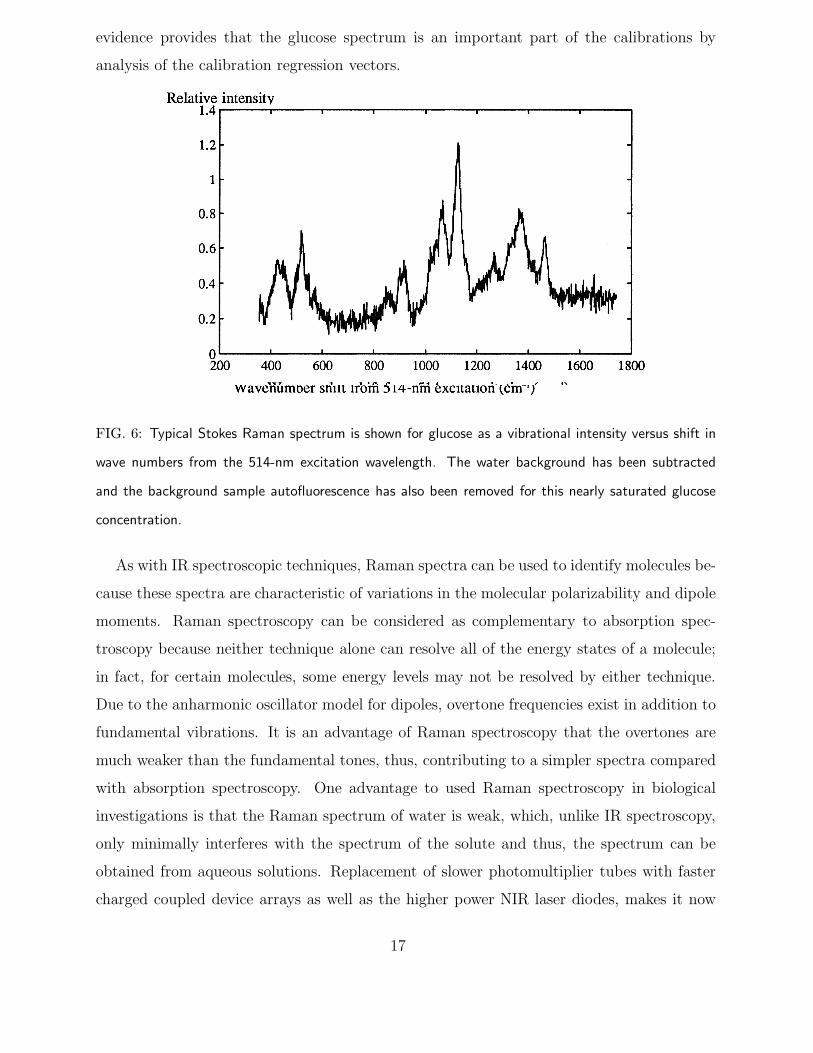
evidence provides that the glucose spectrum is an important part of the calibrations by
analysis of the calibration regression vectors.
FIG. 6: Typical Stokes Raman spectrum is shown for glucose as a vibrational intensity versus shift in
wave numbers from the 514-nm excitation wavelength. The water background has been subtracted
and the background sample autofluorescence has also been removed for this nearly saturated glucose
concentration.
As with IR spectroscopic techniques, Raman spectra can be used to identify molecules be-
cause these spectra are characteristic of variations in the molecular polarizability and dipole
moments. Raman spectroscopy can be considered as complementary to absorption spec-
troscopy because neither technique alone can resolve all of the energy states of a molecule;
in fact, for certain molecules, some energy levels may not be resolved by either technique.
Due to the anharmonic oscillator model for dipoles, overtone frequencies exist in addition to
fundamental vibrations. It is an advantage of Raman spectroscopy that the overtones are
much weaker than the fundamental tones, thus, contributing to a simpler spectra compared
with absorption spectroscopy. One advantage to used Raman spectroscopy in biological
investigations is that the Raman spectrum of water is weak, which, unlike IR spectroscopy,
only minimally interferes with the spectrum of the solute and thus, the spectrum can be
obtained from aqueous solutions. Replacement of slower photomultiplier tubes with faster
charged coupled device arrays as well as the higher power NIR laser diodes, makes it now
17
possible to distinguish tissue types and quantifying blood chemicals in real time. In some
studies eye has been suggested as a site for glucose concentration measurements. The reason,
being the reduction the high fluorescence background, which is incurred in heavily vascu-
larized tissue, due to the high concentration of proteins and other fluorescent components.
Investigators have applied statistical methods such as partial least squares for estimation of
biochemical concentrations from Raman spectra. These statistical methods combined with
more affordable instrumentation give Raman the potential to also be a viable noninvasive
glucose sensor.
There are disadvantages to used the eye for Raman spectroscopy studies, with the pri-
mary concern being the laser excitation powers. The power must be kept low to prevent
injury, but this significantly reduces the signal-to-noise ratio. In addition, in other tissues,
especially those with blood, a large background fluorescence overwhelms the Raman signal.
Instrumentation to excite in the NIR wavelength range has also been proposed to overcome
this problem because the fluorescence component falls off with increasing wavelength. Ex-
citation in the NIR region also offers longer wavelengths, which pass through larger tissue
samples with lower absorption and scatter than other spectral regions such as visible or ul-
traviolet. However, in addition to fluorescence falling off with wavelength, the Raman signal
also falls off to the fourth power as wavelength increases. Thus, there is a trade off between
minimizing fluorescence and maintaining the Raman signal. In addition, like IR and NIR
absorption, to quantifiably determine the inherently low concentrations of glucose in vivo
one also must account for the presence of different chemicals that yield overlapping Raman
signals.
D. Photoacoustic and optoacoustic techniques
The photoacoustic (PA) technique is based on the detection of pressure waves generated
by absorbing photons. A conventional method for studying gases and liquids is to generate
pressure waves with a continuous wave light source and a chopper [27]. Another possibility is
to use pulsed light, such as pulsed lasers, as an energy source. Nanosecond (ns) range optical
pulses are used to induce a rise in temperature, and thus a volumetric expansion inside the
studied sample. The pressure waves generated this way can be detected with acoustic or
optical detectors. The optical detectors are based, for example, on a probe-beam deflection
18
method or on an interferometer [28]. In the probe beam deflection method the probing
light beam deflects when traveling through a region of refractive index change affected by
the PA pulses. The interferometer, on the other hand, is very sensitive in detecting PA
pulse-induced pressure changes on the surface of the sample. The detection of glucose with
the PA technique is based on registering the changes in the peak-to-peak value of the signal,
whereas the optoacoustic (OA) technique is based on analysing changes in the exponential
curve fitted to the time-domain pulse profile. The PA and OA techniques have been used
to measure the glucose content of the human body and blood vessels [29].
1 2
3 4
5
6
7
8
910
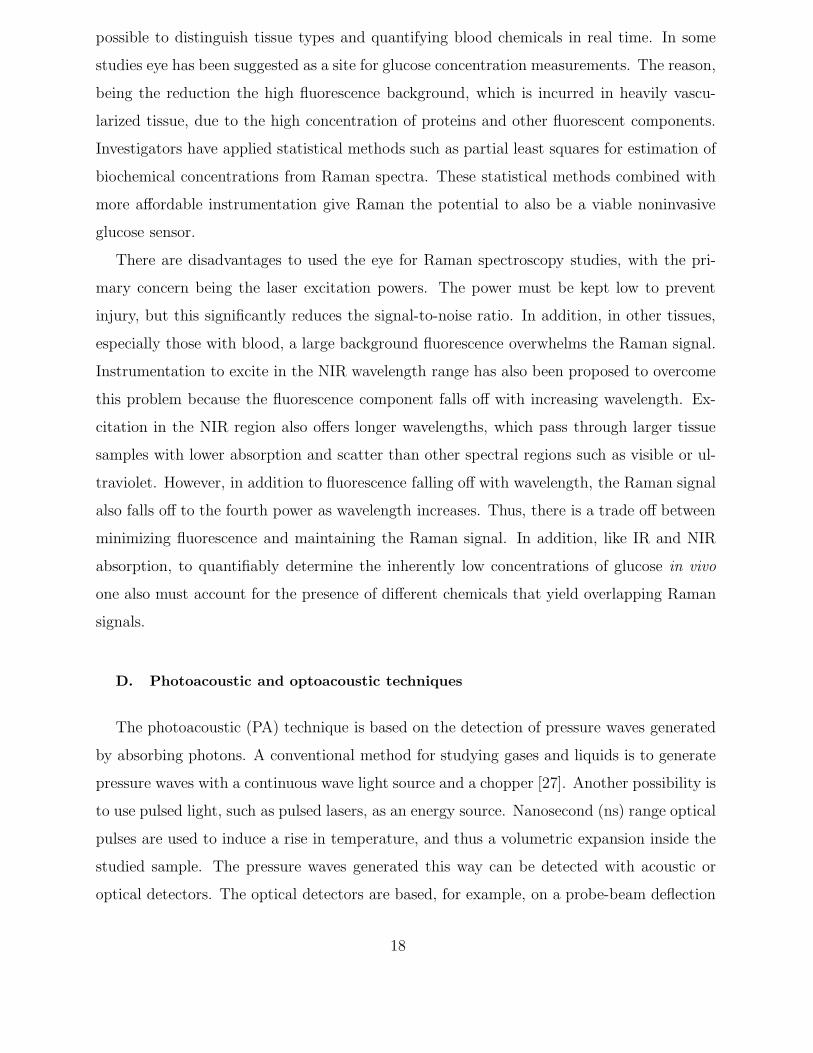
FIG. 7: Photoacoustic measurement system. 1: Laser unit, 2: Laser resonator, 3: Collimating lens, 4:
Filter, 5: Cuvette, 6: Acoustic transducer, 7: Photoacoustic preamplifier, 8: Main amplifier, 9: Power
unit, and 10: Oscilloscope.
Compared with optical absorption techniques, the photoacoustic methods offer the ad-
vantage of higher detection sensitivity, as the PA signal is influenced not only by the optical
absorption coefficient, but also by other physical parameters including thermal expansion,
specific heat and acoustic velocity. This has been demonstrated in the determination of
traces and oils in liquids. The basic principle behind the PA mechanism is that an energy
source (a pulsed laser, for example) irradiates some absorbing material, causing a fast ther-
mal expansion in the illuminated volume. The energy of the expansion is released as an
acoustic wave. A research group led by Mackenzie applied a pulsed PA method to mea-
19
sure blood glucose. They employed near-infrared PA spectroscopy to the study of glucose
aqueous solutions and blood components. To demonstrate the possibility of non-invasive
detection of glucose in the human body, Quan carried out an experiment using a gelatine-
based tissue phantom and a circulation system containing a glucose solution. The reported
detection sensitivity at 1.064 µm was 0.071% per mmol/l. At the same time, Christison [30]
applied a hybrid pulsed TEA CO2 laser to the detection of physiological glucose concentra-
tions (18-450 mg/dl) in human whole blood. The achieved sensitivity was quite good. A
portable non-invasive blood glucose monitor based on the PA method was developed with
laser diodes emitting at the 904 nm wavelength. Having tested the apparatus, the group
reported a correlation coefficient of 0.967 in observed blood glucose concentrations between
the PA response and hospital tests on a venous blood sample [31]. In Germany, a research
team headed by Spanner also used PA and optical techniques to investigate hemoglobin and
glucose in the human body [31]. It is worth noting that they used a special modulating
array of laser diodes. Recently, the correlation between glucose concentration and the re-
duced scattering coefficient of tissue has been put forward and confirmed. A research group
lead by Oraevsky established that 1 mmol/l increase in glucose concentration resulted in
a 3% decrease in the optical attenuation of a rabbit’s sclera in vivo. The result was ob-
tained by measuring a laser-induced acoustic profile using the time-resolved PA technique
at 355 nm [31]. This sensitivity far exceeds any values achieved in previous in vivo glucose
measurements.
E. Spatially resolved diffuse reflectance measurements
The spatially resolved diffuse reflectance technique uses a narrow beam of light to illumi-
nate a restricted area on the surface of section under study. Diffuse reflectance is measured
at several distances from the illuminated area. The intensity of this reflectance depends on
both the scattering and absorption coefficients of the tissue. Reflectance measured in the
immediate vicinity of the illuminated point is mainly influenced by scattering of the skin,
while reflectance farther away from the light source is affected by both scattering and the
absorption properties of skin. The recorded light intensity profiles are used to calculate
the absorption coefficient (µa and the reduced scattering coefficient (µs) of the tissue based
on the diffusion theory of light propagation in tissue [32]. Because µs and glucose concen-
20
tration are correlated, the latter can be extracted by observing changes in the former [32].
Brulsema et al [33]carried out a glucose clamp experiment to measure the diffuse reflectance.
An optical probe was fixed on the patient’s abdomen. The clamping protocol consisted of
a series of step changes in blood glucose concentration from the normal level of 5 mM to
15 mM and back to 5 mM. Three different clamping experiments were done on the body of
diabetic volunteers at wavelength of 650 nm. The corresponding changes in µs were esti-
mated to be about -0.20 percent/mM, -0.34percent/mM and -0.11 % /mM, respectively. A
qualitative correlation between the estimated change in µs and the change in blood glucose
concentration was observed in 30 out of 41 diabetic volunteers. Heinemann [33] obtained
a similar result (-1.0 % / 5.5 mM) in their glucose clamp experiments. However, under
normal conditions, blood glucose concentration does not change as rapidly as the clamping
experiments suggest. Hence, OGTT was applied in the measurement of diffuse reflectance
in reference [33] at the wavelength of 800 nm. The results indicated a mean relative change
in µs of about -0.5 %/mM and 0.3%/mM for healthy persons and type II diabetic patients,
respectively. The acceptable correlation between blood glucose concentration and µs was
75% (27 out of 36 measurements). The recent results by Khalil et al. [34] measured with the
spatially resolved diffuse reflectance technique show that temperature affects the cutaneous
scattering coefficient µs and absorption coefficient (µa) values. Cutaneous µs shows linear
changes as a function of temperature whereas the changes in (µa) showed complex and ir-
reversible behavior. The thermal response of skin has been used as a basis for non-invasive
differentiation of normal and diabetic skin [35].
Recently Poddar et al [36] shown a logarithmic correlation between BGC and µ′
s. They
interpret data in terms of Monte-Carlo simulation to find values of µ′
s, µa and g.
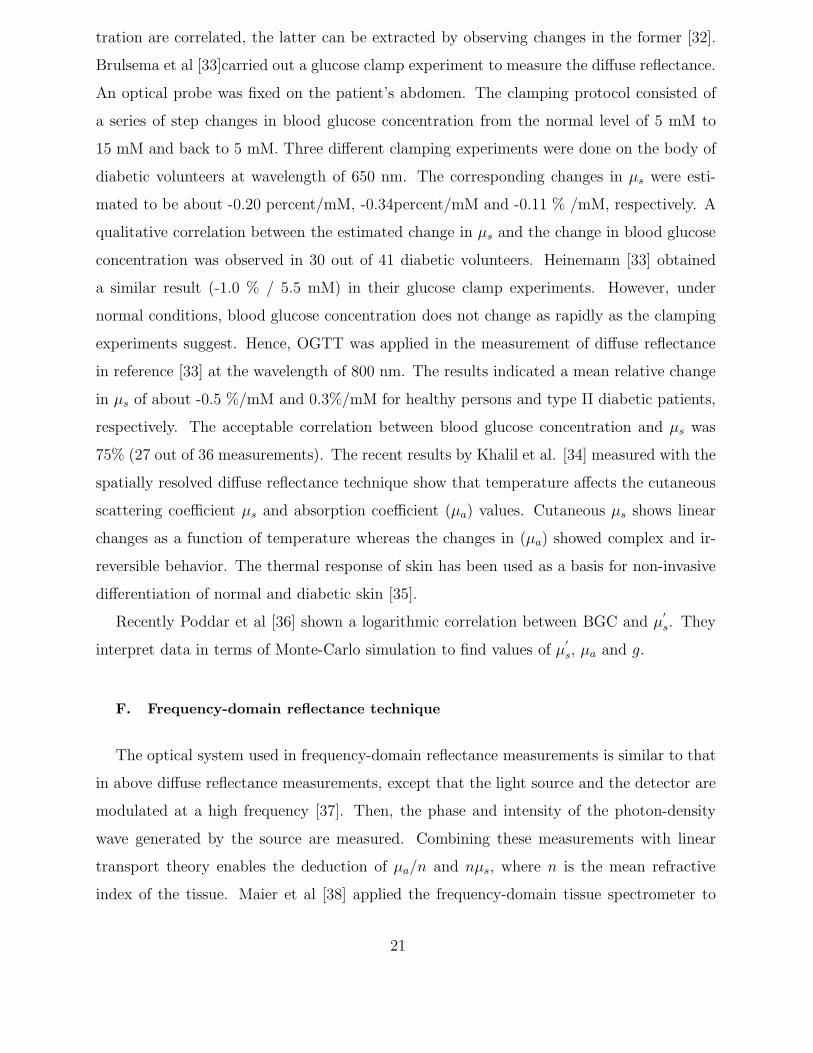
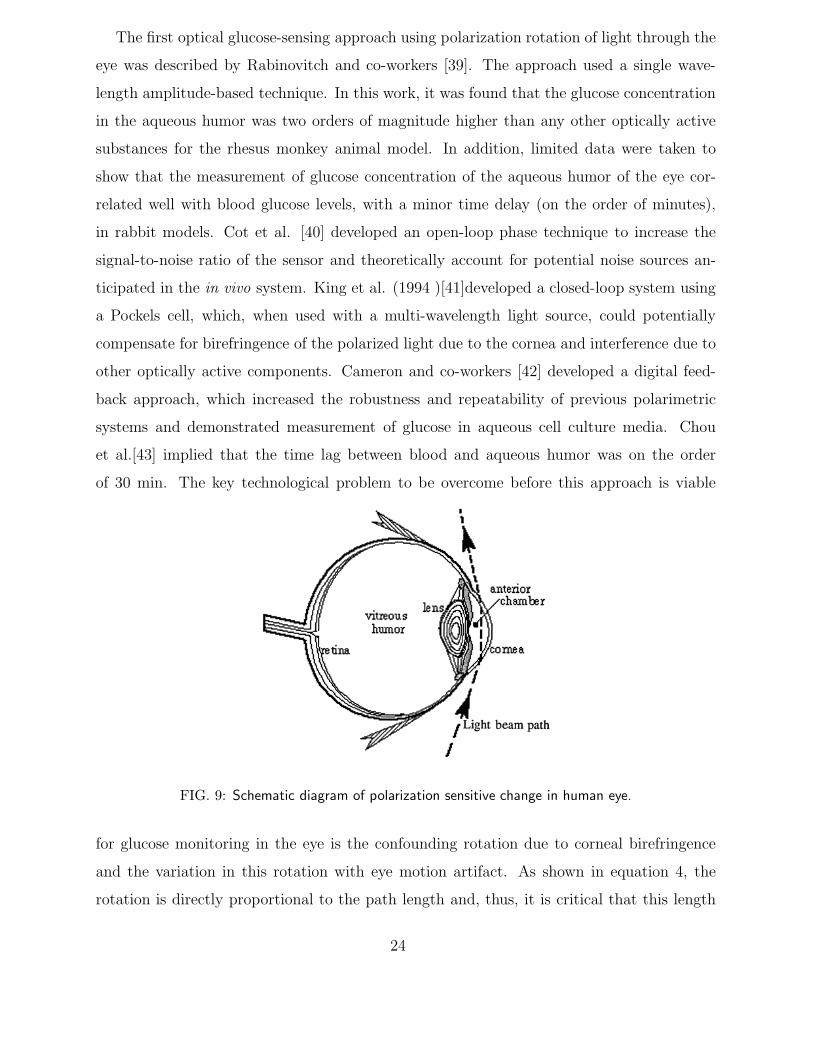
F. Frequency-domain reflectance technique
The optical system used in frequency-domain reflectance measurements is similar to that
in above diffuse reflectance measurements, except that the light source and the detector are
modulated at a high frequency [37]. Then, the phase and intensity of the photon-density
wave generated by the source are measured. Combining these measurements with linear
transport theory enables the deduction of µa/n and nµs, where n is the mean refractive
index of the tissue. Maier et al [38] applied the frequency-domain tissue spectrometer to
21
LS
C
OF
TS
LIA
S
PMT
1
FIG. 8: Schematic of the experimental setup used (Poddar et al) for collection of backscattered signal.
LS - light source, C - Chopper, OF - Optical fiber, TS - stepper motor controlled translation stage, LIA
- Lock-in amplifier, S - sample under study and PMT - Photomultiplier tube.
do an OGTT for a non-diabetic male. The optical source had a wavelength of 850 nm and
the measurement location was muscle tissue in the subjects thigh. The experimental results
showed that the relative change of µs with blood glucose concentration was - 2.5 % / 3.6mM,
which is identical with the results obtained by Heinemann.
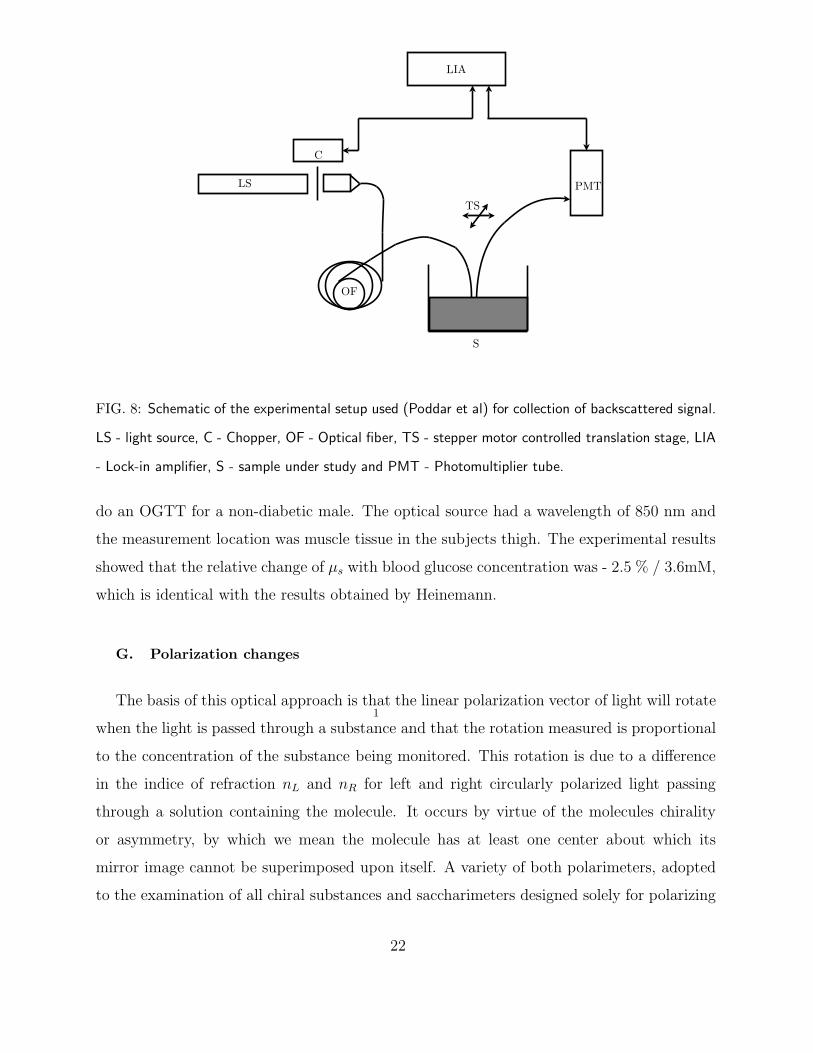
G. Polarization changes
The basis of this optical approach is that the linear polarization vector of light will rotate
when the light is passed through a substance and that the rotation measured is proportional
to the concentration of the substance being monitored. This rotation is due to a difference
in the indice of refraction nL and nR for left and right circularly polarized light passing
through a solution containing the molecule. It occurs by virtue of the molecules chirality
or asymmetry, by which we mean the molecule has at least one center about which its
mirror image cannot be superimposed upon itself. A variety of both polarimeters, adopted
to the examination of all chiral substances and saccharimeters designed solely for polarizing
22
sugars, have been developed. Glucose in the body is dextrorotatory (rotates light in the
right-handed direction with concentration). In addition to the concentration of the chiral
material, the amount of rotation of linear vector of the polarized light also depends on (i)
the thickness of the layer traversed by the light, (ii) the wavelength of the light used for the
measurement,(iii) the temperature and (iv) the pH of the solvent. Historically, polarimetric
measurements have been generally obtained under a set of standard conditions. The path
length typically used as a standard in polarimetry is 10 cm for liquids, the wavelength is
usually that of the green mercury line (5461 Angstroms) and the temperature is 20 ◦C. If
the layer thickness in decimeters (0.1 m) is L, the concentration of solute in grams per 0.1 L
of solution is C, is the observed rotation in degrees, and is the specific rotation or rotation
under standard conditions, which is unique for all chiral molecules, then
C = 100[α]/Lα] (4)
In the above equation the specific rotation ([α]) of a molecule is dependent upon temperature,
wavelength and the pH of the solvent. Of these three, the wavelength of the light has the
dominant effect on the specific rotation. This fact could potentially be used to distinguish
chiral rotation of the molecule of interest from other confounding molecules as well as chiral
rotation from birefringence due to the tissue.
For polarimetry to be used as a noninvasive technique for any chiral molecule and in
particular for blood glucose monitoring, the signal must be able to pass from the source,
through the body and to a detector without total depolarization of the beam. Because
the skin possesses high scattering coefficients, maintaining polarization information in a
beam passing through a thick piece of tissue (i.e., 1 cm), which includes skin, would not be
feasible. Tissue thicknesses of ≤ 4 mm, which include skin, may potentially be used, but the
polarimetric sensing device must be able to measure millidegree rotations in the presence of
≥ 95 % depolarization of the light due to scattering from the tissue. As an alternative to
transmitting light through the skin, several investigators have suggested the eye, as depicted
in Figure , as a site for detection of in vivo glucose concentrations. For instance, an observed
rotation of 4.562 millidegrees per optical pass can be expected for a normal blood glucose
level of 5.55 mmol/L, given a specific rotation of glucose at a wavelength of 633 nm of
45.62◦dmg/ml and thickness of 1 cm. A path length on the order of 1 cm is considered,
because this is the approximate width of the average anterior chamber of a human eye.
23
The first optical glucose-sensing approach using polarization rotation of light through the
eye was described by Rabinovitch and co-workers [39]. The approach used a single wave-
length amplitude-based technique. In this work, it was found that the glucose concentration
in the aqueous humor was two orders of magnitude higher than any other optically active
substances for the rhesus monkey animal model. In addition, limited data were taken to
show that the measurement of glucose concentration of the aqueous humor of the eye cor-
related well with blood glucose levels, with a minor time delay (on the order of minutes),
in rabbit models. Cot et al. [40] developed an open-loop phase technique to increase the
signal-to-noise ratio of the sensor and theoretically account for potential noise sources an-
ticipated in the in vivo system. King et al. (1994 )[41]developed a closed-loop system using
a Pockels cell, which, when used with a multi-wavelength light source, could potentially
compensate for birefringence of the polarized light due to the cornea and interference due to
other optically active components. Cameron and co-workers [42] developed a digital feed-
back approach, which increased the robustness and repeatability of previous polarimetric
systems and demonstrated measurement of glucose in aqueous cell culture media. Chou
et al.[43] implied that the time lag between blood and aqueous humor was on the order
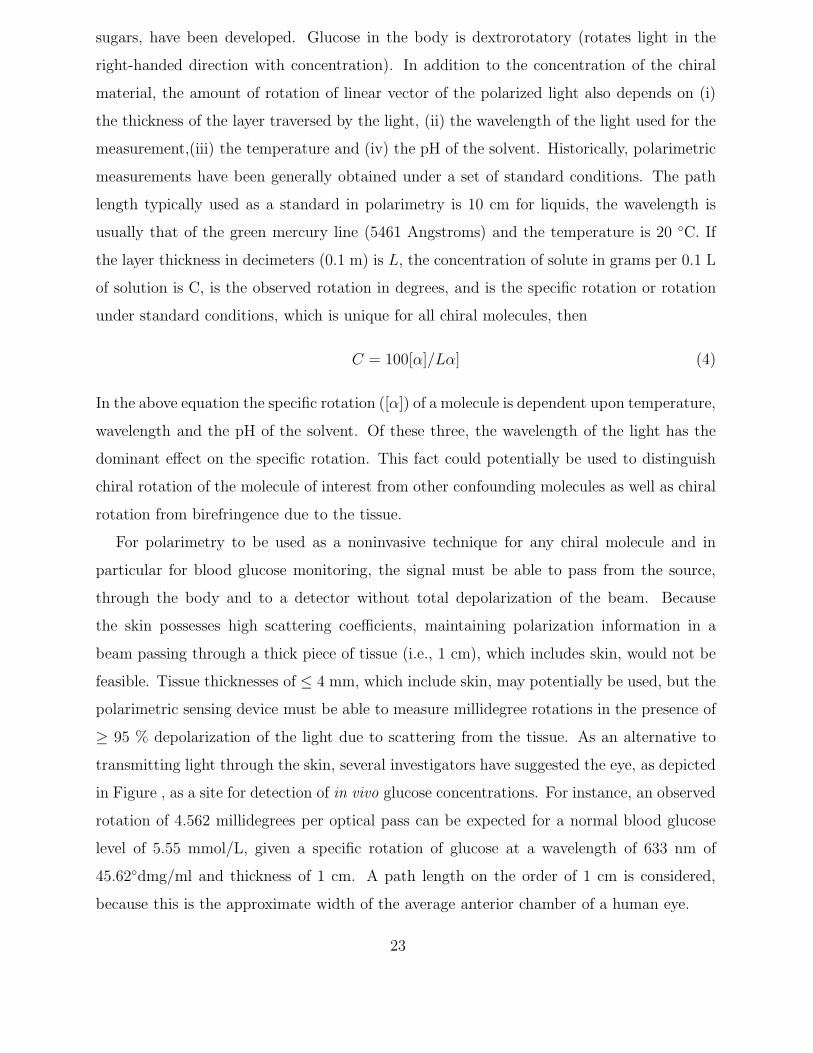
of 30 min. The key technological problem to be overcome before this approach is viable
FIG. 9: Schematic diagram of polarization sensitive change in human eye.
for glucose monitoring in the eye is the confounding rotation due to corneal birefringence
and the variation in this rotation with eye motion artifact. As shown in equation 4, the
rotation is directly proportional to the path length and, thus, it is critical that this length
24
be determined or at least kept constant for each individual subject regardless of the sensing
site. This can potentially be overcome in two ways. The first is to use multiple polarization
states (linear polarization at ± 45 ◦ and left and right circular polarization) to separate
birefringence from chiral rotation as described by the full Jones or Mueller matrix theory.
Finally, there is the possibility that multiple wavelengths could be used because the rotation
due to glucose will vary with wavelength differently than the birefringence.
Very recently, a highly sensitive optical polarimetric sensing system has been
demonstrated[44] using method of Orthogonal Twin Polarized Light (OTPL), which con-
verts micro-angle rotated by optical active substance such as glucose to energy difference of
OTPL By detecting the small polarization rotation of polarized laser light passing through
a glucose containing fluid, this sensing system is suitable for noninvasive glucose monitoring
for diabetes patients. A resolution glucose level of 40 mg/dl has been obtained, with a
0.9777 correlation coefficient between the glucose concentration and the measured values.
The advantages of this system are that it can make use of visible light, reducing influence
of phase significantly, easily available and it can be easily miniaturized.
H. Fluorescence
Several reports of fluorescence-based detection and assays have also appeared in the
literature for a variety of chemicals including folate [45], retinal binding protein for vitamin-
A status [46] and glucose. The fluorescence approach is different from the other optical
approaches described in that it requires the sample be in contact with the sensor and, thus,
cannot be developed as a totally noninvasive technology but rather requires fluid extraction
or an implant. For folate and vitamin A, the fluorescence approaches have been used in
the central laboratory as a process that includes high performance liquid chromatography,
and only recently have technologies for monitoring the vitamin A and glucose levels been
investigated for development into a field instrument. The results reported by Pickup et al
[47]show that intrinsic tissue fluorescence could possibly be used as a basis for non-invasive
glucose monitoring. This technique is based on the detection of the fluorescent cofactor
nicotinamide adenine dinucleotide phosphate (reduced) (NAD(P)H), a product of glucose
metabolism.When exciting at 340 nm NAD(P)H has fluorescence at a wavelength of 440
480 nm. Fluorescence-based sensors are very sensitive and they can even measure glucose
25
at the molecular level. They have been tested in in vitro models and they need to be
studied in vitro. The sensitivity of fluorescence is necessary because this fluid has a glucose
concentration range that is many orders of magnitude smaller (micromolar) than that of
blood glucose.
These fluorescent approaches generally fall into two categories: the glucose oxidase
(GOD)-based sensors and the affinity-binding sensors [48]. In the first category, the sensors
use the electroenzymatic oxidation of glucose by GOX to generate an optically detectable
glucose-dependent signal. Several methods for optically detecting the products of this re-
action and, hence, the concentration of glucose driving the reaction have been devised. All
these approaches have been explored with short-term use in mind because they all use in-
dwelling fiber optic probes. The primary drawback to GOD based sensors is that their
response depends not only on glucose concentration, but also on local oxygen tension in in
vivo conditions. Both fluorescence intensity and lifetime detection need further investigation
[47].
The affinity-based sensors do not depend on local oxygen; however, many of the ear-
lier affinity-binding techniques were investigated for short-term use because they required
indwelling probes. The most prominent fluorescence approaches have exploited the con-
canavalin A (Con A) affinity for polysaccharides. Immobilized Con A was used as a receptor
for competing species of fluorescein isothiocyanate (FITC)-labeled dextran and glucose. In-
creased concentrations of glucose displace FITC-dextran from Con A sites, thus, increasing
the concentration and fluorescence intensity of FITC-dextran in the visible field. The phe-
nomenon of fluorescence resonance energy transfer (FRET), whereby an acceptor in close
proximity to a fluorescent donor can induce fluorescence quenching in the latter as shown
in Figure . In most of the reported literature, glucose detection based upon FRET was
between FITC-bound dextran and tetramethylrhodamine isothiocyanate (TRITC)-bound
Con A. When TRITC-Con A is added to a solution of FITC-dextran, the binding of the
dextran to the Con A results in the required molecular proximity (54A◦) for FRET-based
quenching to occur. Mansouri and Schultz (1984 )[49] reported that glucose concentrations
could be measured in aqueous solutions by a proportional change in FITC fluorescence. The
technique was both very specific to glucose and sensitive to glucose concentration, without
interference from other constituents frequently found in blood plasma.
Lakowicz and co-workers [50] developed similar fluorescent assays for glucose, based on
26
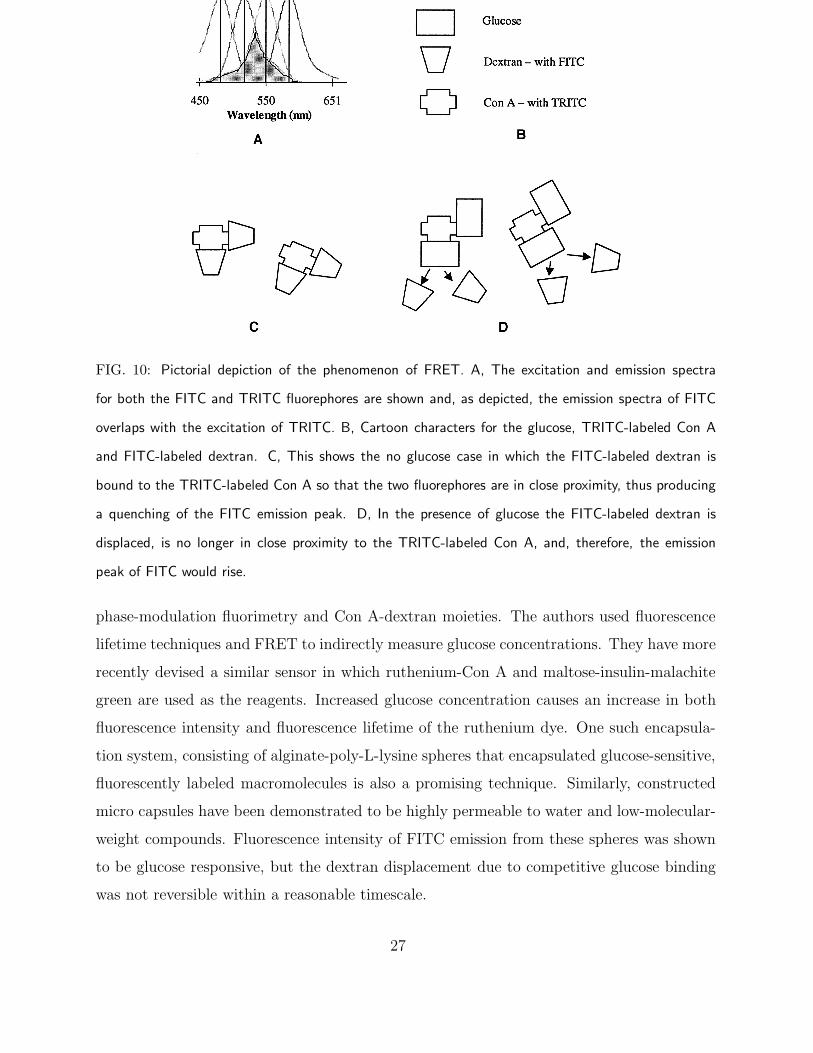
FIG. 10: Pictorial depiction of the phenomenon of FRET. A, The excitation and emission spectra
for both the FITC and TRITC fluorephores are shown and, as depicted, the emission spectra of FITC
overlaps with the excitation of TRITC. B, Cartoon characters for the glucose, TRITC-labeled Con A
and FITC-labeled dextran. C, This shows the no glucose case in which the FITC-labeled dextran is
bound to the TRITC-labeled Con A so that the two fluorephores are in close proximity, thus producing
a quenching of the FITC emission peak. D, In the presence of glucose the FITC-labeled dextran is
displaced, is no longer in close proximity to the TRITC-labeled Con A, and, therefore, the emission
peak of FITC would rise.
phase-modulation fluorimetry and Con A-dextran moieties. The authors used fluorescence
lifetime techniques and FRET to indirectly measure glucose concentrations. They have more
recently devised a similar sensor in which ruthenium-Con A and maltose-insulin-malachite
green are used as the reagents. Increased glucose concentration causes an increase in both
fluorescence intensity and fluorescence lifetime of the ruthenium dye. One such encapsula-
tion system, consisting of alginate-poly-L-lysine spheres that encapsulated glucose-sensitive,
fluorescently labeled macromolecules is also a promising technique. Similarly, constructed
micro capsules have been demonstrated to be highly permeable to water and low-molecular-
weight compounds. Fluorescence intensity of FITC emission from these spheres was shown
to be glucose responsive, but the dextran displacement due to competitive glucose binding
was not reversible within a reasonable timescale.
27
Most recently, the use of poly(ethylene glycol) (PEG) particles to encapsulate the FRET
assay [47] is reported. This polymer has been reported to have numerous properties beneficial
for use in vivo and may potentially overcome many of the drawbacks of the alginate/poly-
L-lysine system. A highly water-soluble hydrogel is formed upon cross-linking. PEG-based
polymers have previously been evaluated for in vivo use as protein drug delivery devices, for
postoperative adhesion prevention and for biocompatible membranes over electrochemical
sensors. PEG-based coatings were reported to improve the biocompatibility of implanted
glucose sensors, without being glucose mass-transfer limiting. The stability and solubility
of numerous proteins are reportedly increased upon conjugation to PEG. Con A has been
conjugated to monomethoxy PEG-5000 while retaining its sugar-binding abilities. It is
possible to create a micro particle-based fluorescent glucose assay system potentially suitable
for subcutaneous implantation and the optimization of the glucose response through control
of the Con A to dextran ratio within the gel.
Overall, the advantage of fluorescence sensors is that they can be made highly sensitive
and highly specific to the analyte of interest and eliminate many of the potential inter-
ferences common with other techniques. However, this technique require the admission of
exogenous chemicals to the subject under study. Additionally, long-term studies are required
to assess the extent to which these chemicals may be susceptible to degradation over time
via consumption, photo-bleaching or denaturation.
I. Time of Flight measurements
Time of Flight (TOF) measurements have been adopted to measure the effect of glucose
on blood in vitro at a wavelength of 906 nm. In photon migration measurements with
the TOF technique, short laser pulses are injected into the sample. The photons of the
pulse undergo many absorption and scattering events when traveling in the sample. The
scattering processes make the photon path lengths longer. Useful data can be obtained
about the optical properties of the sample (µs and µa) by observing the TOF distributions
of the photons and by analysing their shapes. The calculation of different pulse parameters,
such as mean time-of-flight, full width at half maximum (FWHM), integral of the pulse,
center-of-gravity, and moments may help in this analysis. [51].
Fig. shows an example of a TOF measurement system. A picosecond (ps) laser module
28

1
2
3
4
7
8
9
5
6
Laser
10
Attenuator
Reference and measurment signal
FIG. 11: Time-of-flight measurement system. 1: Picosecond laser module, 2: Blanking unit, 3: Fast
speed sweep unit, 4: Streak camera, 5: Digital camera, 6: PC, 7: Camera controller, 8: Power supply
unit, and 9: Delay unit.
with an approximately 30 ps pulse length at a wavelength of 906 nm was used as a light
source and a streak camera was used as a detector in the laser pulse measurements. The
energy of a pulse is 1 nJ. The detection of photons in the streak camera is done with a
photocathode of the streak tube. The light of the photocathode is converted into electrons.
The electrons travel through sweep electrodes, which direct them to the microchannel plate
(MCP). The electrons are multiplied by the MCP and are eventually converted into light on
a phosphor screen. The image on the phosphor screen, containing intensity information as
a function of time, is captured with a CCD camera and shown on a computer screen. The
TOF technique with a streak camera takes a long measurement time.
J. Optical Coherence Tomography
Optical Coherence Tomography (OCT) is based on the detection of back-scattered pho-
tons with an interferometer. The interferometer consists of sample and reference arms, a
light source and a detector. The scanning mechanism in the reference arm enables the de-
tection of photons from different depths in the sample. The glucose sensing is based on
analysing changes in the slope value fitted to the OCT signal depth profile. Esenaliev and
Larin [52] have used OCT for non-invasive glucose monitoring both in vitroand in vivo. OCT
29
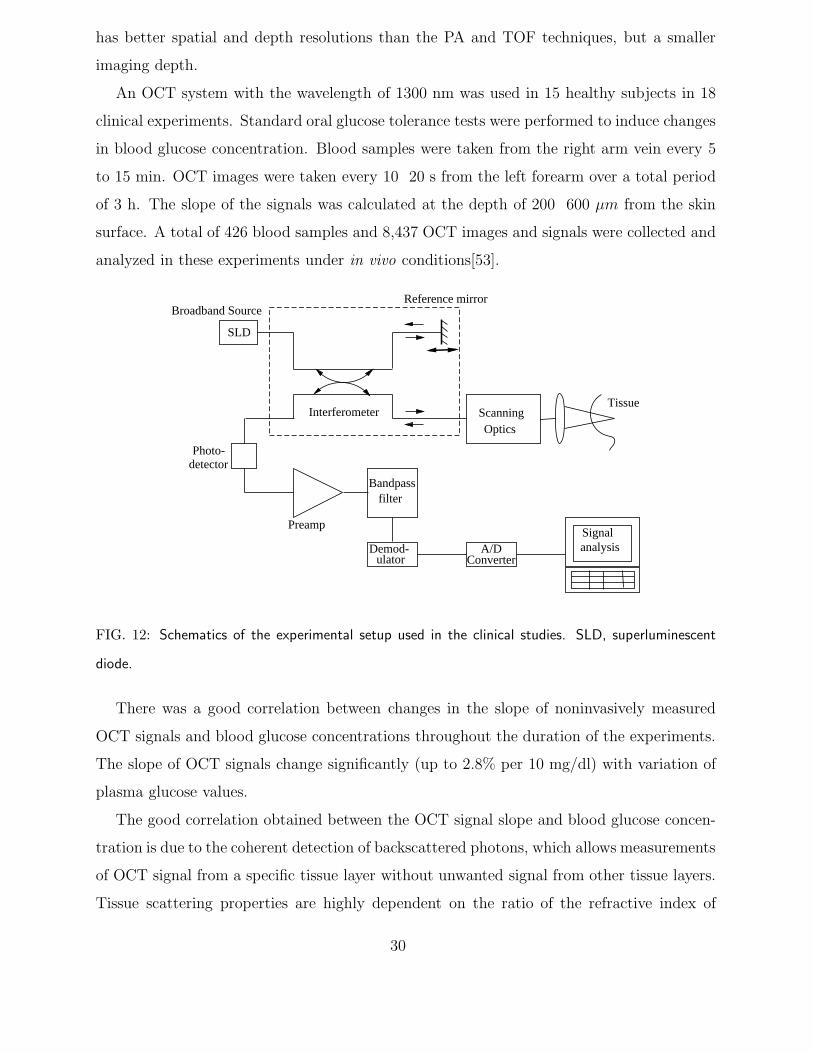
has better spatial and depth resolutions than the PA and TOF techniques, but a smaller
imaging depth.
An OCT system with the wavelength of 1300 nm was used in 15 healthy subjects in 18
clinical experiments. Standard oral glucose tolerance tests were performed to induce changes
in blood glucose concentration. Blood samples were taken from the right arm vein every 5
to 15 min. OCT images were taken every 10 20 s from the left forearm over a total period
of 3 h. The slope of the signals was calculated at the depth of 200 600 µm from the skin
surface. A total of 426 blood samples and 8,437 OCT images and signals were collected and
analyzed in these experiments under in vivo conditions[53].
Broadband Source
SLD
Reference mirror
Interferometer
OpticsScanning
Tissue
Photo-detector
Preamp
Bandpassfilter
Demod-ulator
A/DConverter
Signal analysis
FIG. 12: Schematics of the experimental setup used in the clinical studies. SLD, superluminescent
diode.
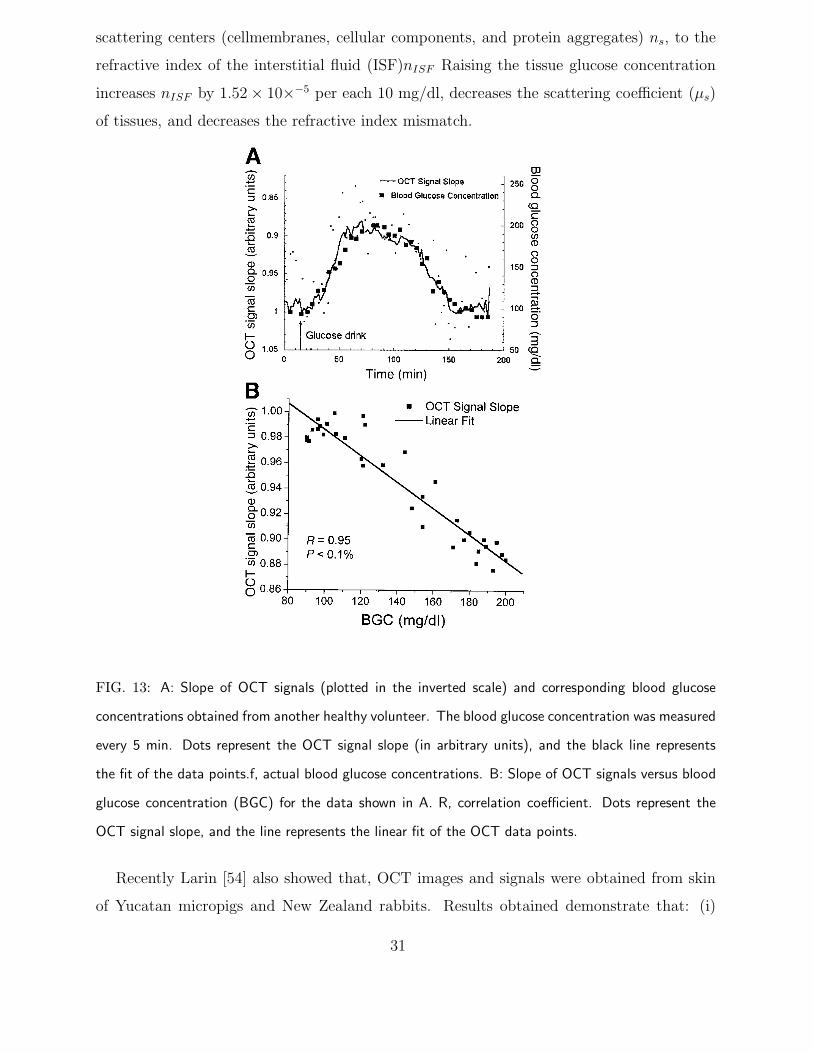
There was a good correlation between changes in the slope of noninvasively measured
OCT signals and blood glucose concentrations throughout the duration of the experiments.
The slope of OCT signals change significantly (up to 2.8% per 10 mg/dl) with variation of
plasma glucose values.
The good correlation obtained between the OCT signal slope and blood glucose concen-
tration is due to the coherent detection of backscattered photons, which allows measurements
of OCT signal from a specific tissue layer without unwanted signal from other tissue layers.
Tissue scattering properties are highly dependent on the ratio of the refractive index of
30
scattering centers (cellmembranes, cellular components, and protein aggregates) ns, to the
refractive index of the interstitial fluid (ISF)nISF Raising the tissue glucose concentration
increases nISF by 1.52 × 10×−5 per each 10 mg/dl, decreases the scattering coefficient (µs)
of tissues, and decreases the refractive index mismatch.
FIG. 13: A: Slope of OCT signals (plotted in the inverted scale) and corresponding blood glucose
concentrations obtained from another healthy volunteer. The blood glucose concentration was measured
every 5 min. Dots represent the OCT signal slope (in arbitrary units), and the black line represents
the fit of the data points.f, actual blood glucose concentrations. B: Slope of OCT signals versus blood
glucose concentration (BGC) for the data shown in A. R, correlation coefficient. Dots represent the
OCT signal slope, and the line represents the linear fit of the OCT data points.
Recently Larin [54] also showed that, OCT images and signals were obtained from skin
of Yucatan micropigs and New Zealand rabbits. Results obtained demonstrate that: (i)
31
several body osmolytes may change the refractive index mismatch between the interstitial
fluid (ISF) and scattering centres in tissue, however the effect of the glucose is approximately
one to two orders of magnitude higher; (ii) an increase of the ISF glucose concentration in
the physiological range (3-30 mM) may decrease the scattering coefficient by 0.22% mM−1
due to cell volume change; (iii) stability of the OCT signal slope is dependent on tissue
heterogeneity and motion artefacts; and (iv) moderate skin temperature fluctuations (±1
◦C) do not decrease accuracy and specificity of the OCT-based glucose sensor, however
substantial skin heating or cooling (several ◦C) significantly change the OCT signal slope.
These results suggest that the OCT technique may provide blood glucose concentration
monitoring with sufficient specificity under normal physiological conditions. We have also
show[55] that there is decrease in reduced scattering coefficient of blood glucose when glucose
concentration is incresed in vivo condition of human skin. We have also developed a novel
mathematical model to extract reduced scattering coefficient of blood glucose. We found
that the correlation obtained between the OCT signal and blood glucose concentration is
due to the coherent detection of backscattered photons.
Very recently, the authors have successfully demonstrated that the technique of optical
coherence tomography can be adopted for non-invassive, non-contact, in-vivo monitoring of
blood glucose.[55] Making use of changes in reduced scattering coefficient due to refractive-
index mismatch between the extracellular fluid and the cellular membranes and armed with
a theoretical model, the authors established a correlation between the glucose concentra-
tion and reduced scattering coefficient (Figure 14). The scattering coefficients are extracted
from the deconvoluted interference signal using Monte Carlo simulation with valid approxi-
mations.
IV. FLUID GLUCOSE BIOCHEMICAL MEASUREMENT
A. Invasive methods
1. Biochemical and Glucometer
Diverse enzymatic sensors based on glucose oxidation have been developed since the
1960s. The earliest blood glucose sensors were mainly used in the clinical environment or
at the bedside for the continuous detection of human glucose level. These devices include
32
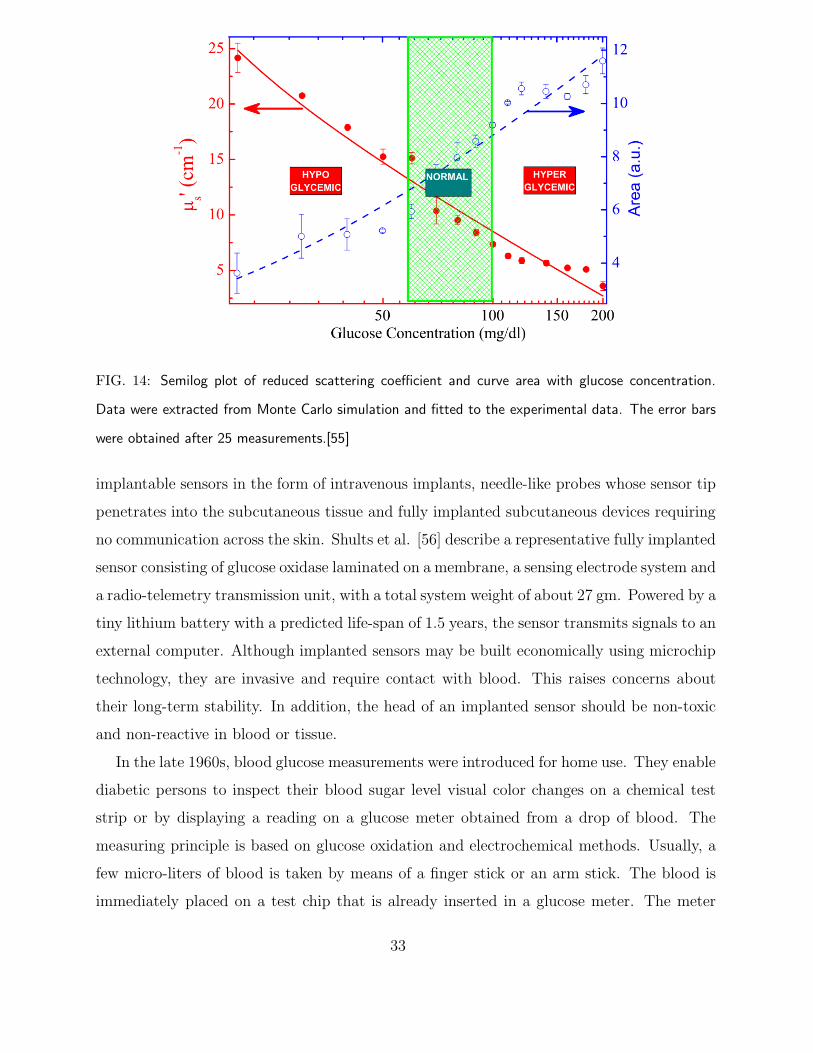
FIG. 14: Semilog plot of reduced scattering coefficient and curve area with glucose concentration.
Data were extracted from Monte Carlo simulation and fitted to the experimental data. The error bars
were obtained after 25 measurements.[55]
implantable sensors in the form of intravenous implants, needle-like probes whose sensor tip
penetrates into the subcutaneous tissue and fully implanted subcutaneous devices requiring
no communication across the skin. Shults et al. [56] describe a representative fully implanted
sensor consisting of glucose oxidase laminated on a membrane, a sensing electrode system and
a radio-telemetry transmission unit, with a total system weight of about 27 gm. Powered by a
tiny lithium battery with a predicted life-span of 1.5 years, the sensor transmits signals to an
external computer. Although implanted sensors may be built economically using microchip
technology, they are invasive and require contact with blood. This raises concerns about
their long-term stability. In addition, the head of an implanted sensor should be non-toxic
and non-reactive in blood or tissue.
In the late 1960s, blood glucose measurements were introduced for home use. They enable
diabetic persons to inspect their blood sugar level visual color changes on a chemical test
strip or by displaying a reading on a glucose meter obtained from a drop of blood. The
measuring principle is based on glucose oxidation and electrochemical methods. Usually, a
few micro-liters of blood is taken by means of a finger stick or an arm stick. The blood is
immediately placed on a test chip that is already inserted in a glucose meter. The meter
33
displays the glucose concentration reading in a few tens of seconds. The main disadvantage
of glucose meters is that they require patients to prick their skin, causing slight physical
pain and harming the skin and the capillaries.
It should be noted, however, that a new silicon micro-needle technique has been developed
by Kumetrix Inc.[57] which gives a minute pain equivalent to a mosquito bite. Normally,
humans are quite unaware of mosquito bites, they only feel a little itch and experience
some swelling at the location of the bite, caused by enzymes that the insect uses to stop
blood from coagulating. Although lacking these chemical agents, the silicon micro-needle is
able to penetrate the skin and draw a blood sample painlessly, because it has a diameter
that is smaller than that of a human hair. The current system consists of a hand-held,
battery-powered, electronic monitor that accepts a cartridge loaded with up to 10 disposable
sampling devices. The heart of the device is a silicon chip that consists of a micro-needle and
a receptacle into which the blood sample is drawn. To take a measurement, the cartridge is
loaded into the monitor and pressed against the skin, causing the micro-needle to penetrate
the skin to draw a very small volume of blood (one-hundredth the size of a blood drop or
100 nano-liters) into the receptacle. Chemicals inside the receptacle react with the glucose
to produce a color. The more intense the color is, the higher the blood glucose level is. The
monitor analyzes the color by lasers and then displays the blood glucose concentration.
B. Permeance measurements in interstitial fluid (minimally- or non-invasive
method)
Interstitial fluid (ISF) is an extracellular fluid through which chemicals (like glucose)
and proteins pass on their way from the capillaries to cells. As a consequence, the glucose
concentration of ISF exhibits a degree of correlation with the glucose concentration in the
capillaries. Some researchers claim that the glucose concentration of ISF is practically
identical to that of blood [58], whereas other investigators maintain that the equivalence is
only about 75% [59]. The difference is probably attributable to the speed of the blood flow:
as the glucose concentration increases, the time delay between observed changes in blood
glucose and ISF glucose is found to be 12 minutes. At any rate, glucose concentration in
the ISF can be used to provide an indicator of the person’s blood glucose value. ISF resides
just under the skin, but the low permeability of the epidermal keratinised layer blocks the
34
permiation of the fluid through the skin. However, during the past few years only few
techniques have been developed for drawing glucose from the skin.
SpectRx Inc. in Norcross, Georgia, has also developed a smart method for accessing ISF
in the skin. The method applies a low-cost, low-energy laser to create micropores in the
stratum corneum. The depth of these micropores is only about 20 µm, just the thickness
of stratum corneum, the layer of dead, nonviable epidermal cells forming the outer skin
surface. The micropores diameter is approximately equal to that of a human hair. The
method offers several advantages. Firstly, the procedure is completely painless. Secondly, it
allows an analysis of the actual ISF, not just partial compositions there of, thereby enabling
a direct glucose concentration measurement by conventional glucose assay techniques such
as the glucose oxidase method. The continuous monitoring system is usable for three days
at a time. The test patch can be placed on almost anywhere (arms, abdomen and legs) on
the human body with no loss of accuracy.
Finally, and most importantly, the procedure does not require calibration from a finger
stick blood measurement. Clinical tests involving 20 diabetic patients show that the corre-
lation between SpectRx ISF measurements and blood glucose levels is as high as 0.90 in the
60- 400 mg/dl glucose range. Another, relatively similar method has also been reported [59].
In this method, the stratum corneum is first stripped, where after effusion ISF is sampled
by suction and its glucose concentration is measured by an ion sensitive FET.
Ultrasound, especially low frequency ultrasound, can induce cavitation in and around
the skin. The oscillation and collapse of cavitation bubbles disorder the lipid bilayers of
the skin, resulting in enhanced skin permeability. The process is known as sonophoresis. It
was first used to enhance the transdermal delivery of drugs, but its application range was
soon extended to include the transdermal monitoring of glucose and other analytes [63].
Accomplishing a transdermal glucose flux through the skin involves two steps. First, the
skin is pre-treated by a low frequency ultrasound (20 kHz, for instance). Second, glucose is
extracted using passive diffusion, low intensity ultrasound or a vacuum. Without ultrasonic
pre-treatment, the permeability of glucose through a rat’s skin is less than 4 ± 3 µm/hr.
Ultrasonic pre-treatment and extraction increase this permeability to 0.026 ± 0.011cm/hr
(or 0.034 ± 0.025 cm/hr for vacuum extraction), representing 100-fold enhancement. Clinical
data shows that the skin retains a high level of permeability for about 15 hours after the
ultrasonic treatment. The correlation coefficient between monitored transdermal glucose
35
level and venous glucose level is about 0.9. The time delay between these glucose levels is
about 12 minutes. Patients report no pain during the ultrasound and the technique leaves
no visible effects on the skin.
Other minimally invasive techniques for monitoring glucose concentration include a pain-
less, hollow lancet used for collecting tiny drops of ISF (Integ), a microdialysis probe, an
inserted sensor (MiniMed Technologies) and a fluorescent sensor (Sensor For Medicine).
Nevertheless, all these techniques harm the skin, albeit slightly.
1. Photonic Crystal Glucose-Sensing Material
Alexeev et al [60] recently reported a photonic crystal glucose-sensing material, which con-
sists of a crystalline colloidal array embedded within a polymer network of a polyacrylamide-
poly (ethylene glycol) hydrogel with pendent phenylboronic acid groups. They used
new boronic acid derivatives such as 4-amino-3-fluorophenylboronic acid and 4-carboxy-
3-fluoropheny lboronic acid as the molecular recognition elements to achieve sensing at
physiologic pH values.
The improved photonic glucose-sensing material sensed glucose in the range of the 100
µmol/litre concentrations found in tear fluid. The detection limits were 1 µmol/litre in
synthetic tear fluid. The visually evident diffraction color shifted across the entire visible
spectral region from red to blue over the physiologically relevant tear-fluid glucose concen-
trations. This sensing material is selective for glucose over galactose, mannose, and fructose.
These glucose sensors have properties appropriate for use in such glucose-sensing applica-
tions as ocular inserts or diagnostic contact lenses for patients with diabetes mellitus.
2. Measurement of Glucose by Metabolic Heat Conformation Method
Kyung Cho et. al [61] developed a method, named as the metabolic heat conformation
(MHC) method, for the noninvasive measurement of blood glucose. The MHC method
involves the measurement of physiologic indices related to metabolic heat generation and
local oxygen supply, which correspond to the glucose concentration in the local blood supply.
They used noninvasive thermal and optical sensors on the fingertip of an individual to
36
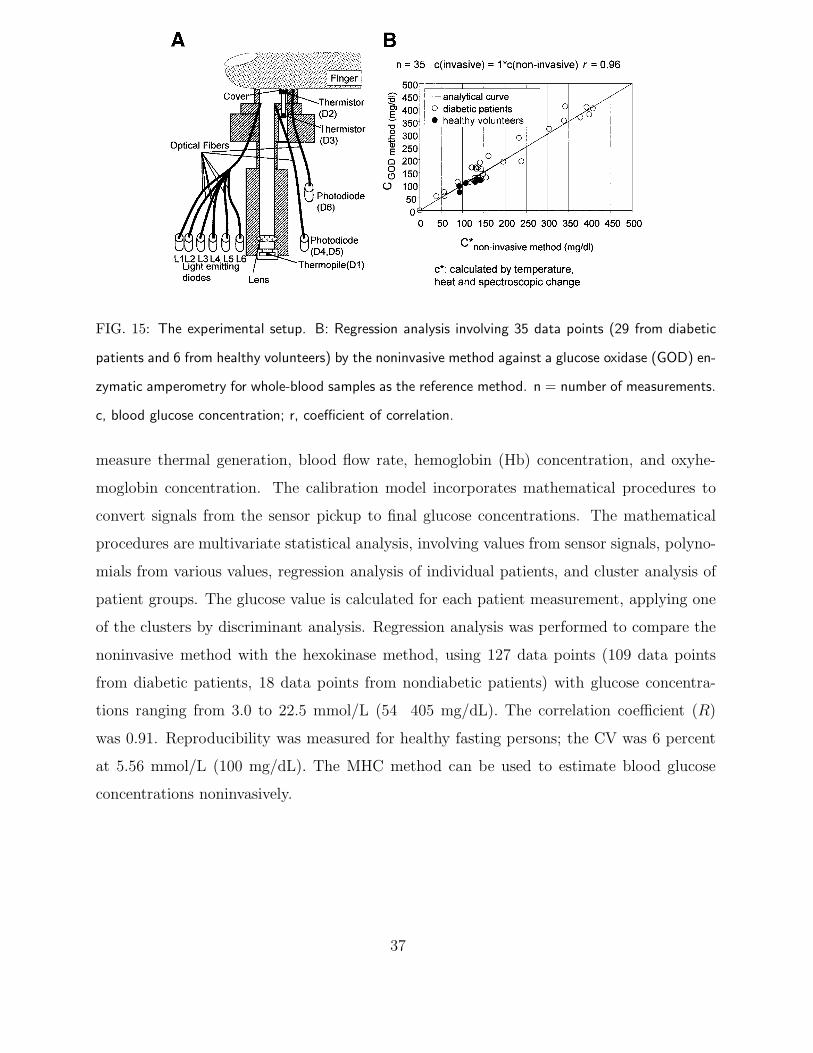
FIG. 15: The experimental setup. B: Regression analysis involving 35 data points (29 from diabetic
patients and 6 from healthy volunteers) by the noninvasive method against a glucose oxidase (GOD) en-
zymatic amperometry for whole-blood samples as the reference method. n = number of measurements.
c, blood glucose concentration; r, coefficient of correlation.
measure thermal generation, blood flow rate, hemoglobin (Hb) concentration, and oxyhe-
moglobin concentration. The calibration model incorporates mathematical procedures to
convert signals from the sensor pickup to final glucose concentrations. The mathematical
procedures are multivariate statistical analysis, involving values from sensor signals, polyno-
mials from various values, regression analysis of individual patients, and cluster analysis of
patient groups. The glucose value is calculated for each patient measurement, applying one
of the clusters by discriminant analysis. Regression analysis was performed to compare the
noninvasive method with the hexokinase method, using 127 data points (109 data points
from diabetic patients, 18 data points from nondiabetic patients) with glucose concentra-
tions ranging from 3.0 to 22.5 mmol/L (54 405 mg/dL). The correlation coefficient (R)
was 0.91. Reproducibility was measured for healthy fasting persons; the CV was 6 percent
at 5.56 mmol/L (100 mg/dL). The MHC method can be used to estimate blood glucose
concentrations noninvasively.
37
3. Reverse iontophoresis used in Glucowatch
Iontophoresis is a process in which a weak electric current is employed to transport
charged molecules through intact skin. The method also enables an increased transport of
polar, as yet uncharged, species. The moving, charged molecules carry glucose and other
chemical molecules found in the ISF through intact skin (reverse iontophoresis). Once the
fluid is extracted from the skin, it can be collected and its glucose concentration is deter-
mined by glucose oxidation methods. Hence, the measurement can be performed continu-
ously without puncturing the skin. However, the slow transit time of the fluid through the
skin produces a 20-minute lag in the blood glucose reading. In addition, the glucose con-
centration in the fluid is much lower than in the blood. While the size of the glucose sample
varies with time and the current applied, the concentration is generally in the micromolar
range, while that of blood glucose is in the millimolar range. Another drawback is that the
test requires periodic calibration with blood testing. As a result, reverse iontophoresis is
not a truly non-invasive method. Moreover, the accuracy of the measurement can be dra-
matically affected by the presence of sweat, and the low electric current passing through the
skin may cause irritation. The most successful iontophoresis-based glucose monitor is the
GlucoWatch [Biographe, a wristwatch-type device developed by Cygnus Inc.[62] in Redwood
City, California]. The device collects glucose molecules in gel collection discs that are part
of a single-use AutoSensor. containing the enzyme glucose oxidase. As glucose enters the
discs, it reacts with the glucose oxidase in the gel to form hydrogen peroxide. A biosensor
in contact with each gel collection disc detects the hydrogen peroxide, and generates an
electronic signal. The monitor uses a calibration value entered previously by the patient
to convert the signal into a glucose measurement, which is displayed on the monitor and
then stored in memory. The sensor is designed to take three measurements every hour and
must be replaced every 12 hours. The patient is required to perform a routing blood-based
calibration every day. To avoid the sweat effect, the GlucoWatch monitor measures skin
conductance, which increases with sweat. If the skin conductance exceeds a predetermined
threshold, the measurement is skipped.
38
V. CONCLUSION
Diabetes mellitus is a complex group of syndromes that have in common a disturbance
in the body’s use of glucose, resulting in an elevated blood sugar. Once detected, sugar
diabetes can be controlled by an appropriate regimen that should include diet therapy, a
weight reduction program for those persons who are overweight, a program of exercise and
insulin injections or oral drugs to lower blood glucose. Blood glucose monitoring by the
patient and the physician is an important aspect in the control of the devastating complica-
tions (heart disease, blindness, kidney failure or amputations) due to the disease. Intensive
therapy and frequent glucose testing has numerous benefits. With ever improving advances
in diagnostic technology, the race for the next generation of bloodless, painless, accurate
glucose instruments has begun. However, many hurdles remain before these products reach
the commercial marketplace.
Calibration of the instruments and validation of the results obtained by the optical meth-
ods under different environmental conditions and used by different patient populations (i.e.,
different ages, sizes and ethnic origins) must be performed. The devices may have to be
calibrated to individual users.
Recent instrumentation lacks specificity due to substantial chemical and physical inter-
ferences. The devices use multivariate regression analyses that convert the optical signal to
a glucose concentration. Large amounts of data are used to build the glucose model and
must take into consideration the concentration range, sampling environment and other fac-
tors involved in the analysis. First an instrument must be designed that accurately detects
glucose concentration. Correlation and clinical interpretation of this value, in respect to the
patient’s true glucose value, is imperative for optimum therapy and disease management.
Considerable progress has been made in the development of non-invasive glucose devices
however, at this time, frequent testing using invasive blood glucose determination via finger-
stick provides the best information for diabetes disease management. Industry spokespersons
have said: anyone who can come up with a viable noninvasive or painless technique is going
to make a lot of money. Peoples lives are involved ... and we don’t want to suggest that this
technology is right around the corner. This is very tricky, difficult work.
39
Acknowledgments
The authors thank DST and AICTE for financial Support.
[1] Davidson MB. Diabetes Mellitus - Diagnosis and Treatment. 3rd Edition, Churchill Living-
stone, New York 1991; 231 - 32.
[2] Auxter S. Disease Management Models of Diabetes Take Root. Clinical Chemistry News 1996;
November, 5 - 16.
[3] Auses JP, Cook SL & Maloy JT. Chemiluminescent enzyme method for glucose. Analytical
Chemistry 1975; 47: 244 - 49.
[4] Eggins BR. Biosensors: An introduction. John Wiley & Sons Ltd and BG Teubner. 1996.
[5] Shults MC, Rhodes RK, Updike SJ, Gilligan BJ & Reining WN. A telemetry instrumentation
system for monitoring multiple subcutaneously implanted glucose sensors. IEEE Transactions
on Biomedical Engineering 1994; 41: 937 - 942.
[6] Fischer U, Rebrin T, Woedtke TV & Abel P. Clinical usefulness of the glucose concentration
in the subcutaneous tissue properties and pitfalls of electrochemical biosensors. Hormones
Metabolism Research 1994; 26: 515 - 522.
[7] Rouane A (2008) Indirect Method of Non Invasive In-vitro Measurement of D+ Glucose.
Sensors & Transducers 93:69-81.
[8] Jagemann KU, Fischbacher C, Danzer K et. al. Application of Near-Infrared Spectroscopy for
Non-Invasive Determination of Blood/Tissue Glucose Using Neural Networks. Zeitschrift fur
Physikalische Chemie 1995; 191:179 - 90.
[9] Bruulsema JT, Essenpreis M, Heinemann L et.al. Detection of Changes in Blood Glucose
Concentration in- vivo with Spatially Resolved Diffuse Reflectance. OSA Conf. On Biomedical
Optical Spectroscopy and Diagnostics 1996.
[10] Haaland DM & Thomas EV. Partial least-squares methods for spectral analysis 1: relation
to other quantitative calibration methods and the extraction of qualitative information. Anal-
ysis Chemistry 1988; 60:1193 - 1202; Heise HM, Marbach R, Janatsch G & Krse-Jarres JD.
Mulitivariate determination of glucose in whole blood by attenuated total reflection infrared
spectroscopy. Analysis Chemistry 1989; 61: 2009 - 2015. ; Martens H & Naes T (1991) Mul-
40
tivariate Calibration. Wiley, Chichester.
[11] Robinson MR, Eaton RP, Haaland DM, Koepp GW, Thomas EV, Stallard BR & Robinson
PL. Noninvasive glucose monitoring in diabetic patients: a preliminary evaluation. Clinical
Chemistry 1992; 38(9): 1618-22.
[12] Burmeister J & Arnold MA. Evaluation of measurement site for non-invasive blood glucose
sensing with near-infrared transmission spectroscopy. Clinical Chemistry 1999; 45(9): 1621 -
1627.
[13] Blank TB, Ruchti TL, Malin SF & Monfre SL. The use of near-infrared diffuse reflectance
for the non-invasive prediction of blood glucose levels. IEEE Laser Electro-Optics Society
Newsletter 1999; 13(5): 9-12.
[14] Heise HM, Marbach R, Koschinsky TH & Gries HM. Non-invasive blood glucose sensors based
on near-infrared spectroscopy. Artificial Organs 1994; 18: 439 - 447; Marbach R, Koschinsky
TH, Gries HM & Heise HM. Non-invasive glucose assay by near infrared diffuse reflectance
spectroscopy of the human inner lip. Applied Spectroscopy 1993; 47: 875 - 881; Heise HM &
Marbach R. effect of data pre-treatment on the non-invasive blood measurement by diffuse
reflectance near-IR spectroscopy. SPIE Proceedings 1994; 2089: 114 - 115.
[15] Jagemann KU, Fischbacher C, Danzer K, Muller UA & Mertes B. Application near infrared
spectroscopy for non-invasive determination of blood /tissue glucose using neural network.
Zeitschrift fr Physikalische Chemie 1995; 1915: 179 - 190; Fischbacher C, Jagemann KU,
Danzer K, Muller UA, Papenkrodt L & Schuler J. Enhancing calibration models for non-
invasive near-infrared spectroscopic blood glucose determinations. Fresenius Journal of Analy-
sis Chemistry 1997; 359: 78-82; Muller UA, Mertes B, Fischbacher C, Jagemann KU & Danzer
K. Non-invasive blood glucose monitoring by means of new infrared spectroscopic methods for
improving the reliability of the calibration models. International Journal of Artificial Organs
1997; 20: 285 -2 90.
[16] Marbach R, Koschinsky TH, Gries FA & Heise HM. Non-invasive Blood Glucose Assay by
Near-Infrared Diffue Reflectance Spectroscopy of the Human Inner Lip. Appl. Spect. 1993;
47(7): 875 - 881.
[17] Heise HM, Marbach R,Janatsc G, Kruse-Jarres JD. Determination of Glucose in Whole Blood
Attenuated Total Reflection Infrared Spectroscopy. Anal. Chem. 1989; 61: 2009-2015; Kaji-
wara K, Uemura T, Kishikawa H et.al. Non-invasive Measurement of Blood Glucose Concen-
41
trations by Analyzing Fourier Transform Infrared Absorbance Spectra Through Oral Mucosa.
Med. & Biol. Eng. Comput. 1993; 31: 17-22.
[18] Zeller H, Novak P & Landgraf R Blood glucose measurement by infrared spectroscopy. The
International Journal of Artificial Organs 1989; 12: 129 135.
[19] Mendelson Y, Clermont AC, Peura RA & Lin BC. Blood glucose measurement by multi-
ple attenuated total reflection and infrared absorption spectroscopy. IEEE Transactions on
Biomedical Engineering 1990; 37: 458 465.
[20] Klonoff DC, Braig J, Sterling B, Kramer C, Goldberger D & Trebino R. Midinfrared
spectroscopy for non-invasive blood glucose monitoring. IEEE Laser Electro-Optics Society
Newsletter 1998; 12: 1314.
[21] Hall J, Pollard A. Clin Chem 1992; 38:16 - 23.
[22] Tang F, Wang X, Wang D and Li J (2008) Non-Invasive Glucose Measurement by Use of
Metabolic Heat Conformation Method. Sensors 8: 3335-3344.
[23] Lambert J, Storrie-Lombardi M & Borchert M. Measurement of physiological glucose levels
using Raman spectroscopy in a rabbit aqueous humor model. LEOS Newsletter 1998; 4: 19
22.
[24] Berger AJ, Wang Y & Feld MS. Rapid, non-invasive concentration measurements of aqueous
biological analytes by near-infrared Raman spectroscopy.Applied Optics 1996; 35: 209 212;
Berger AJ, Koo TW, Itzkan I, Horowitz G & Feld MS. Multicomponent blood analysis by
near-infrared Raman spectroscopy. Applied Optics 1999; 38: 2916 26.
[25] Goetz MJ, Cot GL, Erckens R, March W & Motamedi M. Application of a multivariate tech-
nique to Raman spectra for quantification of body chemicals. IEEE Transactions on Biomedical
Engineering 1995; 42: 728731.
[26] Enejder AMK, Scecina TG, Oh J, Hunter M, Shih W-C, Sasic S, Horowitz GL & Feld MS.
Raman spectroscopy for non-invasive glucose measurements. Journal of Biomedical Optics
2005; 10: 031114 (19).
[27] Tam AC. Applications of photoacoustic sensing techniques. Reviews of Modern Physics 1986;
58: 381 431.
[28] Christison GB & MacKenzie HA. Laser photoacoustic determination of physiological glucose
concentrations in human whole blood. Medical & Biological Engineering & Computing 1993;
31: 284 290; Quan KM, Christison GB, MacKenzie HA & Hodgson P. Glucose determination
42
by a pulsed photoacoustic technique: an experimental study using a gelatin-based tissue
phatom. Physics in Medicine and Biology 1993; 38: 1911 1922; MacKenzie HA, Ashton HS,
Spiers S, Shen Y, Freeborn SS, Hannigan J, Lindberg J & Rae P. Advances in photoacoustic
non-invasive glucose testing. Clinical Chemistry 1999; 45: 1587 95; Ashton HS, MacKenzie
HA, Rae P, Shen YC, Spiers S & Lindberg J. Blood glucose measurements by photoacoustics.
CP463 Photoacoustic and Photothermal Phenomena: 10th International Conference 1999; 570
572; Zhao Z. Pulsed photoacoustic techniques and glucose determination in human blood and
tissue. Dissertation 2002. University of Oulu, Finland; Bednov AA, Savateeva EV & Oraevsky
AA. Glucose monitoring in whole blood. Proceedings of SPIE 2003; 3816: 12 -16.
[29] Laser photoacoustic determination of
[30] Hayward GB & MacKenzie HA. Laser photoacoustic determination of physiological glucose
concentrations in human whole blood. Medical and Biological Engineering and Computing
1993; 31: 248-290. Duncan A, Hannigan J, Freeborn SS et. al. A portable non-invasive blood
glucose monitor. Transducers Eurosensors 1995; 9: 455 - 458.
[31] Bednov AA, Karabutov AA, Savateeva EV, March WF & Oraevsky AA. Monitoring glucose
in vivo by measuring laser-induced acoustic profiles. Proceedings of SPIE 2000; 3916: 9 - 18.
[32] Heinemann L & Schmelzeisen-Redeker G. Non-invasive continuous glucose monitoring in Type
1 diabetic patients with optical glucose sensors. Diabetologia 1998; 41:848 85; Bruulsema JT,
Hayward JE, Farrell TJ et.al. Correlation between blood glucose concentration in diabetics
and non-invasively measured tissue optical scattering coefficient. Optics Letters 1997; 22: 190
192.
[33] Bruulsema JT, Essenpreis M, Heinemann L et. al. Detection of changes in blood glucose con-
centration in vivo with spatially resolved diffuse reflectance. OSA Biomedical Optical Spec-
troscopy and Diagnostics 1996; 3: 2 6. Heinemann L, Krmer U, Kltzer HM, et. al. Non-invasive
glucose measurement by monitoring scattering coefficient during oral glucose tolerance test.
Diabetes Technology & Therapeutics, 2000; 2:211 220.
[34] Khalil OS, Yeh S-j, Lowery MG et. al. Temperature modulation of the visible and near infrared
absorption and scattering coefficients of human skin. Journal of Biomedical Optics 2003; 8:
191 205.
[35] Yeh SJ, Khalil OS, Hanna CF & Kantor S. Near-infrared thermo-optical response of the
localized reflectance of intact diabetic and non-diabetic human skin. Journal of Biomedical
43
Optics 2003; 8: 534 544.
[36] Poddar R, Sharma SR, Sen P and Andrews JT. Measurement of Glucose Concentration in Tur-
bid Media Using Diffused Reflectance.International Journal of Biotechnology & Biochemistry
2006; 2(1): 31 - 40.
[37] Patterson M, Moulton JD, Wilson B, Berndt KW & Lakowicz JR. Frequency-domain re-
flectance for the determination of the scattering and absorption properties of tissue. Applied
Optics 1991; 30: 4474 - 4476; Fishkin JB & Gratton E. Propagation of photon density wave
in strongly scattering media containing an absorbing semi-infinite plane boundedly a straight
edge. Journal of Optical Society of America 1993; A10: 127 - 140; Fantini S, Franceschini MA,
Fishkin JB, Barbieri B & Gratton E Quantitative determi nation of the absorption spectra of
chromophones in strongly scattering media: a light-emittingdiode based techniques. Applied
Optics 1994, 33: 5204 - 5213.
[38] Maier JS, Walker SA, Fantini S, Franceschini MA & Gratton E Possible correlation between
blood glucose concentration and the reduced scattering coefficient of tissue in the near infrared.
Optics Letters 1994, 19(24): 2062-2064.
[39] Rabinovitch B, March WF & Adams RL Noninvasive glucose monitoring of the aqueous
humour of the eye. Diabetes Care 1982, 5: 254-265.
[40] Cot GL., Cameron B. D. Noninvasive polarimetric measurement of glucose in cell culture
media. J. Biomed. Opt. 1997; 2:275-281.
[41] King TW, Cot GL, McNichols R, Goetz MJ, JR Multispectral polarimetric glucose detection
using a single pockels cell. Opt. Eng. 1994;33(8):2746-2753; King T. W., Cot G. L, McNichols
R., Goetz M. J., JR Multispectral polarimetric glucose detection using a single pockels cell.
Opt. Eng. 1994;33(8):2746 - 2753.
[42] Cameron BD, Baba JS & Cot GL Optical polarimetry applied to the development of a nonin-
vasive in vivo glucose monitor. SPIE-BiOS 2000 Conference proceedings V3923. Cameron, BD
& Cot, GL (1996) Polarimetric glucose sensing in aqueous humor utilizing digital closed-loop
control. Proceedings of the 18th International Conference of the IEEE Engineering in Medicine
and Biology Society. CD Rom extended abstract 1.4.2-5; Cot GL, Cameron BD Noninvasive
polarimetric measurement of glucose in cell culture media. J. Biomed. Opt. 1997;2:275-281.
[43] Chou C., Han CY, Kuo WC, Huang YC, Feng CM, Shyu JC. Noninvasive glucose monitoring
in vivo with an optical heterodyne polarimeter. Appl. Opt. 1998;37:3553 - 3557; Cot GL, Fox
44
MD, Northrop RB Noninvasive optical polarimetric glucose sensing using a true phase mea-
surement technique. IEEE Trans. Biomed. Eng. 1992;39:752 - 756; Goetz MJ, JR Microdegree
Polarimetry for Glucose Detection 1992 Master of science thesis University of Connecticut,
Storrs, CT. Groner W., Winkelman JW, Harris AG, Ince C, Bouma GJ, Messmer K, Nadeau
RG; Orthogonal polarization spectral imaging: a new method for the study of the microcircu-
lation. Nat. Med. 1999; 5:6-10; Cot GL, Fox MD & Northrup RB (1992) Noninvasive optical
glucose sensing using a true phase measurement technique. IEEE Transaction of Biomedical
Engineering 39(7): 752-756.; Pohjola S (1966) The glucose content of the aqueous humor in
man. Acta Ophthalmologica Supplementum 88: 11-80.; Cough DA (1982) the composition
and optical rotary dispersion of bovine aqueous humor. Diebetes Care 5: 266-270. Cot GL &
Cameron BD (1997) Noninvasive polarimetric measurement of glucose in cell culture media.
Journal of Biomedical Optics 2(3): 275 - 28
[44] Wang H and Wu B (2008) Development of a noninvasive glucose measurement system based on
orthogonal twin polarized lights and its primary experimental investigation. Yi Peng, Xiaohong
Weng (Eds.): APCMBE 2008, IFMBE Proceedings 19:298301 (Springer-Verlag Berlin 2008).
[45] McShane MJ, Rastegar S, Pishko M, Cot GL. Monte Carlo modeling for implantable fluores-
cent analyte sensors. IEEE Trans. Biomed. Eng. 2000;47:624 - 632; Vahteristo LT, Ollilainen
V, Koivistonen PE, Varo P Improvements in the analysis of reduced folate monoglutamates
and folic acid in food by high-performance liquid chromatography. J. Agric. Food Chem.
1996;44:477 - 482; Craft NE, Haitema T, Brindle LK, Yamini S, Humphrey JH, West KP, JR
Retinol analysis in dried blood spots by HPLC. J. Nutr. 2000;130:882 - 885
[46] McNichols RJ, Cot GL Optical glucose sensing in biological fluids: an overview. J. Biomed.
Opt. 2000;5:5-16; McNichols R. J., Cot G. L. Development of a non-invasive polarimetric
glucose sensor. IEEE-LEOS Newsletter 1998;12:30 - 31.
[47] Pickup JC, Hussain F, Evans ND, Rolinski OJ & Birch DJS (2005) Fluorescence based glucose
sensors. Biosensors and Bioelectronics 20: 2555 - 2565.
[48] Russell RJ, Pishko MV, Gefrides CC, McShane MJ, Cot GL A fluorescence-based glucose
biosensor using concanavalin A and dextran encapsulated in a poly(ethylene glycol) hydro-
gel. Anal. Chem. 1999;71:3126 - 3132; Russell RJ, Pishko MV, Gefrides CC, Cot GL. A
fluorescent glucose assay using poly-L-lysine and calcium alginate microencapsulated TRITC-
succinyl-concanavalin A and FITC-dextran 1998 Proceedings of the 20th Annual International
45
Conference of the IEEE Engineering in Medicine and Biology Society Hong Kong.
[49] Schultz JS, Mansouri S, Goldstein IJ Affinity sensor: a new technique for developing im-
plantable sensors for glucose and other metabolites. Diabetes Care 1982;5:245 - 253; Mansouri
S., Schultz J. S. A miniature optical glucose sensor based on affinity binding. Nat. Biotechnol.
1984;2:885 - 890;
[50] Lakowicz JR, Maliwal B. Optical sensing of glucose using phase-modulation fluorimetry. Anal.
Chim. Acta 1993;271:155 - 164;
[51] Yoo KM, Das BB, Liu F & Alfano RR (1993) Ultrashort laser pulse propagation and imaging
in biological tissue and model random media - steps towards optical mammography. SPIE
Medical Optical Tomography: Functional Imaging and Monitoring IS11: 425 - 449; Leonardi
L & Burns DH (1999) Quantitative measurements in scattering media: photon time-of-flight
analysis with analytical descriptors. Applied Spectroscopy 53:628-636.;Kinnunen M & Myllyl
R (2004) Methods for evaluating the optical properties of a material from measured laser
pulse shapes. Odimap IV, Oulu, Finland: 340-345; Arridge SR & Schweiger M (1995) Direct
calculation of the moments of the distribution of photon time of flight in tissue with a finite-
element method. Applied Optics 34: 2683-2687.
[52] Esenaliev RO, Larin KV & Larina IV (2001) Non-invasive monitoring of glucose concentration
with optical coherence tomography. Optics Letters 26: 992 994.
[53] Larin KV, Larina I, Motamedi M, Gelikonov V, Kuranov R & Esenaliev R (2001) Potential
application of optical coherence tomography for non-invasive monitoring of glucose concen-
tration. Proceedings of SPIE 4263: 8390; Larin KV, Motamedi M, Eledrisi MS & Esenaliev
RO (2002) Non-invasive blood glucose monitoring with optical coherence tomography, a pilot
study in human subjects. Diabetes Care 25: 22632267; Larin KV (2002) Measurement of tis-
sue optical properties with optical coherence tomography: implication for non-invasive blood
glucose concentration monitoring. Dissertation, the University of Texas Medical Branch at
Galveston; Chance B, Liu H, Kitai T & Zhang Y (1995) Effects of solutes on optical proper-
ties of biological materials: models, cells, and tissues. Analytical Biochemistry 227: 351 362;
Larin KV, Ashitkov TV, Larina IV, Petrova IY, Eledrisi M, Motamedi M & Esenaliev RO
(2002) Optical coherence tomography technique for non-invasive blood glucose monitoring:
phantom, animal and human studies. Proceedings of SPIE 4619: 157164.
[54] Larin KV, Ashitkov TV, Larina I, Petrova I, Eledrisi M, Motamedi M & Esenaliev RO (2004)
46
Optical coherence tomography and non-invasive blood glucose monitoring: a review. Proceed-
ings of SPIE 5474: 285290.
[55] Poddar R, Sharma SR, Sen P and Andrews JT (2008) Study of Correlation Between Glucose
Concentration and Reduced Scattering Coefficients in Turbid media using Optical Coherence
Tomography, Current Science 95: 340-345.
[56] Shults MC, Rhodes RK, Updike SJ, Gilligan BJ & Reining WN (1994) A telemetry instru-
mentation system for monitoring multiple subcutaneously implanted glucose sensors. IEEE
Transactions on Biomedical Engineering 41: 937-942.
[57] Kimura J, Kuriyama T, Kikuchi M & Arai T (1992) non-invasive monitoring of glucose in
blood. Chemical Sensor Technology 4: 241-251; Kuriyama T (1994) A portable blood glucose
monitoring system. Proceedings of Electrochemical Society 9414: 10-16.
[58] Fischer U, Rebrin T, Woedtke TV & Abel P (1994) Clinical usefulness of the glucose con-
centration in the subcutaneous tissue properties and pitfalls of electrochemical biosensors.
Hormones Metabolism Research 26: 515-522.
[59] Sternberg F, Meyerhoff C, Mennel FJ, Bischof F & Pfeiffer EF (1995) Subcutaneous glucose
concentration: its real estimation and continuous monitoring. Diabetes Care 18: 1266-1269;
Tamada JA, Bohannon NJV & Potts RO (1995) Measurement of blood glucose in diabetic
subjects using non-invasive transdermal extraction. Nature Medicine 1: 1198-1201.
[60] Vladimir AL, Das S, David N. Finegold and Sanford A. Asher, Photonic Crystal Glucose-
Sensing Material for Noninvasive Monitoring of Glucose in Tear Fluid, Clinical Chemistry.
2004;50:2353-2360.
[61] Kyung OC, Kim YK , Mitsumaki H & Kuwa K. Noninvasive Measurement of Glucose by
Metabolic Heat Conformation Method, Clinical Chemistry. 2004;50:1894 - 1898.
[62] http://www.cygn.com/glucowatch.html.
[63] Kost J, Mitragotri S, Gabbay RA, Pishko M & Langer R (2000) Transdermal monitoring
of glucose and other analytes using ultrasound. Nature Medicine 6(3): 347-350; Mitragotri
S, Coleman M, Kost J, & Langer R (2000) Transdermal extraction of analytes using low
frequency ultrasound. Pharmaceutical Research 17(4): 466-470.
47