
Jonathan B. VanGeest, PhD School of Community Health and Policy Morgan State University
When do Word Embeddings Accurately Reflect Surveys on our Beliefsabout People?
Kenneth JosephComputer Science and Engineering
University at BuffaloBuffalo, NY, 14226
Jonathan H. MorganUniversity of Applied Sciences
Fachhochschule PotsdamPotsdam, Germany
Abstract
Social biases are encoded in word embeddings.This presents a unique opportunity to study so-ciety historically and at scale, and a uniquedanger when embeddings are used in down-stream applications. Here, we investigate theextent to which publicly-available word em-beddings accurately reflect beliefs about cer-tain kinds of people as measured via traditionalsurvey methods. We find that biases found inword embeddings do, on average, closely mir-ror survey data across seventeen dimensionsof social meaning. However, we also findthat biases in embeddings are much more re-flective of survey data for some dimensionsof meaning (e.g. gender) than others (e.g.race), and that we can be highly confident thatembedding-based measures reflect survey dataonly for the most salient biases.
1 Introduction
In April of 2015, protests erupted over the mur-der of Freddie Gray, Jr. Questions about what tocall those protesting quickly became the focus ofa national debate. In an interview on CNN withErin Burnett,1 Baltimore City Councilman CarlStokes admonished then-President Barack Obamaand then-Mayor Stephanie Rawlings-Blake for us-ing the word thugs to refer to the protesters. Bur-nett challenged Stokes’ admonition, claiming theprotesters were indeed thugs because “They knowit’s wrong to steal and burn.” Stokes responded bystating the protesters were “...children who havebeen set aside [and] marginalized.”
The argument between Burnett and Stokes isover the way we label people, the meanings ofthose labels, and the impacts these meanings canhave. Councilman Stokes wants to avoid using thelabel “thug” because of its established, negative
1http://nymag.com/intelligencer/2015/04/carl-stokes-to-cnn-thug-is-racially-charged.html
|| || | || || ||| ||||
| || || ||||||| |||
||| || || ||| ||| |
| | | | ||| || ||||| ||
|| || ||||| || | |||
||||||||| |||| ||
| | || ||| || |||| | |
|| |||||| || ||| | |
| ||| || ||||||| || |
| ||| || || ||| || |||
| ||| |||| | | ||| |||
| ||| ||||| |||| || |
| ||| || ||| || ||| ||
| |||| || | ||| |||
| ||||| | || || || | |
|||| || | |||| |||| |
thug child judge secretary
Potency(weak−−strong)
Evaluation(bad−−good)
Gender(man−−woman)
Black(not black−−black)
BeliefD
imen
sion
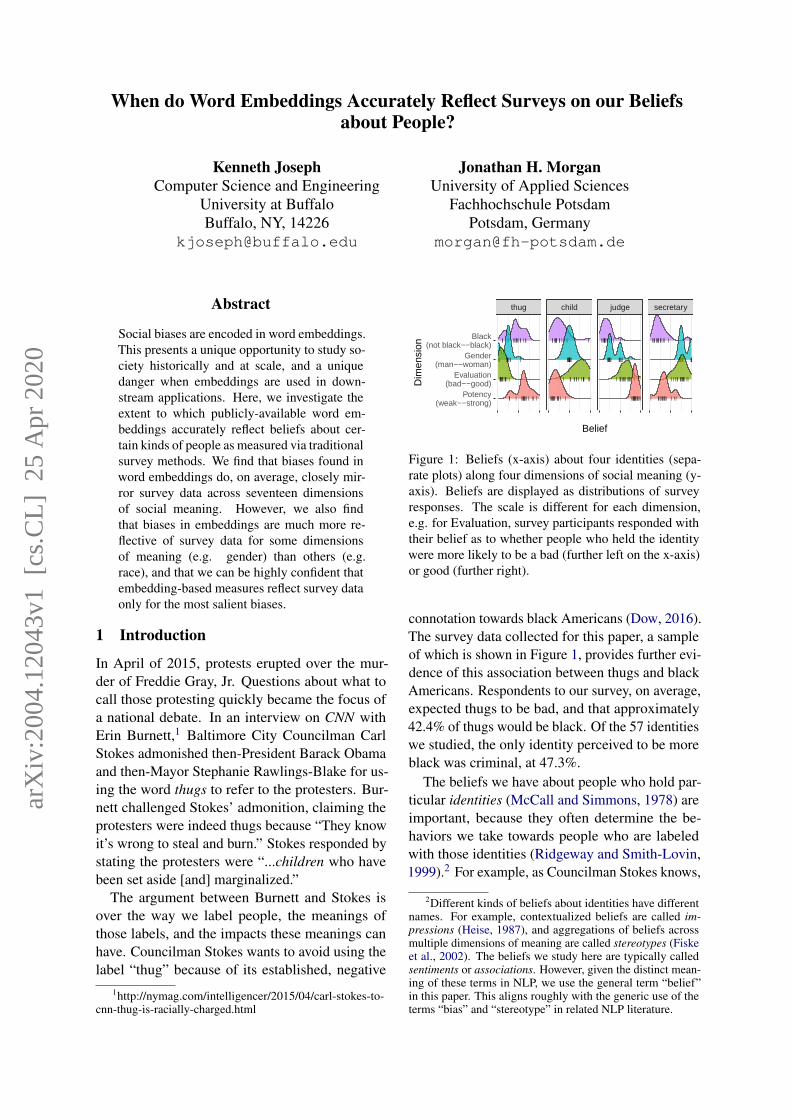
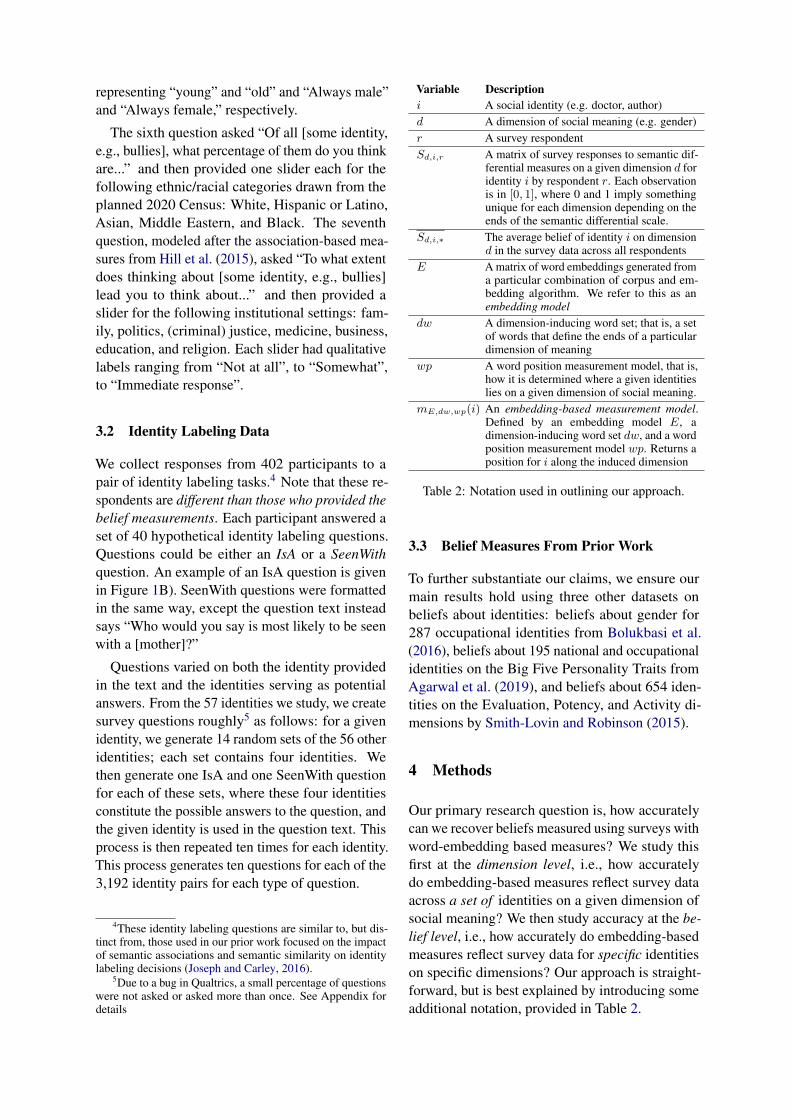
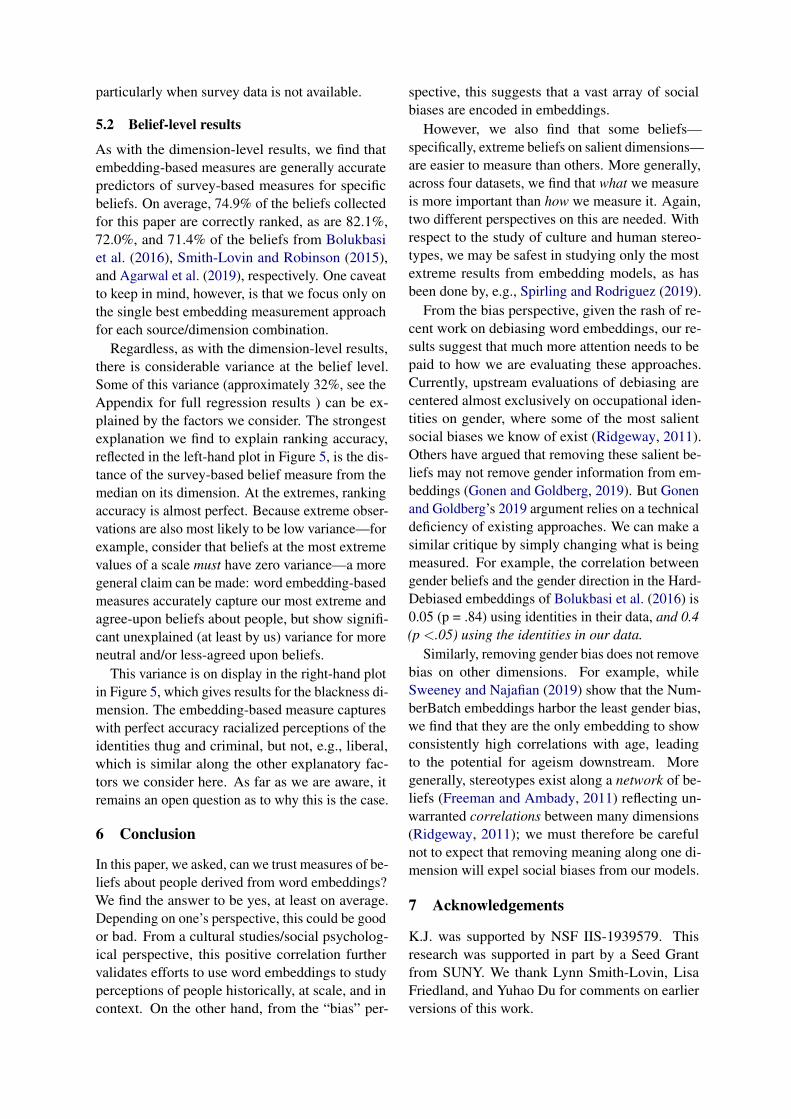
Figure 1: Beliefs (x-axis) about four identities (sepa-rate plots) along four dimensions of social meaning (y-axis). Beliefs are displayed as distributions of surveyresponses. The scale is different for each dimension,e.g. for Evaluation, survey participants responded withtheir belief as to whether people who held the identitywere more likely to be a bad (further left on the x-axis)or good (further right).
connotation towards black Americans (Dow, 2016).The survey data collected for this paper, a sampleof which is shown in Figure 1, provides further evi-dence of this association between thugs and blackAmericans. Respondents to our survey, on average,expected thugs to be bad, and that approximately42.4% of thugs would be black. Of the 57 identitieswe studied, the only identity perceived to be moreblack was criminal, at 47.3%.
The beliefs we have about people who hold par-ticular identities (McCall and Simmons, 1978) areimportant, because they often determine the be-haviors we take towards people who are labeledwith those identities (Ridgeway and Smith-Lovin,1999).2 For example, as Councilman Stokes knows,
2Different kinds of beliefs about identities have differentnames. For example, contextualized beliefs are called im-pressions (Heise, 1987), and aggregations of beliefs acrossmultiple dimensions of meaning are called stereotypes (Fiskeet al., 2002). The beliefs we study here are typically calledsentiments or associations. However, given the distinct mean-ing of these terms in NLP, we use the general term “belief”in this paper. This aligns roughly with the generic use of theterms “bias” and “stereotype” in related NLP literature.
arX
iv:2
004.
1204
3v1
[cs
.CL
] 2
5 A
pr 2
020
we do not behave the same way towards childrenas we do towards thugs. This is because, as re-flected in Figure 1, people generally believe thatchildren are weak and good, whereas thugs are badand powerful. This leads us to want to do thingslike help children, versus wanting to attack thugs(Heise, 2007).
However, measuring beliefs is difficult. Tradi-tionally, we have relied on surveys to collect thesemeasurements. But there are tens of thousandsof identities (Joseph et al., 2016; MacKinnon andHeise, 2010), and beliefs about them can formalong many different dimensions of socioculturalmeaning (e.g. gender, race, and others displayed inFigure 1). Measuring beliefs about many identities,on many dimensions, using traditional surveys cantherefore be difficult. Further, measuring the evo-lution of beliefs is often impossible with surveys,because survey data is extremely sparse historically(Garg et al., 2018). Finally, measuring how thesebeliefs change with additional contextual informa-tion (e.g. beliefs about specific teachers, ratherthan teachers in general) is notoriously difficultwith survey data (Heise, 2007).
Recognizing these difficulties, scholars havebegun to develop NLP tools to measure beliefsabout identities historically, at scale, and in context(Joseph et al., 2017; Hoyle et al., 2019; Fast et al.,2016; Garg et al., 2018; Field et al., 2019). Mostrecent methods derive these measures by manipulat-ing word embeddings. Studying beliefs enmeshedin word embeddings is also critical because embed-dings are widely used in downstream NLP models,which are themselves beginning to label people, forexample, as job-worthy or not (De-Arteaga et al.,2019). Measuring beliefs about people using em-beddings therefore serves the dual purpose of un-derstanding human biases and of ensuring such bi-ases are not propelled further along by algorithms.
However, work remains to understand whenembedding-based measures of beliefs about identi-ties accurately reflect more traditional survey mea-sures, and why some beliefs may be reflected moreaccurately than others. The present work combinesnew and existing survey data with an extensive setof embedding-based measurement strategies to ex-plore this at both the dimension level and the belieflevel. At the dimension level, for example, weask, how well do embeddings capture beliefs aboutgender, relative to race? And if differences exist,why? Such issues have arisen in existing work, for
example, where Garg et al. (2018) see correlationsof .65 between embedding-based and survey-basedmeasures of beliefs about gender, but only .15 forethnicity-based beliefs. At the beliefs-level, weask, for example, how much more accurately dowe capture beliefs about the Potency (strength) ofthugs, relative to beliefs about the Potency of chil-dren? Accuracy at this level is critical for linkinghistorical trends in social behavior to societal-levelbeliefs about particular identities.
Our primary contributions are as follows:• We show that what we measure is more impor-
tant than how we measure it in determiningthe correlation between embedding-based andsurvey-based measures of beliefs about peo-ple.• At the dimension level, the beliefs we measure
most accurately are also the most importantfor how we label others.• At the belief level, assuming we can identify a
good measurement model, embedding-basedmeasures are significantly more accurate formore extreme, and more agreed upon, beliefs.
All code and data necessary to replicate the analysisin this article can be found at https://github.com/kennyjoseph/embedding_impressions.
2 Related Work
Our work is grounded in literature on measuringbeliefs about identities in social psychology in gen-eral and, more specifically, via word embeddings.We address these two literatures separately here.
2.1 Belief Measurement in Social Psychology
A common approach for measuring beliefs aboutspecific identities is to assume a dimensional rep-resentation—that is, to assume a set of distinctdimensions of social meaning can be used to char-acterize how we think and feel about someone thatholds a particular identity. From this dimensionalperspective, two primary questions arise.
First, what are the dimensions along which be-liefs form? Social psychologists have identifiedthree classes of important dimensions: traits, affec-tive meanings, and semantic associations. Traitsrepresent visible—although also socioculturallydefined—characteristics like age, gender, and race(Freeman and Ambady, 2011). Affective dimen-sions of social meaning represent how we feelabout a given person and/or identity (Todorov et al.,2015; Fiske et al., 2002; Heise, 2007). Here,
we use the three affective dimensions proposedby Heise (2007) and that are popular in sociol-ogy (Rogers et al., 2013)— Evaluation (good-ness/badness), Potency (strength/weakness), andActivity (active/passive). Finally, social psycholo-gists often characterize beliefs about identities interms of semantic associations to particular con-cepts (Freeman and Ambady, 2011) or institutions(MacKinnon and Heise, 2010). For example, peo-ple link the identities brother and sister togetherbecause they are both associated with the familyinstitution. In the present work, we collect beliefsfor seventeen different dimensions of social mean-ing, incorporating age, race, gender, evaluation,potency, activity, and six institutional associations.
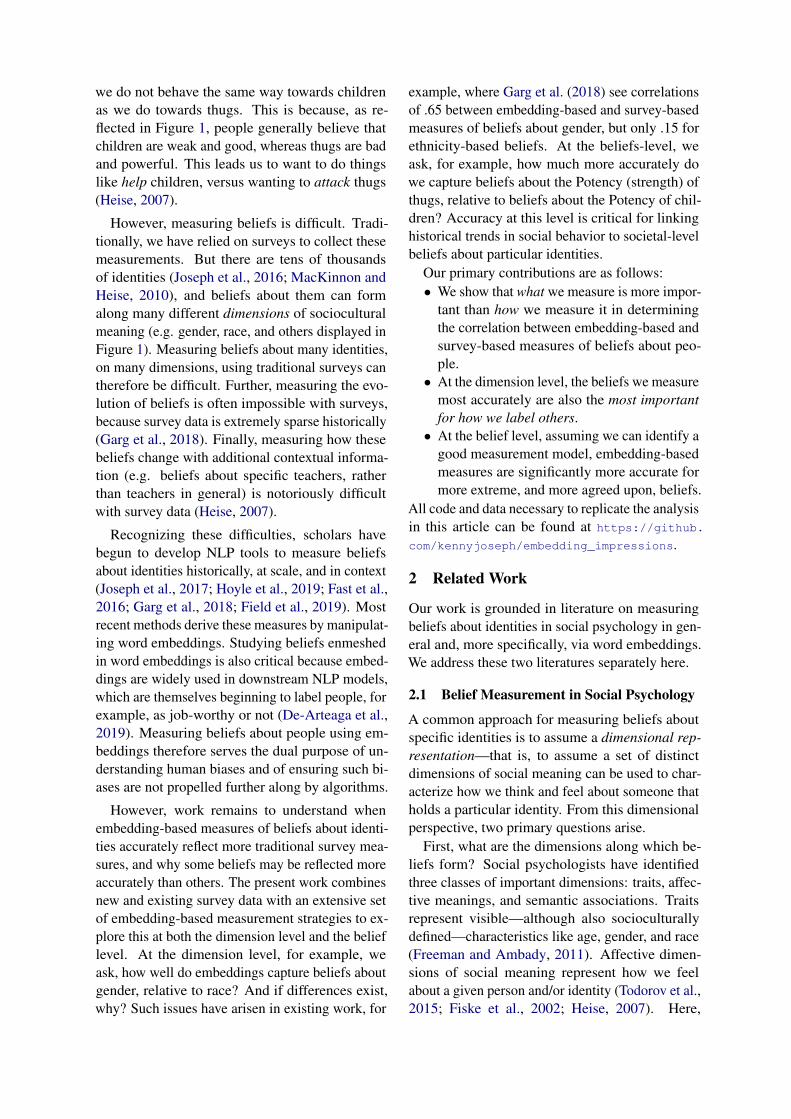
Second, given a theorized dimension of mean-ing, how should we measure society-wide beliefsabout where particular identities lie on that dimen-sion? Here, we adopt perhaps the most commonapproach, which uses semantic differential scaleson surveys (Osgood et al., 1975). The semanticdifferential technique asks respondents to placean identity on a sliding scale with two opposingconcepts (e.g. weak and strong, see the examplein Figure 2A). Finally, it is worth noting that here,like in most social psychology research, we assumethat responses from survey participants generalizeto American culture writ large. This assumption isbuilt on the well-established culture-as-consensusparadigm in psychological anthropology (Karabat-sos and Batchelder, 2003; Batchelder and Romney,1988), and empirical work showing that people tendto agree on the vast majority of their beliefs aboutpeople (Heise, 2007). Nonetheless, many counter-examples exist (Berger et al., 1992; Smith-Lovinand Douglas, 1992). We leave questions about howto address these issues to future work.
2.2 Measuring beliefs with embeddings
Embedding-based approaches to measuring be-liefs typically follow a three step process of cor-pus/embedding selection, dimension selection, andword position measurement.
Corpus/Embedding Selection Several recentworks have argued that the corpus used can impactmeasures of beliefs about people derived from wordembeddings (Lauscher and Glavas, 2019; Mirzaevet al., 2019; Sweeney and Najafian, 2019). Forexample, Brunet et al. (2019) show how to reducegender bias in embeddings by removing particulardocuments from a corpus. However, several oth-
ers have shown that in their analyses, the corpusused does not significantly impact results (Spirlingand Rodriguez, 2019; Garg et al., 2018; Kozlowskiet al., 2019; Caliskan et al., 2017). Differencesin the embedding model used have also been ob-served to impact measurements (Chaloner and Mal-donado, 2019). Again, though, robustness checksfrom other studies suggest a limited effect beyondthe somewhat general hyperparameters of windowsize and the number of dimensions estimated (Garget al., 2018; Kozlowski et al., 2019).
Dimension Selection To measure beliefs, onefirst must select a dimension along which the be-lief is assumed to be held. Much of the literaturehas focused on dimensions related to gender orrace. Others, however, have seen value in movingbeyond these dimensions (Agarwal et al., 2019;Sweeney and Najafian, 2019). Most relevant isthe work of Kozlowski et al. (2019), who studythe association of 59 concepts across 20 differentdimensions of sociocultural meaning, and that ofAn et al. (2018), who induce 732 different dimen-sions using WordNet to study contextual effectsof linguistic meaning. While neither work focusesheavily on identities, these efforts compliment ourgoal of studying a broad range of dimensions ofsocial meaning.
Scholars then identify a direction within the em-bedding that represents this dimension. To do so,an approach similar to the semantic differentialidea is used. Terms are selected to represent thetwo ends of the dimension. For example, to identifythe gender direction, words at one end might be “he”and “him”, and words at the other end, “she” and“her”. Scholarship varies on how these dimension-inducing word sets are selected. For example, sev-eral scholars have used demographically genderedand/or racialized names (Bolukbasi et al., 2016;Caliskan et al., 2017), while others have relied oncareful extraction of concepts from dictionaries andthesauri (Kozlowski et al., 2019). Kozlowski et al.(2019) find that having more words at each endgenerally provides better measurements, and oth-ers have found a need to use frequently occurringterms (Ethayarajh et al., 2019; Brunet et al., 2019).Beyond these observations, however, scholars havegenerally found stable results as long as reasonableword sets are selected.
Word Position Measurement Finally, the po-sition of each identity along this direction mustbe identified. Doing so entails two major deci-
sions. First, how should one quantify the direction,given the dimension-inducing words? For example,Bolukbasi et al. (2016) identify the direction bytaking the first dimension of a PCA on the full setof direction words. Second, how should one definethe position of points along this line? For example,several works use the cosine similarity between theidentified “bias direction” and the embedding ofeach identity. Scholars have also recently proposedsupervised methods for word position measurement(Sweeney and Najafian, 2019; Agarwal et al., 2019).Such approaches are important, but assume the ex-istence of some training data, which may or maynot be available in certain measurement contexts.We therefore do not explore these methods furtherin the present work.
In sum, using embeddings to measure beliefsrequires a series of decisions, the impacts of whichare still debated. Below, we provide the most com-prehensive study to date on the importance of thesedecisions on measurement quality.
3 Survey Data
We collect two new survey datasets for this paper.The first measures beliefs about the 57 identities3 inTable 1 on seventeen dimensions of social meaningdescribed below. The second measures the ways inwhich a set of survey respondents label people withthese identities in hypothetical social situations.
We used a cluster-based approach to select the 57identities we study. We study nine sets of six iden-tities, where each set has been shown in prior workto be related in some way. Five of the sets are char-acterized by a salient association to a specific insti-tution described by MacKinnon and Heise (2010).Three sets are characterized by salient trait similari-ties and differences on gender, age or race/ethnicity.And one set of identities is included where all iden-tities have strong negative Evaluations. Finally, weinclude three random identities as a mechanismfor comparison in other work not described here.For further details on the selection criteria, surveypopulations, and results, see the Appendix.
3.1 New Belief Measurement DataWe collected survey data on beliefs about identi-ties from 247 respondents on Amazon’s Mechan-ical Turk. Each survey respondent provided re-
3Because not all embedding models account for bigrams,we removed “police officer” from all analyses in this paper.However, for future purposes, we include it in our descriptionof the data here.
(a)
(b)
Figure 2: A) Example of a semantic differential ques-tion used to measure beliefs about identities (here, forthe identity “thug” on the Evaluation dimension); B)Example of a hypothetical identity labeling questionused to evaluate the importance of different dimen-sions.
Dimension IdentitiesPolitics conservative, Democrat, liberal, Republi-
can, politician, senatorFamily brother, sister, daughter, son, father,
motherLaw judge, criminal, lawyer, witness, cop, po-
lice officerMedicine doctor, physician, surgeon, nurse, patient,
dentistBusiness executive, consultant, secretary, intern,
banker, bossGender woman, guy, girl, boy, man, ladyAge teenager, kid, child, toddler, adult, minorRace &Ethnicity
black, white, Hispanic, Asian, Arab,American
NegativeEvaluation
thug, idiot, jerk, goon, punk, bully
Random principal, scientist, coach
Table 1: The 57 identities we collect data on. Notethat the dimensions used for sampling do not includeall dimensions used in our belief measurement study.
sponses for four different, randomly selected iden-tities. Each identity was given to a total of 15different respondents. For each identity, we askeda set of seven questions, some of which had mul-tiple subparts. Following prior work, beliefs foraffective dimensions were solicited using a slider-based Likert scale. For the Evaluative dimension,the opposing ends of the Likert scale were labeled“bad, awful” and “good, nice”. For the Potencydimension, “powerless, little” and “powerful, big”,and for the Activity dimension, “slow, quiet, inac-tive” and “fast, noisy, active”. See Heise (2010) formore details on the development of these questions.The fourth and fifth question used Likert scales tomeasure beliefs about age and gender, with ends
representing “young” and “old” and “Always male”and “Always female,” respectively.
The sixth question asked “Of all [some identity,e.g., bullies], what percentage of them do you thinkare...” and then provided one slider each for thefollowing ethnic/racial categories drawn from theplanned 2020 Census: White, Hispanic or Latino,Asian, Middle Eastern, and Black. The seventhquestion, modeled after the association-based mea-sures from Hill et al. (2015), asked “To what extentdoes thinking about [some identity, e.g., bullies]lead you to think about...” and then provided aslider for the following institutional settings: fam-ily, politics, (criminal) justice, medicine, business,education, and religion. Each slider had qualitativelabels ranging from “Not at all”, to “Somewhat”,to “Immediate response”.
3.2 Identity Labeling Data
We collect responses from 402 participants to apair of identity labeling tasks.4 Note that these re-spondents are different than those who provided thebelief measurements. Each participant answered aset of 40 hypothetical identity labeling questions.Questions could be either an IsA or a SeenWithquestion. An example of an IsA question is givenin Figure 1B). SeenWith questions were formattedin the same way, except the question text insteadsays “Who would you say is most likely to be seenwith a [mother]?”
Questions varied on both the identity providedin the text and the identities serving as potentialanswers. From the 57 identities we study, we createsurvey questions roughly5 as follows: for a givenidentity, we generate 14 random sets of the 56 otheridentities; each set contains four identities. Wethen generate one IsA and one SeenWith questionfor each of these sets, where these four identitiesconstitute the possible answers to the question, andthe given identity is used in the question text. Thisprocess is then repeated ten times for each identity.This process generates ten questions for each of the3,192 identity pairs for each type of question.
4These identity labeling questions are similar to, but dis-tinct from, those used in our prior work focused on the impactof semantic associations and semantic similarity on identitylabeling decisions (Joseph and Carley, 2016).
5Due to a bug in Qualtrics, a small percentage of questionswere not asked or asked more than once. See Appendix fordetails
Variable Descriptioni A social identity (e.g. doctor, author)d A dimension of social meaning (e.g. gender)r A survey respondentSd,i,r A matrix of survey responses to semantic dif-
ferential measures on a given dimension d foridentity i by respondent r. Each observationis in [0, 1], where 0 and 1 imply somethingunique for each dimension depending on theends of the semantic differential scale.
Sd,i,∗ The average belief of identity i on dimensiond in the survey data across all respondents
E A matrix of word embeddings generated froma particular combination of corpus and em-bedding algorithm. We refer to this as anembedding model
dw A dimension-inducing word set; that is, a setof words that define the ends of a particulardimension of meaning
wp A word position measurement model, that is,how it is determined where a given identitieslies on a given dimension of social meaning.
mE,dw,wp(i) An embedding-based measurement model.Defined by an embedding model E, adimension-inducing word set dw, and a wordposition measurement model wp. Returns aposition for i along the induced dimension
Table 2: Notation used in outlining our approach.
3.3 Belief Measures From Prior Work
To further substantiate our claims, we ensure ourmain results hold using three other datasets onbeliefs about identities: beliefs about gender for287 occupational identities from Bolukbasi et al.(2016), beliefs about 195 national and occupationalidentities on the Big Five Personality Traits fromAgarwal et al. (2019), and beliefs about 654 iden-tities on the Evaluation, Potency, and Activity di-mensions by Smith-Lovin and Robinson (2015).
4 Methods
Our primary research question is, how accuratelycan we recover beliefs measured using surveys withword-embedding based measures? We study thisfirst at the dimension level, i.e., how accuratelydo embedding-based measures reflect survey dataacross a set of identities on a given dimension ofsocial meaning? We then study accuracy at the be-lief level, i.e., how accurately do embedding-basedmeasures reflect survey data for specific identitieson specific dimensions? Our approach is straight-forward, but is best explained by introducing someadditional notation, provided in Table 2.
4.1 Dimension-level analysis
At the dimension level, we consider first how dif-ferent factors relating to the measurement itself im-pact accuracy. We then study why measurementsare more accurate for some dimensions than others.We do so by connecting the degree of accuracy fora given dimension to how important that dimensionis in how survey respondents select identities forothers in our identity labeling task.
4.1.1 Impact of measurement strategy
As discussed above, the accuracy of embedding-based measurements may vary across propertiesof the dimension being measured, as well as theway in which the embedding-based measurementis constructed. We first study the relative effectsof a) the dimension (d), b) the embedding model(E), c) the dimension-inducing wordset (dw), andd) the word position measurement model (wp) onthe accuracy of embedding-based measurements.As is standard in the literature, we use thePearson correlation between the mean surveyresponse and the output of the embedding-basedmeasure as our definition of accuracy. Thatis, for a given dimension d, survey dataset S,embedding-based measure mE,dw,wp, and set ofidentities of size I , we compute the accuracy ofthe embedding-based measure as the Pearson cor-relation between {Sd,i0,∗, Sd,i1,∗, ..., Sd,iI ,∗} and{mE,dw,wp(i0),mE,dw,wp(i0), ...,mE,dw,wp(iI)}.We then run a linear regression to understand howaccuracy varies across the factors considered.
Our analysis involves all dimensions of socialmeaning studied in the four survey datasets de-scribed above. For embedding models, E, weconsider twelve different publicly available cor-pus/embedding combinations from prior work. Toconstruct dimension-inducing wordsets, dw, we us-ing one of three approaches. The first is to use thesame terms as were placed on the semantic differ-ential scale on the survey (e.g. powerless, powerful,little, big for Potency, as in Figure 2a). In certaincases, we also include a survey-augmented condi-tion that extends this wordset using a thesaurus,after discussion amongst authors. Third, where ap-plicable, we use direction-inducing wordsets fromprior work. Finally, we consider several of the ma-jor established approaches in the literature for wordposition measurement wp. We use the approachesfrom Kozlowski et al. (2019), Swinger et al. (2019),Ethayarajh et al. (2019), Bolukbasi et al. (2016),
and Garg et al. (2018). In the Appendix, we pro-vide full details on the different values of E, dw,and wp that we consider.
4.1.2 Explaining variation across dimensionsAs we will show, controlling for E, dw and wp,there are large differences in accuracy across di-mensions. To better understand these differencesacross dimension, we compute two measurements.First, Kozlowski et al. (2019) show that the vari-ance of the survey data on a dimension, that is,Var(Sd,i0,∗, Sd,i1,∗, ..., Sd,in,∗), is strongly corre-lated with the accuracy of embedding-based mea-sures. However, they also note that “high explainedvariance... reveals little about how these valencesare deployed in social life” (pg. 930). Here, wetherefore compute a second measure that connectsvariance of the survey data on a given dimension toa significant social outcome, how strongly peoplerely on that dimension when labeling other people.
To do so, we first construct a 57x17 matrix Xof scaled-and-centered mean survey responses foreach identity on each dimension in our survey data,i.e. Xi0,d0 = Sd0,i0,∗. We then construct an obser-vation with a binary outcome that pairs the identityin the question with each possible answer. Theoutcome is 1 if the answer was selected, and 0 oth-erwise. For example, in Figure 2B), the pairingscreated would be “mother, adult”, “mother, sister”,“mother, son”, and “mother, lady”. If the respon-dent answered “lady”, then the outcomes would be0, 0, 0, and 1, respectively. The 40.3% of questionswhere respondents answered “all are equally un-likely” were ignored. In total, we obtained 9,597responses where the respondent did not answer“All are equally (un)likely,” split roughly evenlybetween SeenWith and IsA questions.
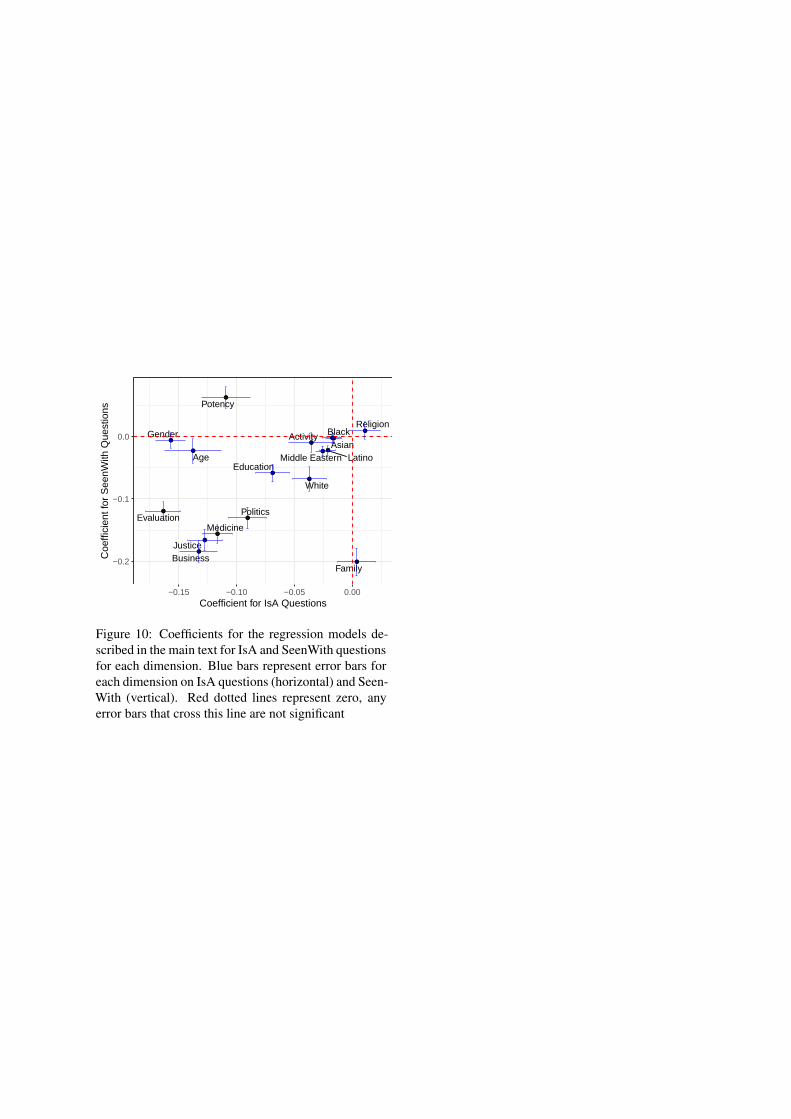
We then train a logistic regression model forIsA and SeenWith questions separately, each withseventeen parameters. For a given observation,the parameters represent the absolute differencebetween each dimension, e.g. the first parameteris |Xiq ,d0 − Xia,d0 |, where iq is “mother“ in Fig-ure 2B), ia is, e.g., “adult”, and d0 is, e.g., gender.
In the Appendix, we provide full results for theseregressions. Intuitively, larger negative coefficientsfor a given dimension indicate that the further awaytwo identities are on that dimension, the less likelythe respondent is to select them as a pair. For exam-ple, we find that Evaluation has a strong negativecorrelation for IsA questions, indicating that re-spondents typically do not expect two identities to
be assigned to the same person if one identity isperceived to be for “good people” and the other for“bad people”. Positive coefficients imply assortativ-ity on the dimension. For example, for SeenWithquestions, Potency has a positive coefficient, im-plying that we expect powerful identities to be seenwith less powerful counterparts. The magnitude ofthese coefficients represent the importance given tothat dimension by survey respondents. We use themaximum of the two coefficients across SeenWithand IsA questions as a measure of this importance.
4.2 Belief-level analysis
We are also interested in accuracy for specific be-liefs. For example, how accurately do embedding-based measures reflect survey data on beliefs aboutthe typical age of a boy? As an outcome for thisbelief-level analysis, we use a ranking task similarto prior work (Spirling and Rodriguez, 2019; Ko-zlowski et al., 2019). We describe this outcome bycontinuing with the example of beliefs about theage of boys. We first compute the set of identitiesN , for which Sage,boy,∗−se(Sage,boy,∗)>Sage,i,∗+se(Sage,i,∗), where se is the standard error function.That is, N represents all identities we are reason-ably confident respondents believed to be youngerthan boys. We then determine the subset of N , Nc,where boy is also ranked above those identities inthe embedding measure. We do the same for iden-tities survey respondents said were older than boys,adding these to N , and to Nc if they are correctlyranked in the embedding measure. Finally, we useNcN to study accuracy at the belief level.
We are interested both in overall levels of ac-curacy for belief-level measurements, as wellas the factors that explain variation in accuracy.We consider four factors that might explain thisvariation (continuing with the age/boy example):sd(Sage,boy,∗), the distance of Sage,boy,∗ to the me-dian over all identities on that dimension, thelogged frequency of the identity in a large corpora,6
and the number of synsets for the identity in Word-Net. To study the impact of these different factors,we use a generalized additive model with a bino-mial link function where Nc
N is the outcome andpoints are weighted by N . Finally, as opposed toconsidering results across all possible E, dw, andwp, we first select those settings that maximize thePearson correlation for each dimension.
6according to (Speer et al., 2018)
●●● ●
●●● ●
●● ● ●
●●● ●
●●●●
●●● ●
●●● ●
●●● ●
●●● ●
●●●●
●●●●
●
●
● ●
● ●
●
●
●
●
●●
●●
●●
●
●●
●●
●●●●
● ●●●
●●●●
●●●●
● ●●●
●●●●
● ●
●
●
●
●
●
●
●
●
●
●
●
●
●
●
●
●
● ●
●
●
Em
beddingD
imension−
inducingW
ordsetW
ord Position
Measure
Dim
ension
−0.9 −0.6 −0.3 0.0
GloVe (50D; 27B Tokens, Twitter)GloVe (100D; 27B Tokens, Twitter)GloVe (200D; 27B Tokens, Twitter)
GloVe (50D; 6B Tokens, Wiki+GigaWord)GloVe (100D; 6B Tokens, Wiki+GigaWord)Number Batch v19.08 (300D; ConceptNet)GloVe (200D; 6B Tokens, Wiki+GigaWord)GloVe (300D; 6B Tokens, Wiki+GigaWord)
Word2Vec (300D; Google News)FastText (300D; Wiki+Gigaword)
GloVe (300D; 840B Tokens, Common Crawl)
Survey−matched GenderBolukbasi Names Gender
Gonen & Goldberg GenderSurvey−matched Race/Ethnicity
Kozlowski Race/EthnicityKozlowski Gender
Survey−matched EvaluationSurvey−matched Institution
Garg GenderSurvey−matched Age
Survey−matched PotencySurvey−augmented Evaluation
Survey−matched ActivityKozlowski Lowercase Race/Ethnicity
Ethayarajh et al. (2019)Bolukbasi et al. (2016)
Ethayarajh et al. (2019) + Kozlowski et al.Kozlowski et al. (2019)
Ethayarajh et al. (2019) + Garg et al.Swinger et al. (2018)
LatinoWhite
AgeMiddle Eastern
AsianActivity
BlackReligion
EducationNeuroticism
PotencyEvaluation
ExtroversionBusiness
OpennessAgreeableness
JusticeFamily
GenderMedicine
Coefficient
Survey Data Source● ●
● ●
This Paper Robinson et al.
Agarwal et al. Bolukbasi et al.
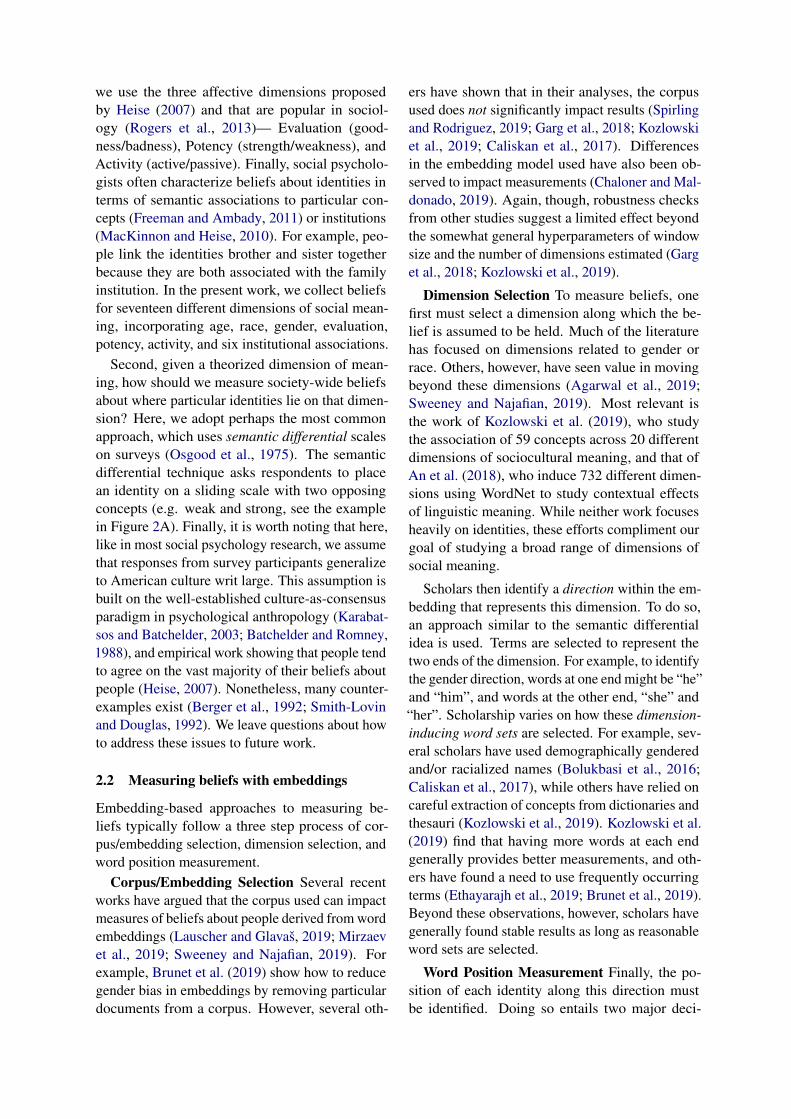
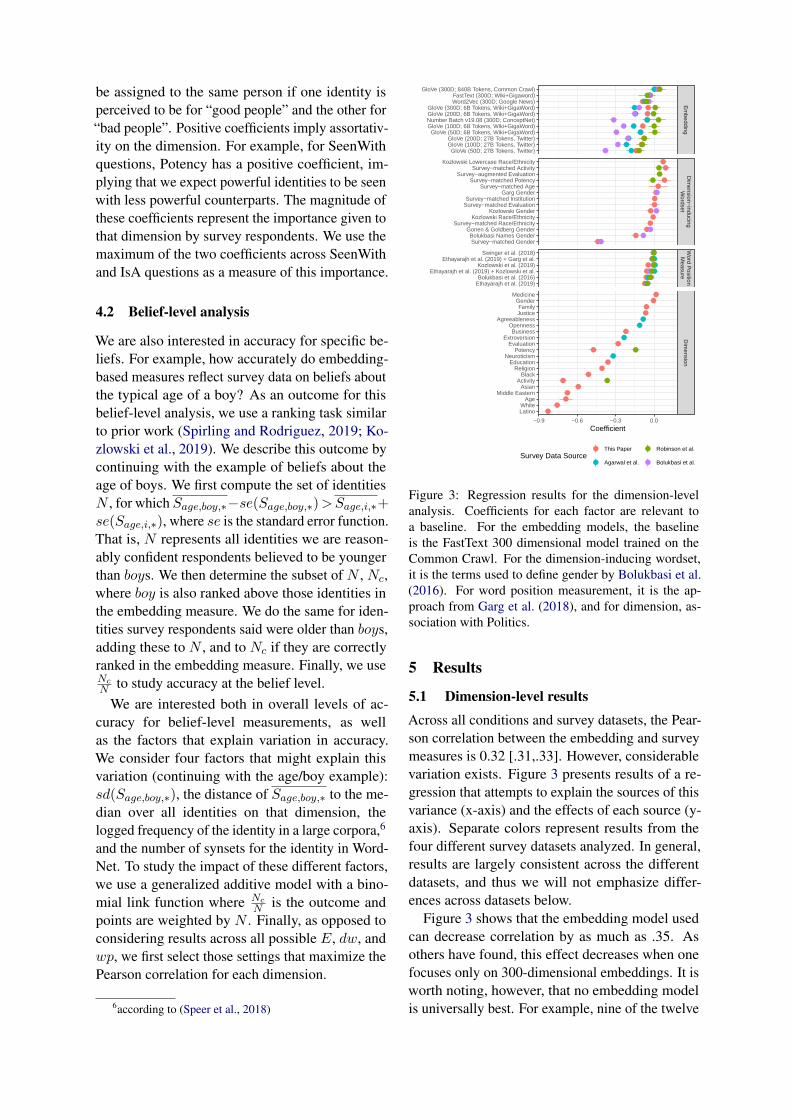
Figure 3: Regression results for the dimension-levelanalysis. Coefficients for each factor are relevant toa baseline. For the embedding models, the baselineis the FastText 300 dimensional model trained on theCommon Crawl. For the dimension-inducing wordset,it is the terms used to define gender by Bolukbasi et al.(2016). For word position measurement, it is the ap-proach from Garg et al. (2018), and for dimension, as-sociation with Politics.
5 Results
5.1 Dimension-level results
Across all conditions and survey datasets, the Pear-son correlation between the embedding and surveymeasures is 0.32 [.31,.33]. However, considerablevariation exists. Figure 3 presents results of a re-gression that attempts to explain the sources of thisvariance (x-axis) and the effects of each source (y-axis). Separate colors represent results from thefour different survey datasets analyzed. In general,results are largely consistent across the differentdatasets, and thus we will not emphasize differ-ences across datasets below.
Figure 3 shows that the embedding model usedcan decrease correlation by as much as .35. Asothers have found, this effect decreases when onefocuses only on 300-dimensional embeddings. It isworth noting, however, that no embedding modelis universally best. For example, nine of the twelve
embedding models studied are responsible for pro-ducing the highest observed correlation for at leastone dimension.
Selection of the dimension-inducing words, dw,also has a limited effect. The one exception is whensurvey-matched words are used for the Gender di-mension, where correlations drop by, on average,around 0.5 relative to the “he/she” baseline. Thefact that using the same words as the semantic dif-ferential scale is a terrible choice, but for only oneof the seventeen dimensions studied, reflects thefact that selection of dw, like elements of otherforms of quantitative social science, remains a mixof art and science (Sterling and Taveter, 2009).
In contrast, even the most scientifically appeal-ing approaches to word position measurement(Ethayarajh et al., 2019) provide marginal gains.The only consistent observation we draw is thatapproaches that normalize measurements across di-mensions related to the same overarching concept(e.g. that normalize racialized beliefs across all per-ceived dimensions of race) perform slightly better.Results thus reflect that the details of measurementare less important than what is being measured.
Reflecting this same fact, the strongest impactson correlation between the survey and embedding-based measures come from which dimension isbeing studied. Some of these results reflect thesalience of these dimensions in social life. Associa-tions to institutions, which are most accurately mea-sured on average, are a primary tool we use to sortpeople into groups (MacKinnon and Heise, 2010).And stronger correlations between the embeddingand survey-based measures for Evaluation and Po-tency, relative to Activity, reflects the increasedimportance in affective perceptions of these two di-mensions (Rogers et al., 2013). However, scholarslargely agree that trait-based beliefs on gender andrace serve as “default characteristics” (Ridgewayand Smith-Lovin, 1999) along which we almost au-tomatically categorize others (Todorov et al., 2015).Given their shared salience, why is gender the onlytrait that can be accurately measured?
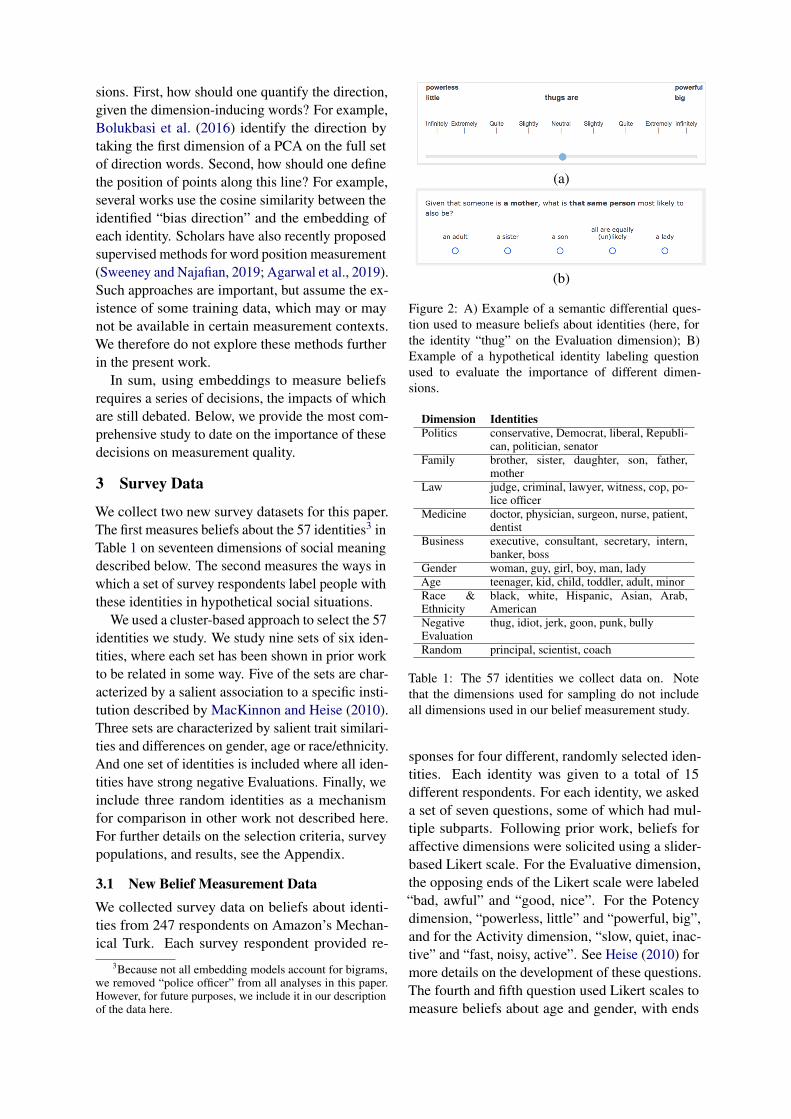
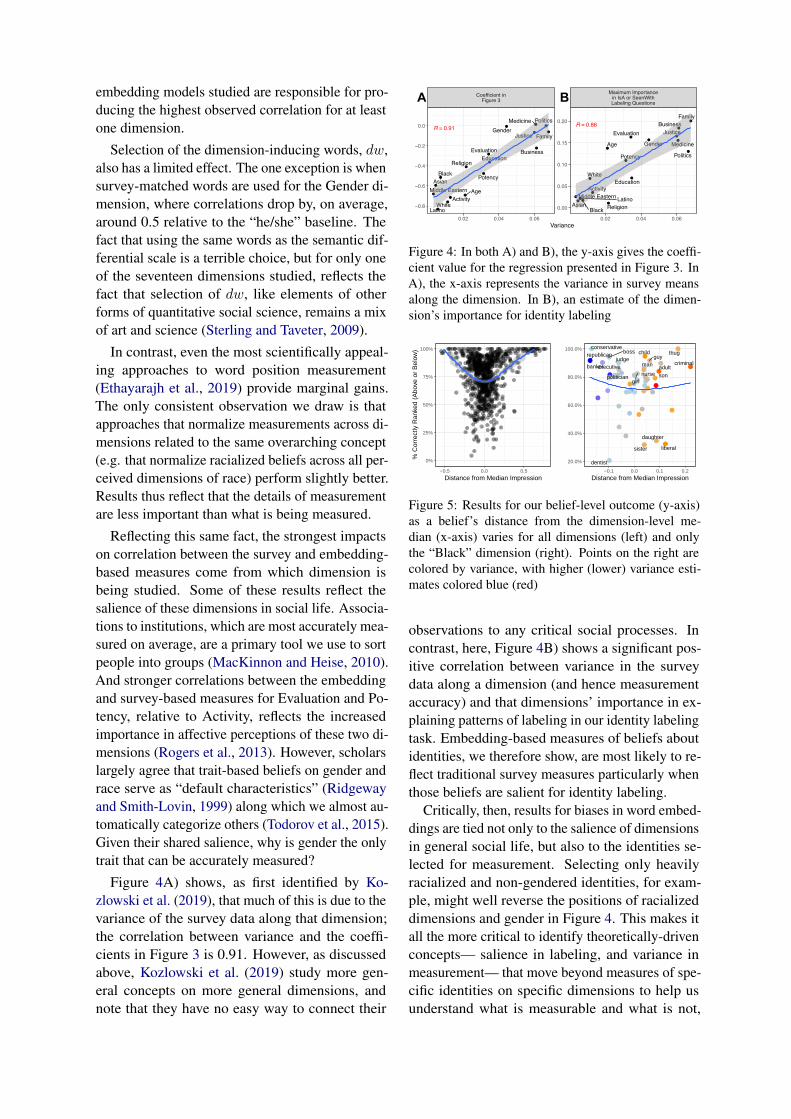
Figure 4A) shows, as first identified by Ko-zlowski et al. (2019), that much of this is due to thevariance of the survey data along that dimension;the correlation between variance and the coeffi-cients in Figure 3 is 0.91. However, as discussedabove, Kozlowski et al. (2019) study more gen-eral concepts on more general dimensions, andnote that they have no easy way to connect their
●●
●
●
●
●
●
●
●
●
●
●
●
●
●
●
●
R = 0.91
ActivityAge
AsianBlack
BusinessEducation
Evaluation
FamilyGender
Justice
Latino
Medicine
Middle Eastern
Politics
Potency
Religion
White
●
●
● ●
●
●
●
●
●
●
●
●
●
●
●
●
●
R = 0.86
Activity
Age
AsianBlack
Business
Education
Evaluation
Family
Gender
Justice
Latino
Medicine
Middle Eastern
PoliticsPotency
Religion
White
Coefficient inFigure 3
Maximum Importancein IsA or SeenWithLabeling Questions
0.02 0.04 0.06 0.02 0.04 0.06
0.00
0.05
0.10
0.15
0.20
−0.8
−0.6
−0.4
−0.2
0.0
Variance
BA
Figure 4: In both A) and B), the y-axis gives the coeffi-cient value for the regression presented in Figure 3. InA), the x-axis represents the variance in survey meansalong the dimension. In B), an estimate of the dimen-sion’s importance for identity labeling
0%
25%
50%
75%
100%
−0.5 0.0 0.5
Distance from Median Impression
% C
orre
ctly
Ran
ked
(Abo
ve o
r B
elow
)
●
●
●●
●
●●
●
●
●
●
●
●
●
●
●
●
●
●
●●
●
●
●
●
●
●●●
●
●
●
●
●
●
● ●
●
●
●
●
●
●
●
●
●
●
●
●
●●
adultbanker
boss childconservative
criminal
daughter
dentist
executive
girl
guyjudge
liberal
man
nursepolitician
republican
sister
son
thug
20.0%
40.0%
60.0%
80.0%
100.0%
−0.1 0.0 0.1 0.2
Distance from Median Impression
Figure 5: Results for our belief-level outcome (y-axis)as a belief’s distance from the dimension-level me-dian (x-axis) varies for all dimensions (left) and onlythe “Black” dimension (right). Points on the right arecolored by variance, with higher (lower) variance esti-mates colored blue (red)
observations to any critical social processes. Incontrast, here, Figure 4B) shows a significant pos-itive correlation between variance in the surveydata along a dimension (and hence measurementaccuracy) and that dimensions’ importance in ex-plaining patterns of labeling in our identity labelingtask. Embedding-based measures of beliefs aboutidentities, we therefore show, are most likely to re-flect traditional survey measures particularly whenthose beliefs are salient for identity labeling.
Critically, then, results for biases in word embed-dings are tied not only to the salience of dimensionsin general social life, but also to the identities se-lected for measurement. Selecting only heavilyracialized and non-gendered identities, for exam-ple, might well reverse the positions of racializeddimensions and gender in Figure 4. This makes itall the more critical to identify theoretically-drivenconcepts— salience in labeling, and variance inmeasurement— that move beyond measures of spe-cific identities on specific dimensions to help usunderstand what is measurable and what is not,
particularly when survey data is not available.
5.2 Belief-level results
As with the dimension-level results, we find thatembedding-based measures are generally accuratepredictors of survey-based measures for specificbeliefs. On average, 74.9% of the beliefs collectedfor this paper are correctly ranked, as are 82.1%,72.0%, and 71.4% of the beliefs from Bolukbasiet al. (2016), Smith-Lovin and Robinson (2015),and Agarwal et al. (2019), respectively. One caveatto keep in mind, however, is that we focus only onthe single best embedding measurement approachfor each source/dimension combination.
Regardless, as with the dimension-level results,there is considerable variance at the belief level.Some of this variance (approximately 32%, see theAppendix for full regression results ) can be ex-plained by the factors we consider. The strongestexplanation we find to explain ranking accuracy,reflected in the left-hand plot in Figure 5, is the dis-tance of the survey-based belief measure from themedian on its dimension. At the extremes, rankingaccuracy is almost perfect. Because extreme obser-vations are also most likely to be low variance—forexample, consider that beliefs at the most extremevalues of a scale must have zero variance—a moregeneral claim can be made: word embedding-basedmeasures accurately capture our most extreme andagree-upon beliefs about people, but show signifi-cant unexplained (at least by us) variance for moreneutral and/or less-agreed upon beliefs.
This variance is on display in the right-hand plotin Figure 5, which gives results for the blackness di-mension. The embedding-based measure captureswith perfect accuracy racialized perceptions of theidentities thug and criminal, but not, e.g., liberal,which is similar along the other explanatory fac-tors we consider here. As far as we are aware, itremains an open question as to why this is the case.
6 Conclusion
In this paper, we asked, can we trust measures of be-liefs about people derived from word embeddings?We find the answer to be yes, at least on average.Depending on one’s perspective, this could be goodor bad. From a cultural studies/social psycholog-ical perspective, this positive correlation furthervalidates efforts to use word embeddings to studyperceptions of people historically, at scale, and incontext. On the other hand, from the “bias” per-
spective, this suggests that a vast array of socialbiases are encoded in embeddings.
However, we also find that some beliefs—specifically, extreme beliefs on salient dimensions—are easier to measure than others. More generally,across four datasets, we find that what we measureis more important than how we measure it. Again,two different perspectives on this are needed. Withrespect to the study of culture and human stereo-types, we may be safest in studying only the mostextreme results from embedding models, as hasbeen done by, e.g., Spirling and Rodriguez (2019).
From the bias perspective, given the rash of re-cent work on debiasing word embeddings, our re-sults suggest that much more attention needs to bepaid to how we are evaluating these approaches.Currently, upstream evaluations of debiasing arecentered almost exclusively on occupational iden-tities on gender, where some of the most salientsocial biases we know of exist (Ridgeway, 2011).Others have argued that removing these salient be-liefs may not remove gender information from em-beddings (Gonen and Goldberg, 2019). But Gonenand Goldberg’s 2019 argument relies on a technicaldeficiency of existing approaches. We can make asimilar critique by simply changing what is beingmeasured. For example, the correlation betweengender beliefs and the gender direction in the Hard-Debiased embeddings of Bolukbasi et al. (2016) is0.05 (p = .84) using identities in their data, and 0.4(p <.05) using the identities in our data.
Similarly, removing gender bias does not removebias on other dimensions. For example, whileSweeney and Najafian (2019) show that the Num-berBatch embeddings harbor the least gender bias,we find that they are the only embedding to showconsistently high correlations with age, leadingto the potential for ageism downstream. Moregenerally, stereotypes exist along a network of be-liefs (Freeman and Ambady, 2011) reflecting un-warranted correlations between many dimensions(Ridgeway, 2011); we must therefore be carefulnot to expect that removing meaning along one di-mension will expel social biases from our models.
7 Acknowledgements
K.J. was supported by NSF IIS-1939579. Thisresearch was supported in part by a Seed Grantfrom SUNY. We thank Lynn Smith-Lovin, LisaFriedland, and Yuhao Du for comments on earlierversions of this work.
ReferencesOshin Agarwal, Funda Durupınar, Norman I. Badler,
and Ani Nenkova. 2019. Word embeddings (also)encode human personality stereotypes. In Proceed-ings of the Eighth Joint Conference on Lexical andComputational Semantics (*SEM 2019), pages 205–211, Minneapolis, Minnesota. Association for Com-putational Linguistics.
Jisun An, Haewoon Kwak, and Yong-Yeol Ahn. 2018.Semaxis: A lightweight framework to characterizedomain-specific word semantics beyond sentiment.In ACL.
William H. Batchelder and A. Kimball Romney. 1988.Test theory without an answer key. Psychometrika,53(1):71–92.
Joseph Berger, Robert Z. Norman, James W. Balkwell,and Roy F. Smith. 1992. Status inconsistency in tasksituations: A test of four status processing principles.American Sociological Review, pages 843–855.
Tolga Bolukbasi, Kai-Wei Chang, James Zou,Venkatesh Saligrama, and Adam Kalai. 2016.Man is to Computer Programmer as Woman is toHomemaker? Debiasing Word Embeddings. arXivpreprint arXiv:1607.06520.
Marc-Etienne Brunet, Colleen Alkalay-Houlihan, Ash-ton Anderson, and Richard Zemel. 2019. Under-standing the Origins of Bias in Word Embeddings.In International Conference on Machine Learning,pages 803–811.
Aylin Caliskan, Joanna J. Bryson, and ArvindNarayanan. 2017. Semantics derived automaticallyfrom language corpora contain human-like biases.Science, 356(6334):183–186.
Kaytlin Chaloner and Alfredo Maldonado. 2019. Mea-suring Gender Bias in Word Embeddings across Do-mains and Discovering New Gender Bias Word Cat-egories. In Proceedings of the First Workshop onGender Bias in Natural Language Processing, pages25–32, Florence, Italy. Association for Computa-tional Linguistics.
Maria De-Arteaga, Alexey Romanov, Hanna Wal-lach, Jennifer Chayes, Christian Borgs, AlexandraChouldechova, Sahin Geyik, Krishnaram Kentha-padi, and Adam Tauman Kalai. 2019. Bias in bios:A case study of semantic representation bias in ahigh-stakes setting. In Proceedings of the Confer-ence on Fairness, Accountability, and Transparency,pages 120–128.
Dawn Marie Dow. 2016. The deadly challenges ofraising African American boys: Navigating the con-trolling image of the “thug”. Gender & Society,30(2):161–188.
Kawin Ethayarajh, David Duvenaud, and Graeme Hirst.2019. Understanding undesirable word embeddingassociations. In Proceedings of the 57th Annual
Meeting of the Association for Computational Lin-guistics, pages 1696–1705, Florence, Italy. Associa-tion for Computational Linguistics.
Ethan Fast, Tina Vachovsky, and Michael S. Bernstein.2016. Shirtless and dangerous: Quantifying linguis-tic signals of gender bias in an online fiction writ-ing community. In Tenth International AAAI Con-ference on Web and Social Media.
Anjalie Field, Gayatri Bhat, and Yulia Tsvetkov. 2019.Contextual affective analysis: A case study of peo-ple portrayals in online# metoo stories. In Proceed-ings of the International AAAI Conference on Weband Social Media, volume 13, pages 158–169.
Susan T. Fiske, Amy JC Cuddy, Peter Glick, and JunXu. 2002. A model of (often mixed) stereotype con-tent: Competence and warmth respectively followfrom perceived status and competition. Journal ofpersonality and social psychology, 82(6):878.
Jonathan B. Freeman and Nalini Ambady. 2011. A dy-namic interactive theory of person construal. Psy-chological review, 118(2):247.
Nikhil Garg, Londa Schiebinger, Dan Jurafsky, andJames Zou. 2018. Word embeddings quantify100 years of gender and ethnic stereotypes. Pro-ceedings of the National Academy of Sciences,115(16):E3635–E3644.
Hila Gonen and Yoav Goldberg. 2019. Lipstick on apig: Debiasing methods cover up systematic genderbiases in word embeddings but do not remove them.In Proceedings of NAACL-HLT, pages 609–614.
David R. Heise. 1987. Affect control theory: Conceptsand model. The Journal of Mathematical Sociology,13(1-2):1–33.
David R. Heise. 2007. Expressive Order. Springer.
David R. Heise. 2010. Surveying Cultures: Discover-ing Shared Conceptions and Sentiments. John Wiley& Sons.
Felix Hill, Roi Reichart, and Anna Korhonen. 2015.Simlex-999: Evaluating semantic models with (gen-uine) similarity estimation. Computational Linguis-tics, 41(4):665–695.
Alexander Hoyle, Wolf-Sonkin, Hanna Wallach, Is-abelle Augenstein, and Ryan Cotterell. 2019. Un-supervised discovery of gendered language throughlatent-variable modeling.
Kenneth Joseph and Kathleen M. Carley. 2016. Relat-ing semantic similarity and semantic association tohow humans label other people. NLP+ CSS 2016,page 1.
Kenneth Joseph, Wei Wei, and Kathleen M. Carley.2016. Exploring patterns of identity usage in tweets:A new problem, solution and case study. In Proceed-ings of the 25th International Conference on WorldWide Web, pages 401–412.

Kenneth Joseph, Wei Wei, and Kathleen M. Carley.2017. Girls rule, boys drool: Extracting seman-tic and affective stereotypes from Twitter. In 2017ACM Conference on Computer Supported Coopera-tive Work.(CSCW).
George Karabatsos and William H. Batchelder. 2003.Markov chain estimation for test theory without ananswer key. Psychometrika, 68(3):373–389.
Austin C. Kozlowski, Matt Taddy, and James A.Evans. 2019. The Geometry of Culture: Analyzingthe Meanings of Class through Word Embeddings.American Sociological Review, 84(5):905–949.
Anne Lauscher and Goran Glavas. 2019. Are we con-sistently biased? multidimensional analysis of bi-ases in distributional word vectors. In Proceedingsof the Eighth Joint Conference on Lexical and Com-putational Semantics (* SEM 2019), pages 85–91.
Neil J. MacKinnon and David R. Heise. 2010. Self,Identity, and Social Institutions. Palgrave Macmil-lan.
Otto H MacLin and Roy S Malpass. 2001. Racial cate-gorization of faces: The ambiguous race face effect.Psychology, Public Policy, and Law, 7(1):98.
George J. McCall and Jerry L. Simmons. 1978. Identi-ties and interactions. New York.
Tomas Mikolov, Kai Chen, Greg Corrado, and Jef-frey Dean. 2013. Efficient estimation of wordrepresentations in vector space. arXiv preprintarXiv:1301.3781.
Tomas Mikolov, Edouard Grave, Piotr Bojanowski,Christian Puhrsch, and Armand Joulin. 2018. Ad-vances in pre-training distributed word representa-tions. In Proceedings of the International Confer-ence on Language Resources and Evaluation (LREC2018).
Inom Mirzaev, Anthony Schulte, Michael Conover, andSam Shah. 2019. Considerations for the interpreta-tion of bias measures of word embeddings. arXivpreprint arXiv:1906.08379.
Charles Egerton Osgood, William H. May, Mur-ray Samuel Miron, and Murray S. Miron. 1975.Cross-Cultural Universals of Affective Meaning, vol-ume 1. University of Illinois Press.
Olutobi Owoputi, Brendan O’Connor, Chris Dyer,Kevin Gimpel, Nathan Schneider, and Noah ASmith. 2013. Improved part-of-speech tagging foronline conversational text with word clusters. InProceedings of NAACL.
Jeffrey Pennington, Richard Socher, and Christopher D.Manning. 2014. Glove: Global vectors for word rep-resentation. In Empirical Methods in Natural Lan-guage Processing (EMNLP), pages 1532–1543.
Cecilia L. Ridgeway. 2011. Framed by Gender: HowGender Inequality Persists in the Modern World.Oxford University Press.
Cecilia L. Ridgeway and Lynn Smith-Lovin. 1999. Thegender system and interaction. Annual review of so-ciology, 25(1):191–216.
Kimberly B. Rogers, Tobias Schroder, and WolfgangScholl. 2013. The Affective Structure of StereotypeContent Behavior and Emotion in Intergroup Con-text. Social Psychology Quarterly, 76(2):125–150.
L. Smith-Lovin and W. Douglas. 1992. An affect con-trol analysis of two religious subcultures. Social per-spectives on emotion, 1:217–47.
L. Smith-Lovin and Dawn T. Robinson. 2015. Inter-preting and Responding to Events in Arabic Culture.Final Report to Office of Naval Research, GrantN00014-09-1-0556.
Robyn Speer, Joshua Chin, and Catherine Havasi. 2017.ConceptNet 5.5: An open multilingual graph of gen-eral knowledge. pages 4444–4451.
Robyn Speer, Joshua Chin, Andrew Lin, Sara Jew-ett, and Lance Nathan. 2018. Luminosoin-sight/wordfreq: v2.2.
Arthur Spirling and P Rodriguez. 2019. Word embed-dings: What works, what doesnt, and how to tellthe difference for applied research. Technical report,Working paper.
Leon Sterling and Kuldar Taveter. 2009. The art ofagent-oriented modeling. MIT press.
Chris Sweeney and Maryam Najafian. 2019. A Trans-parent Framework for Evaluating Unintended Demo-graphic Bias in Word Embeddings. In Proceedingsof the 57th Annual Meeting of the Association forComputational Linguistics, pages 1662–1667, Flo-rence, Italy. Association for Computational Linguis-tics.
Nathaniel Swinger, Maria De-Arteaga, Neil ThomasHeffernan IV, Mark DM Leiserson, and Adam Tau-man Kalai. 2019. What Are the Biases in My WordEmbedding? In Proceedings of the 2019 AAAI/ACMConference on AI, Ethics, and Society, AIES ’19,pages 305–311, New York, NY, USA. ACM.
Alexander Todorov, Christopher Y. Olivola, RonDotsch, and Peter Mende-Siedlecki. 2015. So-cial Attributions from Faces: Determinants, Con-sequences, Accuracy, and Functional Significance.Annual Review of Psychology, 66(1):519–545.
Nicholas Winter, Tyler Burleigh, Ryan Kennedy, andScott Clifford. 2019. A Simplified Protocol toScreen Out VPS and International Respondents Us-ing Qualtrics. SSRN Scholarly Paper ID 3327274,Social Science Research Network, Rochester, NY.
A Embedding Models
We use twelve publicly available embedding mod-els. We use all public GloVe (Pennington et al.,2014) models7, FastText (Mikolov et al., 2018)models8, the original Word2Vec (Mikolov et al.,2013) model9, and v19.08 of the NumberBatch(Speer et al., 2017) model.10
B Word Position Measurement Models
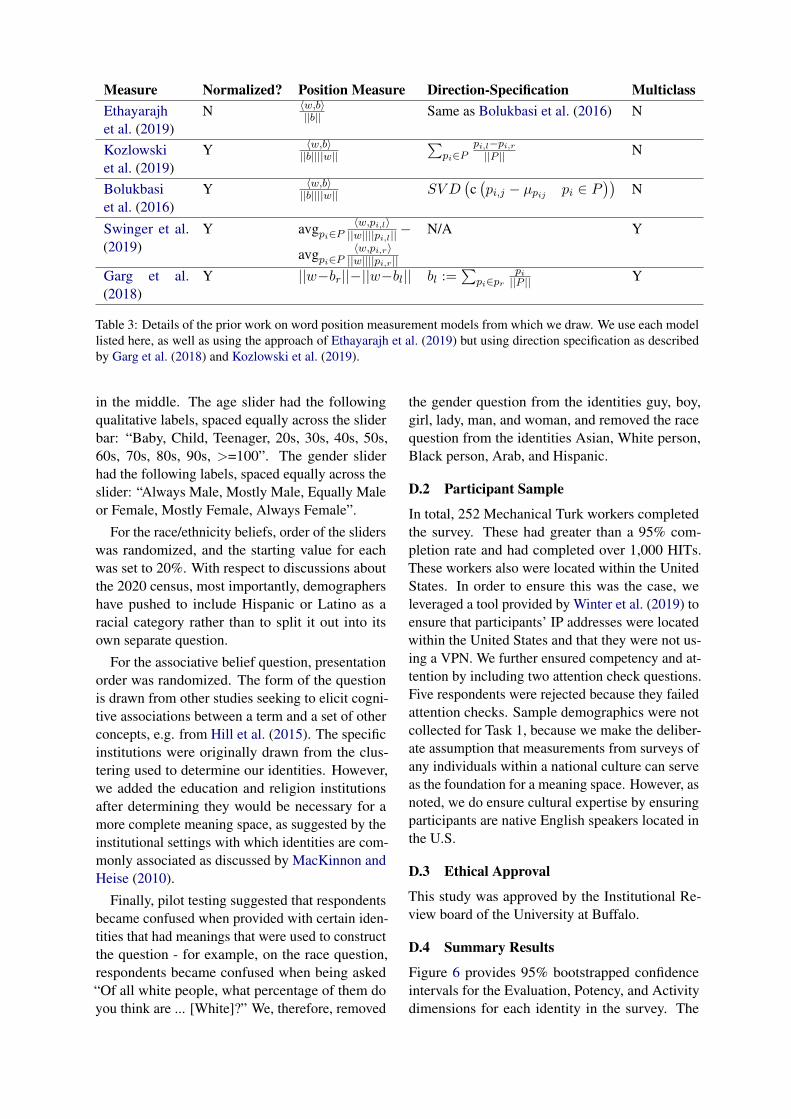
Table 3 outlines the word position measurementmodels used in the present work. The table pro-vides information on the authors of the measure,whether or not embeddings are normalized beforeanalysis, how words are measured once a directionhas been specified, how a direction is specified,and whether or not the method is “multi-class,” de-scribed further below.
Notationally, we have tried to remain as close tothe original works as possible. Therefore, w is theidentity to be measured, and b is the vector indicat-ing the direction along which it is to be measured.For Garg et al. (2018), bl and br represent wordsin the left-hand dimension-inducing word set (e.g.“man” and “him” for gender) and br the right-handof the dimension-inducing word sets (e.g. “woman”and “her” for gender). The variables pi,l and pi,rhave similar meanings for Swinger et al. (2019)and Bolukbasi et al. (2016).
We use the approaches of Garg et al. (2018),Kozlowski et al. (2019), Ethayarajh et al. (2019),and Swinger et al. (2019) exactly as described inthe original texts, except for one modification. Inthe case where a paired set of terms is required—all cases except Garg et al. (2018) and Swingeret al. (2019)—and we have a multi-class measure-ment (e.g. we measure four different dimensionsof racialized beliefs), we first identify a default di-mension and then compare all other dimensions toit. For race, we follow theory on perceptions ofdefault race categories and assign White to be thedefault race (MacLin and Malpass, 2001), and thecomparison point for White, following Kozlowskiet al. (2019), to be Black. For the associative di-mensions, we select family for the default, and
7https://nlp.stanford.edu/projects/glove/
8https://fasttext.cc/docs/en/english-vectors.html
9https://code.google.com/archive/p/word2vec/
10https://github.com/commonsense/conceptnet-numberbatch
compare family to politics.In addition, we consider the possibility that the
computationally appealing approach from (Etha-yarajh et al., 2019) may be improved by using adifferent direction specification approach. There-fore, we consider two additional word positionmeasurement models, Ethayarajh et al. (2019) +Garg et al. (2018), and Ethayarajh et al. (2019) +Kozlowski et al. (2019), that are the same as theoriginal model but using the direction specificationmethod in these two papers instead of the methodfrom Bolukbasi et al. (2016), as was done in theoriginal paper.
C Further Details - Identity Selection forOur Survey Data
In selecting identities for each cluster, we also en-sured that the words selected were a) expressedmost frequently as identities, b) were in a standardset of lexical resources and thus common Englishterms and c) were used relatively frequently. Toensure the identities were used first and foremost asan identity (and not, e.g., as a verb or place name),we first used both the NLP python library spacyand Wordnet to identify any identities for whichthe dominant sense was a verb (e.g. suspect, ac-cused) and removed these from consideration. Toensure that the identities were in common lexicaldatabases, we removed words which were not inWordnet as a noun or an adjective. Finally, to en-sure that identity words were used frequently, wechecked that they were used frequently in either afairly informal medium, Twitter, or in a fairly for-mal medium, Wikipedia. To check the former case,we use the frequency counts of words from 56Mtweets given by Owoputi et al. (2013) and retainonly those identities used in more than 2500 tweets.To check Wikipedia, we first extract all 532,051“clean” pages from a Wikipedia dump from Decem-ber, 2015. A clean page is a page that is not labeledas a stub, that was still active one month after thedump was created, and that also has more than 50views over 2 year span, where we pull one randomhour for each day.
D Further Details - Belief MeasurementData
D.1 MeasurementThe slider bar for the affective dimensions giveslabels at different points, ranging from “Infinitely”to “Slightly” on both ends, with a “Neutral” option
Measure Normalized? Position Measure Direction-Specification MulticlassEthayarajhet al. (2019)
N 〈w,b〉||b|| Same as Bolukbasi et al. (2016) N
Kozlowskiet al. (2019)
Y 〈w,b〉||b||||w||
∑pi∈P
pi,l−pi,r||P || N
Bolukbasiet al. (2016)
Y 〈w,b〉||b||||w|| SV D
(c(pi,j − µpij pi ∈ P
))N
Swinger et al.(2019)
Y avgpi∈P〈w,pi,l〉||w||||pi,l||−
avgpi∈P〈w,pi,r〉||w||||pi,r||
N/A Y
Garg et al.(2018)
Y ||w−br||−||w−bl|| bl :=∑
pi∈prpi||P || Y
Table 3: Details of the prior work on word position measurement models from which we draw. We use each modellisted here, as well as using the approach of Ethayarajh et al. (2019) but using direction specification as describedby Garg et al. (2018) and Kozlowski et al. (2019).
in the middle. The age slider had the followingqualitative labels, spaced equally across the sliderbar: “Baby, Child, Teenager, 20s, 30s, 40s, 50s,60s, 70s, 80s, 90s, >=100”. The gender sliderhad the following labels, spaced equally across theslider: “Always Male, Mostly Male, Equally Maleor Female, Mostly Female, Always Female”.
For the race/ethnicity beliefs, order of the sliderswas randomized, and the starting value for eachwas set to 20%. With respect to discussions aboutthe 2020 census, most importantly, demographershave pushed to include Hispanic or Latino as aracial category rather than to split it out into itsown separate question.
For the associative belief question, presentationorder was randomized. The form of the questionis drawn from other studies seeking to elicit cogni-tive associations between a term and a set of otherconcepts, e.g. from Hill et al. (2015). The specificinstitutions were originally drawn from the clus-tering used to determine our identities. However,we added the education and religion institutionsafter determining they would be necessary for amore complete meaning space, as suggested by theinstitutional settings with which identities are com-monly associated as discussed by MacKinnon andHeise (2010).
Finally, pilot testing suggested that respondentsbecame confused when provided with certain iden-tities that had meanings that were used to constructthe question - for example, on the race question,respondents became confused when being asked“Of all white people, what percentage of them doyou think are ... [White]?” We, therefore, removed
the gender question from the identities guy, boy,girl, lady, man, and woman, and removed the racequestion from the identities Asian, White person,Black person, Arab, and Hispanic.
D.2 Participant Sample
In total, 252 Mechanical Turk workers completedthe survey. These had greater than a 95% com-pletion rate and had completed over 1,000 HITs.These workers also were located within the UnitedStates. In order to ensure this was the case, weleveraged a tool provided by Winter et al. (2019) toensure that participants’ IP addresses were locatedwithin the United States and that they were not us-ing a VPN. We further ensured competency and at-tention by including two attention check questions.Five respondents were rejected because they failedattention checks. Sample demographics were notcollected for Task 1, because we make the deliber-ate assumption that measurements from surveys ofany individuals within a national culture can serveas the foundation for a meaning space. However, asnoted, we do ensure cultural expertise by ensuringparticipants are native English speakers located inthe U.S.
D.3 Ethical Approval
This study was approved by the Institutional Re-view board of the University at Buffalo.
D.4 Summary Results
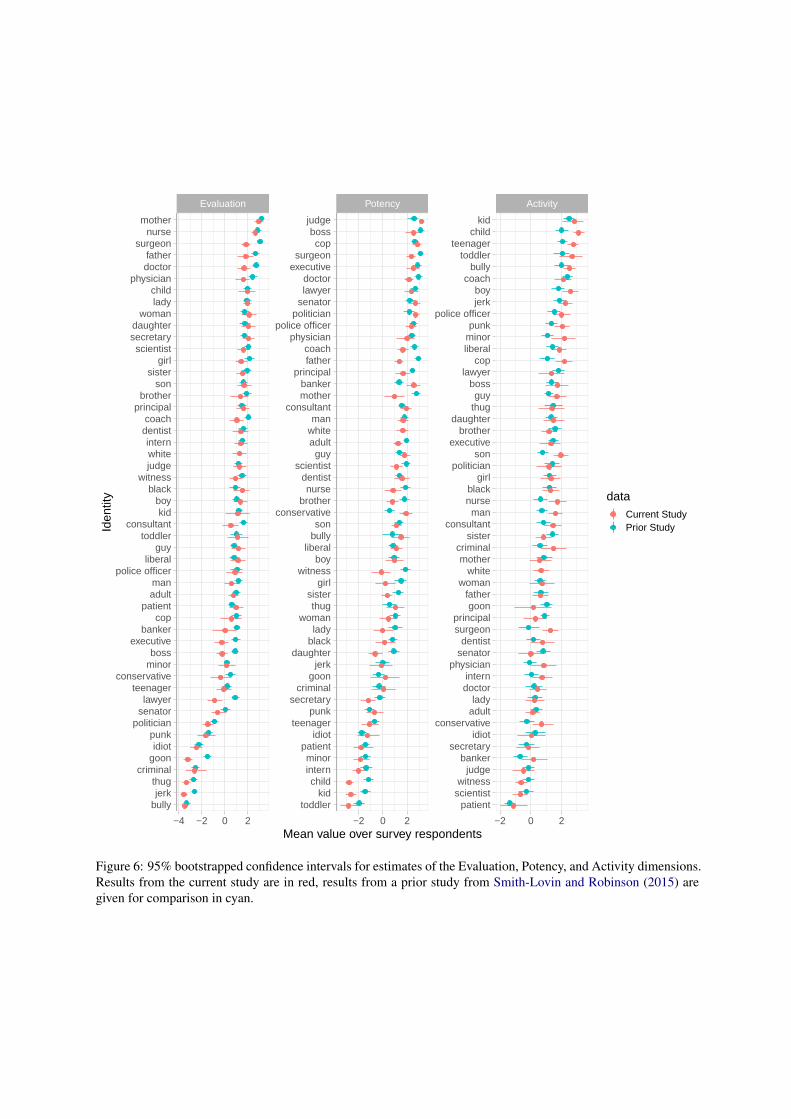
Figure 6 provides 95% bootstrapped confidenceintervals for the Evaluation, Potency, and Activitydimensions for each identity in the survey. The
measurements in our survey are compared to re-sults from Smith-Lovin and Robinson (2015). Thevast majority of our estimates overlap closely withtheirs, signifying the broad generality of the mea-surement tools used by ACT across individualswithin a national culture. Where differences arise,we do not believe one dataset or the other appearsto be universally more accurate, and further, giventhe number of comparisons (171, 3 per each of 57identities), we should expect even by chance somelarger differences in the measurements.
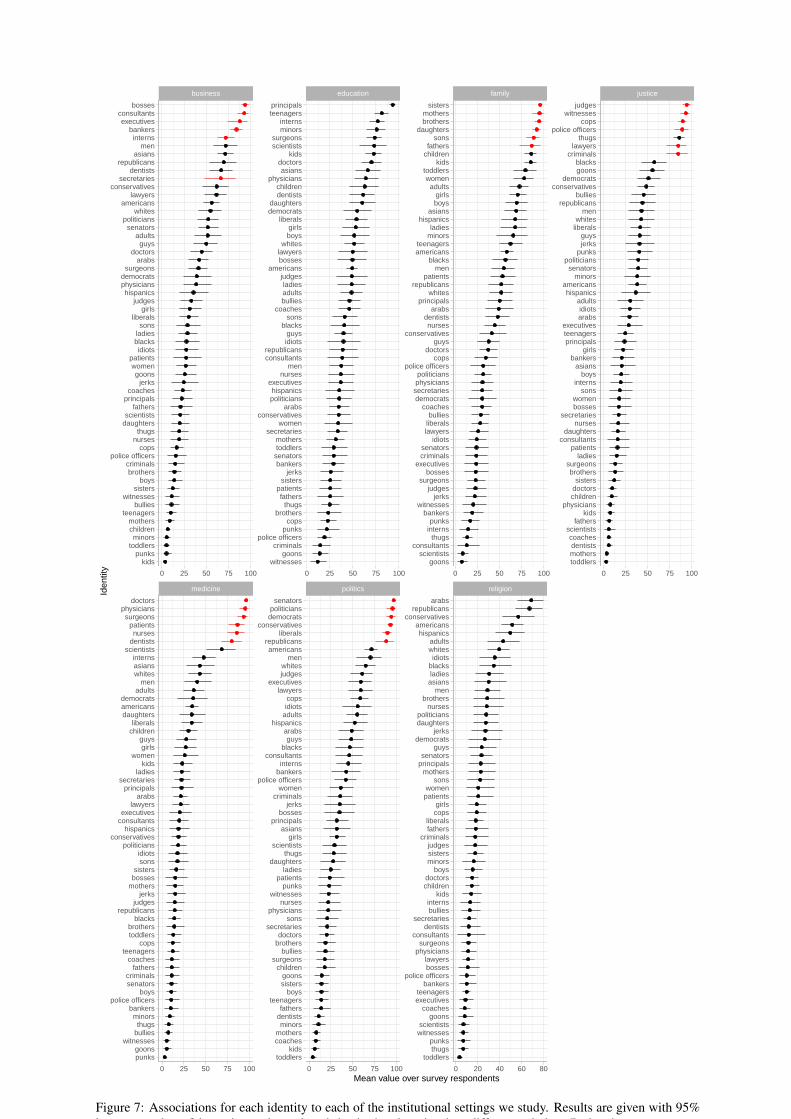
Figure 7 provides full results for associativemeanings. The figure shows that in general, identi-ties assumed to cluster within a particular institu-tion were rated as having the highest associationswith that institution. However, it is also clear thatother identities were also strongly aligned with thevarious institutions in ways that did not follow ex-actly from the construction of our identity set. Forexample, the identity thug was included as a nega-tive affect term, but was perceived to have a strongassociation to the judicial institution.
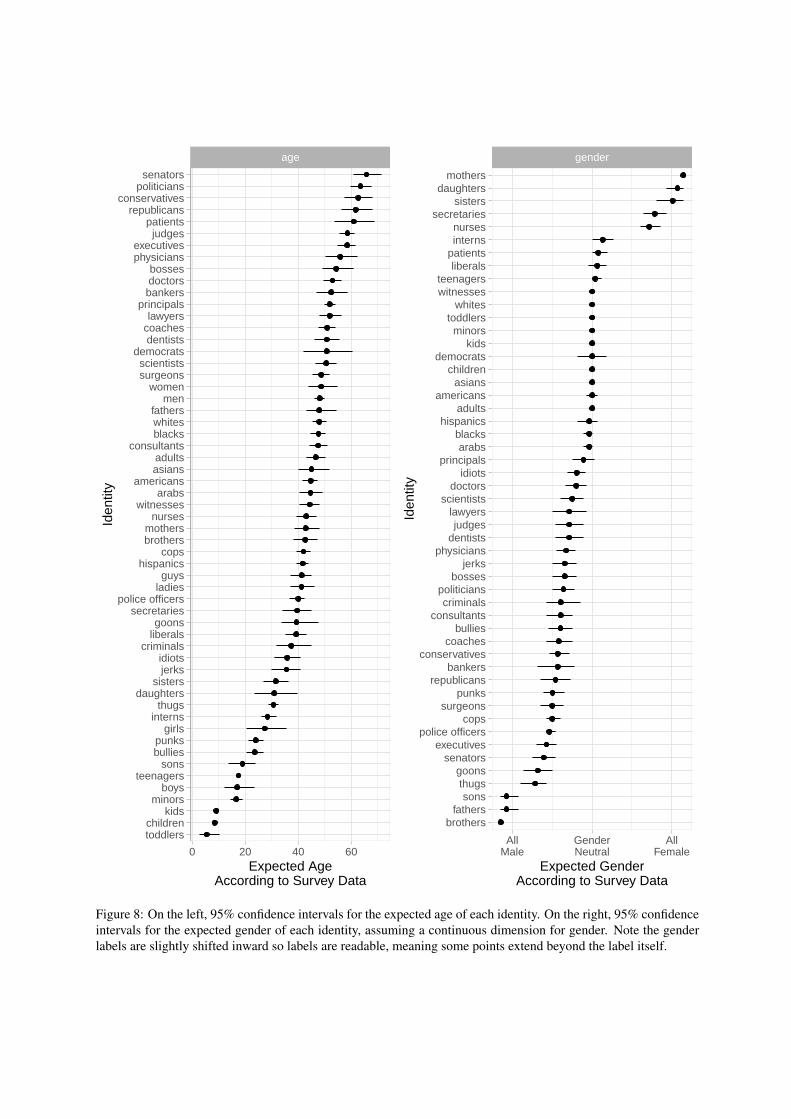
Figure 8 provides full results for the expectedage and gender of each identity. Note that someidentities with a denotative meaning aligned withthese dimensions were included, because pilot testsdid not suggest confusion for these identities. Wetherefore attempted to include as many identitiesas possible in the actual measurement.
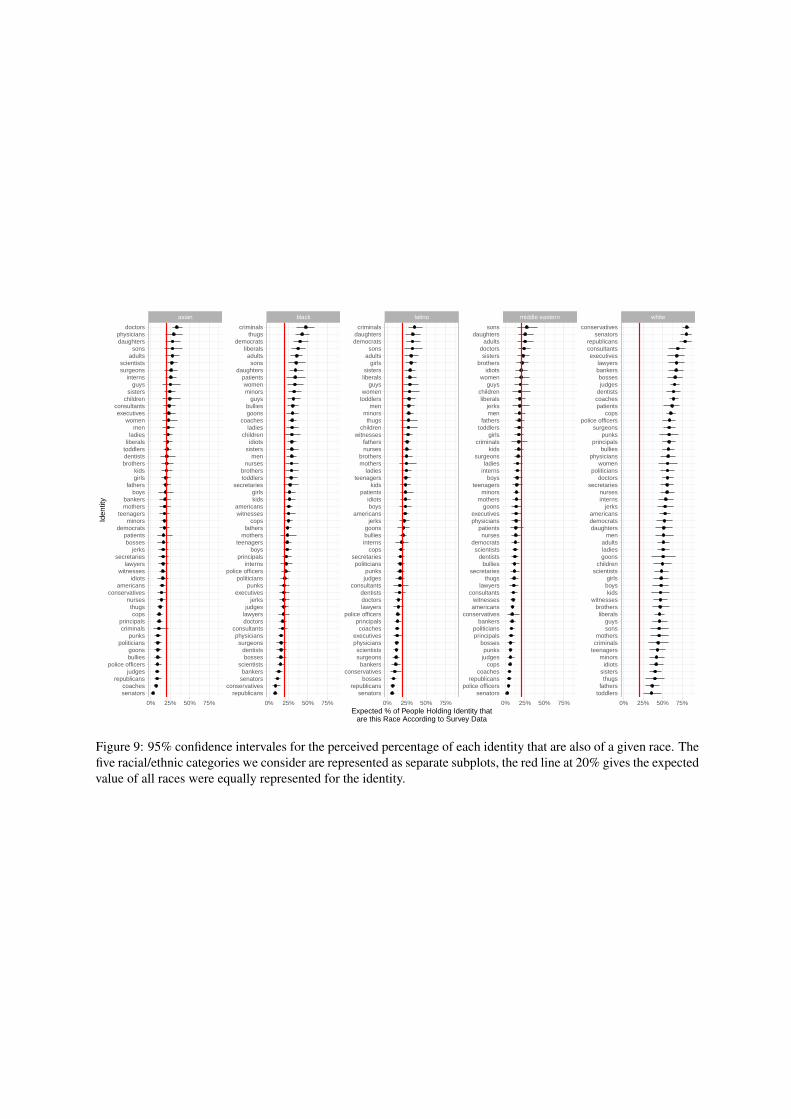
Figure 9 provides full results for the race ques-tion we asked. All identities were assumed by par-ticipants to be more White than expected by chance.Recall that the racial question was not posed for thedenotatively aligned racial identities we studied.
E Further Details - Identity LabelingTask
E.1 Participant Sample
We collected valid data from 402 Mechanical Turkworkers were located in the United States, hadgreater than a 95% completion rate and had com-pleted over 1,000 HITs. To assess accuracy forrespondents, we randomly sampled 5 questionsfrom each respondent and ensured that answersdid not appear to be entered randomly. The sam-ple’s gender was 53.7% female, and 45.6% male(.7% did not say). A total of 89.4% had at leastsome college or vocational training, 53.8% of thesample had completed at least a Bachelor’s degree,and 16.1% had a post-graduate degree. Almost all(96.7%) of the sample were born in and had lived
between 75-100% of their life in the United States.With respect to age, 9.0% of the sample was aged18-24, 17.2% aged 25-29, 33.3% aged 30-39, and40.0% aged 40 or older (.5% did not say). Finally,the sample was largely white, 83.3% of participantswere White or Caucasian.
E.2 Ethical Approval
The survey carried out was approved by the Institu-tional Review board of Carnegie Mellon University.
E.3 Additional Implementation Details
As noted in the text, and replicated here for clarity,from the 57 identities in Table 1, we create surveyquestions for the identity labeling task as follows:for a given identity, we generate 14 random setsof the 56 other identities; each set contains fouridentities. We then generate one IsA and one Seen-With question for each of these sets, where thesefour identities constitute the possible answers tothe question, and the given identity is used in thequestion text. This process is then repeated tentimes for each identity. This process generates ex-actly ten questions for each of the 3,19211 identitypairs for each type of question.
The intention was, therefore, to have exactly tenquestions for each identity pair for each questiontype where the first identity in the pair is shownin the question and the second identity in the pairis shown as a possible answer. In each case, byconstruction, the other possible answers were ran-domly selected. Unfortunately, our survey sufferedfrom a bug with the Qualtrics software used, wherethe option to present questions an even numberof times fails in unclear cases. Due to this error,some of our identity pairs were not seen exactlyten times. Specifically, 3.4% were asked less than6 times, 40% were asked less than ten times, and40.4% were asked more than ten times. While thisdoes not affect our analyses, because they do notrely on any exact number of questions per identitypairing, it is important to note for purposes of anyfuture work with the dataset.
Such issues aside, the process described gener-ated 15,960 questions. These questions produceda total of 16,080 responses (a small number ofquestions—120, or 0.7%—were asked more thanonce in attempts to address the Qualtrics bug) thatwere split evenly, 40 questions per respondent.
1157*56=3,192
E.4 ResultsFigure 10 presents full results for the regressionmodels described in the text to identify the impor-tance of each dimension for identity labeling.
F Additional Details - RQ2
Figures 11-14 present results from generalized ad-ditive models with the four dependent variablesdescribed in the main text on the rank-level out-come variable at the belief level. The models ex-plain 31.8%, 34.2%, 16.9%, and 21.6% of the de-viance for the data from this paper, Bolukbasi et al.(2016), Agarwal et al. (2019), and Smith-Lovinand Robinson (2015), respectively. Across the fourdatasets, the only consistent predictor is the dis-tance of the survey-based belief measure from themedian. Note, however, that in the data from Smith-Lovin and Robinson (2015), this pattern does nothold at the extremes. Further analyses suggests thisis due to a small number of outliers on the extremesof the Evaluation dimension, and does not appearto reflect any interesting trend worth additional con-sideration. Additionally, we note that, the authorsof Bolukbasi et al. (2016) could only provide uswith a mean per-identity estimate, and thus no in-formation on the variance of those estimates is usedin our results.
Evaluation Potency Activity
−4 −2 0 2 −2 0 2 −2 0 2
patientscientistwitness
judgebanker
secretaryidiot
conservativeadultlady
doctorintern
physiciansenatordentist
surgeonprincipal
goonfather
womanwhite
mothercriminal
sisterconsultant
mannurseblack
girlpolitician
sonexecutive
brotherdaughter
thugguy
bosslawyer
copliberalminorpunk
police officerjerkboy
coachbully
toddlerteenager
childkid
toddlerkid
childinternminor
patientidiot
teenagerpunk
secretarycriminal
goonjerk
daughterblacklady
womanthug
sistergirl
witnessboy
liberalbullyson
conservativebrother
nursedentist
scientistguy
adultwhiteman
consultantmotherbanker
principalfathercoach
physicianpolice officer
politiciansenatorlawyerdoctor
executivesurgeon
copboss
judge
bullyjerk
thugcriminal
goonidiot
punkpoliticiansenatorlawyer
teenagerconservative
minorboss
executivebanker
coppatient
adultman
police officerliberal
guytoddler
consultantkid
boyblack
witnessjudgewhiteintern
dentistcoach
principalbrother
sonsister
girlscientist
secretarydaughter
womanladychild
physiciandoctorfather
surgeonnurse
mother
Mean value over survey respondents
Iden
tity data
Current StudyPrior Study
Figure 6: 95% bootstrapped confidence intervals for estimates of the Evaluation, Potency, and Activity dimensions.Results from the current study are in red, results from a prior study from Smith-Lovin and Robinson (2015) aregiven for comparison in cyan.
medicine politics religion
business education family justice
0 25 50 75 100 0 25 50 75 100 0 20 40 60 80
0 25 50 75 100 0 25 50 75 100 0 25 50 75 100 0 25 50 75 100
toddlersmothersdentistscoaches
scientistsfathers
kidsphysicians
childrendoctorssisters
brotherssurgeons
ladiespatients
consultantsdaughters
nursessecretaries
bosseswomen
sonsinterns
boysasians
bankersgirls
principalsteenagersexecutives
arabsidiots
adultshispanics
americansminors
senatorspoliticians
punksjerksguys
liberalswhites
menrepublicans
bulliesconservatives
democratsgoonsblacks
criminalslawyers
thugspolice officers
copswitnesses
judges
goonsscientists
consultantsthugs
internspunks
bankerswitnesses
jerksjudges
surgeonsbosses
executivescriminalssenators
idiotslawyersliberalsbullies
coachesdemocratssecretariesphysicianspoliticians
police officerscops
doctorsguys
conservativesnurses
dentistsarabs
principalswhites
republicanspatients
menblacks
americansteenagers
minorsladies
hispanicsasians
boysgirls
adultswomen
toddlerskids
childrenfathers
sonsdaughters
brothersmothers
sisters
toddlersthugspunks
witnessesscientists
goonscoaches
executivesteenagers
bankerspolice officers
bosseslawyers
physicianssurgeons
consultantsdentists
secretariesbulliesinterns
kidschildrendoctors
boysminorssistersjudges
criminalsfathersliberals
copsgirls
patientswomen
sonsmothers
principalssenators
guysdemocrats
jerksdaughterspoliticians
nursesbrothers
menasiansladiesblacksidiots
whitesadults
hispanicsamericans
conservativesrepublicans
arabs
witnessesgoons
criminalspolice officers
punkscops
brothersthugs
fatherspatients
sistersjerks
bankerssenatorstoddlersmothers
secretarieswomen
conservativesarabs
politicianshispanics
executivesnurses
menconsultantsrepublicans
idiotsguys
blackssons
coachesbulliesadultsladies
judgesamericans
bosseslawyerswhites
boysgirls
liberalsdemocratsdaughters
dentistschildren
physiciansasians
doctorskids
scientistssurgeons
minorsinterns
teenagersprincipals
toddlerskids
coachesmothers
minorsdentistsfathers
teenagersboys
sistersgoons
childrensurgeons
bulliesbrothersdoctors
secretariessons
physiciansnurses
witnessespunks
patientsladies
daughtersthugs
scientistsgirls
asiansprincipals
bossesjerks
criminalswomen
police officersbankersinterns
consultantsblacks
guysarabs
hispanicsadultsidiotscops
lawyersexecutives
judgeswhites
menamericans
republicansliberals
conservativesdemocratspoliticianssenators
kidspunks
toddlersminors
childrenmothers
teenagersbullies
witnessessisters
boysbrothers
criminalspolice officers
copsnursesthugs
daughtersscientists
fathersprincipalscoaches
jerksgoons
womenpatients
idiotsblacksladiessons
liberalsgirls
judgeshispanics
physiciansdemocratssurgeons
arabsdoctors
guysadults
senatorspoliticians
whitesamericans
lawyersconservatives
secretariesdentists
republicansasians
meninterns
bankersexecutives
consultantsbosses
punksgoons
witnessesbulliesthugs
minorsbankers
police officersboys
senatorscriminals
fatherscoaches
teenagerscops
toddlersbrothers
blacksrepublicans
judgesjerks
mothersbossessisters
sonsidiots
politiciansconservatives
hispanicsconsultantsexecutives
lawyersarabs
principalssecretaries
ladieskids
womengirlsguys
childrenliberals
daughtersamericansdemocrats
adultsmen
whitesasiansinterns
scientistsdentistsnurses
patientssurgeons
physiciansdoctors
Mean value over survey respondents
Iden
tity
Figure 7: Associations for each identity to each of the institutional settings we study. Results are given with 95%bootstrapped confidence intervals, and each institutional setting is a different subplot. Red estimates representidentities that were assumed to be clustered on the given institutional setting
age
0 20 40 60
toddlerschildren
kidsminors
boysteenagers
sonsbulliespunks
girlsinterns
thugsdaughters
sistersjerksidiots
criminalsliberalsgoons
secretariespolice officers
ladiesguys
hispanicscops
brothersmothers
nurseswitnesses
arabsamericans
asiansadults
consultantsblackswhitesfathers
menwomen
surgeonsscientists
democratsdentistscoacheslawyers
principalsbankersdoctorsbosses
physiciansexecutives
judgespatients
republicansconservatives
politicianssenators
Expected AgeAccording to Survey Data
Iden
tity
gender
AllMale
GenderNeutral
AllFemale
brothersfathers
sonsthugsgoons
senatorsexecutives
police officerscops
surgeonspunks
republicansbankers
conservativescoaches
bulliesconsultants
criminalspoliticians
bossesjerks
physiciansdentistsjudges
lawyersscientists
doctorsidiots
principalsarabs
blackshispanics
adultsamericans
asianschildren
democratskids
minorstoddlers
whiteswitnessesteenagers
liberalspatientsinternsnurses
secretariessisters
daughtersmothers
Expected GenderAccording to Survey Data
Iden
tity
Figure 8: On the left, 95% confidence intervals for the expected age of each identity. On the right, 95% confidenceintervals for the expected gender of each identity, assuming a continuous dimension for gender. Note the genderlabels are slightly shifted inward so labels are readable, meaning some points extend beyond the label itself.
asian black latino middle eastern white
0% 25% 50% 75% 0% 25% 50% 75% 0% 25% 50% 75% 0% 25% 50% 75% 0% 25% 50% 75%
toddlersfathers
thugssistersidiots
minorsteenagerscriminalsmothers
sonsguys
liberalsbrothers
witnesseskids
boysgirls
scientistschildren
goonsladiesadults
mendaughtersdemocratsamericans
jerksinternsnurses
secretariesdoctors
politicianswomen
physiciansbullies
principalspunks
surgeonspolice officers
copspatientscoachesdentistsjudgesbosses
bankerslawyers
executivesconsultantsrepublicans
senatorsconservatives
senatorspolice officers
republicanscoaches
copsjudgespunks
bossesprincipalspoliticians
bankersconservatives
americanswitnesses
consultantslawyers
thugssecretaries
bulliesdentists
scientistsdemocrats
nursespatients
physiciansexecutives
goonsmothers
minorsteenagers
boysinternsladies
surgeonskids
criminalsgirls
toddlersfathers
menjerks
liberalschildren
guyswomen
idiotsbrothers
sistersdoctors
adultsdaughters
sons
senatorsrepublicans
bossesconservatives
bankerssurgeonsscientists
physiciansexecutives
coachesprincipals
police officerslawyersdoctorsdentists
consultantsjudgespunks
politicianssecretaries
copsinternsbulliesgoons
jerksamericans
boysidiots
patientskids
teenagersladies
mothersbrothers
nursesfathers
witnesseschildren
thugsminors
mentoddlerswomen
guysliberalssisters
girlsadults
sonsdemocratsdaughterscriminals
republicansconservatives
senatorsbankers
scientistsbossesdentists
surgeonsphysicians
consultantsdoctorslawyersjudges
jerksexecutives
punkspoliticians
police officersinterns
principalsboys
teenagersmothers
fatherscops
witnessesamericans
kidsgirls
secretariestoddlersbrothers
nursesmen
sistersidiots
childrenladies
coachesgoonsbullies
guysminorswomen
patientsdaughters
sonsadults
liberalsdemocrats
thugscriminals
senatorscoaches
republicansjudges
police officersbulliesgoons
politicianspunks
criminalsprincipals
copsthugs
nursesconservatives
americansidiots
witnesseslawyers
secretariesjerks
bossespatients
democratsminors
teenagersmothersbankers
boysfathers
girlskids
brothersdentiststoddlersliberalsladies
menwomen
executivesconsultants
childrensisters
guysinterns
surgeonsscientists
adultssons
daughtersphysicians
doctors
Expected % of People Holding Identity thatare this Race According to Survey Data
Iden
tity
Figure 9: 95% confidence intervales for the perceived percentage of each identity that are also of a given race. Thefive racial/ethnic categories we consider are represented as separate subplots, the red line at 20% gives the expectedvalue of all races were equally represented for the identity.
●
●
●
●
●
●
●
●
●
●
●
● ●
●●
●
●
Evaluation
Gender
Age
BusinessJustice
Medicine
Potency
Politics
Education
White
Activity
Middle Eastern Latino
BlackAsian
Family
Religion
−0.2
−0.1
0.0
−0.15 −0.10 −0.05 0.00Coefficient for IsA Questions
Coe
ffici
ent f
or S
eenW
ith Q
uest
ions
Figure 10: Coefficients for the regression models de-scribed in the main text for IsA and SeenWith questionsfor each dimension. Blue bars represent error bars foreach dimension on IsA questions (horizontal) and Seen-With (vertical). Red dotted lines represent zero, anyerror bars that cross this line are not significant
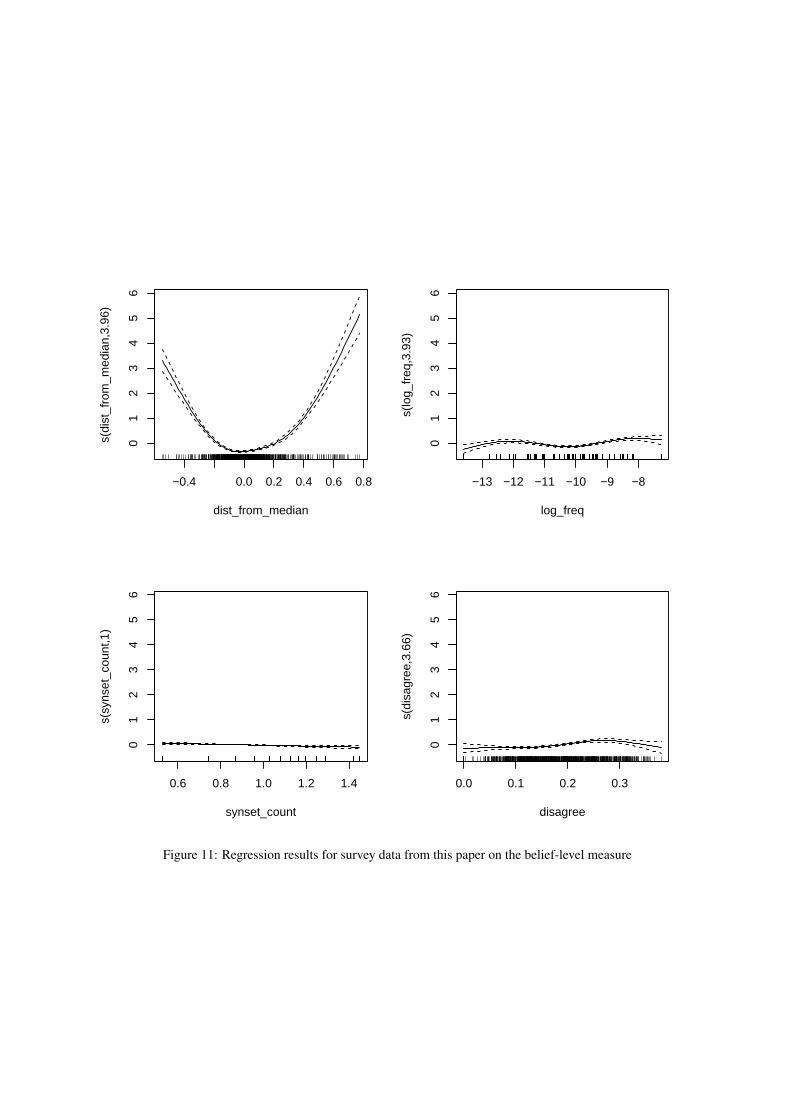
−0.4 0.0 0.2 0.4 0.6 0.8
01
23
45
6
dist_from_median
s(di
st_f
rom
_med
ian,
3.96
)
−13 −12 −11 −10 −9 −8
01
23
45
6
log_freq
s(lo
g_fr
eq,3
.93)
0.6 0.8 1.0 1.2 1.4
01
23
45
6
synset_count
s(sy
nset
_cou
nt,1
)
0.0 0.1 0.2 0.3
01
23
45
6
disagree
s(di
sagr
ee,3
.66)
Figure 11: Regression results for survey data from this paper on the belief-level measure
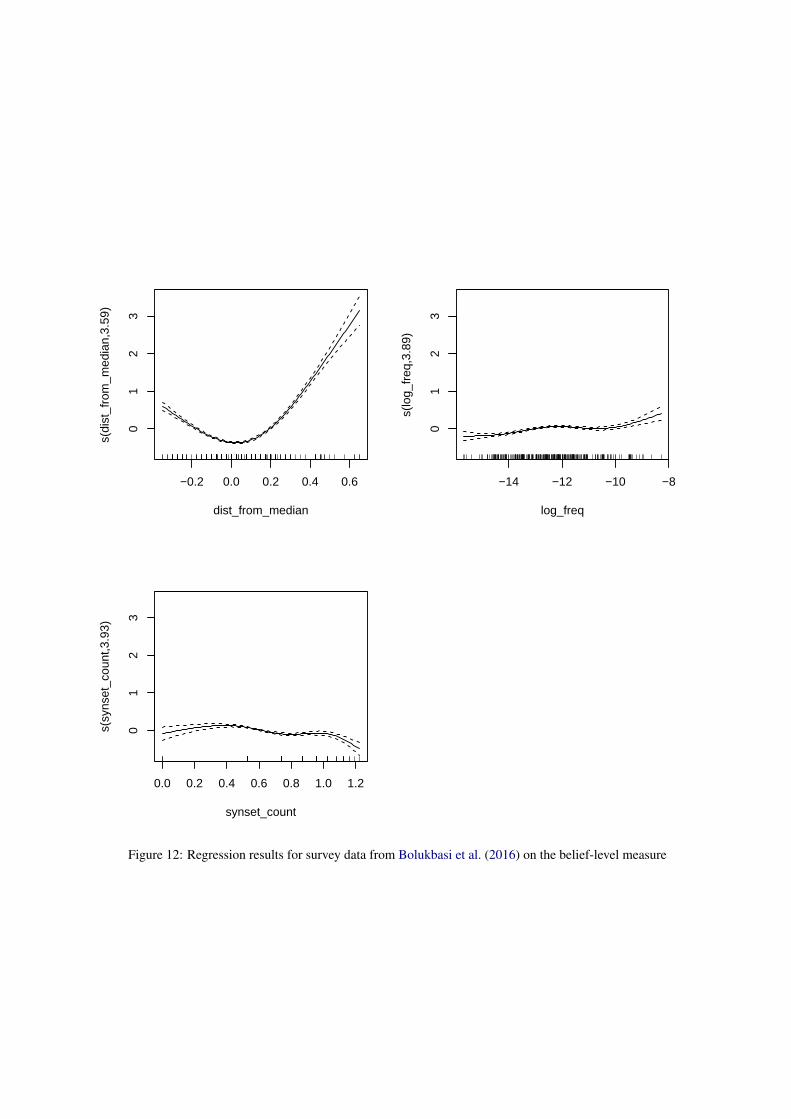
−0.2 0.0 0.2 0.4 0.6
01
23
dist_from_median
s(di
st_f
rom
_med
ian,
3.59
)
−14 −12 −10 −8
01
23
log_freq
s(lo
g_fr
eq,3
.89)
0.0 0.2 0.4 0.6 0.8 1.0 1.2
01
23
synset_count
s(sy
nset
_cou
nt,3
.93)
Figure 12: Regression results for survey data from Bolukbasi et al. (2016) on the belief-level measure
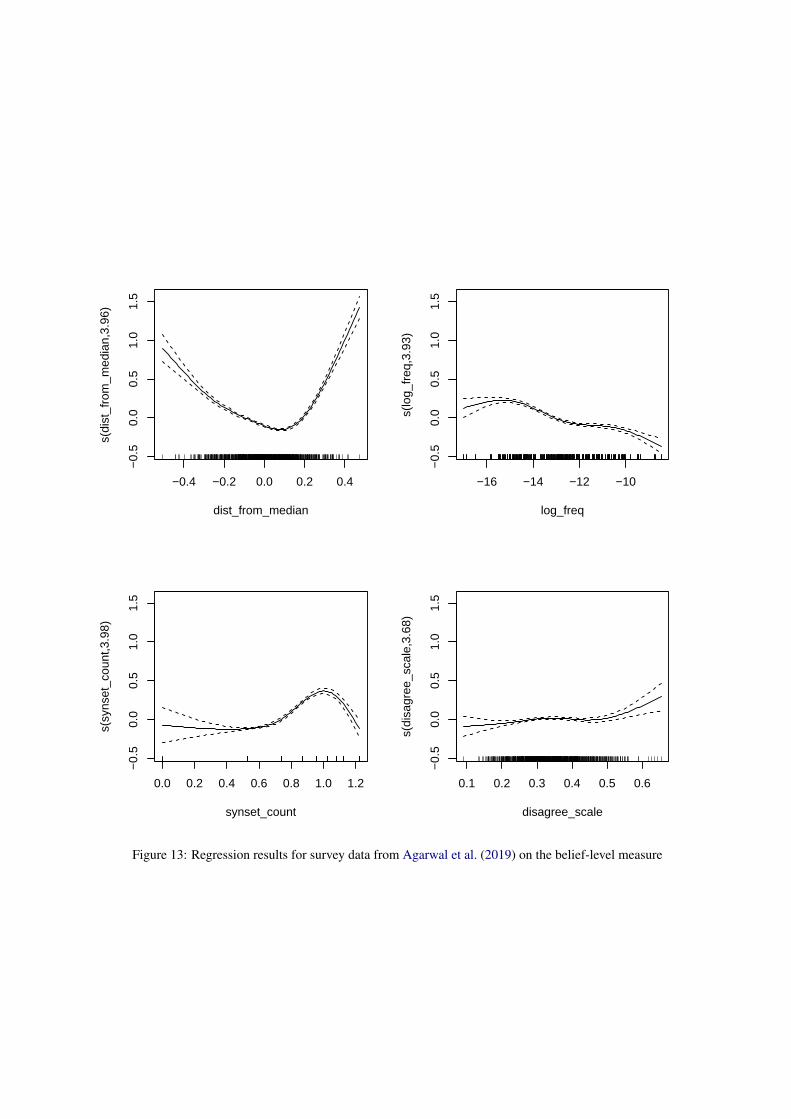
−0.4 −0.2 0.0 0.2 0.4
−0.
50.
00.
51.
01.
5
dist_from_median
s(di
st_f
rom
_med
ian,
3.96
)
−16 −14 −12 −10
−0.
50.
00.
51.
01.
5
log_freq
s(lo
g_fr
eq,3
.93)
0.0 0.2 0.4 0.6 0.8 1.0 1.2
−0.
50.
00.
51.
01.
5
synset_count
s(sy
nset
_cou
nt,3
.98)
0.1 0.2 0.3 0.4 0.5 0.6
−0.
50.
00.
51.
01.
5
disagree_scale
s(di
sagr
ee_s
cale
,3.6
8)
Figure 13: Regression results for survey data from Agarwal et al. (2019) on the belief-level measure
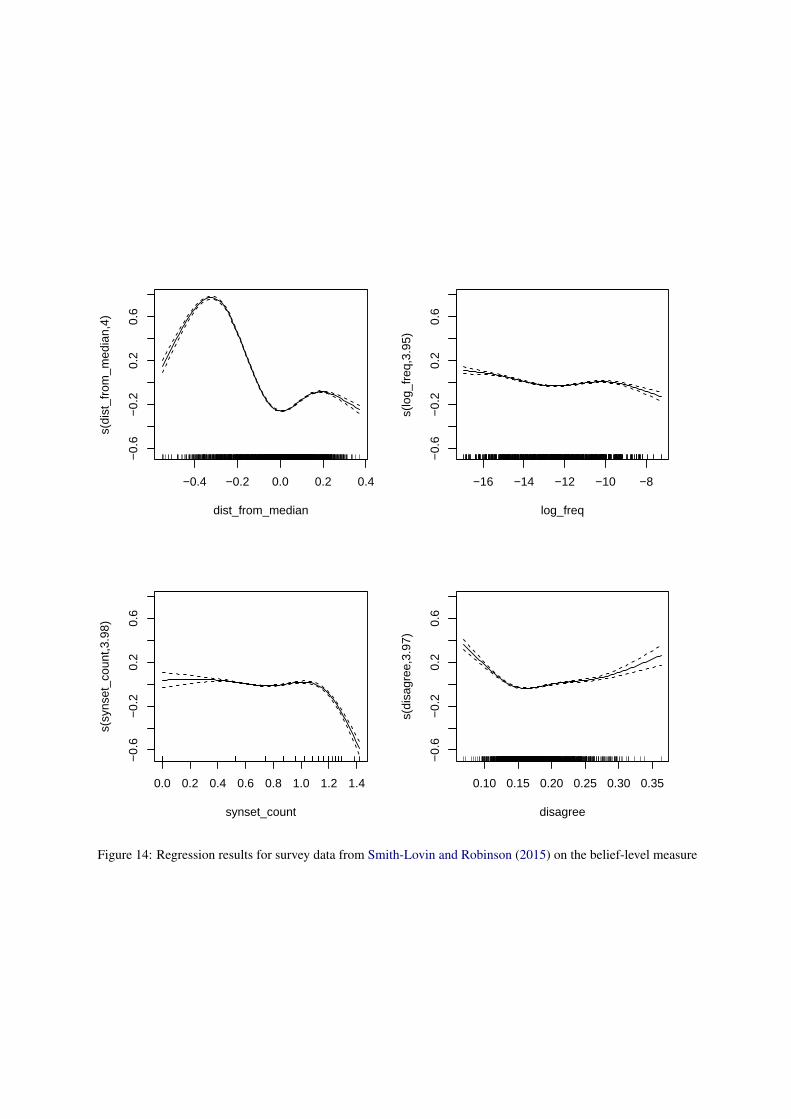
−0.4 −0.2 0.0 0.2 0.4
−0.
6−
0.2
0.2
0.6
dist_from_median
s(di
st_f
rom
_med
ian,
4)
−16 −14 −12 −10 −8
−0.
6−
0.2
0.2
0.6
log_freq
s(lo
g_fr
eq,3
.95)
0.0 0.2 0.4 0.6 0.8 1.0 1.2 1.4
−0.
6−
0.2
0.2
0.6
synset_count
s(sy
nset
_cou
nt,3
.98)
0.10 0.15 0.20 0.25 0.30 0.35
−0.
6−
0.2
0.2
0.6
disagree
s(di
sagr
ee,3
.97)
Figure 14: Regression results for survey data from Smith-Lovin and Robinson (2015) on the belief-level measure
![arXiv:1009.2798v1 [astro-ph.HE] 14 Sep 2010 · 2018-11-21 · arXiv:1009.2798v1 [astro-ph.HE] 14 Sep 2010. 2 Jonathan Arons ... suggesting no plasma more than a meter or so above](https://static.fdocuments.us/doc/165x107/5e29b359934e905ddf3a872e/arxiv10092798v1-astro-phhe-14-sep-2010-2018-11-21-arxiv10092798v1-astro-phhe.jpg)
![Jonathan D. Touboul arXiv:1410.8001v2 [cond-mat.dis-nn] 21 ... · 2 JONATHAN D. TOUBOUL In this domain, models were developed in such di erent domains as the alignment of spins in](https://static.fdocuments.us/doc/165x107/5e7f22529737ca6ead3b8f72/jonathan-d-touboul-arxiv14108001v2-cond-matdis-nn-21-2-jonathan-d-touboul.jpg)


![JONATHAN HANSELMAN AND LIAM WATSON - arXiv · 2019. 8. 14. · 2 JONATHAN HANSELMAN AND LIAM WATSON Recall from [4, 5] that for a (connected, orientable) three-manifold M with torus](https://static.fdocuments.us/doc/165x107/5fe396876e7f5270537f3dcc/jonathan-hanselman-and-liam-watson-arxiv-2019-8-14-2-jonathan-hanselman-and.jpg)


![arXiv:1802.02691v2 [stat.ME] 6 Aug 2018arXiv:1802.02691v2 [stat.ME] 6 Aug 2018 Corresponding Author: Jonathan Williams, williams.jonathan1@mayo.edu 1 Introduction People are living](https://static.fdocuments.us/doc/165x107/5f1661d8db757d03b57b2064/arxiv180202691v2-statme-6-aug-2018-arxiv180202691v2-statme-6-aug-2018.jpg)

![Elie Bretin & Morgan Brassel arXiv:0904.0098v1 [math.NA] 1 ... · elie.bretin@imag.fr (corresponding author) morgan.brassel@imag.fr April 2009 Abstract This paper is concerned with](https://static.fdocuments.us/doc/165x107/5e4d8a66da4a854cb0346c87/elie-bretin-morgan-brassel-arxiv09040098v1-mathna-1-eliebretinimagfr.jpg)

