JOM SILKKITIE ASIA EQUITY INVESTMENT FUND Monthly Report ... · India11 % US 3% Vietnam16 %...
8
JOM Silkkitie Asia Equity Investment Fund’s NAV was 222.60 at the end of November so the performance during the month stood at +6.5%. Since fund inception (31st July 2009) the NAV has increased by +122.60%, thus the annual performance has been +8.95%. Market volatility continued in November along with the global capital markets. However, at the end of the month the sentiment improved as Fed’s Powell indicated that the rate hike cycle maybe nearing its end. The G20 meeting in early December was also deemed positive, as China and the US decided to put further import tolls on hold for 90 days. The declining price of oil, from nearly 70 USD in October to 50 USD in late November, was very positive for many emerging markets that are running current account deficits, such as the Philippines, India and Indonesia. Therefore, many EM currencies have been strengthening against the USD for many weeks now. In addition, market stress seems to have shifted increasingly toward the US as many macro indicators have been deteriorating, valuation levels are historically high while liquidity situation has been tightening - now it seems that the domestic driven EM space is quite attractive given the low valuation and stable growth in many of our focus markets. During the month we increased India’s and Indonesia’s weights. In addition, as the global growth is now clearly slowing down, we are increasingly focusing on domestic driven structural themes, which are not correlated to global trade cycle. JOM Fund Management Ltd Salomonkatu 17 B, 00100 Helsinki, FINLAND Tel: +358 9 670 115, Fax: +358 9 670 117 info @jom.fi www.jom.fi Past performance is no guarantee for future returns. The Fund value may increase or decrease, and the investor may incur losses when redeeming his shares. MSCI AC Asia ex-Japan (EUR) is a price index, which takes dividends into account. Further details on JOM Silkkitie Investment Fund may be found in the key investor information document, fund prospectus and fund rules, which are available by request from JOM Fund Management Ltd, or on the website www.jom.fi. *For the fiscal period since 1.1.2018, % of fund average net assets. **Based on daily returns during 12 months. Detailed formulas available from the Fund Management Company. JOM SILKKITIE, NET ASSET VALUE (31 November 2018) 222.60 Fund size 31.81 mEUR Number of fund units 142 893.8168 kpl Inception date 31.7.2009 Last month’s performance +6.50% Performance since inception +122.60% Annualized performance since inception +8.95% Accumulated management fee* 1.11% Accumulated performance fee* 0.00% Accumulated custodian fee* 0.14% Net investment position (prior to subscriptions on 30.11.2018) 96.8% Volatility** 14.4% Portfolio turnover 257.2% Name: JOM Silkkitie Fund (UCITS) Portfolio Manager: Juuso Mykkänen Custodian: SEB. Helsinki branch Benchmark index: No official index Profit sharing: The Fund has only accumulating units Fund rules last confirmed: 7.7.2017 Inception date: 31.7.2009 ISIN-code: FI4000003470 Bloomberg-ticker: JOMSILK FH Fund target group: Demanding investors who understand the potential of Asian equity markets in the long run. Minimum subscription: 5 000 € Subscription account: IBAN: FI81 3301 0001 1297 17 BIC: ESSEFIHXXXX Management fee: 1.2% p.a. Subscription fee: 1.5% - 0% Redemption fee: 1% (min. 20 €) Performance fee: 10% on the return exceeding the hurdle rate of 5%. (pls see Fund prospectus for details) OVERVIEW OF THE FUND JOM SILKKITIE ASIA EQUITY INVESTMENT FUND Monthly Report November 2018
Transcript of JOM SILKKITIE ASIA EQUITY INVESTMENT FUND Monthly Report ... · India11 % US 3% Vietnam16 %...

JOM Silkkitie Asia Equity Investment Fund’s NAV was 222.60 at the end ofNovember so the performance during the month stood at +6.5%. Since fundinception (31st July 2009) the NAV has increased by +122.60%, thus the annualperformance has been +8.95%.
Market volatility continued in November along with the global capital markets.However, at the end of the month the sentiment improved as Fed’s Powellindicated that the rate hike cycle maybe nearing its end. The G20 meeting inearly December was also deemed positive, as China and the US decided to putfurther import tolls on hold for 90 days.
The declining price of oil, from nearly 70 USD in October to 50 USD in lateNovember, was very positive for many emerging markets that are runningcurrent account deficits, such as the Philippines, India and Indonesia. Therefore,many EM currencies have been strengthening against the USD for many weeksnow. In addition, market stress seems to have shifted increasingly toward theUS as many macro indicators have been deteriorating, valuation levels arehistorically high while liquidity situation has been tightening - now it seems thatthe domestic driven EM space is quite attractive given the low valuation andstable growth in many of our focus markets.
During the month we increased India’s and Indonesia’s weights. In addition, asthe global growth is now clearly slowing down, we are increasingly focusing ondomestic driven structural themes, which are not correlated to global tradecycle.
J O M F u n d M a n a g e m e n t L t dS a l o m o n k a t u 1 7 B , 0 0 1 0 0 H e l s i n k i , F I N L A N D
T e l : + 3 5 8 9 6 7 0 1 1 5 , F ax : + 3 5 8 9 6 7 0 1 1 7in fo @j om . f i w w w . j om . f i
Pastperformance is noguaranteeforfuturereturns.The Fundvalue mayincrease ordecrease, andthe investor mayincur losses whenredeeming hisshares. MSCI AC Asia ex-Japan (EUR) is a price index, which takes dividends into account. Further details on JOM Silkkitie Investment Fund may befoundinthekey investor information document, fundprospectus andfundrules,which areavailable byrequest fromJOM Fund ManagementLtd, oron the website www.jom.fi. *For the fiscal period since 1.1.2018, % of fund average net assets. **Based on daily returns during 12 months. Detailedformulasavailable fromtheFundManagement Company.
JOM SILKKITIE, NET ASSET VALUE (31 November 2018) 222.60
Fund size 31.81 mEUR
Number of fund units 142 893.8168 kpl
Inception date 31.7.2009
Last month’s performance +6.50%
Performance since inception +122.60%
Annualized performance since inception +8.95%
Accumulated management fee* 1.11%
Accumulated performance fee* 0.00%
Accumulated custodian fee* 0.14%
Net investment position (prior to subscriptions on 30.11.2018) 96.8%
Volatility** 14.4%
Portfolio turnover 257.2%
Name:JOM Silkkitie Fund (UCITS)
Portfolio Manager:Juuso Mykkänen
Custodian: SEB. Helsinki branch
Benchmark index:No official index
Profit sharing:The Fund has only accumulating units
Fund rules last confirmed:7.7.2017
Inception date: 31.7.2009
ISIN-code: FI4000003470
Bloomberg-ticker: JOMSILK FH
Fund target group:Demanding investors who understand the potential of Asian equity markets in the long run.
Minimum subscription: 5 000 €
Subscription account:IBAN: FI81 3301 0001 1297 17
BIC: ESSEFIHXXXX
Management fee:1.2% p.a.
Subscription fee:1.5% - 0%
Redemption fee:1% (min. 20 €)
Performance fee:10% on the return exceeding the hurdle rate of 5%. (pls see Fund prospectus for details)
OVERVIEW OF THE FUND
JOM SILKKITIE ASIA EQUITY INVESTMENT FUND Monthly Report November 2018

FUND CORRELATION (12M, DAILY) WITH SOME EQUITY INDICES (EUR)
Jakarta Composite Index JCI
Philippine composite
Index PCOMP
HK China H sharesHSCEI
MSCI Asia ex-Japan
TopixMSCI World
S&P 500Bloomberg Europe 500
Index
Indonesia Philippines China Asia Japan World US Europe
0.52 0.28 0.64 0.67 0.43 0.22 0.09 0.30
FUND PERFORMANCE MONTHLY (%)
Jan Feb Mar Apr May Jun Jul Aug Sep Oct Nov Dec Year
2009 - - - - - - - -2.74 +7.49 +1.52 +0.40 +7.07 +14.08
2010 +3.55 -0.05 +9.66 +4.00 -8.12 +0.74 +7.55 +2.46 +13.95 +2.45 +2.73 +6.39 +53.60
2011 -8.11 -1.34 +2.81 +3.17 -2.47 -0.62 +7.75 -10.15 -14.07 +5.83 -4.11 +4.73 -17.59
2012 +8.75 +4.07 +2.35 +1.85 -4.68 -2.26 +2.58 -5.49 +0.90 +4.59 +5.35 +2.51 +21.44
2013 +6.18 +6.82 +3.25 -0.51 +10.17 -11.08 -1.57 -6.91 +2.00 +3.54 -1.15 +2.88 +12.31
2014 +2.31 +7.46 +0.14 +2.94 +2.21 -1.48 +7.98 +3.98 -1.25 -0.58 -0.33 -4.53 +19.72
2015 +6.02 +3.20 +5.89 +2.38 +3.81 -8.69 -3.22 -16.41 -2.44 +15.52 -1.36 -0.51 +0.61
2016 -9.61 +0.65 +5.97 +1.25 +1.71 +8.58 +7.75 +1.84 -1.66 +0.30 -3.26 +1.38 +14.44
2017 -0.55 +4.73 +1.51 -0.13 -0.67 -0.93 -4.23 -0.73 -0.40 +1.62 -2.73 +0.30 -2.46
2018 +1.54 +0.55 -5.46 +2.03 +4.85 -9.28 -4.14 +0.32 -5.39 -7.39 +6.50 -15.95
+ 14.08 %
+ 9.25 %
+ 40.60 %
- 6.80 %- 11.58 %
+ 9.92 %
+ 10.48 %+ 14.13 %
- 1.59 %
+ 14.13 %
+ 4.90 %
+ 12.45 %
- 10.52 %
+ 7.80 %+ 6.16 %
+ 3.90 %
- 6.13 %- 6.32 %
- 10.27 %
-20 %
+ 0 %
+ 20 %
+ 40 %
+ 60 %
FUND PERFORMANCE BI-ANNUALLY (%)
Pastperformance is noguaranteeforfuturereturns.The Fundvalue mayincrease ordecrease, andthe investor mayincur losses whenredeeming hisshares. MSCI AC Asia ex-Japan (EUR) is a price index, which takes dividends into account. Further details on JOM Silkkitie Asia Equity Investment Fundmaybefoundinthekeyinvestorinformationdocument,fundprospectusandfundrules,whichareavailablebyrequestfromJOMFundManagementLtd,oronthewebsitewww.jom.fi.
80
100
120
140
160
180
200
220
240
260
280
300
320
31.7.2009 12.6.2011 24.4.2013 7.3.2015 17.1.2017 30.11.2018
JOM SILKKITIE NAV VS. THE REGIONAL EQUITY MARKET INDEX
MSCI AC Asia ex-Japan (Total return, EUR)
JOM Silkkitie
JOM SILKKITIE ASIA EQUITY INVESTMENT FUND Monthly Report November 2018
J O M F u n d M a n a g e m e n t L t dS a l o m o n k a t u 1 7 B , 0 0 1 0 0 H e l s i n k i , F I N L A N D
T e l : + 3 5 8 9 6 7 0 1 1 5 , F ax : + 3 5 8 9 6 7 0 1 1 7in fo @j om . f i w w w . j om . f i
China 29 %
Indonesia 21 %Philippines
12 %
India 11 %
US3%
Vietnam 16 %
Myanmar 3%
Pakistan
5 %
Equities Geographical Break-down
Financial &
Property 27 %
Infra 14 %
Green &
Clean 5 %
Consumers 51
%
Hedge 3 %
Equities by Investment Themes

Monthly Report November 2018JOM SILKKITIE ASIA EQUITY INVESTMENT FUND
Above: Logistics costs will inevitable decline in Indonesia as infra is being improved.
In Indonesia and the Philippines during November
Prior to this visit we were in Jakarta in March. Indonesia’s capital had becomemuch cleaner since then, mostly due to the Asian Games that were held in August.There was hardly any rubbish alongside the streets and the city seems to befunctioning in a more orderly fashion, especially around the Thamrin and Kuninganareas. What was also notable, there were many more green plantings under thebridges and around infra and roads. Also, the traffic seemed to work quite fluentlycompared to earlier visits, however, the main reasons for better traffic were that1. subway is now in the testing phase, thus there are no more subway constructionsites blocking the traffic, 2. Odd-even registration plate policy is in action again. Allthis visible improvement in city’s cleanliness, traffic etc. are going to affectpositively foreign business-people’s and investors’ decisions when they visit theIndonesian capital.
What comes to infra completion, there will be two times more toll-roadscompleted in just 2018-19 than in the last 20 years combined – thus, the infra pushwill increasingly be reflected in the country’s productivity figures in the comingyears. Also, many of the companies we met highlighted how they will bebenefitting fromthe improved infra and connectivity, going forward.
The companies we met were relatively positive, give or take some variationdepending on the sector they operate in: the outlook for the banks were the moststable, as for the time being they did not see any meaningful negative effect arisingfrom the BI’s rate hikes, because the loan growth cycle has only recently started toclimb up from the multi-year bottom. Meanwhile, the companies operating in therapidly growing digitization business were extremely positive, as the underlyingstructural growth cannot be slowed down by economic cycles nor rate hikes. Inaddition, as Indonesia, with its 265m people, has emerged as a testing ground forseveral new mobile/digital/disruption -apps/technologies, many companiesoperating in the arena want to execute their expansion plans in rapid and flauntymanner – the growth is hugely visible!
J O M F u n d M a n a g e m e n t L t dS a l o m o n k a t u 1 7 B , 0 0 1 0 0 H e l s i n k i , F I N L A N D
T e l : + 3 5 8 9 6 7 0 1 1 5 , F ax : + 3 5 8 9 6 7 0 1 1 7in fo @j om . f i w w w . j om . f i
JOM SILKKITIE ASIA EQUITY INVESTMENT FUND
As the IDR has in recent years weakened against the USD, many companies haveincreasingly been forced to trim down their costs, in order to maintainsatisfactory margin levels. This was visible in Komodo’s portfolio companyArwana Citra (ARNA), which produces building materials; ARNA has managed tocut its energy and material costs as they have focused on improving their lineoperations.The most negative factor mentioned by the companies was the soft privateconsumption, especially in the big ticket items such as houses and cars. The mainreason for this cautiousness was due to the ongoing tax reform, as thegovernment is increasingly monitoring people’s consumption habits andcomparing that to their reported income and wealth. Thus, if you buy anexpensive house or a car, not corresponding to your reported income, the taxofficials may well pay you a visit.Therefore, changing people’s attitudes to pay taxes will take some time, and it isvery difficult to estimate for how long the consumer cautiousness will continue.Indonesia’s collected tax/GDP ratio is only around 10% currently, which is a verylow figure in the Asian context. The government’s medium term target is toincrease the ratio up toward a level of 14-15%.
Below: Loan growth cycle has re-emerged in Indonesia after reaching a multi year bottom. The loan growth cycle has been one of the missing links in the economy. In October the loan growth was +13.75% YoY, while during the last upcycle loans were growing at +20% YoY.
J O M F u n d M a n a g e m e n t L t dS a l o m o n k a t u 1 7 B , 0 0 1 0 0 H e l s i n k i , F I N L A N D
T e l : + 3 5 8 9 6 7 0 1 1 5 , F ax : + 3 5 8 9 6 7 0 1 1 7in fo @j om . f i w w w . j om . f i
Monthly Report November 2018
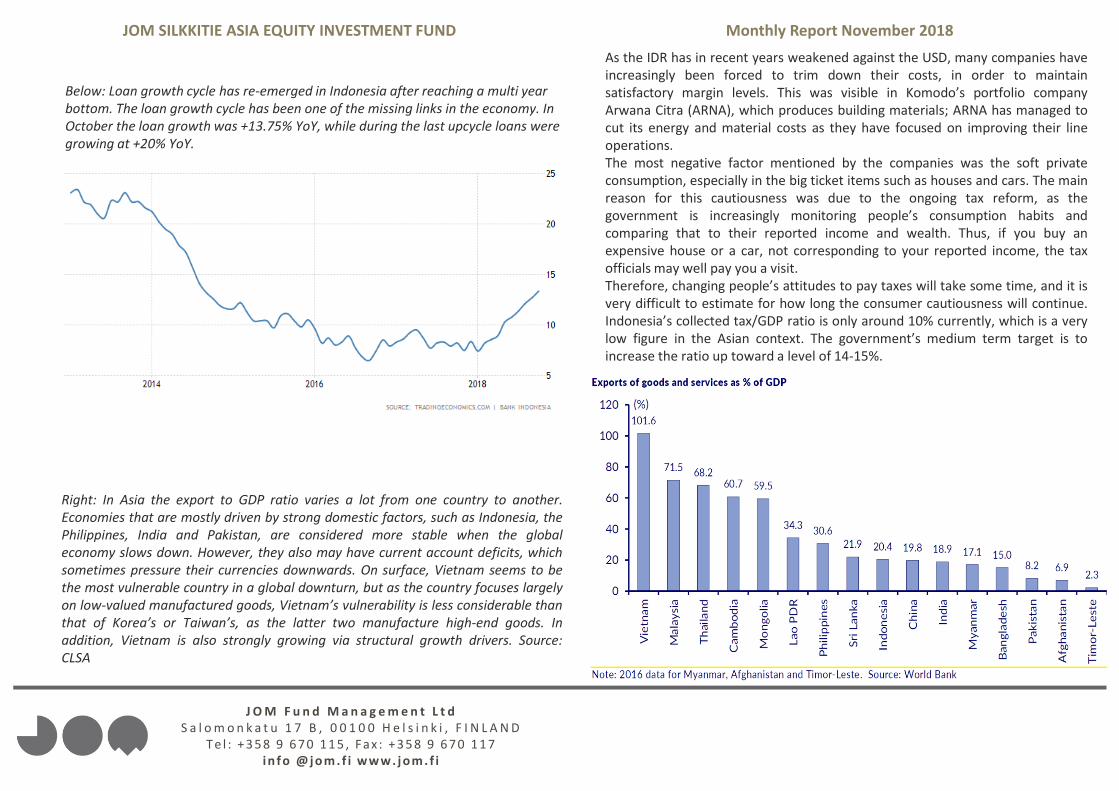
Right: In Asia the export to GDP ratio varies a lot from one country to another.Economies that are mostly driven by strong domestic factors, such as Indonesia, thePhilippines, India and Pakistan, are considered more stable when the globaleconomy slows down. However, they also may have current account deficits, whichsometimes pressure their currencies downwards. On surface, Vietnam seems to bethe most vulnerable country in a global downturn, but as the country focuses largelyon low-valued manufactured goods, Vietnam’s vulnerability is less considerable thanthat of Korea’s or Taiwan’s, as the latter two manufacture high-end goods. Inaddition, Vietnam is also strongly growing via structural growth drivers. Source:CLSA

JOM SILKKITIE ASIA EQUITY INVESTMENT FUND
The Philippines
We visited the country’s two largest cities, Cebu and Manila. We’ve previouslyvisited Cebu only once, which was some 16 months ago during the summer of2017. This time it was very clear that the city is growing rapidly, as its skyline hadchanged tremendously, now having a much bigger city feel to it with a plethorahigh-rise buildings and construction cranes. Our portfolio company, CebuLandmasters' (CLI) comments were also reflecting that growth is continuing inthe Visayas area where where the company is headquartered, as well as in theMindanao-area. CLI’s 9m/2018 net income increased by 27% YoY and the fullyear result growth should even be slightly better. PE for 2018 is only 4x, P/NAVdiscount is 75%, CLI is also buying back its own shares and paying a 3.5%dividend.
We also visited MCIA (Mactan Cebu International Airport) new terminal-2, whichhad started to operate in July 2018. T-2 is dedicated solely for internationalflights, whereas the older T-1 is for domestic flights. The Silkkitie portfolioholding Megawide has constructed the T-2 and has a concession to operate MCIAfor 25 years. With the new T-2, Cebu and the surrounding areas are set forfurther acceleration of tourism growth. In the Mactan island where airport islocated, there are numerous new holiday resorts and hotels under construction,and the rumor has it that Cebu may in the near future have direct flights alsofrom Europe, complementing the current selection of routes from various Asiancities.
In Manila, we met companies from a number of sectors, such as property,consumption, manufacturing industry, as well as some large conglomerates,operating in various areas of the economy. Surprisingly, the most positivemessage was coming from the property developers, as even in the high-endproperties, demand has been very robust in most of Manila’s business centerssuch as Makati and Bonifacio Global City. The prices per square meter can be ashigh as 10kEUR, but on average they tend to be around 3-4kEUR per squaremeter. Foreign, especially the Chinese buyers, have been active in the high-endsegment. Apparently, the structural growth in the mid-end segment is still veryrobust, despite the interest rates having been hiked due to the inflationarypressures arising mainly from the higher oil price.
Above: MCIA T-2 was a state of the art type of terminal, with all the best and latest airport tech devices (security check, conveyor belt etc.) that will definitely have a positive effect on the visitors. However, a bit of a negative impression was created by the standard gap between the visibly quite poor older terminal T-1 as compared to the new T-2.
J O M F u n d M a n a g e m e n t L t dS a l o m o n k a t u 1 7 B , 0 0 1 0 0 H e l s i n k i , F I N L A N D
T e l : + 3 5 8 9 6 7 0 1 1 5 , F ax : + 3 5 8 9 6 7 0 1 1 7in fo @j om . f i w w w . j om . f i
Monthly Report November 2018
In addition, as the Philippines have been running a current account deficit, puttingpressure on the peso, the domestic consumption outside of property has been softer in2018 (auto sales, for example). Nevertheless, the country’s midlle income class is set togrow for much longer – an argument bought also by Ikea – as the Swedish furniture giantis building the world’s largest Ikea-store with SM Group in Manila’s Pasay City. SM Groupis also operating one of the largest malls, Mall of Asia, in the same location.

JOM SILKKITIE ASIA EQUITY INVESTMENT FUND
Above: The Cebu skyline is changing rapidly as the building boom continues, and the city is attracting more tourists and businesses.
J O M F u n d M a n a g e m e n t L t dS a l o m o n k a t u 1 7 B , 0 0 1 0 0 H e l s i n k i , F I N L A N D
T e l : + 3 5 8 9 6 7 0 1 1 5 , F ax : + 3 5 8 9 6 7 0 1 1 7in fo @j om . f i w w w . j om . f i
Monthly Report November 2018
Above: The PHP has declined vs the USD over the last three years, as the currentaccount has turned negative due to strong domestic demand. However, the PHP hasrecently gained somewhat, along with the other EM currencies. Source: Bloomberg
44
46
48
50
52
54
56
2.1
2.2
01
5
2.2
.20
16
2.4
.20
16
2.6
.20
16
2.8
.20
16
2.1
0.2
01
6
2.1
2.2
01
6
2.2
.20
17
2.4
.20
17
2.6
.20
17
2.8
.20
17
2.1
0.2
01
7
2.1
2.2
01
7
2.2
.20
18
2.4
.20
18
2.6
.20
18
2.8
.20
18
2.1
0.2
01
8
USD-PHP 3yr

Past performance is no guarantee for future returns. The Fund value may increase or decrease, and the investor may incur losses when redeeming his shares. Jakarta Composite Index (EUR) and MV Indonesia SmallCap Index (EUR) are price indices, which take dividends into account. Further details on JOM Komodo Investment Fund may be found in the key investor information document, fund prospectus and fund rules, which areavailable by request from JOM Fund Management Ltd, or on the website www.jom.fi. *For the fiscal period since 1.1.2018, % of fund average netassets. **Will be calculated based on daily returns during 12 months. after the fund has sufficient track history. Detailed formulas availablefrom the Fund Management Company.
JOM Komodo Indonesia Equity Investment Fund’s NAV was 157.19 at the end ofNovember, as it increased by 13.25% during the month. Since fund inception (15th
May 2012) the NAV has increased by +57.19%, thus the annual performance hasbeen +7.15%.
The Indonesian capital markets started to attract increasingly foreign investors in
November: foreign inflow to equities was +600mUSD while inflow to government
bonds was +2.1bnUSD. We think there are two clear reasons for foreign inflows: 1.
external factors such as decline in the price of oil, US Fed’s rate hike slowdown and
possible USD weakness, and market stress shift more toward US capital markets. 2.
Clear signs of growth in Indonesian domestic economic cycle such as bank loans,
property and investment cycle. Also infra improvements are now starting slowly to
bear fruit in various economic sectors.
Indonesia’s large domestic driven economy and its low correlation to global trade
cycle are also positive factors for many global investors. This is now increasingly
important as during last few years, when global trade cycle was running strongly,
global investment flows were flowing toward beneficiaries of strong trade cycle and
especially toward tech sector while at the same time money was increasingly flowing
out from many Asia’s domestic driven themes (despite their healthy growth and
profits), thus making these sectors trading at very cheap valuation levels. Therefore
we think that now as global trade cycle slowing, investment flows start to seek for
themes and stocks that are structurally growing. So, currently we see situation rather
attractive for Indonesia assets as long as there is not globally any credit event similar
magnitude of 2008-09.
During the month we increased weights of stocks that operate only in domestic
driven themes, and that are trading at multi-year low valuation levels
JOM KOMODO, NET ASSET VALUE (30 November 2018) 157.19
Size of the fund 13.70 mEUR
Number of fund units 87 173.3476
Inception date 15.5.2012
Last month’s performance +13.25%
Performance since inception +57.19%
Annualised performance since inception +7.15%
Accumulated management fee* 1.38%
Accumulated performance fee* 0.00%
Accumulated custodian fee* 0.24%
Net investment position (prior to subscriptions on 30.11.2018) 97.9%
Volatility** 16.3%
Portfolio turnover 197.12%
Fund’s correlation to JCI-Index (12m) 0.69
Name:JOM Komodo Fund (UCITS)
Portfolio Manager:Juuso Mykkänen
Custodian: SEB. Helsinki branch
Benchmark index:No official index
Profit sharing:The Fund has only accumulating units
Fund rules last confirmed:7.7.2017
Inception date: 15.5.2012
ISIN-code: FI4000043401
Fund target group:Demanding investors who understand the potential of Asian equity markets in the long run.
Minimum subscription:5 000 €
Subscription account:IBAN:FI75 3301 0001 1363 24
BIC: ESSEFIHXXX
Management fee:1.5% p.a.
Subscription fee:1.5% - 0%
Redemption fee:2% (min. 20 €)
Performance fee:10% on the return exceeding the hurdle rate of 5%. (pls see Fund prospectus for details)
FUND OVERVIEW
J O M F u n d M a n a g e m e n t L t dS a l o m o n k a t u 1 7 B , 0 0 1 0 0 H e l s i n k i , F I N L A N D
T e l : + 3 5 8 9 6 7 0 1 1 5 , F ax : + 3 5 8 9 6 7 0 1 1 7in fo @j om . f i w w w . j om . f i
JOM KOMODO INDONESIA EQUITY INVESTMENT FUND Monthly Report November 2018

Past performance is no guarantee for future returns. The Fund value may increase or decrease, and the investor may incur losses when redeeming his shares. Jakarta Composite Index (EUR) and MV Indonesia SmallCap Index (EUR) are price indices, which take dividends into account. Further details on JOM Komodo Investment Fund may be found in the key investor information document, fund prospectus and fund rules, which areavailable by request from JOM Fund Management Ltd, or on the website www.jom.fi. *For the fiscal period since 1.1.2018, % of fund average netassets. **Will be calculated based on daily returns during 12 months. after the fund has sufficient track history. Detailed formulas availablefrom the Fund Management Company.
J O M F u n d M a n a g e m e n t L t dS a l o m o n k a t u 1 7 B , 0 0 1 0 0 H e l s i n k i , F I N L A N D
T e l : + 3 5 8 9 6 7 0 1 1 5 , F ax : + 3 5 8 9 6 7 0 1 1 7in fo @j om . f i w w w . j om . f i
JOM KOMODO INDONESIA EQUITY INVESTMENT FUND Monthly Report November 2018
40
60
80
100
120
140
160
180
15.5.2012 17.6.2013 21.7.2014 23.8.2015 25.9.2016 28.10.2017 1.12.2018
JOM KOMODO NAV VS. INDONESIA EQUITY INDICES
JAKARTA COMPOSITE Index (EUR)
S&P Indonesia SmallCap Price (EUR)
JOM Komodo
FUND PERFORMANCE MONTHLY (%)
Jan Feb Mar Apr May Jun Jul Aug Sep Oct Nov Dec Year
2012 - - - - -6.29 +0.42 +3.62 -8.02 +3.01 +0.71 +7.63 -4.57 -4.34
2013 +6.05 +17.64 +13.43 +1.54 +11.52 -11.79 -8.95 -20.95 -0.95 +7.28 -13.95 -3.40 -10.13
2014 +9.68 +15.86 +10.77 -1.42 +3.20 -6.05 +10.24 +8.15 -2.09 +2.30 +5.50 +2.61 +73.92
2015 +2.45 +0.04 +2.24 -8.35 +1.42 -6.30 +0.26 -16.99 -8.01 +21.09 -1.75 -0.47 -17.26
2016 -1.69 +3.01 +5.87 +0.63 -0.86 +8.49 +9.63 +4.12 -3.45 +7.33 -6.93 +2.44 +30.86
2017 -0.30 +5.05 -0.38 +1.37 +0.73 -2.46 -4.74 -1.73 +1.37 +3.63 -4.47 -1.28 -3.63
2018 +5.21 +0.16 -1.45 +1.09 +3.50 -6.29 -1.32 -4.18 -3.48 -4.27 +13.35 +0.75
Industrial 20%
Financial 22%
Consumer, Non-
cyclical 5%Communications 5%
Consumer,
Cyclical 30%
Basic
Materials
15%
Technology
3%
Equities by Investment Themes
2
3
4
5
6
7
8
9
1.2
.20
10
1.7
.20
10
1.1
2.2
01
0
1.5
.20
11
1.1
0.2
01
1
1.3
.20
12
1.8
.20
12
1.1
.20
13
1.6
.20
13
1.1
1.2
01
3
1.4
.20
14
1.9
.20
14
1.2
.20
15
1.7
.20
15
1.1
2.2
01
5
1.5
.20
16
1.1
0.2
01
6
1.3
.20
17
1.8
.20
17
1.1
.20
18
1.6
.20
18
1.1
1.2
01
8
Inflation and interest rates in Indonesia2010 - today
Inflation Interest rate
Above: BI (Bank Indonesia) surprised markets by lifting interest rates by 25bps to 6% level on 15th November. Capital market reaction to this move was very positive. Source: Bloomberg.