
Joint Working Party on Trade and Environment Report on the ...

UHMD Joint Environment Working Group – Agenda – 9 September 2020
AGENDA
Upper Hunter Mining Dialogue
Joint Environment Working Group
Wednesday 9 September 2020, 10:00 am to 12:00 pm
Join via Zoom Video or Teleconference - details below:
Join Zoom Meeting via Web Browser: Link: https://us02web.zoom.us/j/86853778382?pwd=Yzg5UEhIMlA3UGJ4djFYOFNkaXZTZz09
Passcode: UHMDJEWG
Join Zoom Meeting via Telephone: Dial: +61 2 8015 6011 Australia
Meeting ID: 868 5377 8382
No. Item Attachment
1. Welcome and Apologies (5 mins)
2. Minutes and actions of the previous meeting (5 mins)
3. COVID-19 Update and Impacts on 2020 Projects and Activities (20 mins)
4. Update on Emissions & Health Projects (20 mins)
5. Update on Land Management Projects (20 mins) Yes
6. Update on Water Projects (20 mins) Yes
7. Update on Communications Activities (10 mins)
8. Update on other Dialogue Working Groups/Committees (10 mins)
9. Other Business (5 mins)
10. Next Meeting & Close (5 mins)

UHMD Joint Environment Working Group Meeting – 9 September 2020
1
Upper Hunter Mining Dialogue Joint Environment Working Group - 9 September 2020
Agenda Item 2
DRAFT MINUTES
Upper Hunter Mining Dialogue
Joint Environment Working Group Meeting
UHMD Resource Centre, Upstairs of the Town Square Shopping Centre Suite 1, 159 John Street, Singleton NSW 2330
Wednesday 10 June 2020: 10.00 am to 11.20 pm
Attending: Paul Amidy (Chair) Glencore Andrew Reid MACH Energy Mount Pleasant Operation Glenda Briggs Regional NSW (Regions, Industry, Agriculture and Resources) Cameron Archer The University of Newcastle Julie Thomas Muswellbrook Coal Company Bill Baxter Yancoal Jeff (R.J.) Esdaile Community member Mary-Anne Crawford Singleton Council Neville Hodkinson Singleton Shire Healthy Environment Group Lisa Richards BHP Sharon Pope Muswellbrook Shire Council Ned Stephenson Glencore Chris Knight The Bloomfield Group Matthew Newton Resources Regulator Ken Bray Hunter Valley Water Users Association Bob Mackie theresource James Barben NSW Minerals Council Craig Milton NSW Minerals Council Apologies Carolyn Herlihy Hunter New England LHD Daniel Lewer Hunter Land Management Adam Gilligan NSW Environment Protection Agency Jo Powells Local Land Services Jim Morgan Wybong Action Group/NSW Farmers Federation Peter York Thiess Simon Francis DPI Water
1. Welcome and apologies The Chair welcomed all attendees and noted the apologies received. Mr. Barben thanked all for joining via Zoom and teleconference.
2. Minutes from Previous Meeting
The minutes for the previous meeting were accepted, except for one recommended change to the previous meeting’s minutes. In agenda item 11 - Dr. Hodkinson’s presentation, the Dialogue secretariat is to update the passage that refers to ‘minimisation dispersion’, as “minimisation of pollution and dispersion” instead. The minutes will be amended and recirculated for approval.

UHMD Joint Environment Working Group Meeting – 9 September 2020
2
Action: ● Dialogue secretariat to review and edit previous minutes to reflect Dr. Hodkinson’s advice
regarding ‘minimisation of pollution and dispersion’
3. Update on COVID-19 and impacts on Dialogue projects and activities Mr. Barben updated members on the Dialogue’s approach to COVID-19, and the impact this has had on a variety of the Dialogue’s engagement activities, primarily the School Mine Tours Program and attendance at community events. Given the ongoing restrictions regarding public gatherings may impact the Dialogue’s ability to host working group meetings for the September round of meetings, members encouraged the Dialogue to consider alternative methods of engaging and communicating with stakeholders. Ms. Crawford advised that Singleton Council could act as a short-term replacement meeting venue to adhere to current restrictions which the Dialogue secretariat was open to exploring further. Comments regarding the Air Quality report made under this agenda item have been included below in the discussion for agenda item 4.
4. Update on Emissions and Health Projects Mr. Milton provided a brief overview of the Air Quality project. The Dialogue secretariat has recently received peer review comments from Melita Keywood from the CSIRO and will seek to work through these with the report’s authors at ERM to ensure these are reflected in the final report. Members were keen to review this feedback and the Dialogue secretariat agreed to share this report with members. Dr. Hodkinson noted that the ‘community perceptions’ and addressing perceptions on impacts to health is key to the issue of community engagement. Dr. Hodkinson advised that responses from the government and industry have not met these community expectations to date, and was concerned that the draft report as is, may create confusion in the community and open the Dialogue up to criticism. Dr. Hodkinson shared that he had provided a response to the initial report and suggested this be shared with members, as it outlined various issues. While the air may appear to be cleaner than it once was, this is not necessarily reflected in this analysis of PM2.5 and PM10 data. Mr. Barben agreed that there may be an issue with a mismatch between the timescales. Dr. Hodkinson advised that he felt the work that Matt Riley and DPIE-EES was undertaking was bridging between the minimisation of pollution and dispersion project and the Dialogue’s Air Quality study. When queried if the DPIE-EES work would be useful in responding in a more rapid time frame, Dr. Hodkinson agreed this has been useful and is a step in the right direction, though noted Mr. Riley and his team would need more time to come out with a more refined product. Other feedback from members was positive and noted that we can only work with the data that is available. Dr. Hodkinson advised that if the Dialogue’s report included a statement about the limitations of the study, this may go some way to benefiting the report, as its current design will only tell the one story despite the peer review’s comments. Mr. Barben accepted these concerns and the Dialogue secretariat would be looking into this issue further. ACTION:
● Dialogue secretariat to distribute Melita Keywood (CSIRO) peer review comments to the Joint Environment Working Group members.
● Dialogue secretariat to distribute Dr. Hodkinson’s comments regarding the initial report to the Working Group for review.
5. Update on Land Management Projects
Mr. Milton advised that the Dialogue was close to finalising the rehabilitation and disturbance data for 2019. Mr. Newton (Resources Regulator) advised that COVID-19 has impacted RR’s ability to finalise the
UHMD Joint Environment Working Group Meeting – 9 September 2020
3
Operational Rehabilitation Reforms regulation, however he expected these would go out in the next few weeks for review, over a six-week consultation period. Mr. Newton advised the reforms are similar to those in 2018/19, however instead of imposing these by way of title conditions, these would be facilitated by an amendment to the regulation instead. Members encouraged the RR to consult with external communities in a tailored manner to ensure they understand the reforms (e.g. key changes and the effectiveness of the new regulation and how it will benefit the Upper Hunter community). Mr. Newton advised that the reforms would be consulted along the lines of the regular gazetting process and would involve engagement with all key stakeholders, and that this would be communicated through the Mine Rehabilitation News subscription newsletter service, as well as a webinar. Mr. Newton also updated members on the ‘Mine Rehabilitation News’, a new environmental newsletter the RR is producing, and encouraged members to subscribe for the latest updates. Industry members advised of registration issues for those who had already subscribed to the Safety news service, which Mr. Newton advised he would be following up. Member can subscribe to the Mining Sustainability Matters newsletter here: https://nsw.us2.list-manage.com/subscribe?u=d8b64a3fbc7f2ff2db8ec673b&id=6d7810af78 Mr. Newton advised that the rehabilitation GIS portal is live, however the RR is awaiting regulation to publish this information. They are seeking voluntary submission of data from sites until such time that it becomes mandatory to provide. Members agreed that the publishing of this data will increase transparency of mine rehabilitation progress, with Mr. Barben noting this is the logical next step of the Dialogue’s annual reporting project. Industry members queried whether the system would automatically update to the latest available data, or if there would be a note within the portal advising when the data displayed was entered into the system. Mr. Newton advised that once the portal is mandatory, companies will be more confident that their data is accurate and that what is displayed is the most recent and correct data. Mr. Newton expected that within the next 12 months, all operations will be reporting rehabilitation data through this portal and would be happy to discuss with any interested parties further offline. Mr. Reid provided a brief update on the work that Mount Pleasant Operations is undertaking with Firesticks Alliance regarding cultural burns on their site. MPO is currently in discussions with the RFS and is on track to start burns on a 25-ha area to the North West of their operations in the coming months. ACTION:
● Dialogue secretariat to share the link to register for the Resource Regulator’s Mine Rehabilitation News subscription service.
6. Update on Water Projects
Mr. Milton and Mr. Barben updated members on the two main water projects, the Water Accounting Framework annual project, and the HRSTS Water Quality Study, with both projects awaiting data to finalise.
7. Update on Communications Activities Mr. Milton provided an update on the Dialogue’s planning for a website upgrade and what this will likely involve. Mr. Newtown also advised of a new summary video showcasing rehabilitation at various NSW sites, including those in the Upper Hunter which has recently been released. Please click the following link to view: https://www.youtube.com/watch?v=BWykINHEEZQ&feature=youtu.be Mr. Mackie updated members on the Dialogue’s other engagement and communications activities. While COVID-19 has impacted the ability to attend community events, the Dialogue has been working to increase communications during this time, including enhancing social media planning and expediting the release of the revamped ‘The Dialogue’ newsletter.
8. Update on Dialogue Working Groups and Committees
UHMD Joint Environment Working Group Meeting – 9 September 2020
4
Other Working Group updates were noted by members.
9. Other Business No other business was raised.
10. Next Meeting / Close The next meeting is scheduled for Wednesday 9 September 2020. The Dialogue secretariat will be reviewing the COVID-19 restrictions for public gatherings and will determine how best to undertake this meeting, although we anticipate this will likely continue as a face to face meeting by this time, albeit potential in a different venue. We will update members closer to the meeting. The meeting closed at 11:10 AM.
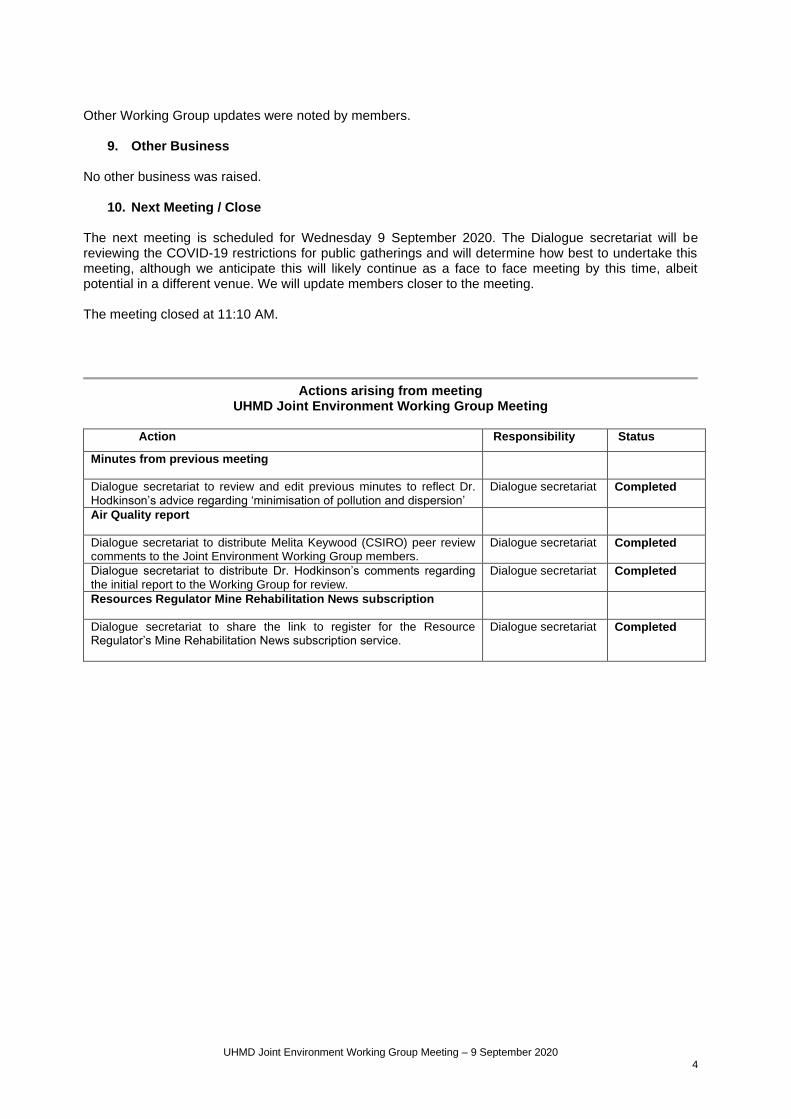
Actions arising from meeting
UHMD Joint Environment Working Group Meeting
Action Responsibility Status
Minutes from previous meeting
Dialogue secretariat to review and edit previous minutes to reflect Dr. Hodkinson’s advice regarding ‘minimisation of pollution and dispersion’
Dialogue secretariat Completed
Air Quality report
Dialogue secretariat to distribute Melita Keywood (CSIRO) peer review comments to the Joint Environment Working Group members.
Dialogue secretariat Completed
Dialogue secretariat to distribute Dr. Hodkinson’s comments regarding the initial report to the Working Group for review.
Dialogue secretariat Completed
Resources Regulator Mine Rehabilitation News subscription
Dialogue secretariat to share the link to register for the Resource Regulator’s Mine Rehabilitation News subscription service.
Dialogue secretariat Completed

UHMD Joint Environment Working Group Meeting – 9 September 2020
5
Upper Hunter Mining Dialogue Joint Environment Working Group - 9 September 2020
Agenda Item 3
COVID-19 UPDATE AND IMPACTS ON 2020 DIALOGUE PROJECTS AND ACTIVITIES Issue The ongoing COVID-19 pandemic has resulted in a significant disruption to many of the Dialogue’s usual activities throughout the calendar year. Background Since the June 2020 meetings, the Dialogue has opted to continue with virtual meetings until such time when government health advice determines it is safe to host face-to-face meetings at the Dialogue offices. If such meetings are permitted but are required to be in accordance with specified rules (e.g. 1 person per 4 m2), the Dialogue will seek to find alternative arrangements. To date, the virtual meetings have been successful, with a higher number of attendees using this platform than in previous meetings, so we expect these meetings to continue in this format in the interim. As members were advised in July, the ongoing challenge of COVID-19 and the ongoing impact of restrictions has required the Dialogue to unfortunately cancel the 2020 Forum event. The forum is a valued community event for various UHMD stakeholders, and we look forward to planning its return in 2021. Similarly, the UHMD has had to cancel the remainder of the 2020 School Mine Tours Programs due to current bans on school excursions and to reduce the possible risk of introducing COVID-19 to schools and mine sites. With significant interest in participation, the School Tours Program was set for a record year in 2020, with 22 schools from across the Upper Hunter to be involved. The Dialogue fully intends to offer the School Mine Tours Program in 2021, providing the can be delivered safely. COVID-19 has also impacted the UHMD's other significant community engagement activities. The Broke Village Fair and Singleton Show were scheduled for September, but both have been cancelled. The Dialogue was working to ensure the Hunter Coal Festival could take place but this event organisers should this event be able to proceed as planned in October. In the meantime, the Dialogue has been working to finalise a number of projects, with updates on these projects included throughout these papers. FOR INFORMATION/DISCUSSION

UHMD Joint Environment Working Group Meeting – 9 September 2020 6
Upper Hunter Mining Dialogue Joint Environment Working Group - 9 September 2020
Agenda Item 4
EMISSIONS AND HEALTH UPDATE
Please see below for a summary of current Dialogue projects and other activities being undertaken in the Emissions and Health area:
Analysis of Upper Hunter Air Quality Monitoring Network Data
The Dialogue continues to progress with an analysis of the Upper Hunter Air Quality Monitoring Network data project.
At the June 2020 Joint Working Group meeting, members were able to discuss the draft report, and provide additional feedback to be considered by ERM as they work to incorporate Dialogue member comments and those from the CSIRO peer review, undertaken by Melita Keywood. The CSIRO peer review was distributed to Working Group members, alongside analysis by Neville Hodkinson.
ERM is currently finalising a draft to incorporate the CSIRO comments and recommendations, as well as additional member feedback into a revised report. The revised report will include some objective statistical analysis, which will be included as an appendix to the report.
As these revisions are still in progress, the Dialogue secretariat is unable to distribute the latest report to the Joint Working Group at this time. The Dialogue secretariat will distribute the revised report to members out of session in the coming weeks, which will provide a final opportunity for members to review the report prior to publication.
The Dialogue is preparing a release plan for the Air Quality Report, which will involve: ● Uploading the report onto the Dialogue website; and● Highlighting the report’s key findings in UHMD media.
Upper Hunter Air Quality Monitoring Network - Summer 2019/20 Update
The Summer 2019-20 seasonal air quality update is yet to be published. This typically occurs in late August 2020, so please click the link below to check for the full report once published: https://www.environment.nsw.gov.au/topics/air/air-publications?regions=Hunter
Recommendation:
● That Working Group members discuss the air quality report and consider the Dialogue’srelease and promotion of this report to stakeholders and through local media.
FOR INFORMATION/DISCUSSION

UHMD Joint Environment Working Group Meeting – 9 September 2020 7
Upper Hunter Mining Dialogue Joint Environment Working Group - 9 September 2020
Agenda Item 5
UPDATE ON LAND MANAGEMENT PROJECTS
Please see below for a summary of current Dialogue projects and other activities being undertaken in the Land Management area:
Rehabilitation Principles and Commitments - 2019 Results and Company Reports
The Dialogue has collated region-wide rehabilitation and disturbance data for the 2019 calendar year from Upper Hunter industry members. Please see the attached summary for full details.
While there have been some key improvements in a number of areas from the 2018 results, it should be noted that there is still a net increase in the amount of disturbance, which presents an ongoing challenge for industry to address.
Key findings of interest include: ● There was a 41% decrease in newly disturbed land during 2019 (979ha) compared to the 2018
figure of 1,666 ha. ● 2019 recorded the lowest total figure of newly disturbed land in a calendar year since the reporting
project commenced in 2012, significantly less than the long-term average of 1214 ha per year. ● There was 869 ha of newly rehabilitated land during 2019, which is a 19% decrease from 2018.
The 2019 figure is slightly less than the long-term average of 891 ha per year, during a period where the region experienced prolonged drought conditions and low rainfall.
● The annual rehabilitation to disturbance ratio increased to 0.89 in 2018, which is a significantimprovement from 0.64 in 2018. This is the highest amount reported since the project commenced in 2012 and is the closest to parity.
● The amount of biodiversity offset land and managed land increased slightly in 2019, although thishas remained relatively stable and comparable to the figure reported in 2017.
● The total land under rehabilitation at Upper Hunter companies has risen to 13,470 ha, an increaseof 53% on the total rehabilitation figure reported in 2012.
● The overall proportion of disturbed land rehabilitated increased 1.2% on the 2018 figure, and isnow at 37.4% in 2019, up from 36.2% in 2018.
● The total amounts for managed land and buffer lands remained largely unchanged from figuresreported in 2018.
The Dialogue is planning for the release of 2019 result, which will involve: ● Publishing the results, preparing infographics highlighting the result analysis and trends, and
individual company reports will also be published on the website, as we have done in previous years.
● The Dialogue will seek to actively promote the results and key findings in local media publications.● It is important to acknowledge the various environmental challenges that the Upper Hunter faces
as the region continues to experience drought conditions and below-average rainfall.
Operational Rehabilitation (Compliance and Reporting Reforms)
The Dialogue understands that the Resources Regulator intends to release the revised reforms in early September, accompanied by a six-week consultation period.
Grazing Trials / ACARP study into rehabilitation projects
ACARP project C27030 - Examination of Past and Present Mine Rehabilitation to Grazing Land as a Guide to Future Research, is still being finalised. A draft report was reviewed by the industry monitors who provided feedback directly to ACARP shortly after Justine Cox’s presentation to the Joint Working Group in March. Once completed, the report will be distributed to Working Group members.

UHMD Joint Environment Working Group Meeting – 9 September 2020 8
Pilot Pathway for Post-Mining Land Use
Work continues to advance case studies to test the pilot pathways for post mining land uses. NSWMC and member companies continue to advocate for action on this matter with a variety of regulators including the Department of Resources and Geoscience and the Resources Regulator.
While it was understood that resourcing was to be allocated within DPIE to manage this matter, this is yet to occur, and the matter is currently being managed by Michael Wright and Stephen Wills. The Dialogue is seeking an update from Mr. Wills, and hope to share a verbal update at the meeting if possible.
The Dialogue is also seeking an update on the Upper Hunter Economic Diversification Project which Mr. Wills referred to at the 2019 Forum presentation, which stakeholders were keen to learn more about.
Recommendation:
● That Working Group members discuss the 2019 rehabilitation results and endorse thesefor publication.
FOR DISCUSSION/DECISION
Attachment: Draft 2019 Rehabilitation Principles and Commitments Summary of Results
Please note: As these are yet to be published on the Dialogue website, we kindly ask that these attachments are not distributed beyond the Working Group members at this stage.

UHMD Joint Environment Working Group Meeting – 9 September 2020
9
Attachment: Draft 2019 Rehabilitation Principles and Commitments Summary of Results
Rehabilitation Principles and Commitments: Results 2012-2019
Rehabilitation 2012 2013 2014 2015 2016 2017 2018 2019
A
Total land area disturbed and not yet
rehabilitated at the beginning of the
reporting period (ha) 17,830 18,098 18,479 20,171 21,180 21,472 21,816 22,276
B Total amount of land newly disturbed
within the reporting period (ha) 1,163 1,148 1,057 1,424 1,270 1,008 1,666 979
C
Total amount of land newly
rehabilitated within the reporting period
(rehabilitation commenced in this
period) (ha) 895 962 801 856 907 763 1,071 869
D
Total land area disturbed and not yet
rehabilitated at the end of the reporting
period (D = A + B - C) (ha) 18,098 18,283 18,736 21,008 21,304 21,770 22,411
22,518
*
E
Total area of rehabilitation at all
operations at the end of the reporting
period (ha) 8,791 9,145 10,023 10,783 11,653 12,315 12,714
13,470
*
F Annual rehabilitation to disturbance
ratio (C: B) 0.77 0.84 0.76 0.6 0.71 0.75 0.64 0.89
G Overall proportion of disturbed land
rehabilitated (E/(D+E)) (%) 32.7% 33.3% 34.9% 33.9% 35.4% 36.1% 36.2% 37.4%
Other Land Managed 2012 2013 2014 2015 2016 2017 2018 2019
Estimate of the total land held as
biodiversity offsets (ha) 10,973 13,164 22,607 22,773 25,466 41,768 41,139 41,803
Estimate of the total area of land
managed for agricultural use (e.g.
grazing, cropping, viticulture) (ha) 57,533 60,174 44,252 44,632 40,146 59,320 59,212 59,209
Estimate of total buffer land (ha) N/A N/A N/A N/A N/A N/A 47,063 47,179
Note: All land area figures are reported in hectares (ha).
Key observations:
● There was a 41% decrease in newly disturbed land during 2019 (979ha) compared to the 2018 figure of 1,666 ha.
● 2019 recorded the lowest total figure of newly disturbed land in a calendar year since the reporting project commenced in 2012, significantly less than the long-term average of 1214 ha per year.
● There was 869 ha of newly rehabilitated land during 2019, which is a 19% decrease from 2018. The 2019 figure is slightly less than the long-term average of 891 ha per year, during a period where the region experienced prolonged drought conditions and low rainfall.
● The annual rehabilitation to disturbance ratio increased to 0.89 in 2018, which is a significant improvement from 0.64 in 2018. This is the highest amount reported since the project commenced in 2012 and is the closest to parity.
● The amount of biodiversity offset land and managed land increased slightly in 2019, although this has remained relatively stable and comparable to the figure reported in 2017.
● The total land under rehabilitation at Upper Hunter companies has risen to 13,470 ha, an increase of 53% on the total rehabilitation figure reported in 2012.

UHMD Joint Environment Working Group Meeting – 9 September 2020 10
● The overall proportion of disturbed land rehabilitated increased 1.2% on the 2018 figure, and isnow at 37.4% in 2019, up from 36.2% in 2018.
● The total amounts for managed land and buffer lands remained largely unchanged from figuresreported in 2018.
*Note for 2019 data:● The reported D and E figures for 2019 do not align with previously reported data. This is as a
result of Yancoal reporting that 170 ha of previously reported rehabilitation being reclassified as
a result of an Independent Rehabilitation Review conducted in 2019. Approximately 40 ha of this amount was reported as rehab disturbance in 2019, however a remaining discrepancy of 130 ha was removed from the rehabilitation reporting due to the fact that these were seeded to cover crops, but not the final seed mixes. These areas will be seeded to the final seed mixes in 2020 and 2021 and will feed back into the rehabilitation reporting figures in the coming years.
2019 Graphs:

UHMD Joint Environment Working Group Meeting – 9 September 2020 11
Buffer Land Reporting: 2019 Results 2018 (ha) 2019 (ha)
A Agricultural land - grazing, dairy, cropping, intensive, other 42,367 42,365
B Residential land 904 908
C Commercial land 71 185
D Recreational land 36 36
E Other land (including vacant land and land not suitable for use) 3,685 3,684
Total area of buffer land 47,063 47,179

Rehabilitation 2012 2013 2014 2015 2016 2017 [8] 2018 2019
A: Total land area disturbed and not yet rehabilitated at the beginning of the reporting period (hectares) [4]
17,830 18,098 18,479 20,171 21,180 21,472 21,816 22,276
B: Total amount of land newlydisturbed within the reporting period (hectares)
1,163 1,148 1,057 1,424 [6] 1,270 1,008 1,666 979
C: Total amount of land newly rehabilitated [1] within the reporting period (hectares)
895 962 801 856 907 763 1,071 869
D: Total land area disturbed and not yet rehabilitated at the end of the reporting period (D=A+B-C) (hectares)
18,098 18,283 18,736 21,008 21,304 21,770 22,411 22,518 [10]
E: Total area of rehabilitation at all operations at the end of the reporting period (hectares) [2]
8,791 9,145 10,023
10,783 11,653 12,315 12,714 13,470
F: Annual rehabilitation to disturbance ratio (C:B) [3]
0.77
0.84 0.76 0.6 0.71 0.75 [7] 0.640.89
G: Overall proportion of disturbed land rehabilitated 32.7% 33.3% 34.9% 33.9% 35.4% 36.1% 36.2% 37.4%
Other Managed Land [5] 2012 2013 2014 2015 2016 2017 2018 2019
Estimate of total land held as biodiversity offsets (hectares)
10,973 13,164 22,607 22,773 25,466 41,768 41,139 41,803
Estimate of the total area of land managed for agricultural use (e.g. grazing, cropping, viticulture) (hectares)
57,533 60,174 44,252 44,632 40,146 59,320 59,212 59,209
Estimate of total buffer land (hectares) [9]
N/A N/A N/A N/A N/A N/A 47,063 47,179
Please see over the page for notes that provide contextual information to the published results.
REHABILITATION
2019 Results
To find out more, visit miningdialogue.com.au
Since 2012, the Upper Hunter Mining Dialogue has been collecting annual rehabilitation data and information from mining operations across the Upper Hunter to provide information to the community regarding the amount of progressive rehabilitation being undertaken.
Industry rehabilitation data for 2018 was kindly provided for this project by Glencore, Yancoal, The Bloomfield Group, BHP, Muswellbrook Coal Company, Peabody Energy, Mount Pleasant Operation, Bengalla Mining Company and Malabar Coal. Contextual information has been sourced from the NSW Department of Primary Industries, Australian Bureau of Statistics, Singleton City Council and Muswellbrook Shire Council.
Industry Principles & Commitments
All Dialogue member companies have agreed to a set of common principles and commitments, developed by the Joint Environment Working Group, to drive improvements in the speed of rehabilitation and to provide aggregate data to the community about total land disturbed and rehabilitated. The Principles are as follows. Principle 1 Include rehabilitation planning in mine planning; Principle 2 Undertake progressive rehabilitation; Principle 3 Minimise time that disturbed areas are left without vegetation; Principle 4 Prioritise areas of rehabilitation and temporary cover to reduce impacts; Principle 5 Meet target for rehabilitation progress identified in the Mining Operations Plan; and Principle 6 Set quality targets for rehabilitation in the Mining Operations Plan and implement a monitoring program to measure performance.

Notes
[1]Rehabilitation is defined by the Mining Act 1992 as the treatment or management of disturbed land or water for the purpose of establishing a safe and stable environment.
[2]Row E2013 may not equal Row C2013 + Row E2012 as areas that have been previously rehabilitated, then re-disturbed are excluded from the Total area of rehabilitation of all operations at the end of the reporting period.
[3]The rehabilitation to disturbance ratio indicates how many hectares of rehabilitation are undertaken for each hectare of land disturbed during the year. A ratio of 1 indicates that the area of rehabilitation and disturbance in that year are the same.
[4]Row A(Year) does not necessarily equal Row D (Year -1) because some companies have reconciled their figures and corrected them over time.
[5]
There have been substantial changes in the amount of ‘Other Land Managed’ between 2013 and 2014 because: (i) significant increases in additional offset areas have been established, and (ii) because some of the land previously identified as being used for Agriculture is now being used for mining purposes or biodiversity offsets.
[6]The increase in land newly disturbed in 2015 is predominantly due to the establishment of the Bulga Optimisation project.
[7]
Mount Pleasant Operations (MPO) commenced reporting data into this project in 2017. Typically, during the initial stages of a mining operation a larger amount of disturbance is conducted to establish the mine and associated infrastructure. As the mine develops, progressive rehabilitation is conducted and much of the initial disturbance is rehabilitated. While the rehabilitation to disturbance ratio was 0.75 in 2017, if the MPO data this figure becomes positive at 1.03. This demonstrates that the industry conducted more rehabilitation than disturbance in 2017, putting aside the development of MPO. Total figures from the 2017 results have been adjusted following the discovery of a reporting error from one site that caused an over-reporting of newly distrubed land, that was in fact a cumulative total.
[8]
Total figures from the 2017 results have been adjusted following the discovery of a reporting error from one site that incorrectly reported cumulative disturbance as newly disturbed land, which resulted in an over-reporting of the actual amount of disturbance across Upper Hunter operations.
[9]The Dialogue has introduced a new reporting category as part of the 2018 results, where the total amount of buffer land owned by the mining companies operating in the Upper Hunter is now being reported. The total amount is also broken down into various categories.
[10]
The reported D and E figures for 2019 do not align with previously reported data. This is due to Yancoal reporting that 170 ha of previously reported rehabilitation being reclassified as a result of an Independent Rehabilitation Review conducted in 2019. Approximately 40 ha of this amount was reported as rehab disturbance in 2019, however a remaining discrepancy of 130 ha was removed from the rehabilitation reporting due to the fact that these were seeded to cover crops, but not the final seed mixes. These areas will be seeded to the final seed mixes in 2020 and 2021 and will feed back into the rehabilitation reporting figures in the coming years.
Full Upper Hunter Mining Dialogue Temporary and Final Rehabilitation Principles and Commitments
1. Include rehabilitation planning in mine planning - Planning for rehabilitation should be integrated into the mine planning process and should include allocating adequate and dedicated resources to achieve the planned rehabilitation outcomes.
2. Undertake progressive rehabilitation - Companies should undertake rehabilitation progressively, with the objective of ensuring that rehabilitation is as close as possible to active mining.
3. Minimise time that disturbed areas are left without vegetation - Companies should actively seek to minimise the time that land is left without cover during mining. This should include:• Taking steps to ensure that rehabilitation is commenced within 12 months of land becoming available for rehabilitation.• Utilising methods of temporary rehabilitation*, such as aerial seeding of overburden and other disturbed areas where permanent
rehabilitation has not commenced.
4. Prioritise areas of rehabilitation and temporary cover to reduce impacts - Companies should prioritise rehabilitation and temporary cover in those areas where leaving land exposed will have the most impact. The following areas should be considered to have priority:• Areas that have the greatest impact on visual amenity, such as areas that face townships, residences, or the highway• Areas that have the potential to generate dust leaving the site.• Areas that are important for biodiversity, such as rehabilitation adjoining or providing connectivity to remnant vegetation.
5. Meet target for rehabilitation progress identified in the Mining Operations Plan - Each company should meet the annual target for rehabilitation quantity (area) set in the Mining Operations Plans for each of its mines.
6. Set quality targets for rehabilitation in the Mining Operations Plan and implement a monitoring program to measure performance - Each company should include quality targets for the various types of rehabilitation in the Mining Operations Plan for each of its mines. A monitoring program to measure the performance of rehabilitation areas against the quality targets should be implemented at each of its mines.
* Temporary rehabilitation describes reshaping, revegetation and other rehabilitation techniques that are used for purposes other than final rehabilitation. This includes such initiatives as seeding overburden emplacement areas to reduce erosion, which are only temporary.
REHABILITATION
2019 Results
To find out more, visit miningdialogue.com.au
1.
Industry rehabilitation data for 2018 was kindly provided for this project by Glencore, Yancoal, The Bloomfield Group, BHP, Muswellbrook Coal Company, Peabody Energy, Mount Pleasant Operation, Bengalla Mining Company and Malabar Coal.
Industry Principles & Commitments

UHMD Joint Environment Working Group Meeting – 9 September 2020
12
Upper Hunter Mining Dialogue Joint Environment Working Group - 9 September 2020
Agenda Item 6
UPDATE ON WATER PROJECTS Please see below for a summary of current Dialogue projects and other activities being undertaken in the Water area: Water Accounting Framework - 2019 Water Use Results and Contextual Summaries The Dialogue has collated region-wide rehabilitation and disturbance data for the 2019 calendar year from Upper Hunter industry members, which has been analysed by HEC. Please see attached for a summary of the 2019 results. Draft results will be added to contextual data to quantify industry’s water use in the 2019 calendar year in the context of the Hunter River and other water users (e.g. businesses, residents, and other industries). See the attached documents for further information regarding the 2019 results. The results once confirmed by industry will be published via the simple and detailed infographics as in previous years, with a summary statement collating all industry members' comments on their water use throughout the past calendar year. Camilla West from Hydro Engineering and Consulting (HEC) will be attending the meeting to respond to member questions regarding the latest round of results. Hunter River Salinity Trading Scheme (HRSTS) Water Quality Study Following the completion of the initial study into the water quality at Hunter River Salinity Trading Scheme discharge points compared to the overall health of the Hunter River, the Steering Committee met with the EPA and the University of Newcastle to discuss the need for a follow-on study. It was considered that, given the good performance of the scheme, that further studies may not be necessary. The steering committee thought it important to close out the issues identified in the initial study and are currently considering the need for further studies. The Dialogue Secretariat sought advice from hydrological consulting firm HEC on a monitoring protocol to examine the actual discharge levels under regular discharge conditions. Given the sampling was taken during a prolonged dry period, the results are not representative of discharge conditions and would impact the results. The monitoring protocol has been provided to member companies and enacted when a discharge event occurs. Data was sourced from companies following the discharge opportunities experienced in the high rainfall period in February 2020, to examine the results under normal discharge conditions. HEC has provided an assessment report to NSWMC (attached) for consideration. The assessment was able to draw a number of conclusions, most notably that there is a relationship between recorded nitrate concentrations and preceding rainfall, with lower concentrations recorded following periods of higher rainfall; and that during licenced discharges (which occur typically following periods of higher rainfall), it is likely that nitrate values would be lower than they would be following periods of low rainfall (when discharge is unlikely). Recommendation:
● Working Group members review and discuss the preliminary 2019 results for the Water Accounting Framework and consider endorsing the release of these results.
● Working Group members review and discuss the Water Quality Assessment and consider endorsing the publication of these findings.
FOR INFORMATION / DISCUSSION

UHMD Joint Environment Working Group Meeting – 9 September 2020
13
Attachments:
1. Water Accounting Framework - Draft 2019 Results Summary and Infographics
2. Hunter River Salinity Trading Scheme (HRSTS) Water Quality Study - Hunter River Nitrate Assessment - Draft analysis
Please note: As these are yet to be published on the Dialogue website, we kindly ask that these attachments are not distributed beyond the Working Group members at this stage.

UHMD Joint Environment Working Group Meeting – 9 September 2020
14
Attachment: Water Accounting Framework - Summary of 2019 Results
Water Accounting Framework - Summary of 2019 Results
Key Infographic Figures 2018 2019 Change
Water entering the Hunter River System (GL) 188.1 214.2 +28.6
TOTAL Environmental Flow (GL) 183.7 179.5 -4.2
TOTAL Extraction from the Hunter River (GL) 133.6 143.0 +9.4
- % of water extracted for farmer/resident/business use (GL) 65% (121.5) 58% (125.0) -7% (+3.5)
- % mining industry uses of Hunter River System's water (GL)
8% (14.6) 8% (18.0) Same (+3.4)
% of water that stayed in the river 28% (52.0) 33% (71.2) +7% (+19.2)
% of mine water sourced from onsite rainfall/runoff 27% 26% -1%
Evaporation from dams (GL) 35.1 29.3 -5.8
- Factor of "water evaporated" to "mine extraction" 2 2 Same
TOTAL Mine Inflows (GL) 70.3 63.4 -6.9
- % of water sourced from deep aquifers 33% 35% +2%
- % of mine water from river and alluvial aquifers 22% 30% +8%
TOTAL Mine Outflows (GL) 69.3 64.8 -4.5
- % of mine water discharged into the Hunter River 0% 0% Same
% the mining industry reuses of its water onsite 46% 55% +9%
Rainfall at Scone (mm) 362.7 281.2 -81.5
Long term average (mm) 636.0 591.6 -44.4
Key Observations:
● 2019 was a drier than average year, with 214 billion litres entering the river system in the Upper Hunter (up from 188 billion litres in 2018).
● 33% of that water stayed in the river (up from 28% in 2018). ● The amount of water extracted and used by farmers, residents and businesses was 58% at 125GL
(a reduction in percentage from 65%, but up from 122 GL in 2018). ● Mining used less than 8% of the water in the system, the same percentage as in 2018, however
the amount rose to 18.0 GL (up from 14.6 GL in 2018). ● More than 2 times as much water evaporated from the Hunter River System storage dams as was
extracted from the Hunter River System by mining companies (this figure is the same as in 2018). ● 30% of mine water came from rivers and alluvial aquifers (up from 22% in 2018). ● 26% of mine water was sourced from onsite rainfall and runoff (down from 27% in 2018). ● 35% of water was sourced from deep aquifers that are of limited use to other water users due to
their high salinity (up from 33% in 2018). ● The mining industry reused 55% of its water onsite (up from 46% in 2018, and a similar result to
that of 2017). ● No mine water was discharged into the Hunter River in 2019 (the same figure as in 2018). ● The rainfall in Scone during 2019 was 281 mm, which is well below the long-term average of 592
mm. The dry conditions meant that companies did not have any opportunities to discharge excess

UHMD Joint Environment Working Group Meeting – 9 September 2020
15
water into the Hunter River System and were in fact keenly conserving their stored water. ● The source for contextual rainfall data was updated in 2019 due to the closure of the Scone SCS
station. Scone Airport AWS was selected due to its nearby location, reliability and similar profile, however long-term data for this site is limited to 1994 onwards and differs slightly from previous data used. This is most notably reflected in a reduction of the long-term average of 592 mm compared to 636 mm for the previous station.

UPPER HUNTER WATER BALANCE 2019Mining’s water use
HUNTER RIVER SYSTEM
1GL = 1 gigalitre = 1 billion litres
Hunter River System Extraction
Mining Industry Water Use Balance
Goulburn River
Hunte
r Riv
er
Hunter River
Gle
nnies
Creek
MUSWELLBROOK
SINGLETON
To find out more about the UHMD, visit miningdialogue.com.au
55% ReuseAlluvial 0.9GL (1%) Hard Rock 22.1GL (35%)
The Upper Hunter Mining Dialogue assessed water use by the mining industry in the Upper Hunter in 2019. Using a common accounting framework, mining companies have reported their water inflows and outflows from operations. This has helped them to manage their water use and embark on water saving and reuse opportunities.
UPPER HUNTER MINING INDUSTRY
JUST
8%
The mining industry used
of water in the Upper Hunter River System
REUSED
55%
The mining industry
of its water onsite
26% of mine water was
sourced from onsite rainfall and runoff
ALMOST
2xas much water evaporated
from the Hunter River System storage dams as was extracted from the Hunter River System by
mining companies
30%of mine water came
from rivers and alluvial aquifers
Only
35%of water was sourced
from deep aquifers that are of limited use to other water users
due to their high
Other Outflows 2.4GL (4%)
Groundwater 1.0GL (2%)
Third Party 1.9GL (3%)
Entrainment in coal & tailing 26.1GL (40%)
Third Party 3.5GL (5%)
Hunter River System 18.0GL (28%)
Rainfall/Runoff 16.4GL (26%)
Groundwater 25.5GL (40%)
Water quality components:
HIGHHIGH MEDIUMMEDIUM LOW
Evaporation 33.3GL (51%)
To Hunter River System 0.0GL (0%)
34.7GLNet Rainfall/Runoff and Evaporation
179.5GLEnvironmental Flows including Dam Release
143.0GLTotal Extraction from Hunter River
The rainfall in Scone during 2019 was 281mm, which is significantly lower than the long-term average rainfall of 592mm. [1]
The continueddry conditions meant thatcompanies did not haveopportunties to dischargeexcess water into theHunter River Systemand were in fact keenlyconserving their storedwater.
18.0GLMining = 8%
0%of mine water was
discharged into the Hunter River
The NSW Minerals Council has compiled the data in this infographic using the best available information. Since water accounting is a complex task that relies on estimates and computer models, there are corresponding limits to the accuracy of the
information. Sources: Bureau of Meteorology; DPI Water; NSW Minerals Council data.
Notes: [1] The source for contextual rainfall data was updated in 2019 due to the closure of the Scone SCS station. Scone Airport AWS was selected due to its nearby location, however long-term data for this site is limited to 1994 onwards.
Decrease in mine water
storage 1.4GL
71.2GLFlow Passing Singleton (Including flows for the environment)
= 40%
125.0GLAgriculture / Power Station / Town Water
= 58%
Mine
Town
Glenbawn Dam
Glennies Creek Dam
Evaporation from dams = 29.3GL

To find out more, visit miningdialogue.com.au
THE HUNTER RIVER 2019A precious water resource for the Upper Hunter
2019 was a drier than average year.
That year
entered the river system in the Upper Hunter.
214 BILLION LITRES
of that water stayed in the river.
33%
The amount of water extracted and used by farmers, residents and
58%
of the water in the system.
used less than
8%MINING
The NSW Minerals Council has compiled the data in this infographic using the best available information. Since water accounting is a complex task that relies on estimates and computer models, there are corresponding limits to the accuracy of the information. Sources: Bureau of Meteorology; DPI Water; NSW Minerals Council data.

2 September 2020
Policy Manager
NSW Minerals Council
Via email
Attention: Craig Milton
Craig,
Re: Hunter River Nitrate Assessment
1. INTRODUCTION AND BACKGROUND
In March 2018, the University of Newcastle (UON, 2018) reported on an assessment of metals
and metalloids across key storage dams that are part of mining operations in the Hunter Valley,
NSW. Water from these storage dams can be released in a controlled fashion to the Hunter
River as part of the Hunter River Salinity Trading Scheme (HRSTS), subject to the Environment
Protection Licence (EPL) associated with each individual operation. In addition to analysis of
metals and metalloids, UON (2018) reported elevated nitrogen in the site storage dams – most
notably nitrate. This contrasted with lower values at sample sites located on the Hunter River. It
was suspected that the elevated nitrate levels were due to a prolonged dry period and the
associated effects on the site storages without significant turnover.
Hydro Engineering & Consulting Pty Ltd (HEC) were commissioned to undertake further
assessment of recorded nitrate data and the potential effects on the Hunter River as a result of
licensed discharge. Recorded data are summarised in Table 1 and Table 2 for the site storage
dams and Hunter River sample sites respectively. Samples were collected during the last week
of August 2017.
Table 1 Monitored Nitrate Values in Hunter Valley Mine Site Storage Dams (UON, 2018)
Bengalla Mine
Liddell Coal
Ravensworth Operations
Hunter Valley Operations
Mt Thorley Warkworth
Bulga Coal
Reservoir North
Narama Dam Parnells Dam
Dam 11
Lake James
Dam 1N
Dam 9S
Surge Dam
Northern Dam (ND2)
Nitrate (mg/L
N) 3.02 2.9 11.2 0.837 3.27 0.447 0.781 1.91 3.62 0.133
Table 2 Monitored Nitrate Values at Hunter River Locations (UON, 2018)
Dartbrook Keys Bridge Denman Jerrys Plains
Glennies Creek
Singleton
Nitrate (mg/L N)
0.009 0.204 0.115 0.016 0.005 0.007

200902_Hunter River Nitrate Assessment - J1805-2.l1b tracked changes Page
2
The ANZG (2018) default guideline trigger value for the protection of freshwater aquatic ecosystems
at the 95% level of species protection for nitrate is 2.4 mg/L (toxic effects)1. The default guideline
trigger value for eutrophication is 0.35 mg/L (total of all nitrogen oxides) for NSW east flowing
lowland rivers.
2. ANALYSIS – RAVENSWORTH OPERATIONS HISTORICAL DATA
Given the UoN (2018) sampling was a one off sample at a point in time, a detailed assessment was
undertaken of available historical monitoring data to contextualise the data and assess if elevated
nitrate levels have been persistent historically.
An extended period of monitored nitrate was able to be obtained for Ravensworth Operations
Narama Dam (formerly the 1,000 ML Dam) from which licensed discharges can occur in line with the
provisions of the HRSTS.
A time series plot of recorded nitrate concentrations for the Narama Dam is given in Figure 1. Also
included in the plot is the UON (2018) value – highlighted in red.
Figure 1 Recorded Nitrate Values – Ravensworth Operations Narama Dam
The following points are worth of note regarding the data plotted in Figure 1:
• the recorded nitrate values vary over a wide range: from 0.27 mg/L to 20 mg/L;
• the median and 80th percentile values (also plotted) are 5.6 mg/L and 8.8 mg/L; and
• the UON (2018) value is higher than the 80th percentile of all values and is the fifth highest recorded value.
Nitrate values in the Narama Dam will vary with source water transferred to the dam and will be
affected by antecedent rainfall. In order to assess the effect that rainfall may have had on recorded
nitrate values, daily site rainfall data was analysed and compared with recorded nitrate data. Where
recorded data from Ravensworth Operations was missing, data from the nearby Glendell Mine was
1 As recommended by ANZG (2018), value obtained from NIWA (2013) which was used to inform the current New Zealand
nitrate toxicity attribute.

200902_Hunter River Nitrate Assessment - J1805-2.l1b tracked changes Page
3
used. Rainfall data was able to be obtained from February 2009 onwards – therefore nitrate data for
the first three data points in Figure 1 were not used in the analysis. Nitrate data prior to February
2015 did not have a date recorded (month and year only) and therefore a day of the month had to be
assumed in the analysis
Daily rainfall totals were calculated for different periods of time prior to the date of each nitrate
sample. Periods of 7, 14 and 21 days were used and the corresponding plots of nitrate
concentrations versus preceding rainfall are given in Figure 2 to Figure 4. Also plotted are curves of
best fit (exponential plots) and corresponding coefficients of determination (R2).
Figure 2 Ravensworth Operations Narama Dam Recorded Nitrate Values Versus Previous 7-Day Rainfall

200902_Hunter River Nitrate Assessment - J1805-2.l1b tracked changes Page
4
Figure 3 Ravensworth Operations Narama Dam Recorded Nitrate Values Versus Previous 14-Day Rainfall
Figure 4 Ravensworth Operations Narama Dam Recorded Nitrate Values Versus Previous 21-Day Rainfall
The R2 values are representative of the proportion of variance in the recorded data that is predictable
from the rainfall in the preceding period. The highest R2 value occurs for the 14-day preceding
rainfall. The plots indicate that recorded nitrate values tend to decrease with increasing preceding
rainfall. The relatively low R2 values indicate that other factors affect the nitrate concentrations and
intuitively these would include rainfall intensity, time of year and catchment characteristics at the
time. Nevertheless the above analysis illustrates that nitrate concentration would be lower following
periods of rainfall in the weeks preceding and higher following periods of low rainfall. Only 11.4 mm
of rainfall was recorded at Ravensworth Operations in the 21 days prior to the UON (2018) sampling
and zero rainfall in the 14 days prior.
Discharge from mining operations in the Hunter Valley can only occur during “high” and flood” flow
events in the Hunter River. Furthermore, mining operations tend to release only during times of
water excess, following rainfall periods. This is illustrated by the data in Table 3 which shows
monthly recorded releases from the Narama Dam from 2015 onwards together with corresponding
monthly rainfall totals.
Table 3 Narama Dam HRSTS Releases and Monthly Rainfall
Month and Year HRSTS Release Volume (ML) Monthly Rainfall (mm)
Mar-14 131.68 77.6
Apr-15 325.81 204.6
Aug-15 21.77 50.8
Jan-16 42.3 202
Jun-16 95.9 83.8
Jul-16 0 39.6
Aug-16 420.11 34.2
Sep-16 675.73 77.8

200902_Hunter River Nitrate Assessment - J1805-2.l1b tracked changes Page
5
Month and Year HRSTS Release Volume (ML) Monthly Rainfall (mm)
Mar-17 76.45 227.2
Apr-17 11.11 40.8
The data in Table 3 indicates that releases tend to occur in months with higher rainfall and/or which
have had higher rainfall in the preceding month. The data in Figure 2 to Figure 4 indicates that this
would coincide with periods of lower nitrate concentrations.
3. DATA ANALYSIS – HUNTER MINING OPERATIONS 20TH FEBRUARY 2020
In order to augment the UON (2018) data (recorded following a period of low rainfall) a campaign of
sampling was undertaken by a number of mining operations on 20th February 2020. This
corresponded to a period of high preceding rainfall, with 115 mm recorded at Ravensworth
Operations in the preceding 14 days while 156 mm was recorded in the month preceding this date.
Recorded nitrate concentrations are shown in Figure 5. Sampling and analysis for nitrate occurred at
several site storage dams from which licensed discharge can occur (shown as grey bars) as well as
a number of locations on the Hunter River (shown as green bars).
Figure 5 Recorded Nitrate Concentrations – 20th February 2020
The recorded data from the sampling campaign of 20th February 2020 indicates that monitored nitrate
concentrations in the site water storage dams were all below concentrations in the Hunter River.
Only one storage (Hunter Valley Operations Parnells Dam) had concentrations comparable to those
in the Hunter River, while all other values were below 0.3 mg/L which is below the ANZG (2018)
default guideline trigger value for eutrophication.
The above data further indicates that lower nitrate concentrations are likely to occur in mine site
storage dams following rainfall.
It is noteworthy that the water quality in the Hunter River is subject to a number of influences other
than licensed discharge from mining operations, including the following.
200902_Hunter River Nitrate Assessment - J1805-2.l1b tracked changes Page
6
• Licensed discharge from other operations including municipal wastewater treatment plants, a landfill, waste depot, composting facility and livestock processing facilities.
• Runoff from rural agricultural and pastoral operations.
• Town runoff.
• Regulated release from two large water storages.
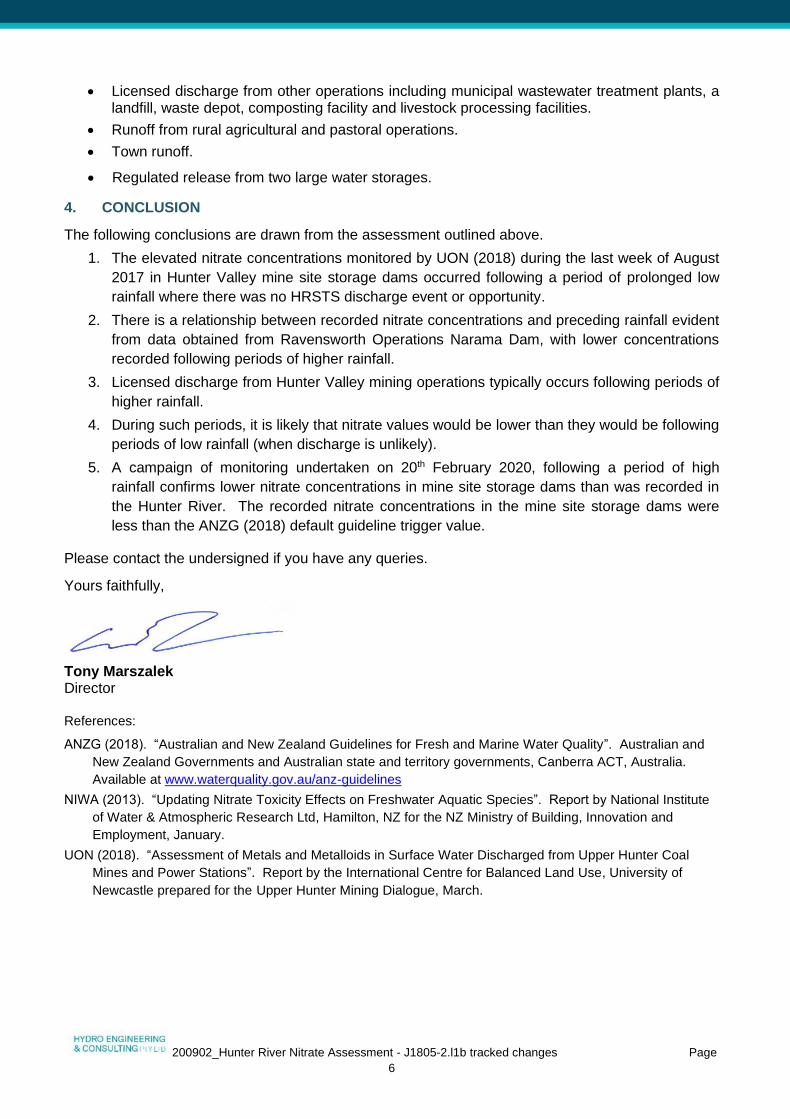
4. CONCLUSION
The following conclusions are drawn from the assessment outlined above.
1. The elevated nitrate concentrations monitored by UON (2018) during the last week of August
2017 in Hunter Valley mine site storage dams occurred following a period of prolonged low
rainfall where there was no HRSTS discharge event or opportunity.
2. There is a relationship between recorded nitrate concentrations and preceding rainfall evident
from data obtained from Ravensworth Operations Narama Dam, with lower concentrations
recorded following periods of higher rainfall.
3. Licensed discharge from Hunter Valley mining operations typically occurs following periods of
higher rainfall.
4. During such periods, it is likely that nitrate values would be lower than they would be following
periods of low rainfall (when discharge is unlikely).
5. A campaign of monitoring undertaken on 20th February 2020, following a period of high
rainfall confirms lower nitrate concentrations in mine site storage dams than was recorded in
the Hunter River. The recorded nitrate concentrations in the mine site storage dams were
less than the ANZG (2018) default guideline trigger value.
Please contact the undersigned if you have any queries.
Yours faithfully,
Tony Marszalek Director References:
ANZG (2018). “Australian and New Zealand Guidelines for Fresh and Marine Water Quality”. Australian and
New Zealand Governments and Australian state and territory governments, Canberra ACT, Australia.
Available at www.waterquality.gov.au/anz-guidelines
NIWA (2013). “Updating Nitrate Toxicity Effects on Freshwater Aquatic Species”. Report by National Institute
of Water & Atmospheric Research Ltd, Hamilton, NZ for the NZ Ministry of Building, Innovation and
Employment, January.
UON (2018). “Assessment of Metals and Metalloids in Surface Water Discharged from Upper Hunter Coal
Mines and Power Stations”. Report by the International Centre for Balanced Land Use, University of
Newcastle prepared for the Upper Hunter Mining Dialogue, March.

UHMD Joint Environment Working Group Meeting – 9 September 2020
16
Upper Hunter Mining Dialogue Joint Environment Working Group - 9 September 2020
Agenda Item 7
UPDATE ON COMMUNICATIONS ACTIVITIES Please see below for an update on the Dialogue’s various communication and engagement activities: Website Refresh
● The Dialogue continues to develop its website upgrade, with an anticipated launch date of late October to early November. The upgrade will simplify the Dialogue website format and provide a more user-friendly and engaging experience for stakeholders. The Communications Working Group will be consulted throughout the process and will provide feedback to the Secretariat through the user-testing phase.
Community and stakeholder engagement
● Covid-19 restrictions on gatherings has unfortunately forced the suspension of all scheduled community engagement activities. The Dialogue had been scheduled to attend Broke Village Vintage Fair and the Singleton Show in September and the Westpac Rescue Helicopter Service’s Hunter Valley Mining Charity Rugby League Day in October, but all events have been cancelled by organisers. It had been hoped the Dialogue could also feature a major display as well as host a procurement event at the Hunter Coal Festival scheduled for October, but the Festival’s organisers recently announced it would be postponed until 2021 with the dates yet to be confirmed. The Dialogue display was also scheduled to feature at the Annual Forum which has also been postponed until 2021.
School Mine Tours Program
● Likewise, the School Mine Tours Program has had to be “parked up” due to Covid-19. It had been hoped to roll out the 13 tours scheduled in July, August and September as well as reschedule at least some of the tours postponed from the April-June schedule but ongoing potential health risks and restrictions on school excursions and visitors to mine sites has forced the program to be held over. Schools have reiterated their support for the program and, hopefully, we can include the 22 schools committed to the 2020 program in the planned 2021 schedule.
Media
● As part of its updated social media communications plan to bolster its online presence, The Dialogue has been populating its Facebook page. As well as posting its news articles with links to the Dialogue website, additional posts have included revisiting past Dialogue success stories including the video of the 2019 Annual Forum and the Cattle Grazing Study. The focus on Dialogue success stories will continue alongside news posts.
● News articles distributed to local media in the past few months have included reports on Working Group discussions at their meetings via Zoom and the postponement of the Annual Forum and School Mine Tours Program.
FOR INFORMATION
UHMD Joint Environment Working Group Meeting – 9 September 2020
17
Upper Hunter Mining Dialogue Joint Environment Working Group - 9 September 2020
Agenda Item 8
UPDATE ON OTHER DIALOGUE WORKING GROUPS/COMMITTEES The Dialogue has several Committees and Working Groups with differing objectives. It is important to share information and knowledge amongst all Dialogue groups where relevant to help inform discussions. Please see below for updates on various Dialogue Working Groups and Committees: Joint Advisory Steering Committee The Joint Advisory Steering Committee met via videoconference on Wednesday 24 June 2020. This meeting provided the JASC their first opportunity to review the 2019 Forum feedback and the summary of Joint Working Group discussions, following the cancellation of the March 2020 meeting. Key items discussed included:
● The Air Quality report and community perceptions of air quality in the region, noting there is a need to maintain a consistent focus and concerted effort on air quality communications even when air quality debate subsides. Members were keen for the Dialogue to partner with reputable organisations such as CSIRO with messaging and promotion of the report.
● Members discussed Economic and Social Development opportunities, noting that the suggestion to standardise induction requirements of sites could be further explored by the Joint Working Group following from their initial discussion.
● Members discussed the Dialogue’s future events such as the Forum, noting that current restrictions may not permit an event to be held in 2020.
● Members supported the Dialogue’s Business Support Service proposal, noting this would supplement Chamber programs focused on immediate relief to businesses.
● The JASC Chair, Sarah Withell advised that she would shortly be taking up a new role outside of BHP with Whitehaven Coal.
The next JASC meeting is scheduled for Wednesday 8 October 2020. Communications Working Group The Communications Working Group last met on Tuesday 16 June 2020 via teleconference to discuss the following key issues:
● Members received a detailed overview of the website upgrade project, with encouragement for members to provide any feedback to help improve the Dialogue’s online communications. Members supported the Dialogue secretariat hosting a standalone demonstration of the new website once it was completed.
● Members discussed the Dialogue’s Air Quality Report and encouraged the secretariat to prepare a media release plan and speaking points for addressing any potential criticisms and questions from stakeholders not familiar with the project.
● Members noted the disruption to the Dialogue’s community engagement activities, in particular the school tours program and community events schedule.
The CWG is scheduled to meet Tuesday 15 September from 2:00 pm to 4:00 pm. Joint Economic and Social Development Working Group The Joint Economic and Social Development Working Group recently met on Wednesday 9 September 2020 via videoconference, with key topics for discussion including:
● A summary of the economic impacts on the Hunter. ● Updates from the local chambers and councils. ● Updates on the Dialogue’s procurement information hub.

UHMD Joint Environment Working Group Meeting – 9 September 2020
18
A verbal update on any outcomes will be provided at the meeting. The schedule for 2021 meetings is yet to be finalised. FOR INFORMATION/DISCUSSION

UHMD Joint Environment Working Group Meeting – 9 September 2020
19
Upper Hunter Mining Dialogue Joint Environment Working Group - 9 September 2020
Agenda Item 9
OTHER BUSINESS Updates from Working Group members To encourage greater awareness of items of interest across the Dialogue’s network of stakeholders, the Dialogue Secretariat encourages Working Group members to share updates on their current or future activities and projects that may be of interest to the Joint Environment Working Group members, or the Dialogue more generally. FOR INFORMATION

UHMD Joint Environment Working Group Meeting – 9 September 2020
20
Upper Hunter Mining Dialogue Joint Environment Working Group - 9 September 2020
Agenda Item 10
NEXT MEETING / CLOSE Future meeting dates have yet to be decided. Members will be contacted and sent through meeting invites and details once these have been finalised. As the Dialogue will not be hosting a 2020 Forum event, the Dialogue secretariat is seeking the views from Working Group members on whether a short meeting to be held in November/December to update and round to year would be supported, and what dates may suit members. FOR INFORMATION